Warren Resources — Sidoti & Company Conference (March 2009)
28 slides from Warren Resources's conference presentation, Mar 24, 2009
Slide 1: Warren Resources, Inc. Sidoti & Company Conference
Warren Resources, Inc. March 24, 2009 Sidoti & Company Conference
Slide 2: Disclaimer
Disclaimer Cautionary Note to U.S. Investors: This presentation includes “forward-looking statements” within the meaning of Section 27A of the Securities Act of 1933, as amended, and Section 21E of the Securities Exchange Act of 1934, as amended. The opinions, forecasts, projections or other stateme
Slide 3: Company Profile
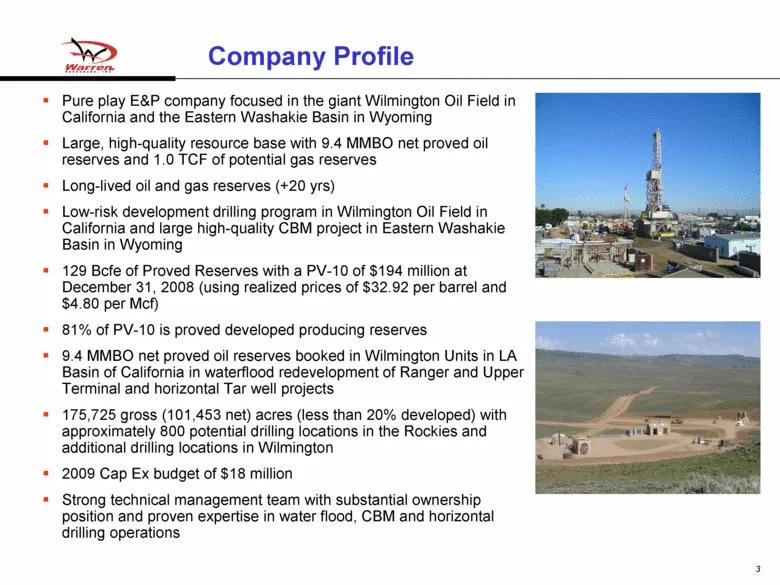
Company Profile Pure play E&P company focused in the giant Wilmington Oil Field in California and the Eastern Washakie Basin in Wyoming Large, high-quality resource base with 9.4 MMBO net proved oil reserves and 1.0 TCF of potential gas reserves Long-lived oil and gas reserves (+20 yrs) Low-risk dev
Slide 4: Warren Resources Operational Overview
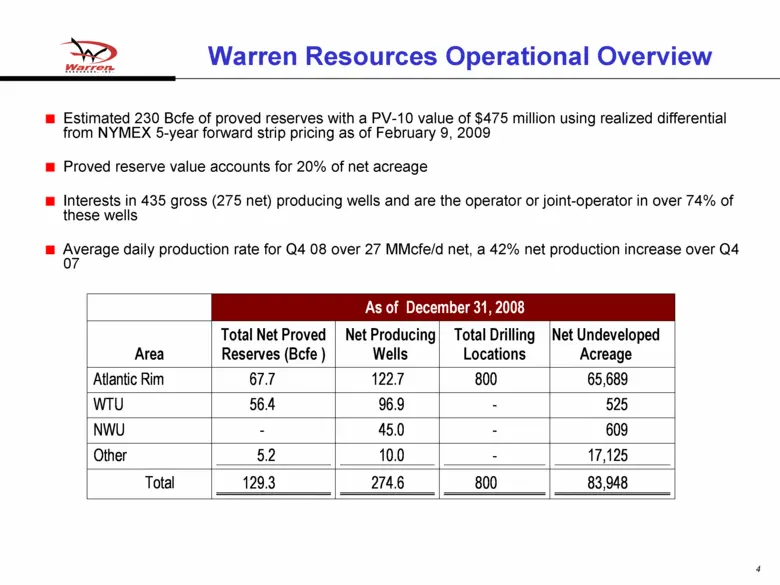
Warren Resources Operational Overview Estimated 230 Bcfe of proved reserves with a PV-10 value of $475 million using realized differential from NYMEX 5-year forward strip pricing as of February 9, 2009 Proved reserve value accounts for 20% of net acreage Interests in 435 gross (275 net) producing we
Slide 5: Proved and Unrisked, Unbooked, Potential Reserves
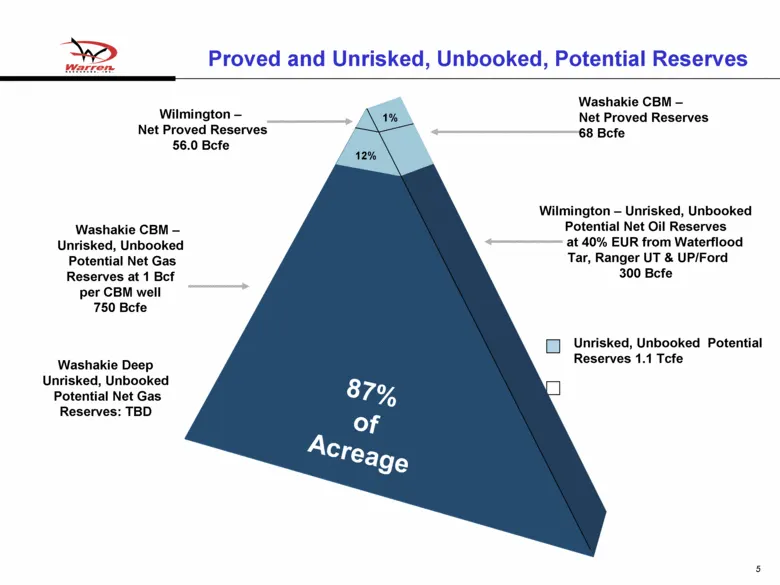
Proved and Unrisked, Unbooked, Potential Reserves Wilmington – Net Proved Reserves 56.0 Bcfe Unrisked, Unbooked Potential Reserves 1.1 Tcfe Washakie CBM – Unrisked, Unbooked Potential Net Gas Reserves at 1 Bcf per CBM well 750 Bcfe Wilmington – Unrisked, Unbooked Potential Net Oil Reserves at 40% EU
Slide 6: Business Strategy
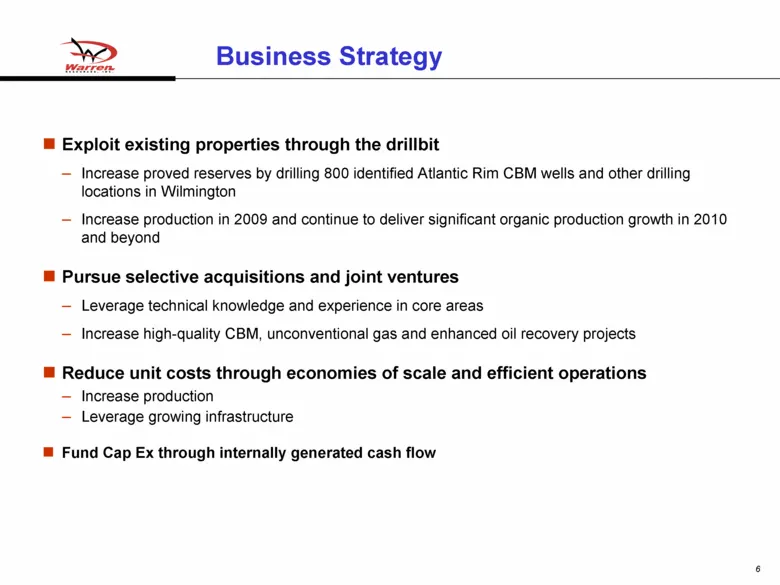
Business Strategy Exploit existing properties through the drillbit Increase proved reserves by drilling 800 identified Atlantic Rim CBM wells and other drilling locations in Wilmington Increase production in 2009 and continue to deliver significant organic production growth in 2010 and beyond Pursue
Slide 7: Experienced Operating Team
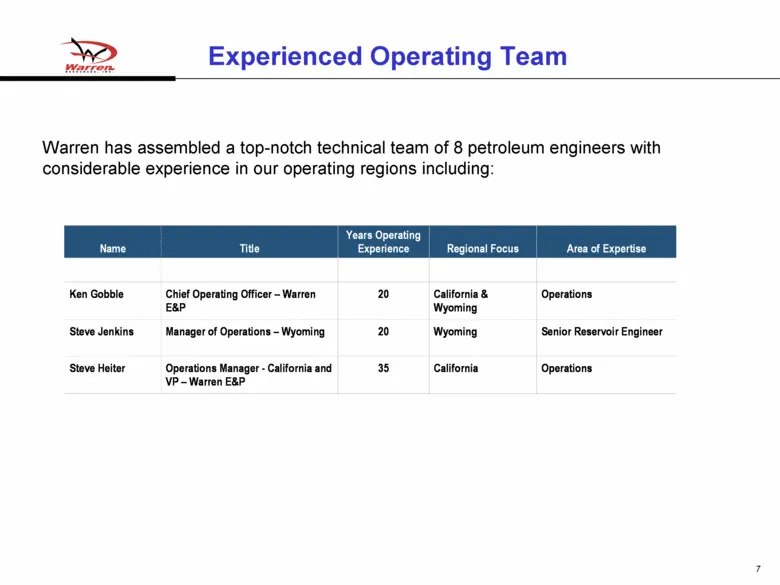
Experienced Operating Team Warren has assembled a top-notch technical team of 8 petroleum engineers with considerable experience in our operating regions including: 7 Name Title Years Operating Experience Regional Focus Area of Expertise Ken Gobble Chief Operating Officer – Warren E&P 20 California
Slide 8: Focused Operations - Wilmington Oil Field
Focused Operations - Wilmington Oil Field
Slide 9: The Wilmington Oil Field
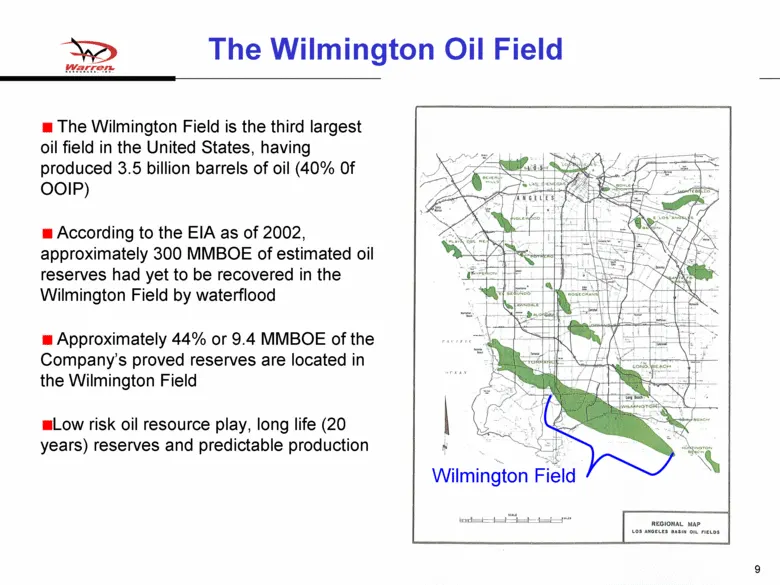
The Wilmington Oil Field The Wilmington Field is the third largest oil field in the United States, having produced 3.5 billion barrels of oil (40% 0f OOIP) According to the EIA as of 2002, approximately 300 MMBOE of estimated oil reserves had yet to be recovered in the Wilmington Field by waterflood
Slide 10: WTU (Warren) Structure
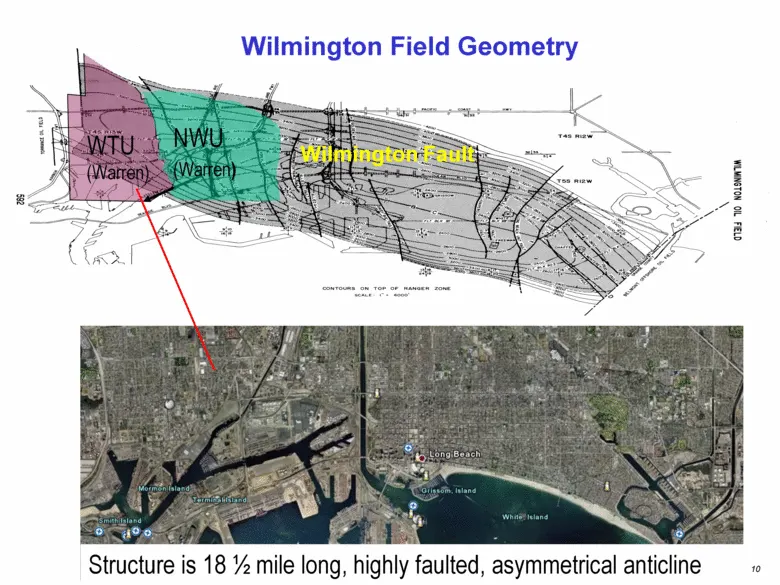
WTU (Warren) Structure is 18 ½ mile long, highly faulted, asymmetrical anticline Wilmington Fault Wilmington Field Geometry NWU (Warren) 10
Slide 11: Wilmington Townlot Unit (WTU)
Wilmington Townlot Unit (WTU) Unitized in 1972 by Exxon Warren holds 98.9% WI, 80.9% NRI 9.4 MMBO net booked proved reserves at 12/31/2008 Enhanced secondary waterflood recovery ASP potential not yet booked Multiple productive sands in reservoirs (Tar, Ranger, Upper Terminal, UP 237, Ford & basement
Slide 12: WTU Oil Production Since 01/2004
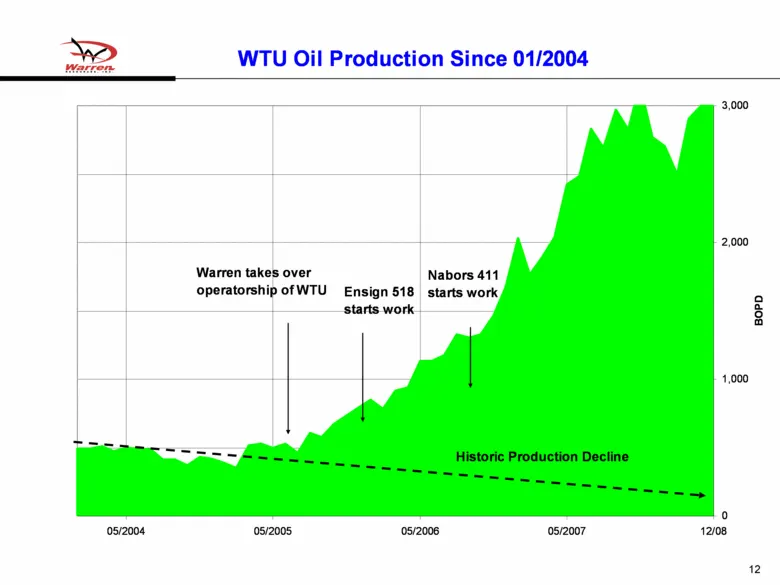
12 WTU Oil Production Since 01/2004 0 1,000 2,000 3,000 12/08 05/2007 05/2006 05/2005 05/2004 BOPD Warren takes over operatorship of WTU Nabors 411 starts work Ensign 518 starts work Historic Production Decline
Slide 13: Wilmington Townlot Unit
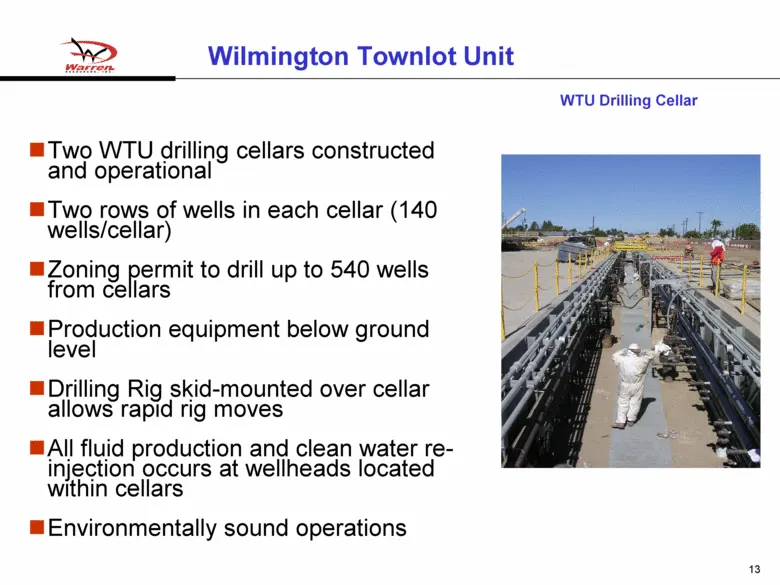
Wilmington Townlot Unit Two WTU drilling cellars constructed and operational Two rows of wells in each cellar (140 wells/cellar) Zoning permit to drill up to 540 wells from cellars Production equipment below ground level Drilling Rig skid-mounted over cellar allows rapid rig moves All fluid producti
Slide 14: PeriScope Geosteering of Hz Wells at WTU
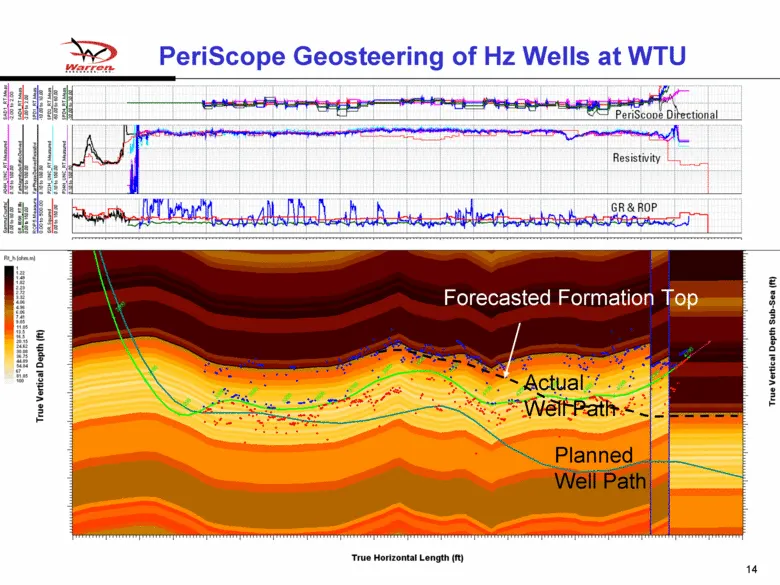
PeriScope Geosteering of Hz Wells at WTU Planned Well Path Actual Well Path Forecasted Formation Top 14
Slide 15: Vertical vs. Horizontal Tar Wells
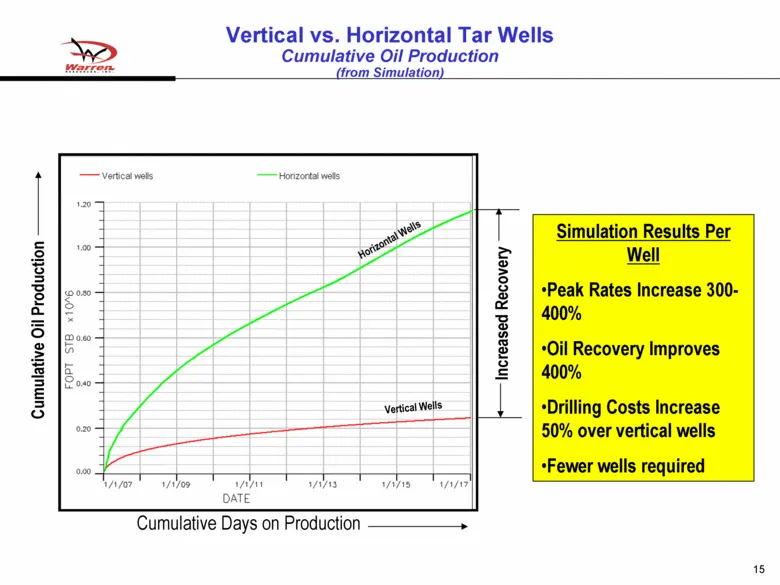
Vertical vs. Horizontal Tar Wells Cumulative Oil Production (from Simulation) Simulation Results Per Well Peak Rates Increase 300-400% Oil Recovery Improves 400% Drilling Costs Increase 50% over vertical wells Fewer wells required Cumulative Oil Production Increased Recovery Cumulative Days on Produ
Slide 16: Key WTU Projects Underway
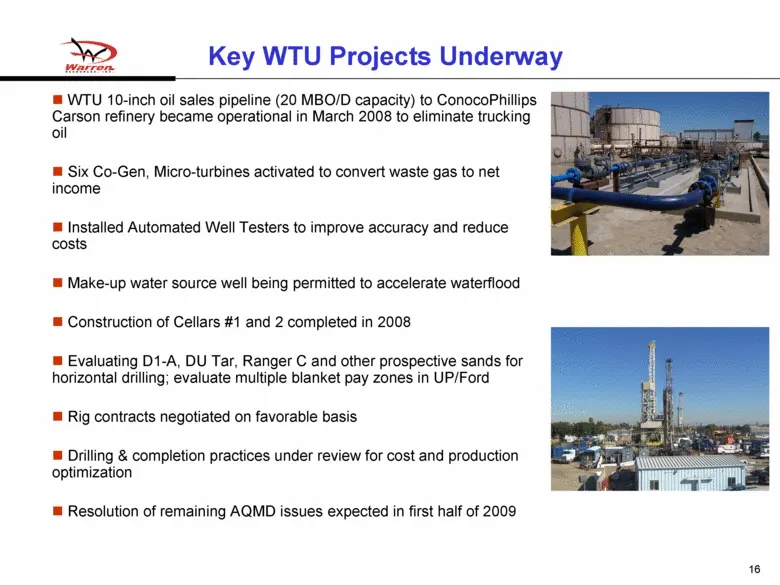
Key WTU Projects Underway WTU 10-inch oil sales pipeline (20 MBO/D capacity) to ConocoPhillips Carson refinery became operational in March 2008 to eliminate trucking oil Six Co-Gen, Micro-turbines activated to convert waste gas to net income Installed Automated Well Testers to improve accuracy and r
Slide 17: North Wilmington Unit
North Wilmington Unit Unitized for Water Flood in 1977 by Sunoco Produced 37 MMBO (24% of OOIP) Warren holds 100% W.I. and 84.6% N.R.I. Warren has focused on operational improvements and returning idle wells to production/injection since acquisition Current production is 500 BOPD gross (425 BOPD net
Slide 18: California Operations Summary
California Operations Summary Quality Assets with huge remaining potential oil-in-place of 550 MMBO Newly proven technologies and high oil prices should enable substantial remaining reserves to be captured economically Construction phase of cellar 1 and 2 completed in 2008 Production volumes have be
Slide 19: Washakie Basin – Atlantic Rim CBM
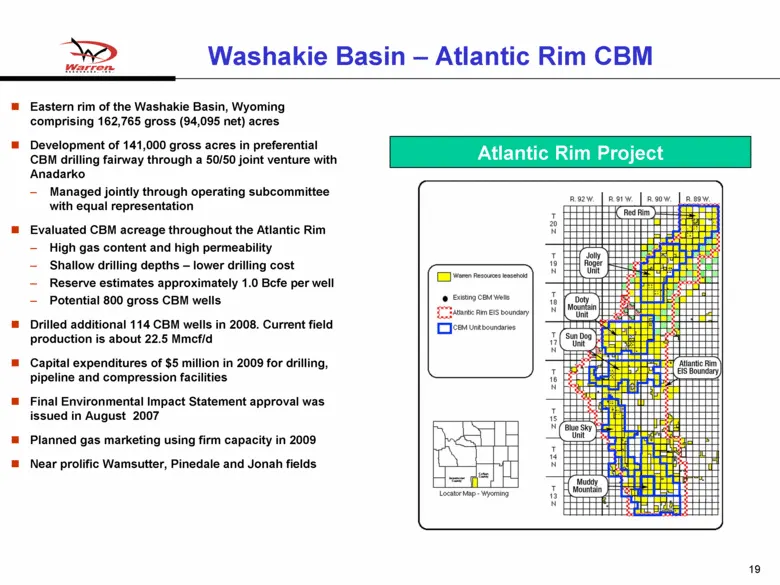
Washakie Basin – Atlantic Rim CBM Eastern rim of the Washakie Basin, Wyoming comprising 162,765 gross (94,095 net) acres Development of 141,000 gross acres in preferential CBM drilling fairway through a 50/50 joint venture with Anadarko Managed jointly through operating subcommittee with equal repre
Slide 20: Atlantic Rim CBM Type Curve
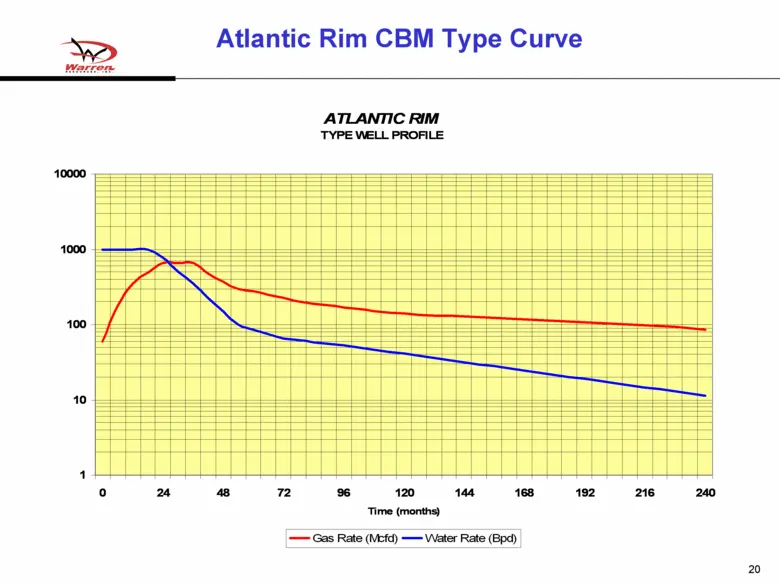
Atlantic Rim CBM Type Curve Cellar 1 Cellar 2 Cellar 3 20 ATLANTIC RIM TYPE WELL PROFILE 1 10 100 1000 10000 0 24 48 72 96 120 144 168 192 216 240 Time (months) Gas Rate (Mcfd) Water Rate (Bpd)
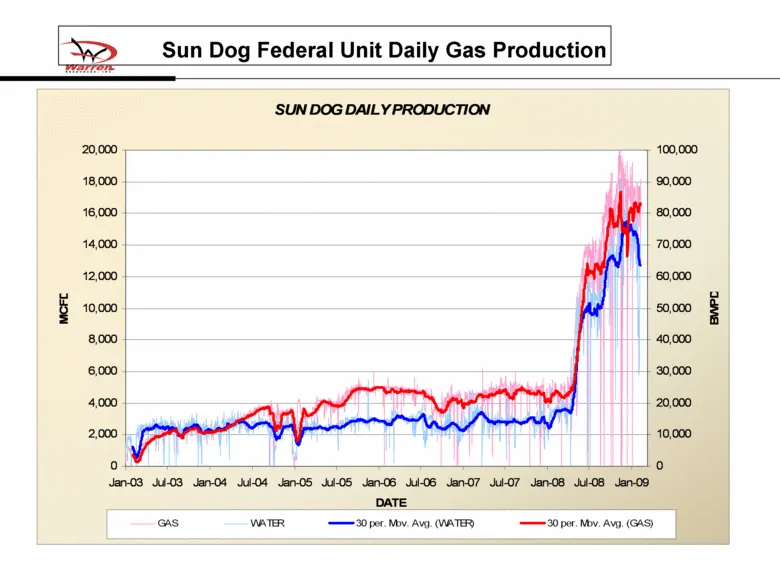
Slide 21: Sun Dog Federal Unit Daily Gas Production
Sun Dog Federal Unit Daily Gas Production SUN DOG DAILY PRODUCTION 0 2,000 4,000 6,000 8,000 10,000 12,000 14,000 16,000 18,000 20,000 Jan-03 Jul-03 Jan-04 Jul-04 Jan-05 Jul-05 Jan-06 Jul-06 Jan-07 Jul-07 Jan-08 Jul-08 Jan-09 DATE MCFD 0 10,000 20,000 30,000 40,000 50,000 60,000 70,000 80,000 90,000
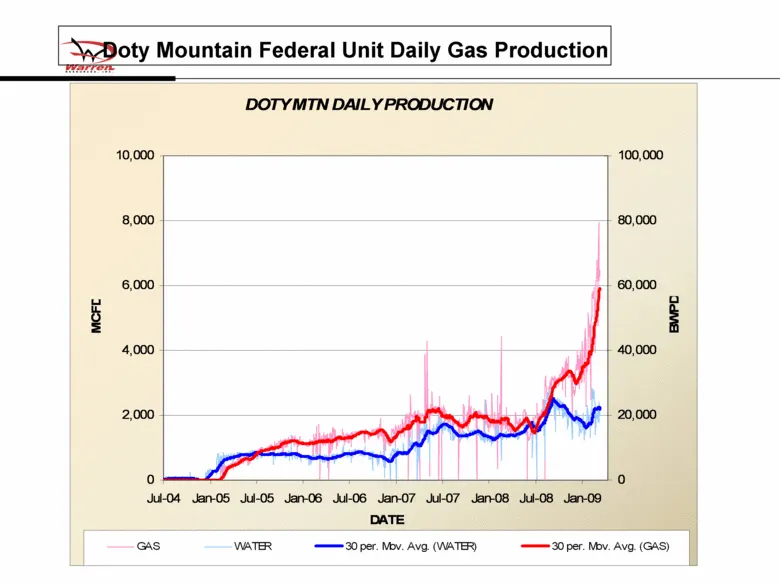
Slide 22: Doty Mountain Federal Unit Daily Gas Production
Doty Mountain Federal Unit Daily Gas Production DOTY MTN DAILY PRODUCTION 0 2,000 4,000 6,000 8,000 10,000 Jul-04 Jan-05 Jul-05 Jan-06 Jul-06 Jan-07 Jul-07 Jan-08 Jul-08 Jan-09 DATE MCFD 0 20,000 40,000 60,000 80,000 100,000 BWPD GAS WATER 30 per. Mov. Avg. (WATER) 30 per. Mov. Avg. (GAS) 22
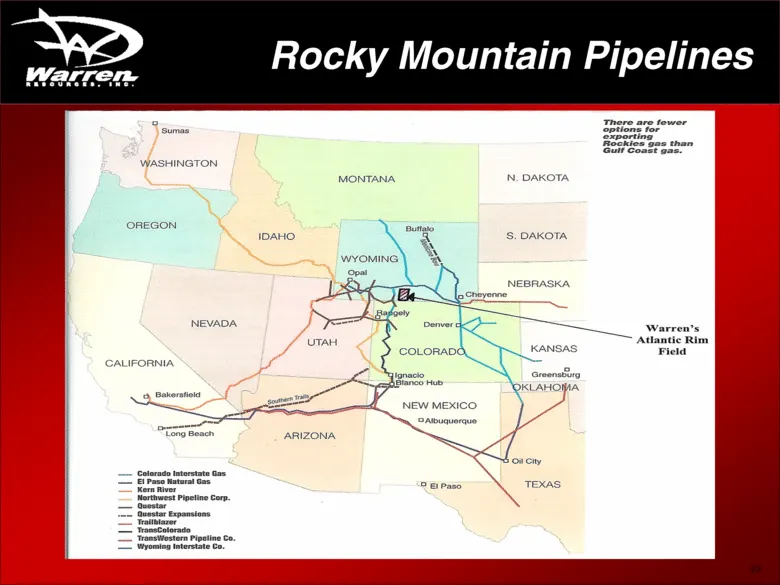
Slide 23: Rocky Mountain Pipelines
Rocky Mountain Pipelines 23
Slide 24: Financial Overview
Financial Overview 24
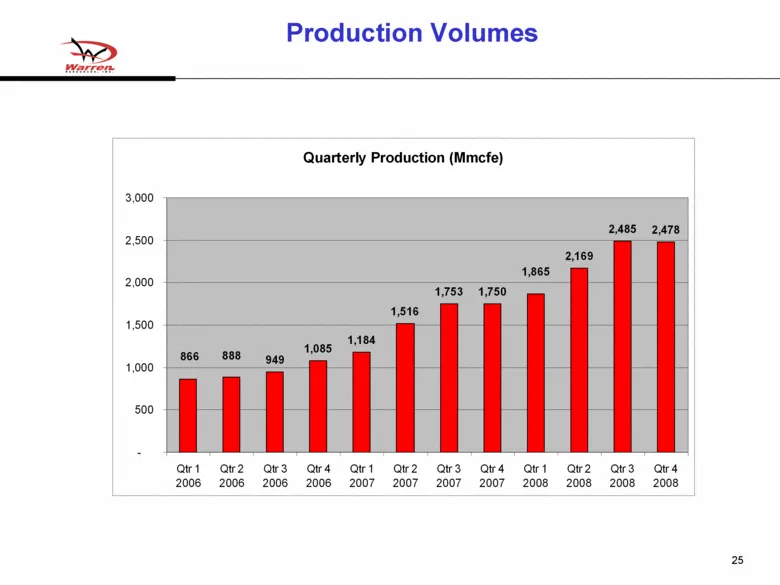
Slide 25: Production Volumes
Production Volumes 25 Quarterly Production (Mmcfe) 949 1,085 1,184 1,516 1,753 1,750 2,169 2,485 2,478 866 888 1,865 - 500 1,000 1,500 2,000 2,500 3,000 Qtr 1 2006 Qtr 2 2006 Qtr 3 2006 Qtr 4 2006 Qtr 1 2007 Qtr 2 2007 Qtr 3 2007 Qtr 4 2007 Qtr 1 2008 Qtr 2 2008 Qtr 3 2008 Qtr 4 2008
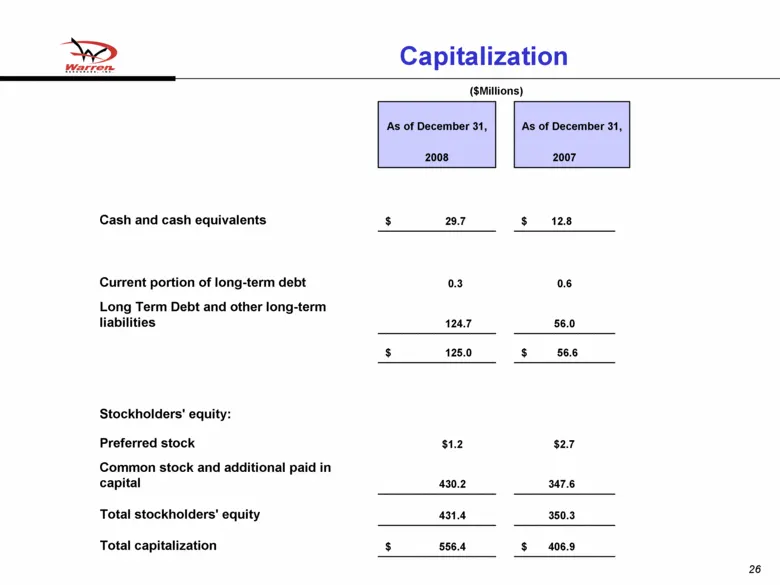
Slide 26: Capitalization
Capitalization ($Millions) 26 $ 406.9 $ 556.4 Total capitalization 350.3 431.4 Total stockholders’ equity 347.6 430.2 Common stock and additional paid in capital $2.7 $1.2 Preferred stock Stockholders’ equity: $ 56.6 $ 125.0 56.0 124.7 Long Term Debt and other long-term liabilities 0.6 0.3 Current p
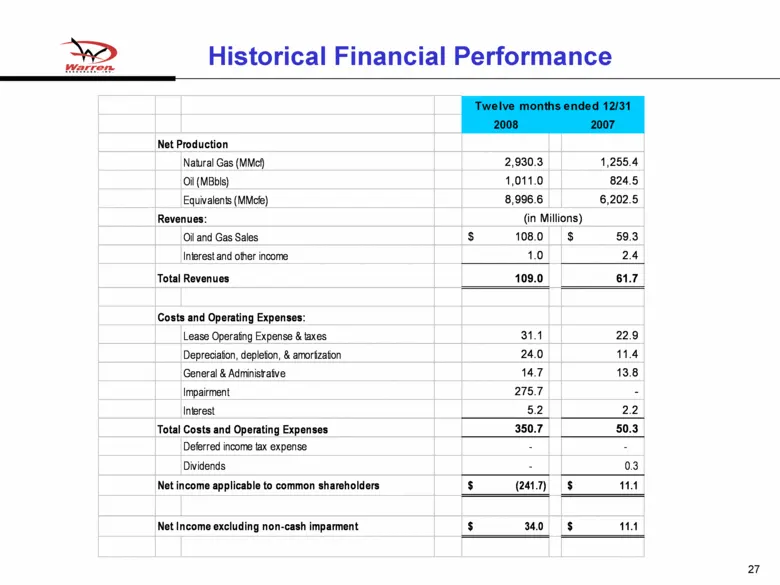
Slide 27: Historical Financial Performance
Historical Financial Performance 27 2008 2007 Net Production Natural Gas (MMcf) 2,930.3 1,255.4 Oil (MBbls) 1,011.0 824.5 Equivalents (MMcfe) 8,996.6 6,202.5 Revenues: Oil and Gas Sales 108.0 $ 59.3 $ Interest and other income 1.0 2.4 Total Revenues 109.0 61.7 Costs and Operating Expenses: Lease Ope
Slide 28: Warren Resources
Warren RESOURCES,
Source: SEC EDGAR · 8-K filed Mar 24, 2009
More decks from Warren Resources Inc
 Debt Investor Presentation (June 2016)18 slides · Jun 3, 2016
 Enercom 2015: The Oil and Gas Conference31 slides · Aug 19, 2015
 GHS 100 Conference 201536 slides · Jun 23, 2015
 Corporate Update (June 2015)7 slides · Jun 16, 2015
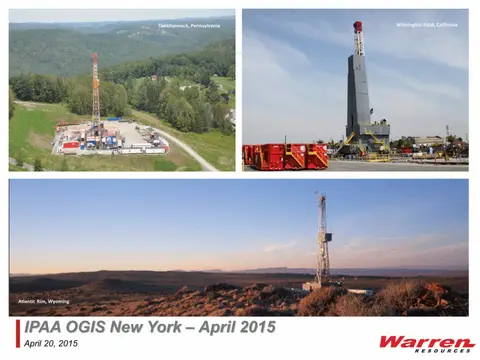 IPAA OGIS New York April 201532 slides · Apr 20, 2015
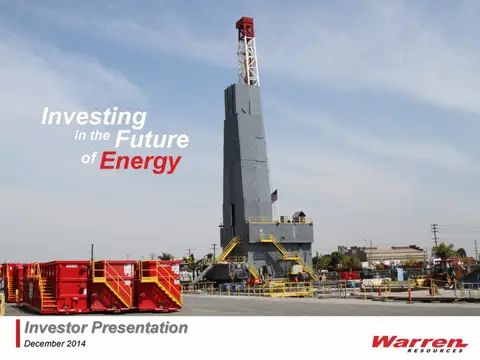 Investor Presentation (December 2014)42 slides · Dec 11, 2014