Pepco — Wells Fargo Utility Symposium 2010
25 slides from Pepco's conference presentation, Dec 7, 2010

Slide 1: Wells Fargo Utility Symposium
Wells Fargo Utility Symposium NEW YORK, NY • DECEMBER 8, 2010
Slide 2: Safe Harbor Statement
Safe Harbor Statement Some of the statements contained in today’s presentation are forward-looking statements within the meaning of Section 21E of the Securities Exchange Act of 1934, as amended, and are subject to the safe harbor created by the Private Securities Litigation Reform Act of 1995. Thes
Slide 3: PHI's Strategic Repositioning
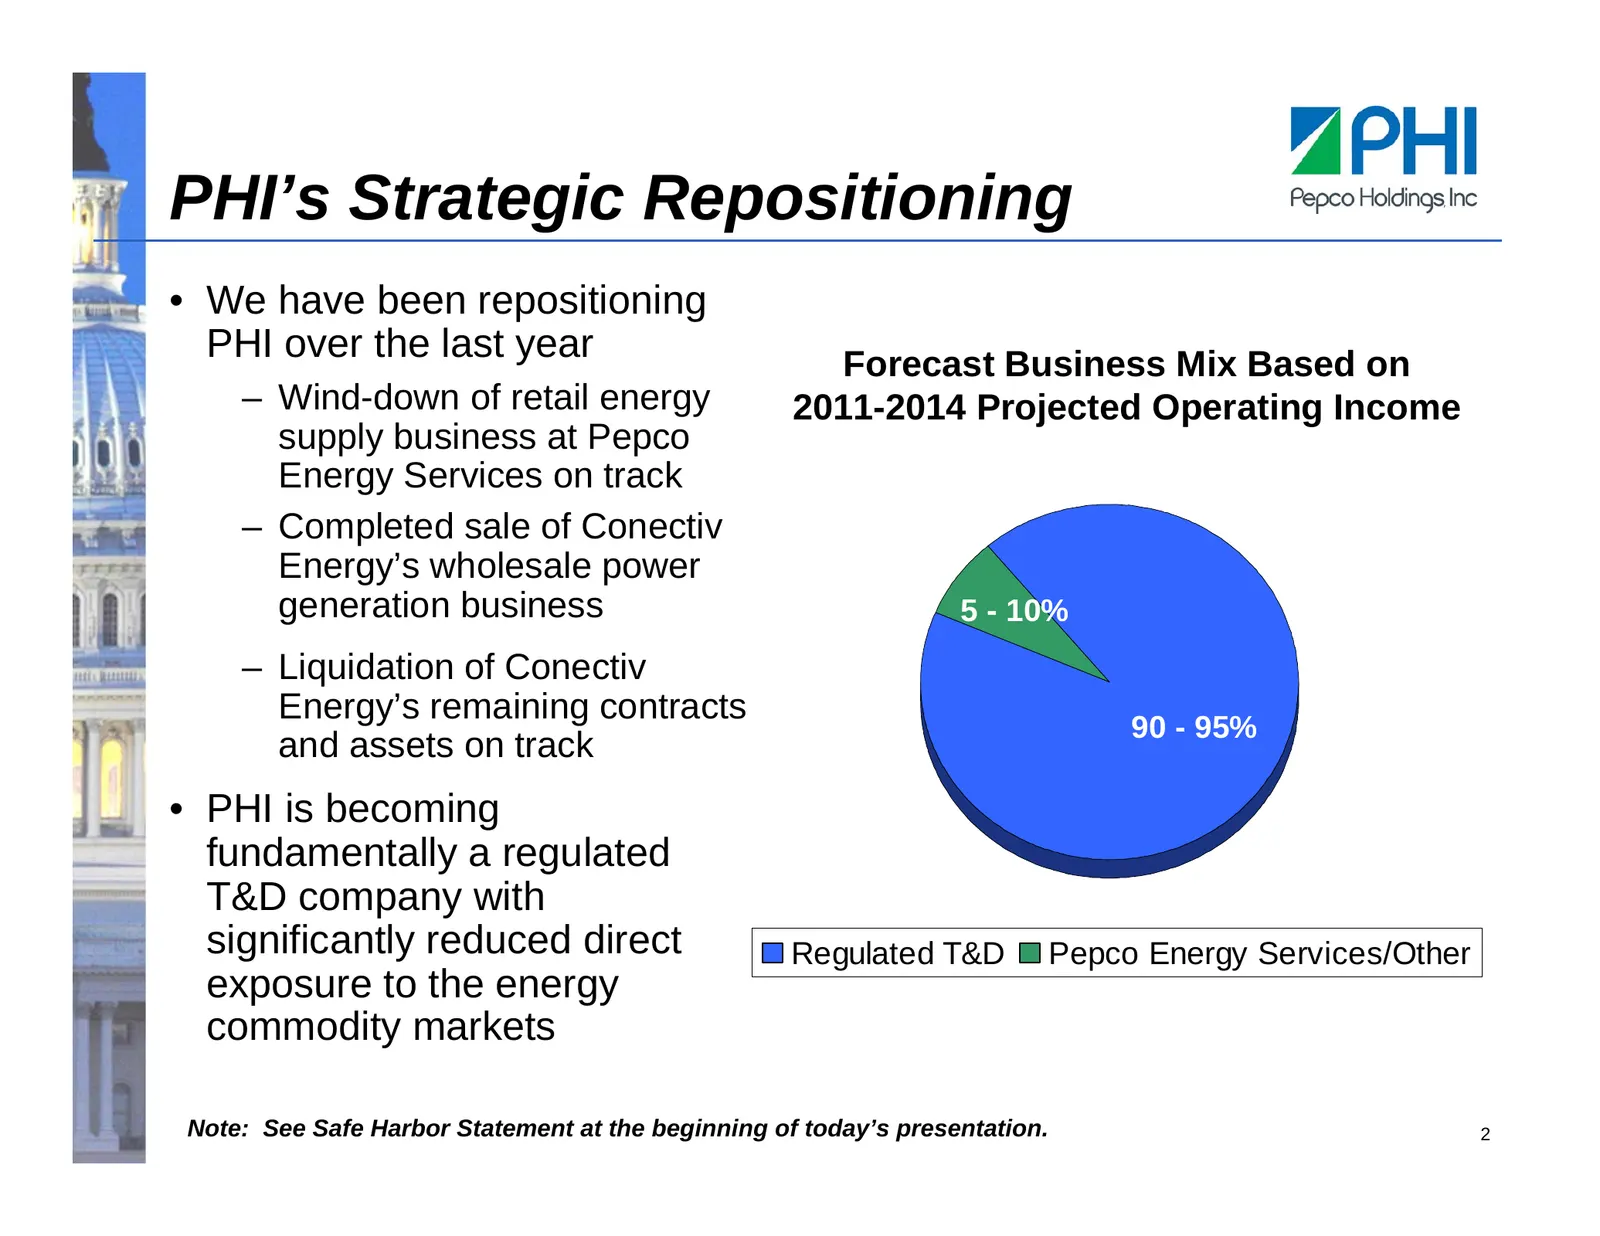
PHI’s Strategic Repositioning • We have been repositioning PHI over the last year Forecast Business Mix Based on – Wind-down of retail energy 2011-2014 Projected Operating Income supply business at Pepco Energy Services on track – Completed sale of Conectiv Energy’s wholesale power generation busine
Slide 4: PHI's Strategic Focus
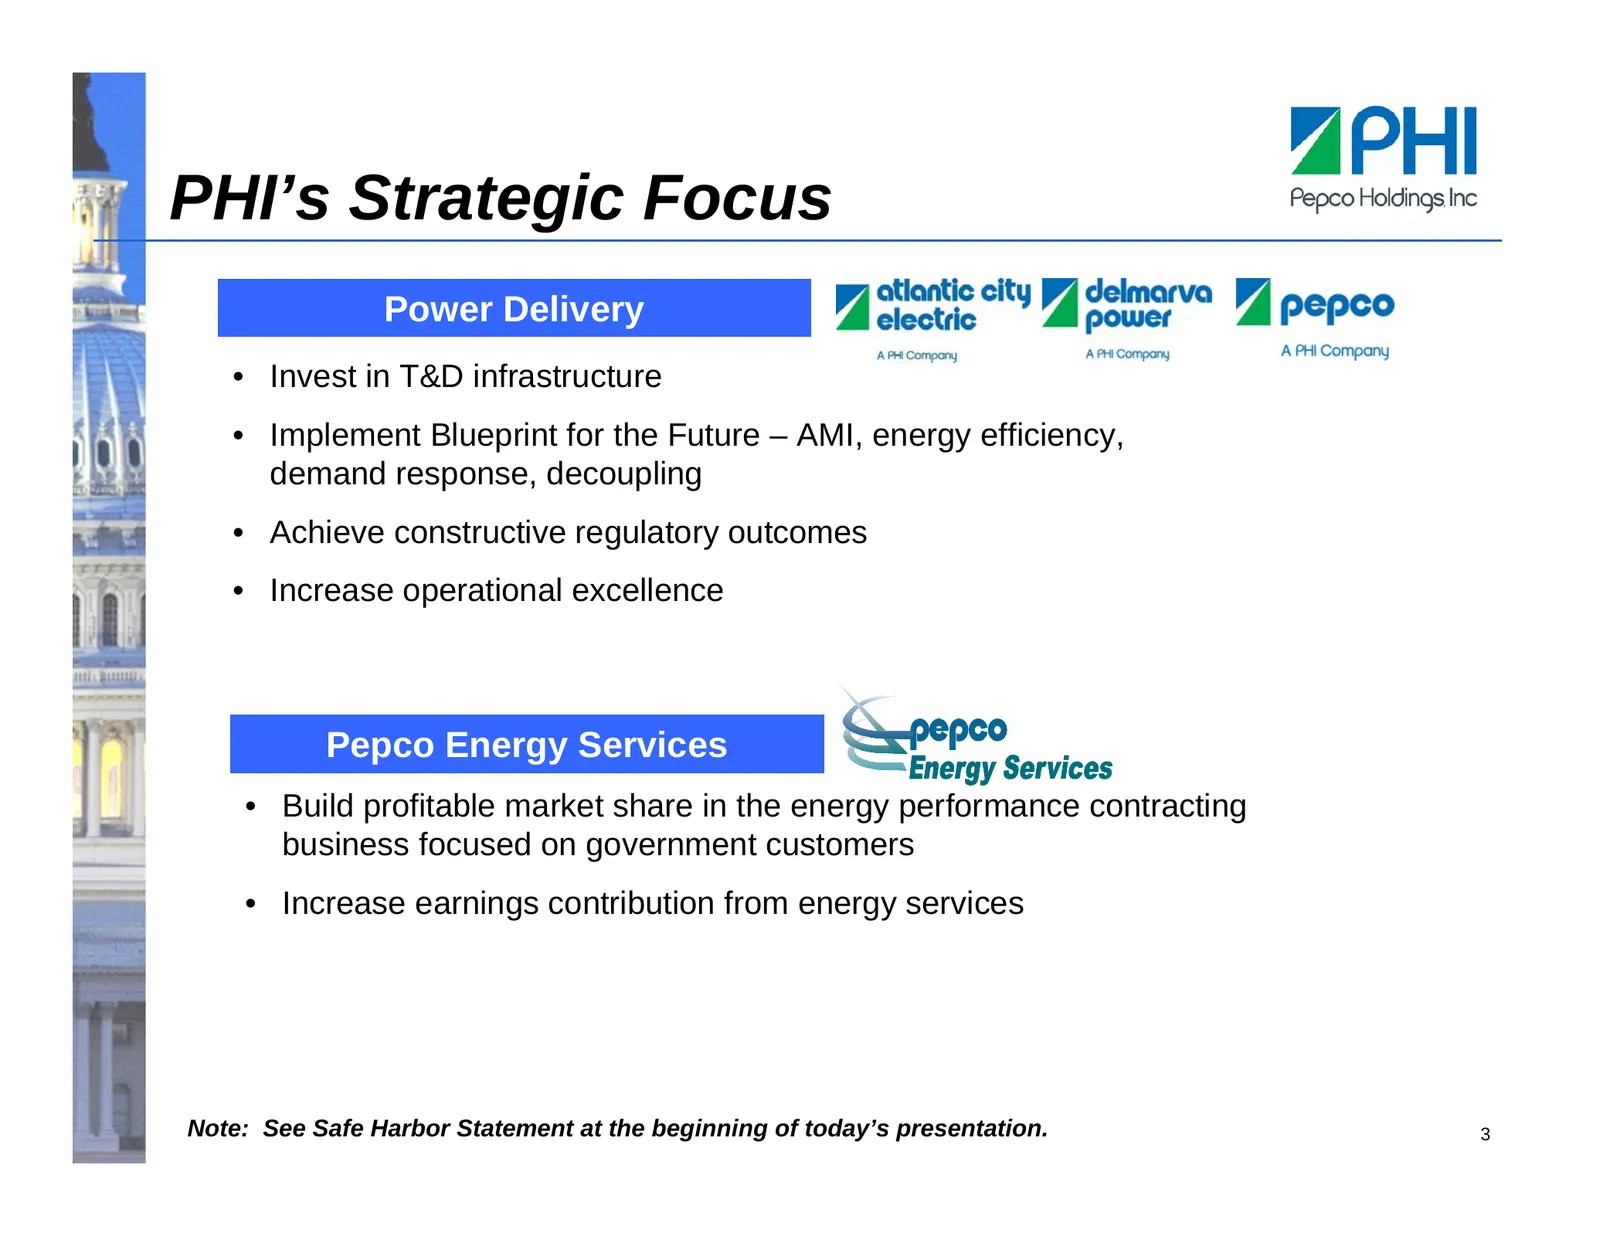
PHI’s Strategic Focus Power Delivery • Invest in T&D infrastructure • Implement Blueprint for the Future – AMI, energy efficiency, demand response, decoupling • Achieve constructive regulatory outcomes • Increase operational excellence Pepco Energy Services • Build profitable market share in the ene
Slide 5: Power Delivery – Positioned for Growth
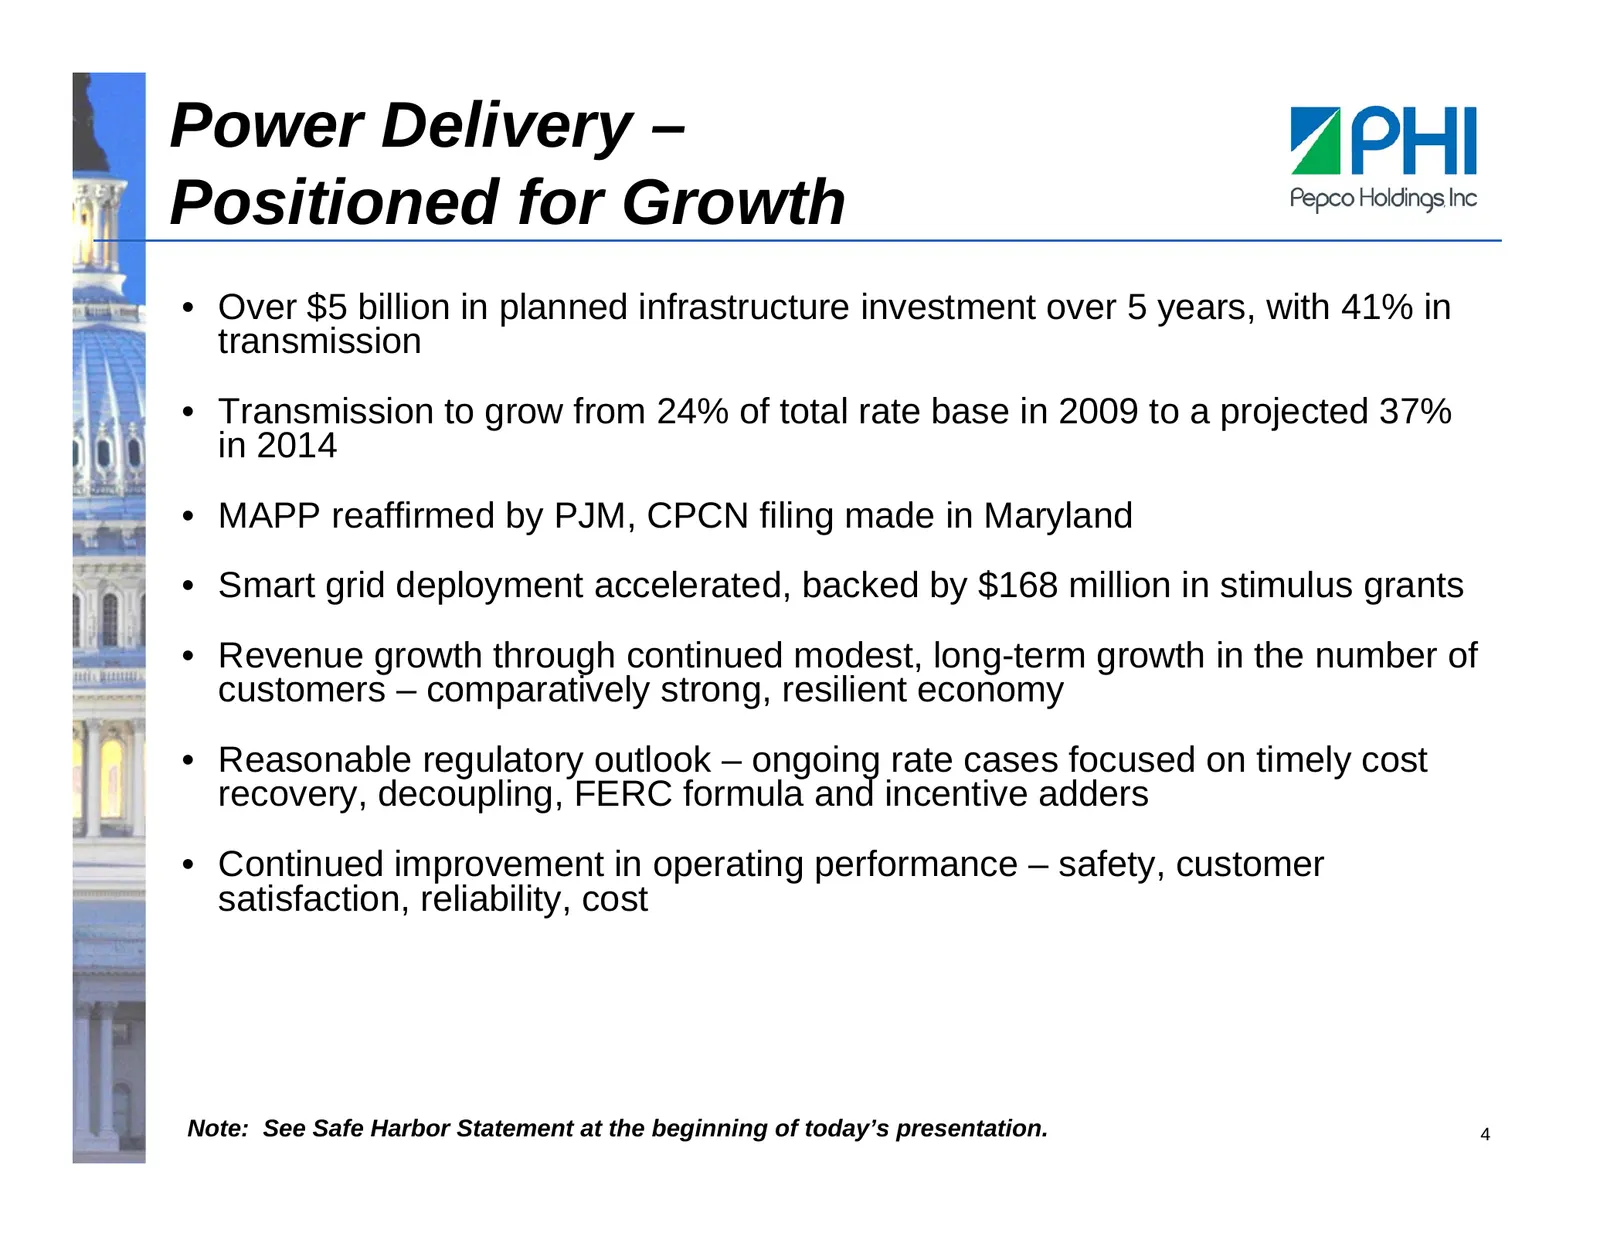
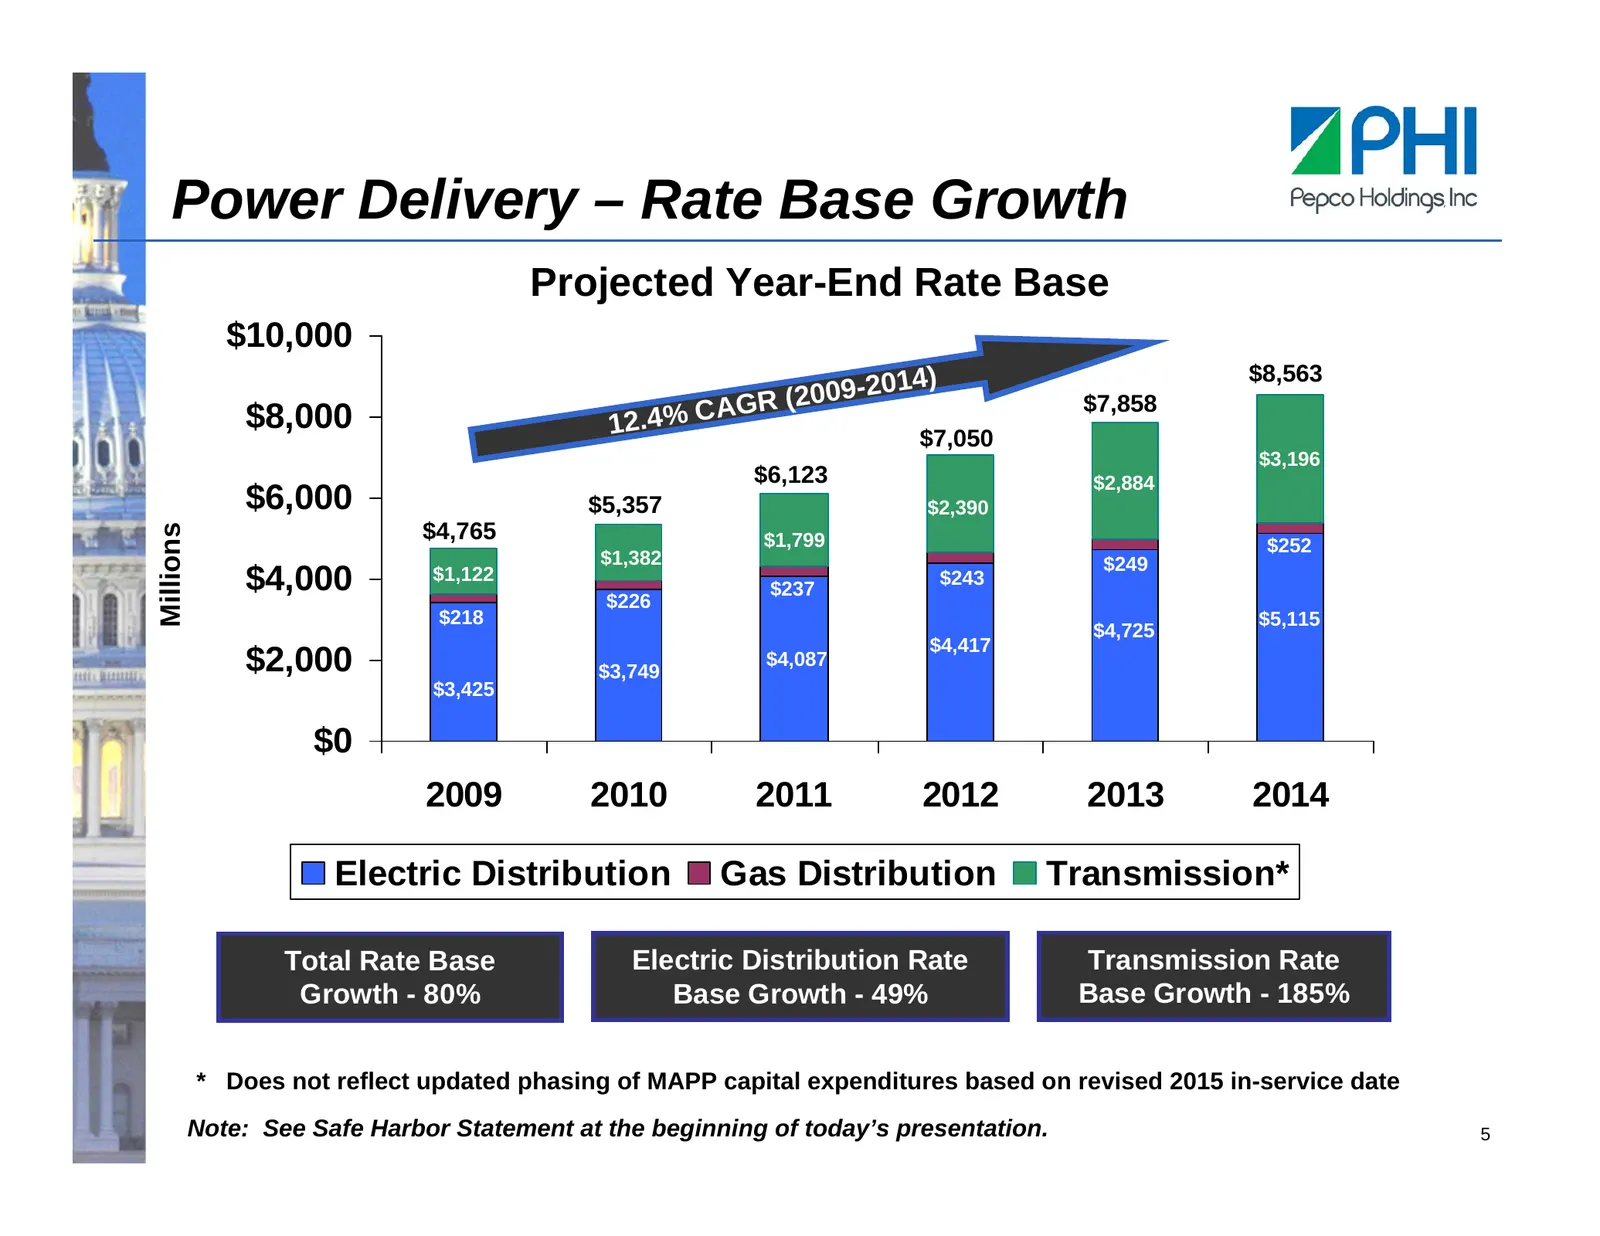
Power Delivery – Positioned for Growth • Over $5 billion in planned infrastructure investment over 5 years, with 41% in transmission • Transmission to grow from 24% of total rate base in 2009 to a projected 37% in 2014 • MAPP reaffirmed by PJM, CPCN filing made in Maryland • Smart grid deployment ac
Slide 6: Power Delivery – Rate Base Growth
Power Delivery – Rate Base Growth Projected Year-End Rate Base $10,000 $8,563 ( 2009-2014) AGR $7,858 $8,000 12.4% C $7,050 $3,196 $6,123 $2,884 $6,000 $5,357 $2,390 $4,765 Millions $1,799 $252 $1,382 $249 $4,000 $1,122 $226 $237 $243 $218 $5,115 $4,725 $4,417 $2,000 $3,749 $4,087 $3,425 $0 2009 201
Slide 7: Mid-Atlantic Power Pathway (MAPP) – Project Update
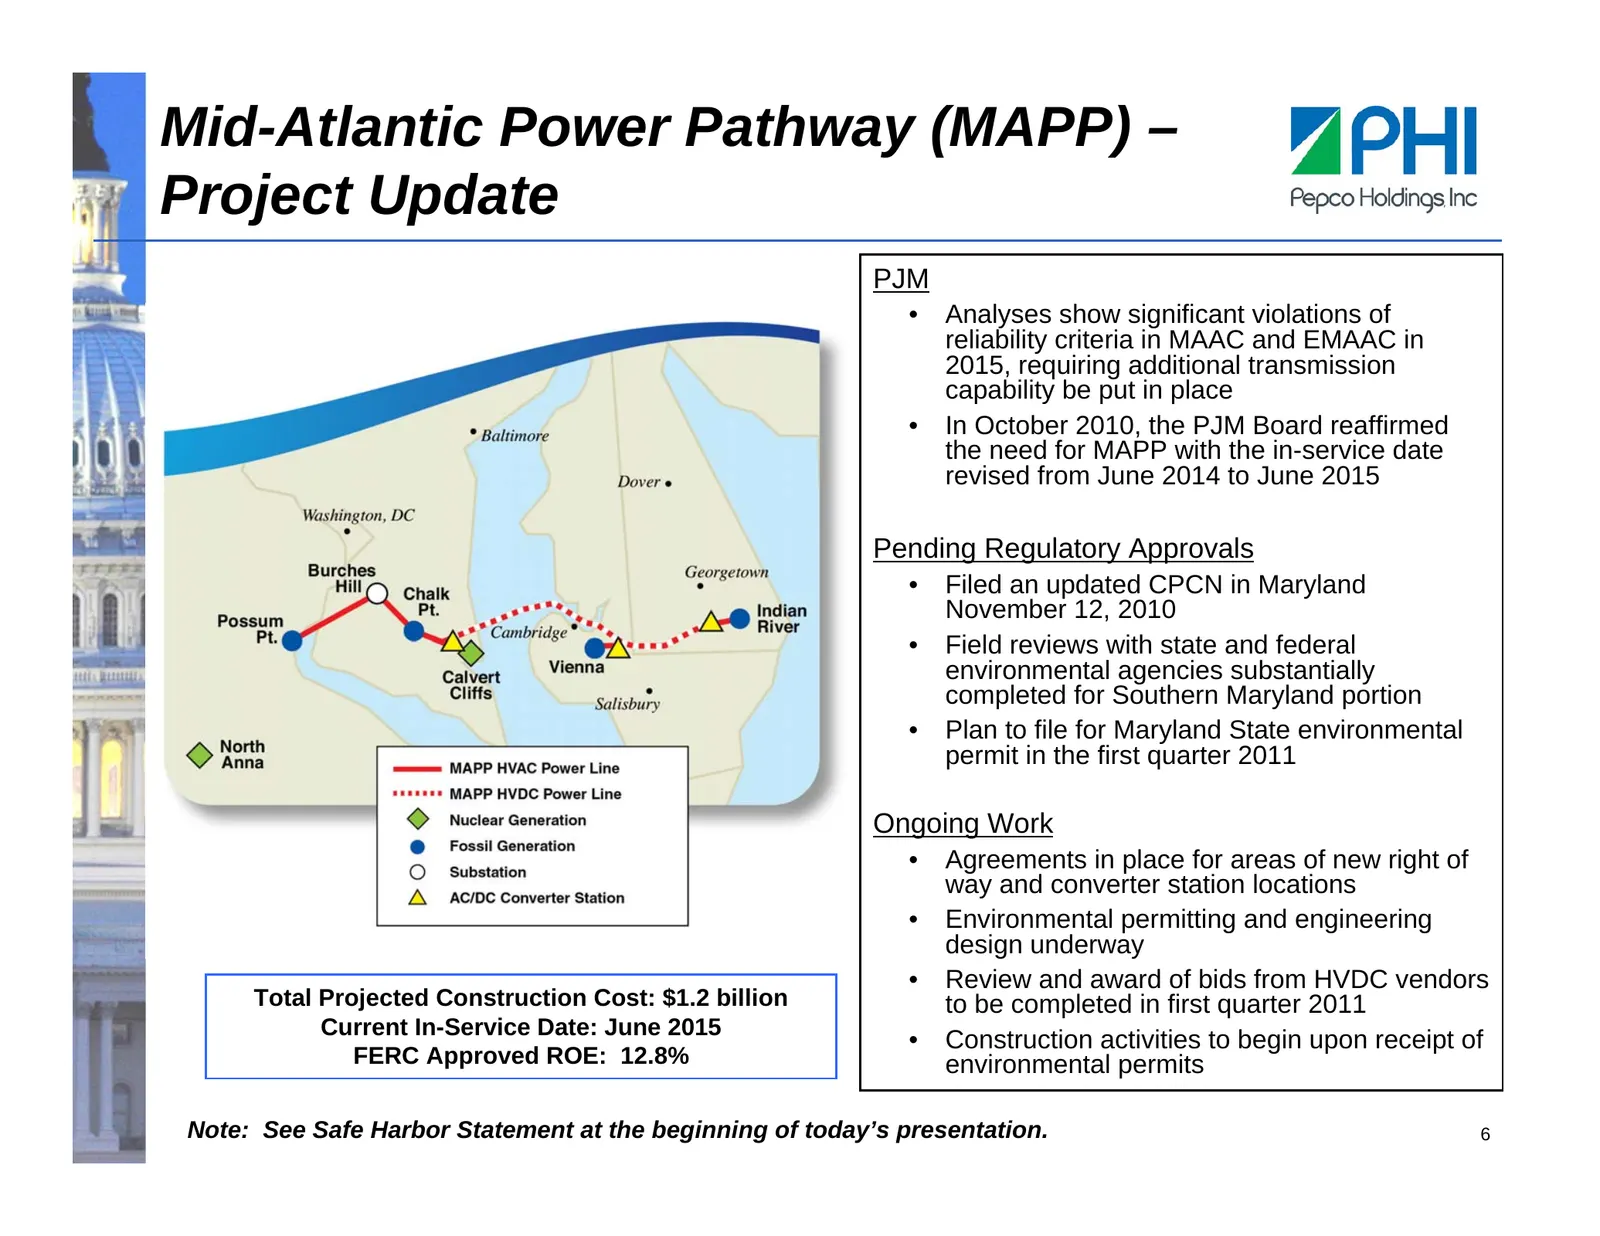
Mid-Atlantic Power Pathway (MAPP) – Project Update PJM • Analyses show significant violations of reliability criteria in MAAC and EMAAC in 2015, requiring additional transmission capability be put in place • In October 2010, the PJM Board reaffirmed the need for MAPP with the in-service date revised
Slide 8: MAPP Construction Expenditures – Revised for 2015 In-Service Date
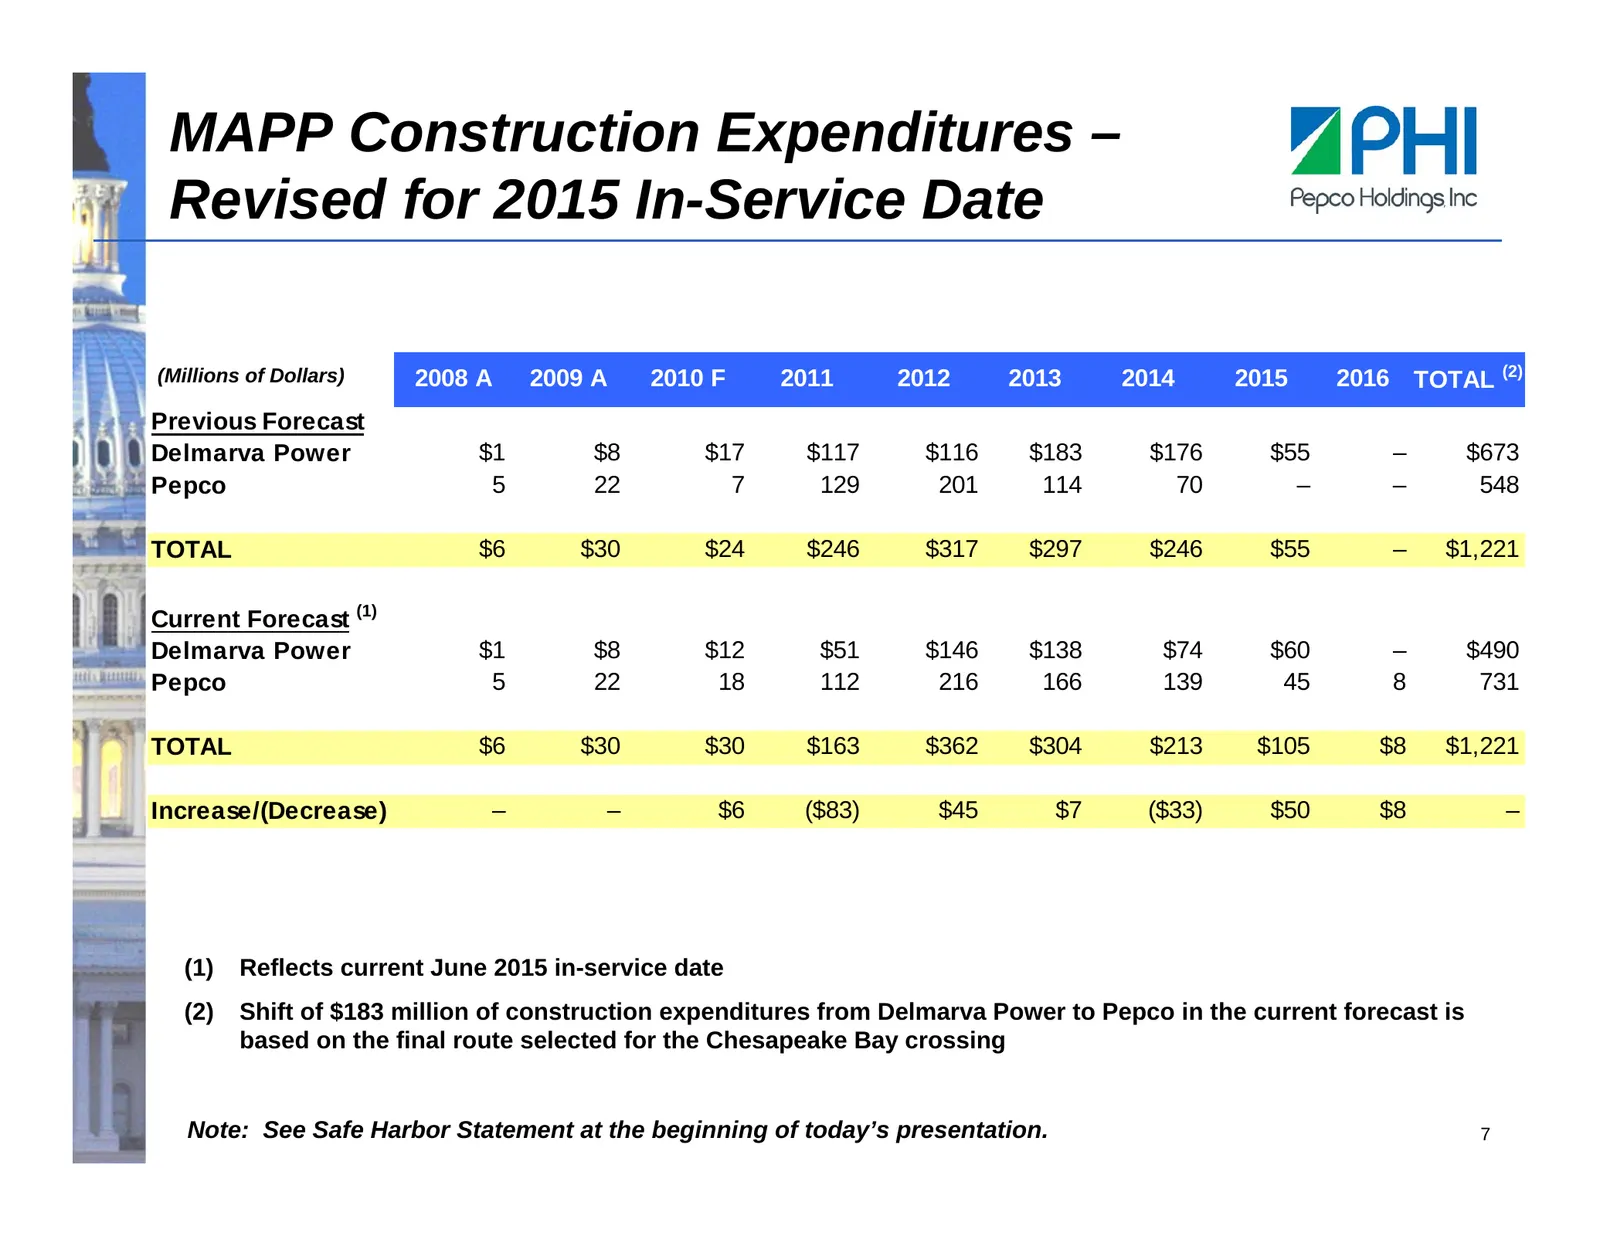
MAPP Construction Expenditures – Revised for 2015 In-Service Date (Millions of Dollars) 2008 A 2009 A 2010 F 2011 2012 2013 2014 2015 2016 TOTAL (2) Previous Forecast Delmarva Power $1 $8 $17 $117 $116 $183 $176 $55 – $673 Pepco 5 22 7 129 201 114 70 – – 548 TOTAL $6 $30 $24 $246 $317 $297 $246 $55
Slide 9: Blueprint – Project Status by Jurisdiction
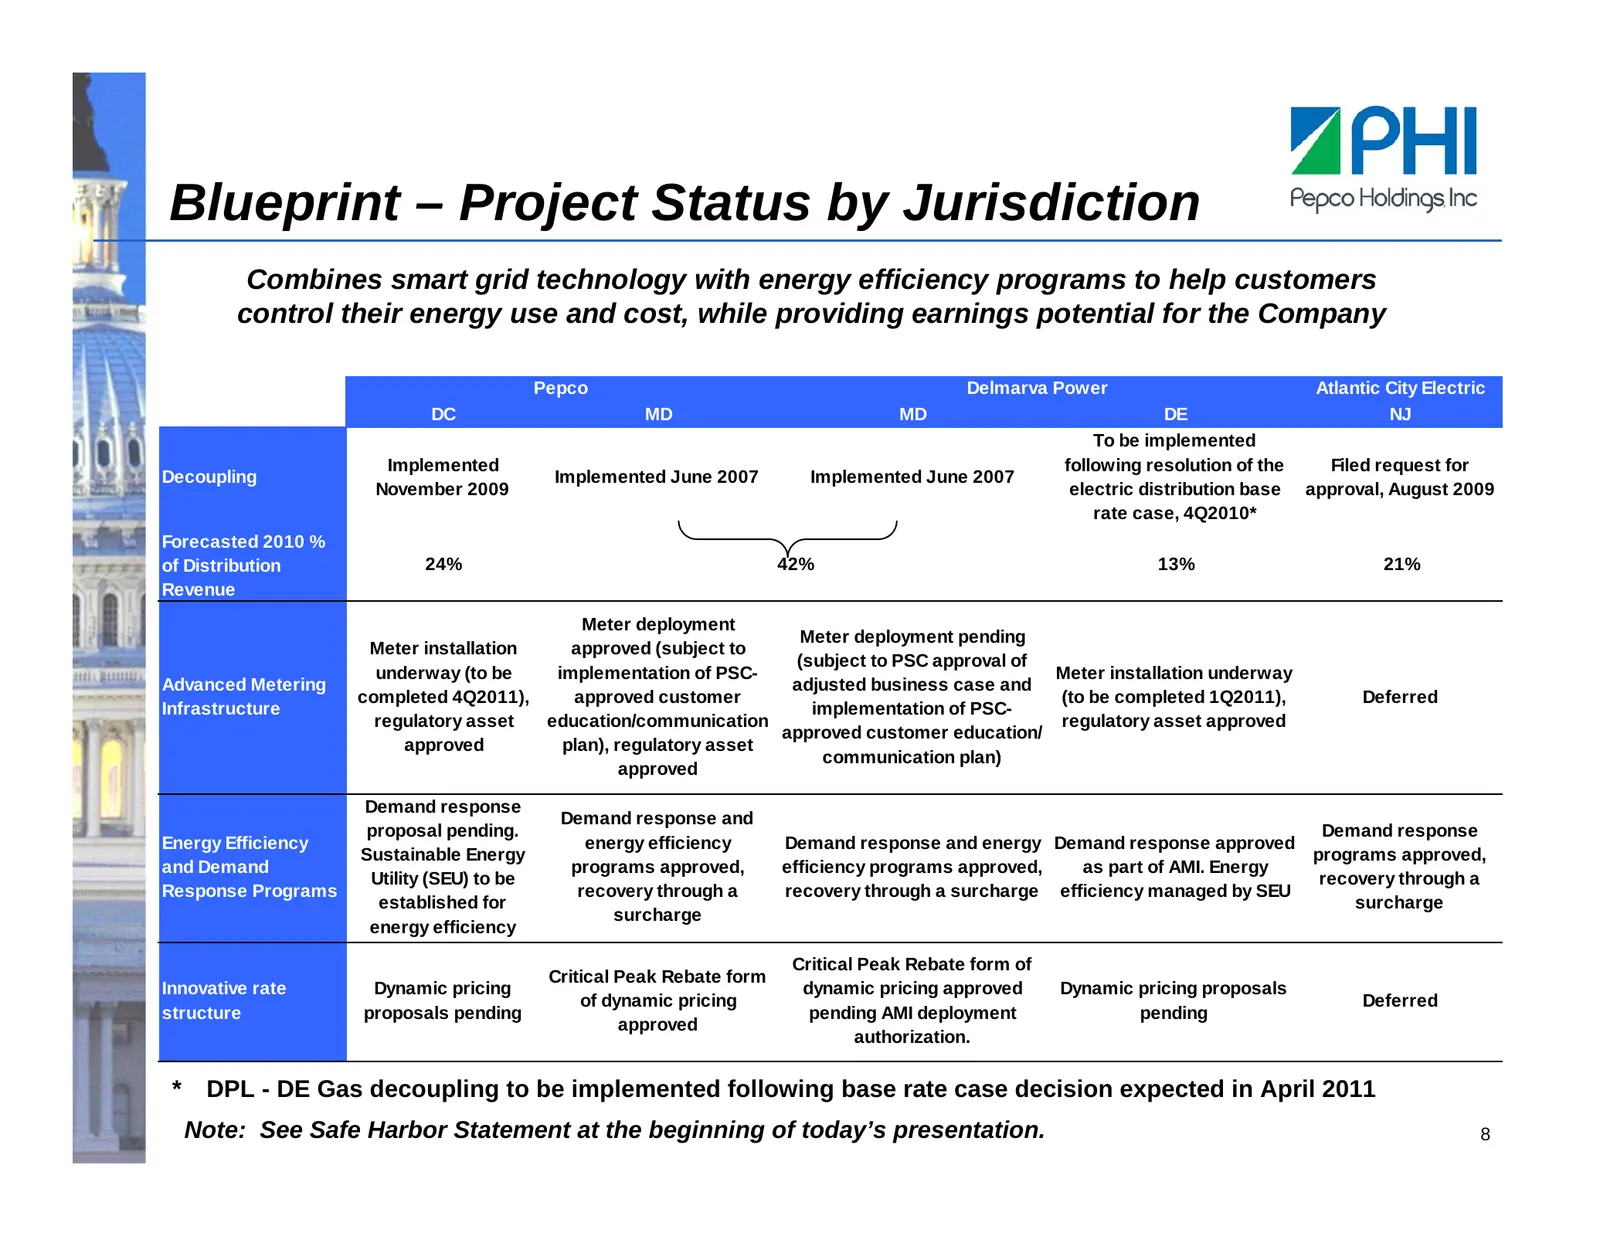
Blueprint – Project Status by Jurisdiction Combines smart grid technology with energy efficiency programs to help customers control their energy use and cost, while providing earnings potential for the Company Pepco Delmarva Power Atlantic City Electric DC MD MD DE NJ To be implemented Implemented f
Slide 10: Sales and Customer Growth
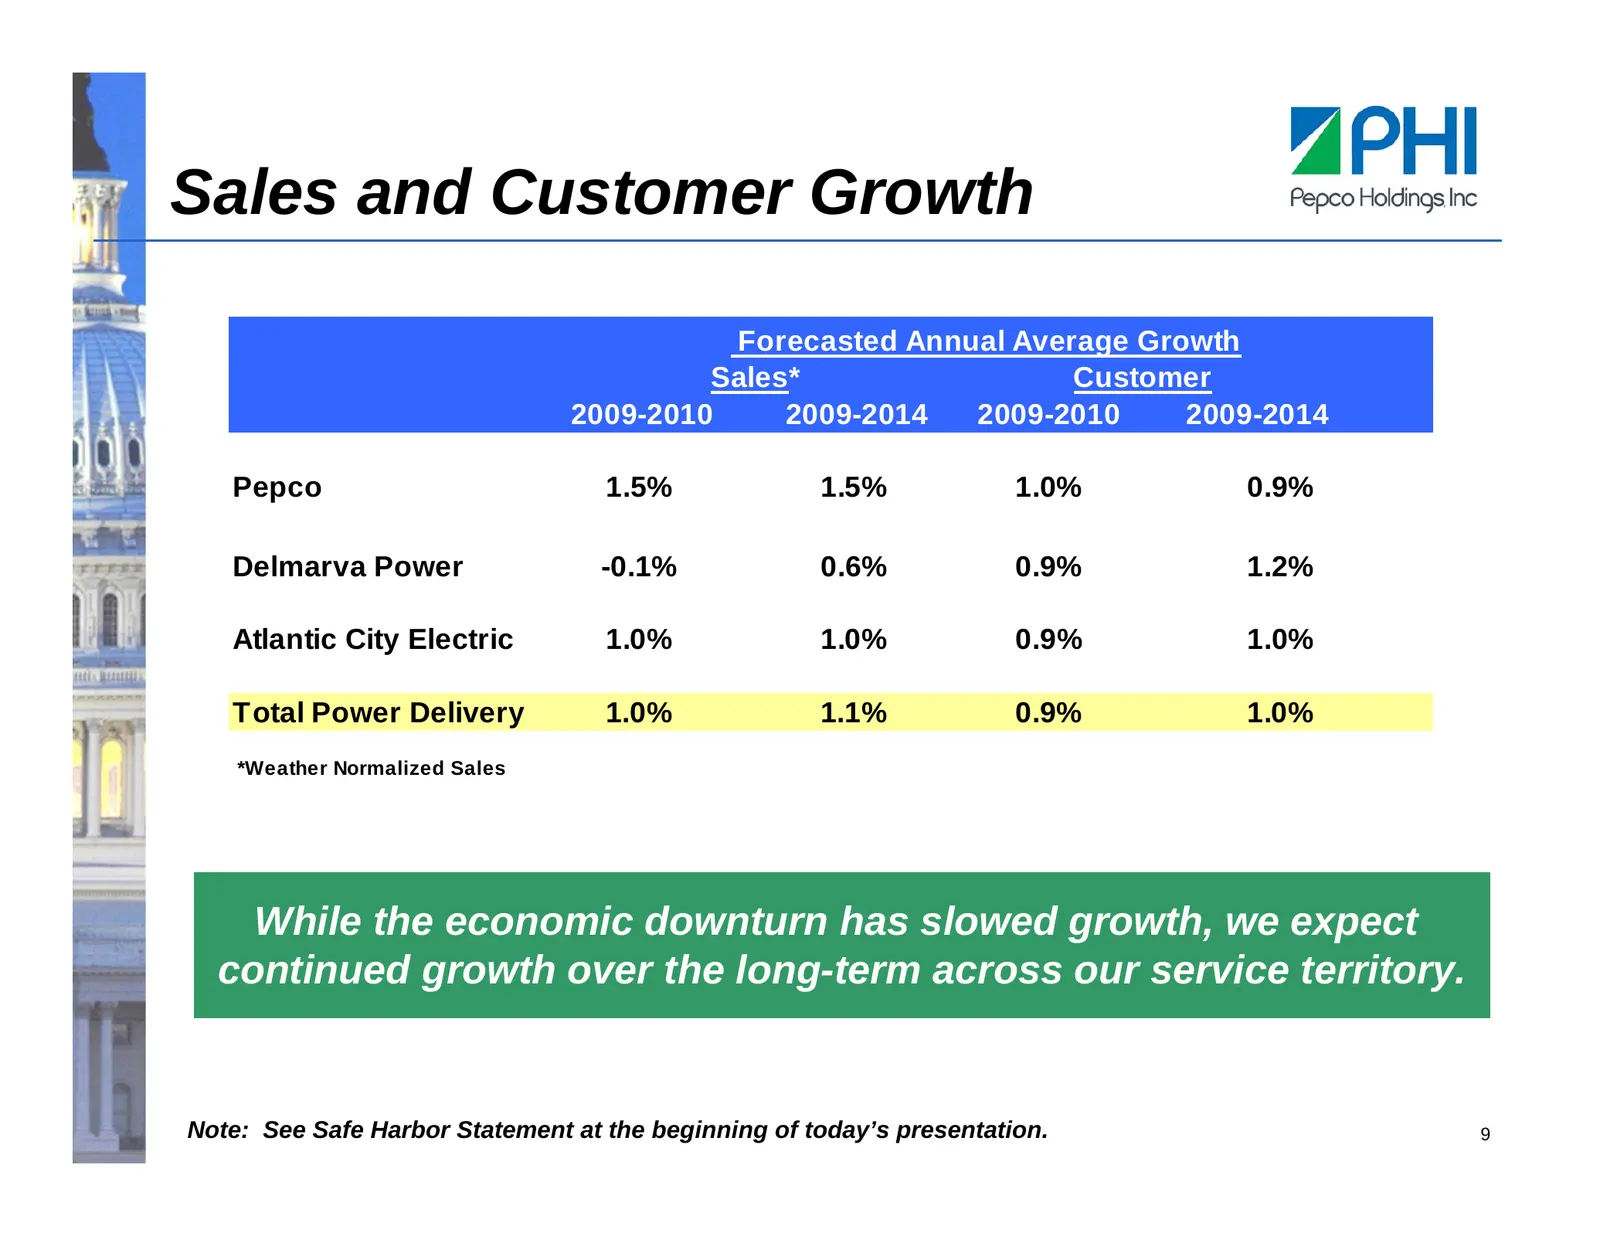
Sales and Customer Growth Forecasted Annual Average Growth Sales* Customer 2009-2010 2009-2014 2009-2010 2009-2014 Pepco 1.5% 1.5% 1.0% 0.9% Delmarva Power -0.1% 0.6% 0.9% 1.2% Atlantic City Electric 1.0% 1.0% 0.9% 1.0% Total Power Delivery 1.0% 1.1% 0.9% 1.0% *Weather Normalized Sales While the eco
Slide 11: Distribution Rate Cases – Most Recent Decisions
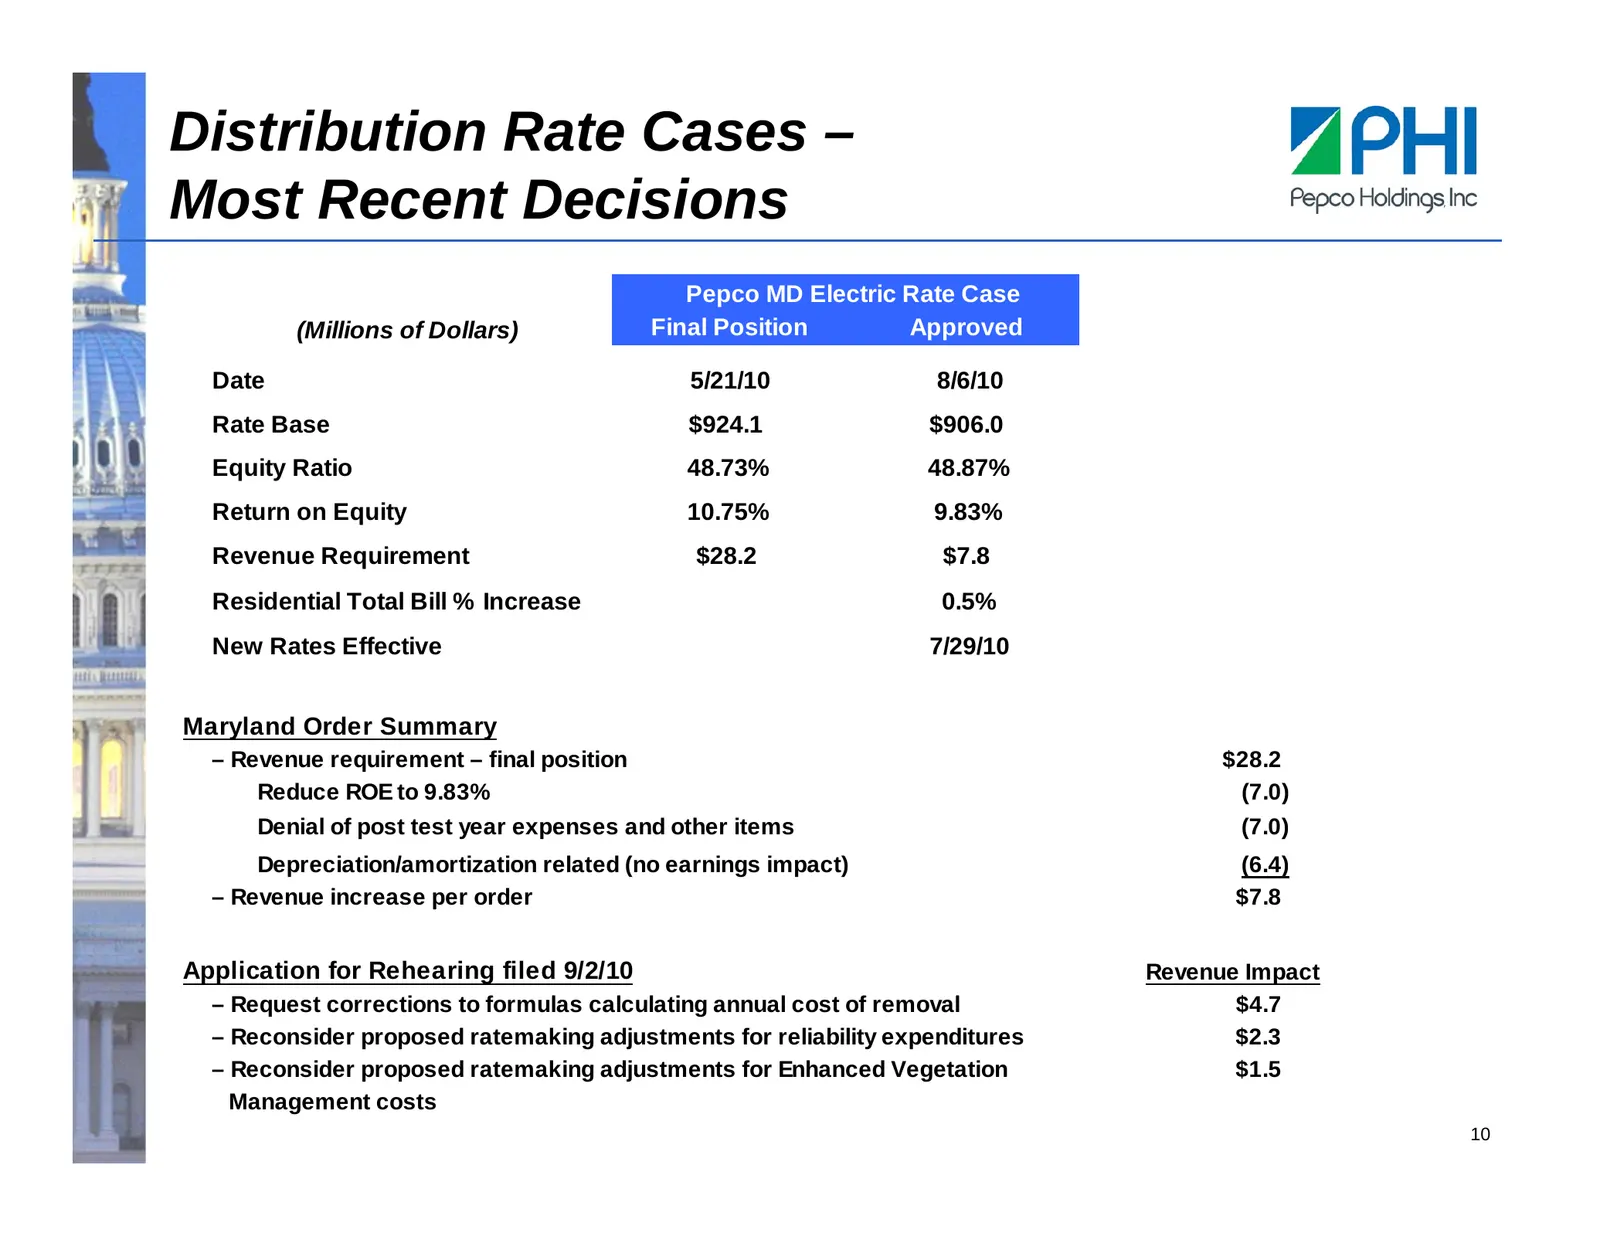
Distribution Rate Cases – Most Recent Decisions Pepco MD Electric Rate Case (Millions of Dollars) Final Position Approved Date 5/21/10 8/6/10 Rate Base $924.1 $906.0 Equity Ratio 48.73% 48.87% Return on Equity 10.75% 9.83% Revenue Requirement $28.2 $7.8 Residential Total Bill % Increase 0.5% New Rat
Slide 12: Distribution Rate Cases – Most Recent Decisions (continued)
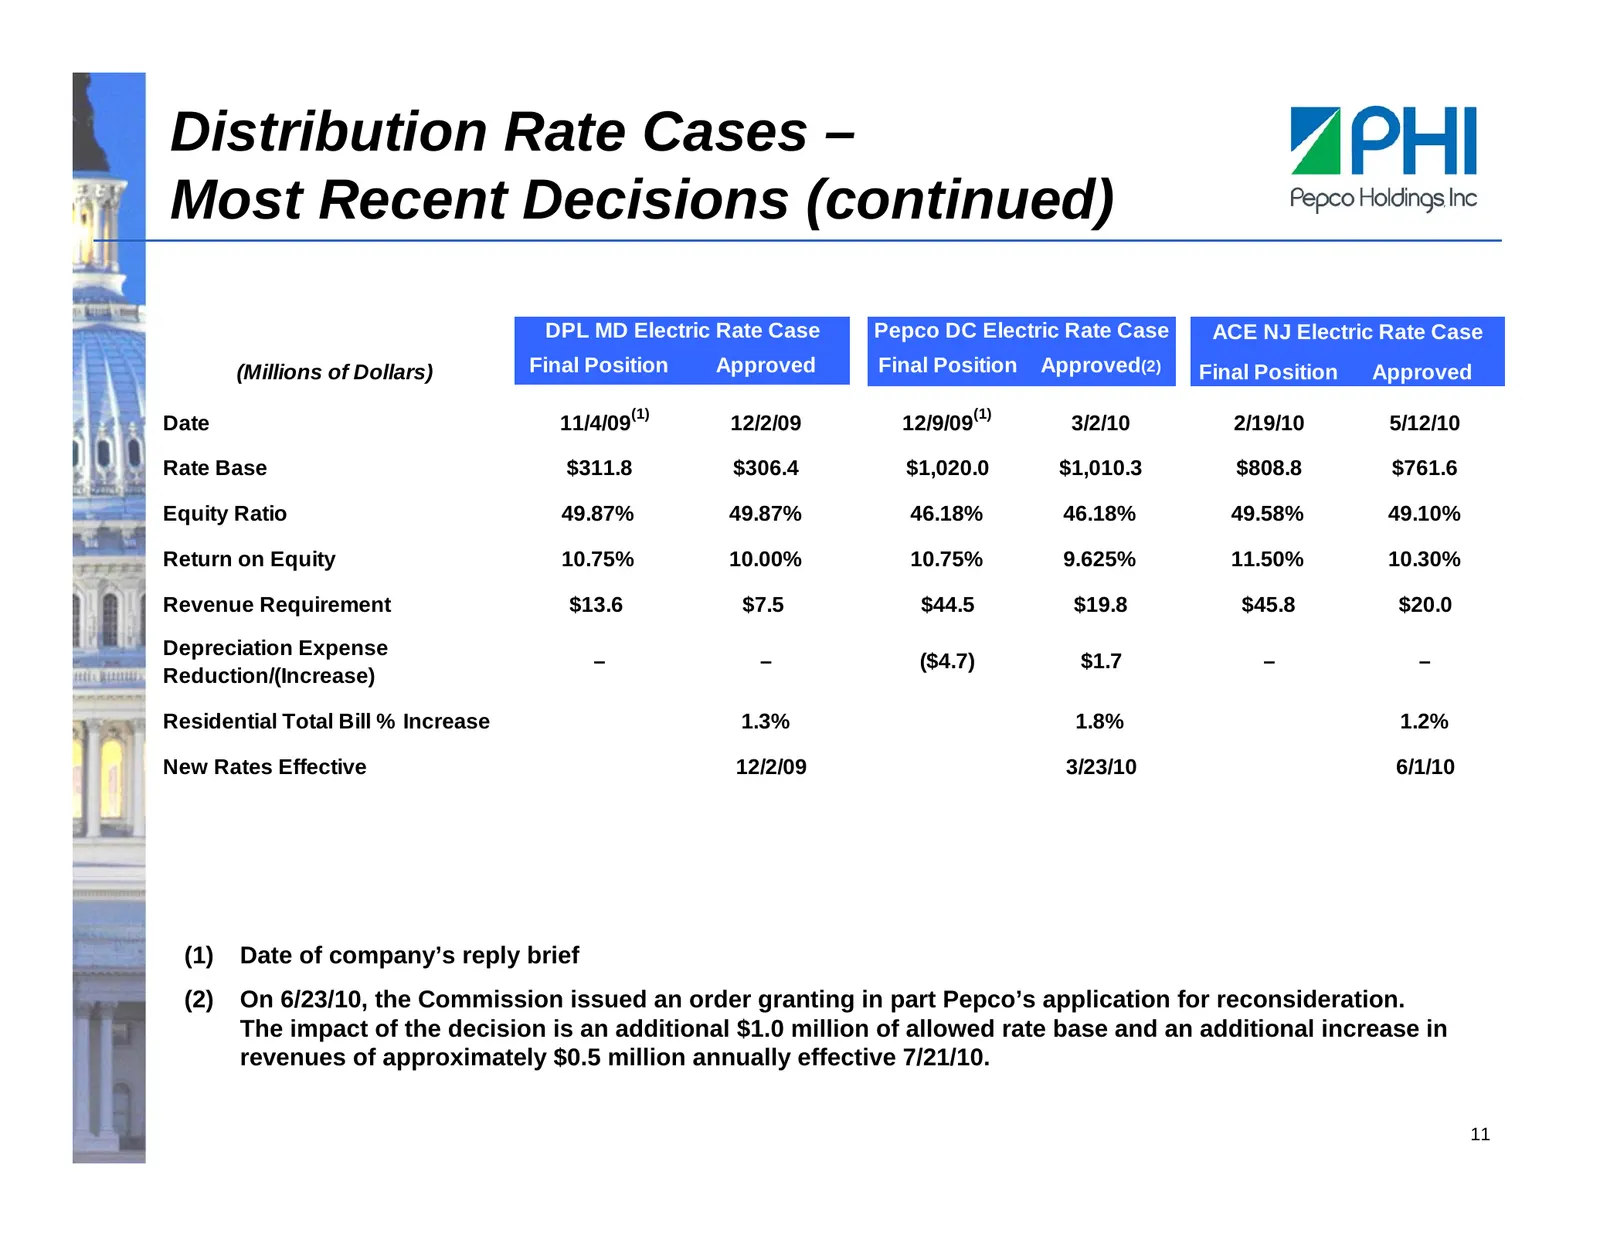
Distribution Rate Cases – Most Recent Decisions (continued) DPL MD Electric Rate Case Pepco DC Electric Rate Case ACE NJ Electric Rate Case (Millions of Dollars) Final Position Approved Final Position Approved(2) Final Position Approved (1) (1) Date 11/4/09 12/2/09 12/9/09 3/2/10 2/19/10 5/12/10 Rat
Slide 13: Distribution Rate Cases – Pending Delmarva Power – Electric
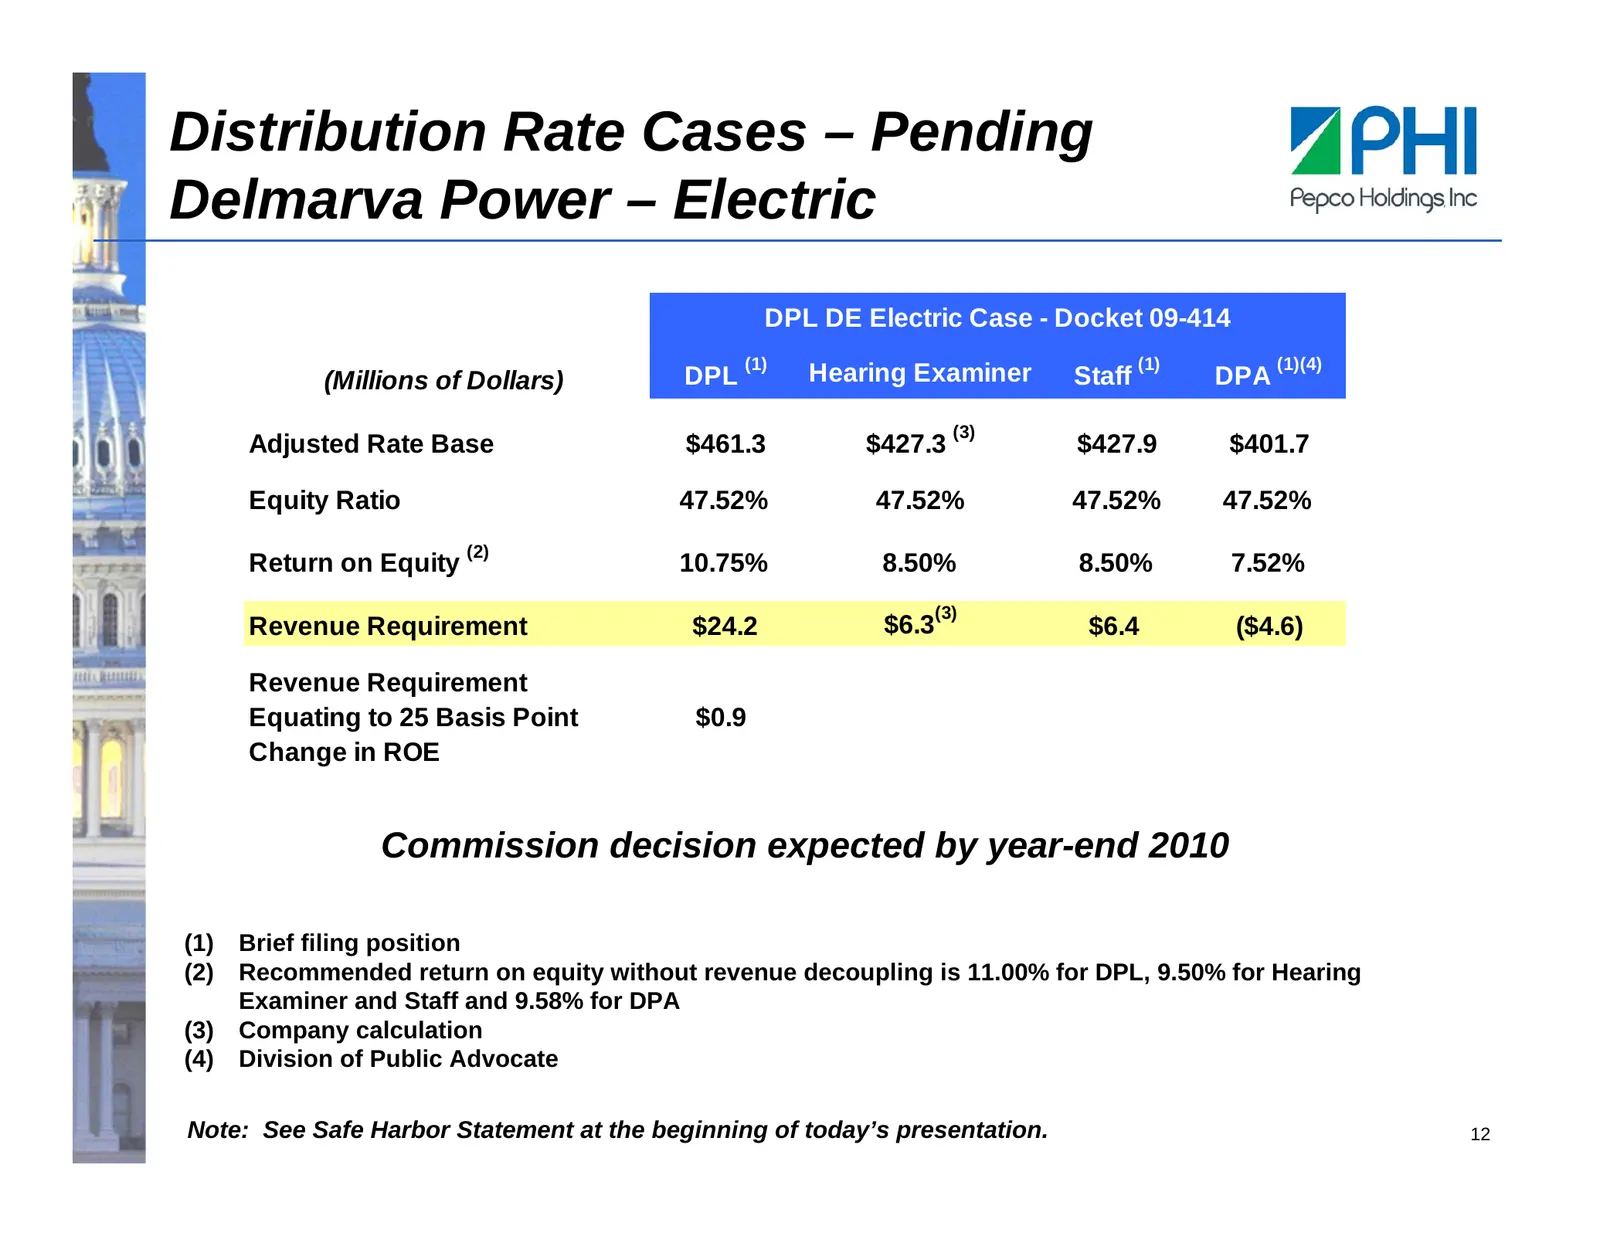
Distribution Rate Cases – Pending Delmarva Power – Electric DPL DE Electric Case - Docket 09-414 (1) (1) (1)(4) (Millions of Dollars) DPL Hearing Examiner Staff DPA (3) Adjusted Rate Base $461.3 $427.3 $427.9 $401.7 Equity Ratio 47.52% 47.52% 47.52% 47.52% (2) Return on Equity 10.75% 8.50% 8.50% 7.5
Slide 14: Distribution Rate Cases – Pending Delmarva Power – Gas
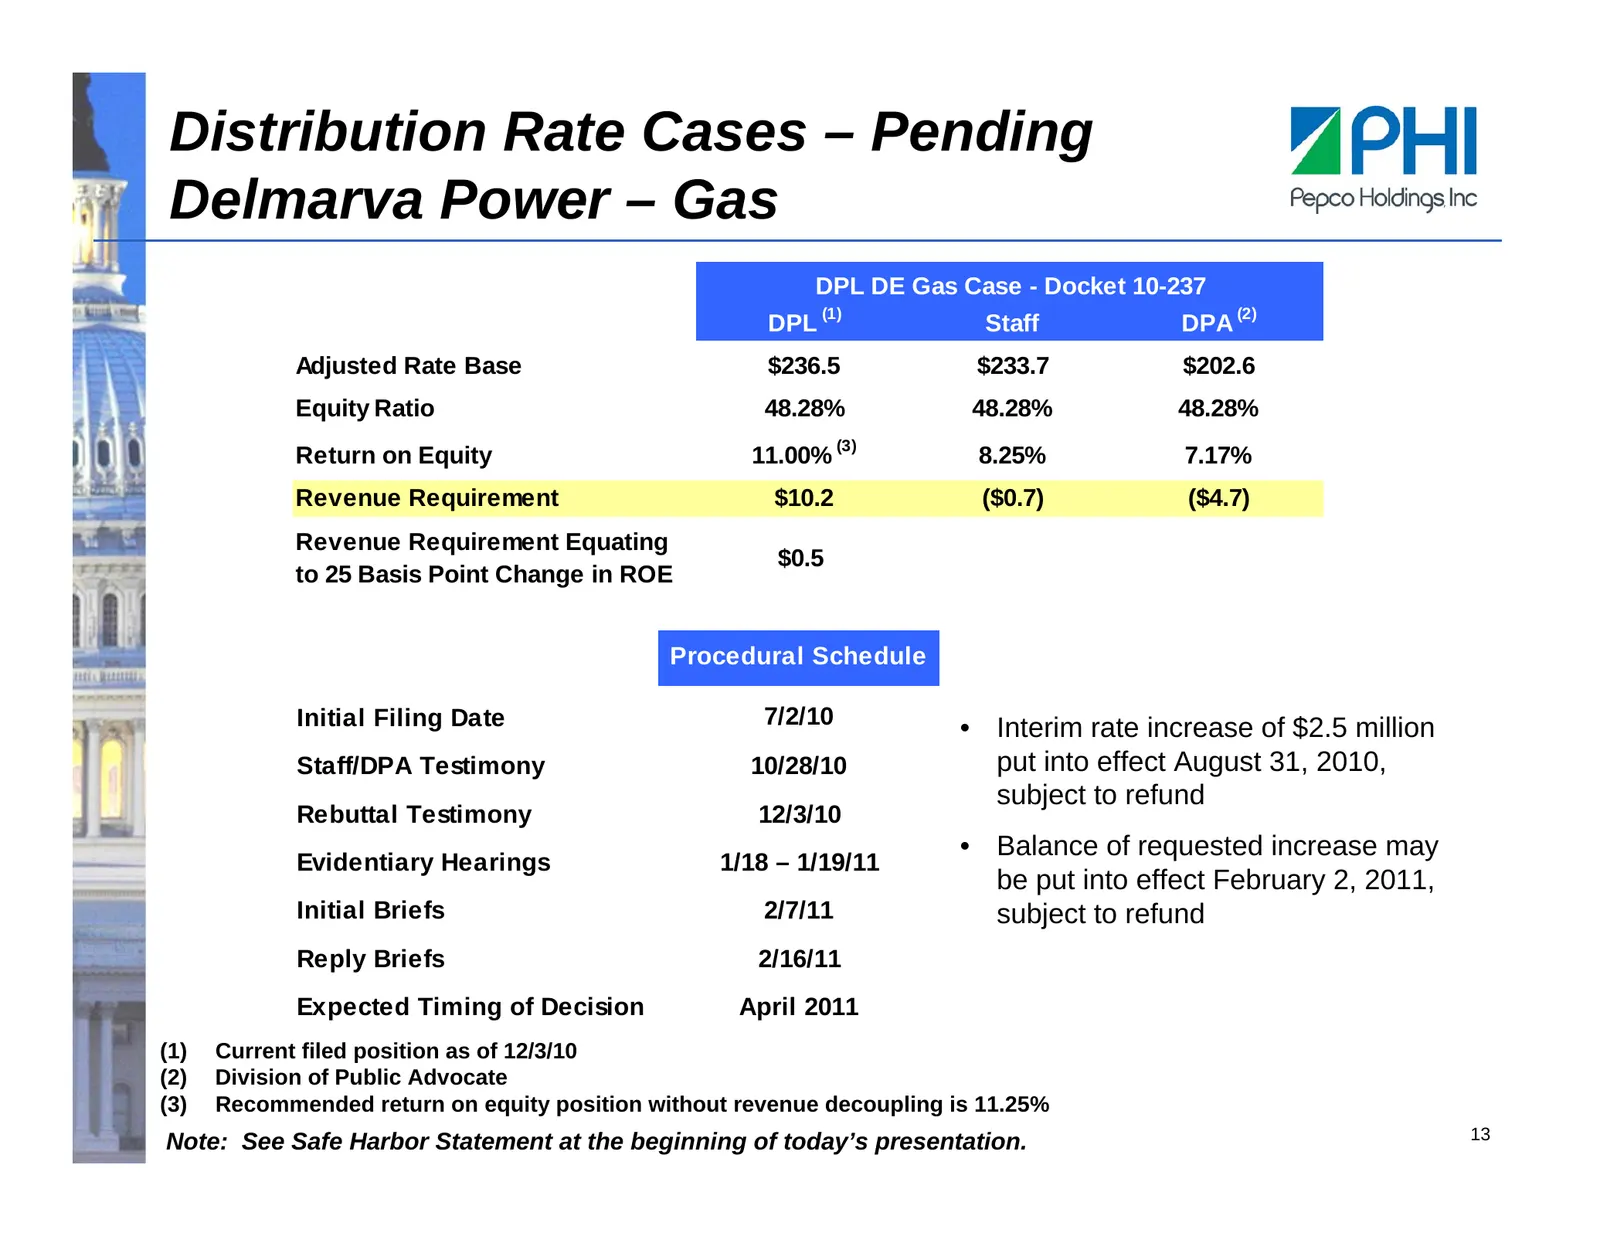
Distribution Rate Cases – Pending Delmarva Power – Gas DPL DE Gas Case - Docket 10-237 (1) (2) DPL Staff DPA Adjusted Rate Base $236.5 $233.7 $202.6 Equity Ratio 48.28% 48.28% 48.28% (3) Return on Equity 11.00% 8.25% 7.17% Revenue Requirement $10.2 ($0.7) ($4.7) Revenue Requirement Equating $0.5 to
Slide 15: Distribution Rate Cases – The Next Cycle
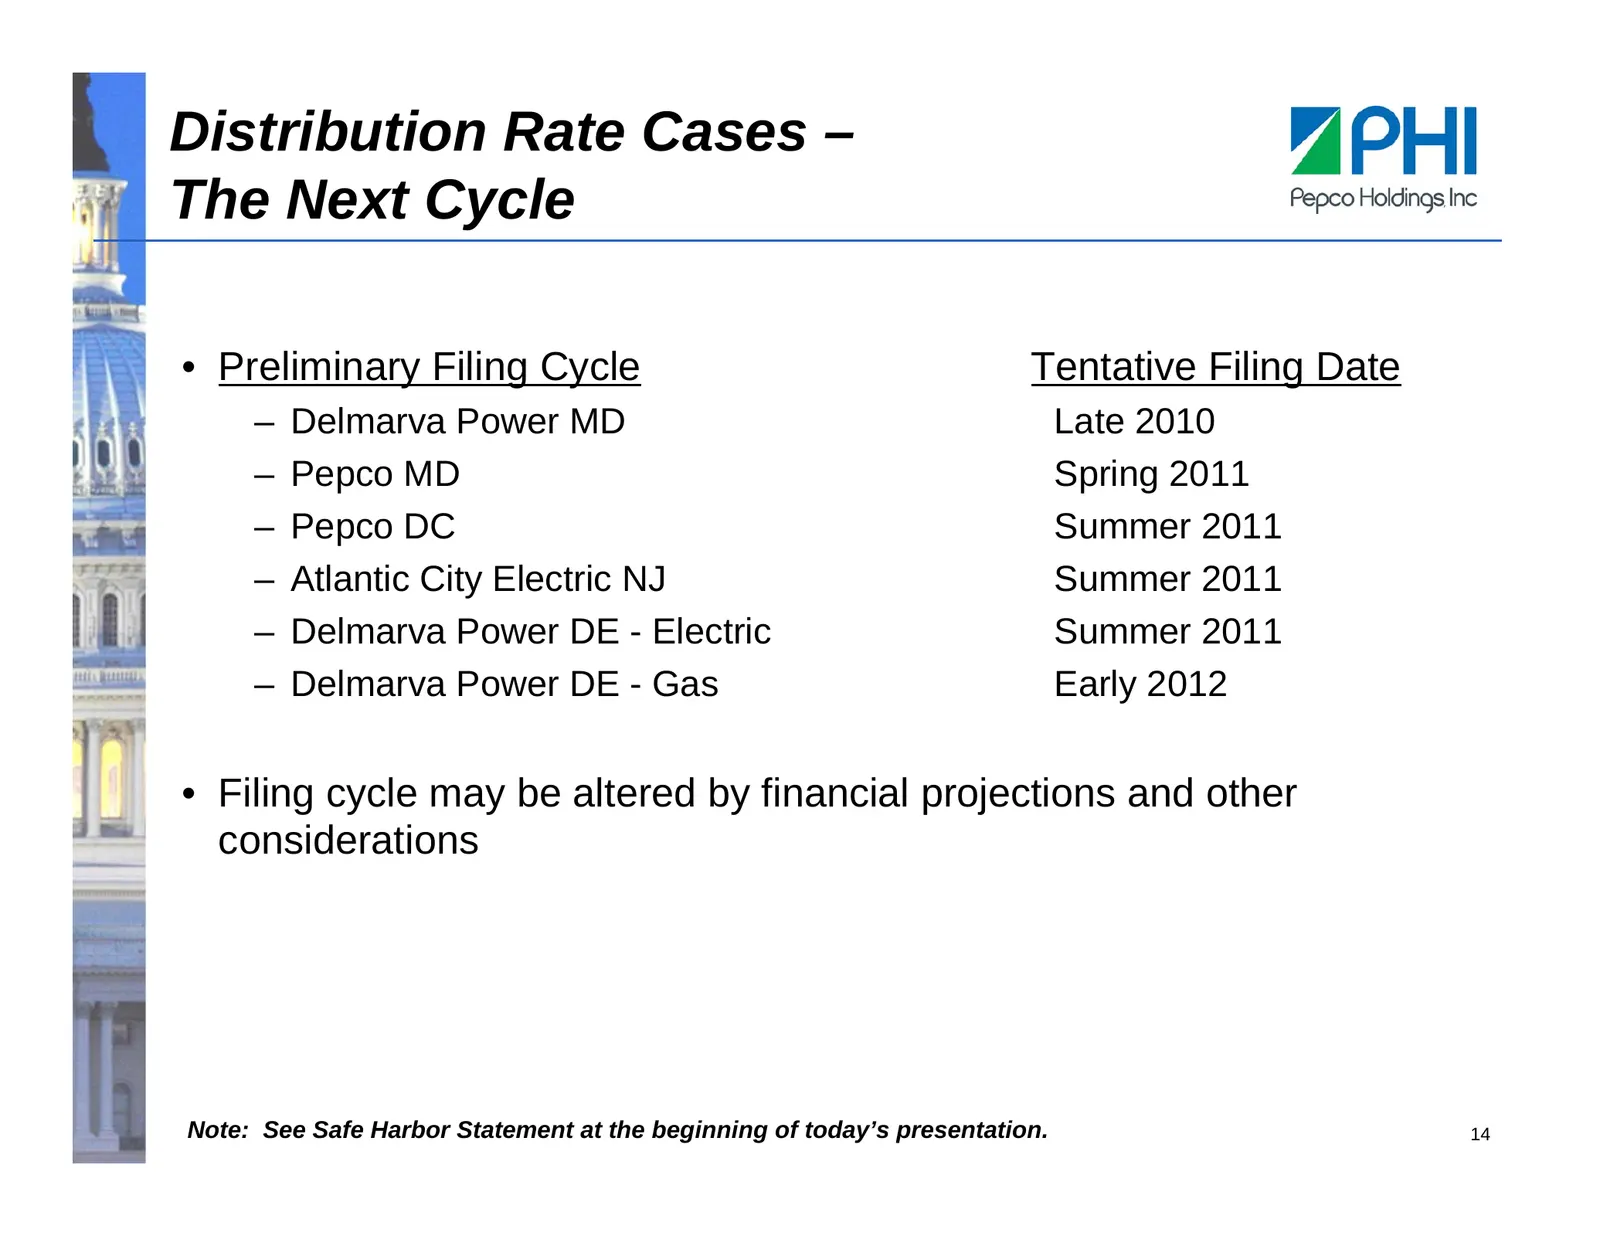
Distribution Rate Cases – The Next Cycle • Preliminary Filing Cycle Tentative Filing Date – Delmarva Power MD Late 2010 – Pepco MD Spring 2011 – Pepco DC Summer 2011 – Atlantic City Electric NJ Summer 2011 – Delmarva Power DE - Electric Summer 2011 – Delmarva Power DE - Gas Early 2012 • Filing cycle
Slide 16: Regulatory Lag Reduction Mechanisms
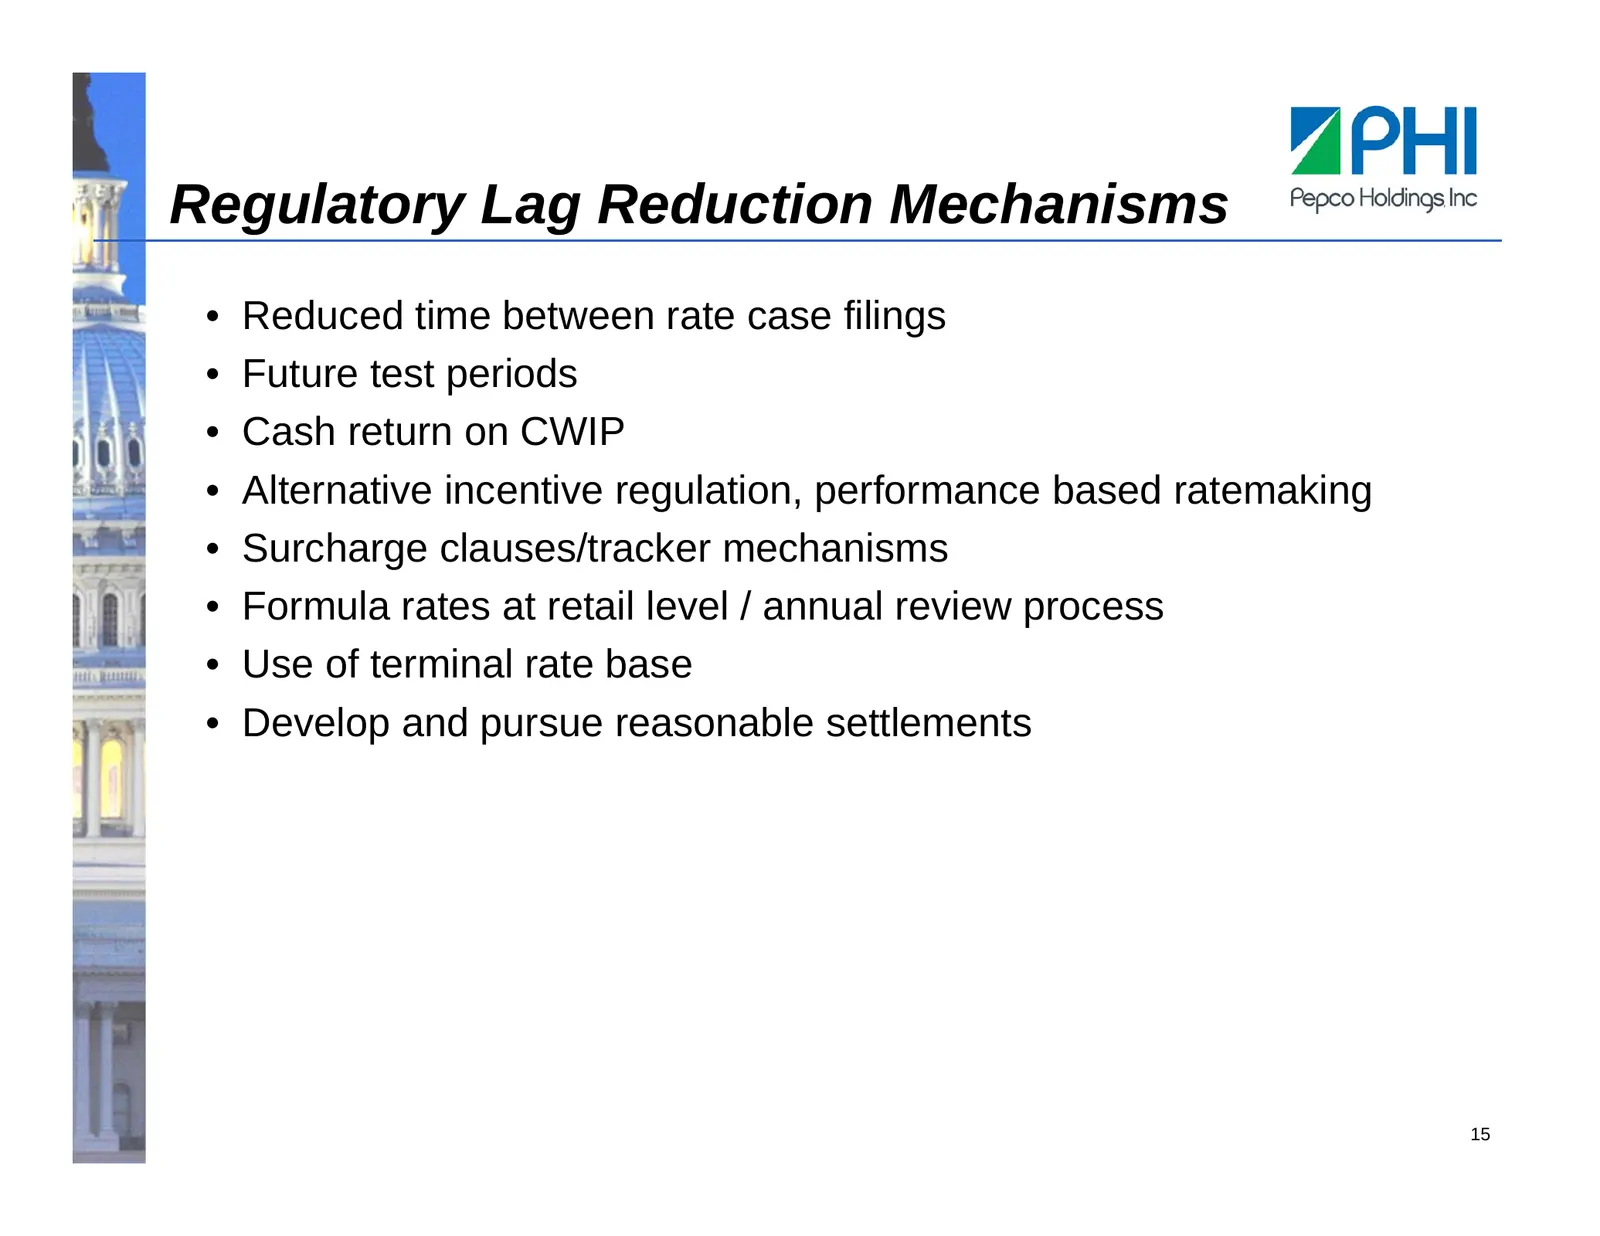
Regulatory Lag Reduction Mechanisms • Reduced time between rate case filings • Future test periods • Cash return on CWIP • Alternative incentive regulation, performance based ratemaking • Surcharge clauses/tracker mechanisms • Formula rates at retail level / annual review process • Use of terminal r
Slide 17: Pepco Energy Services Overview
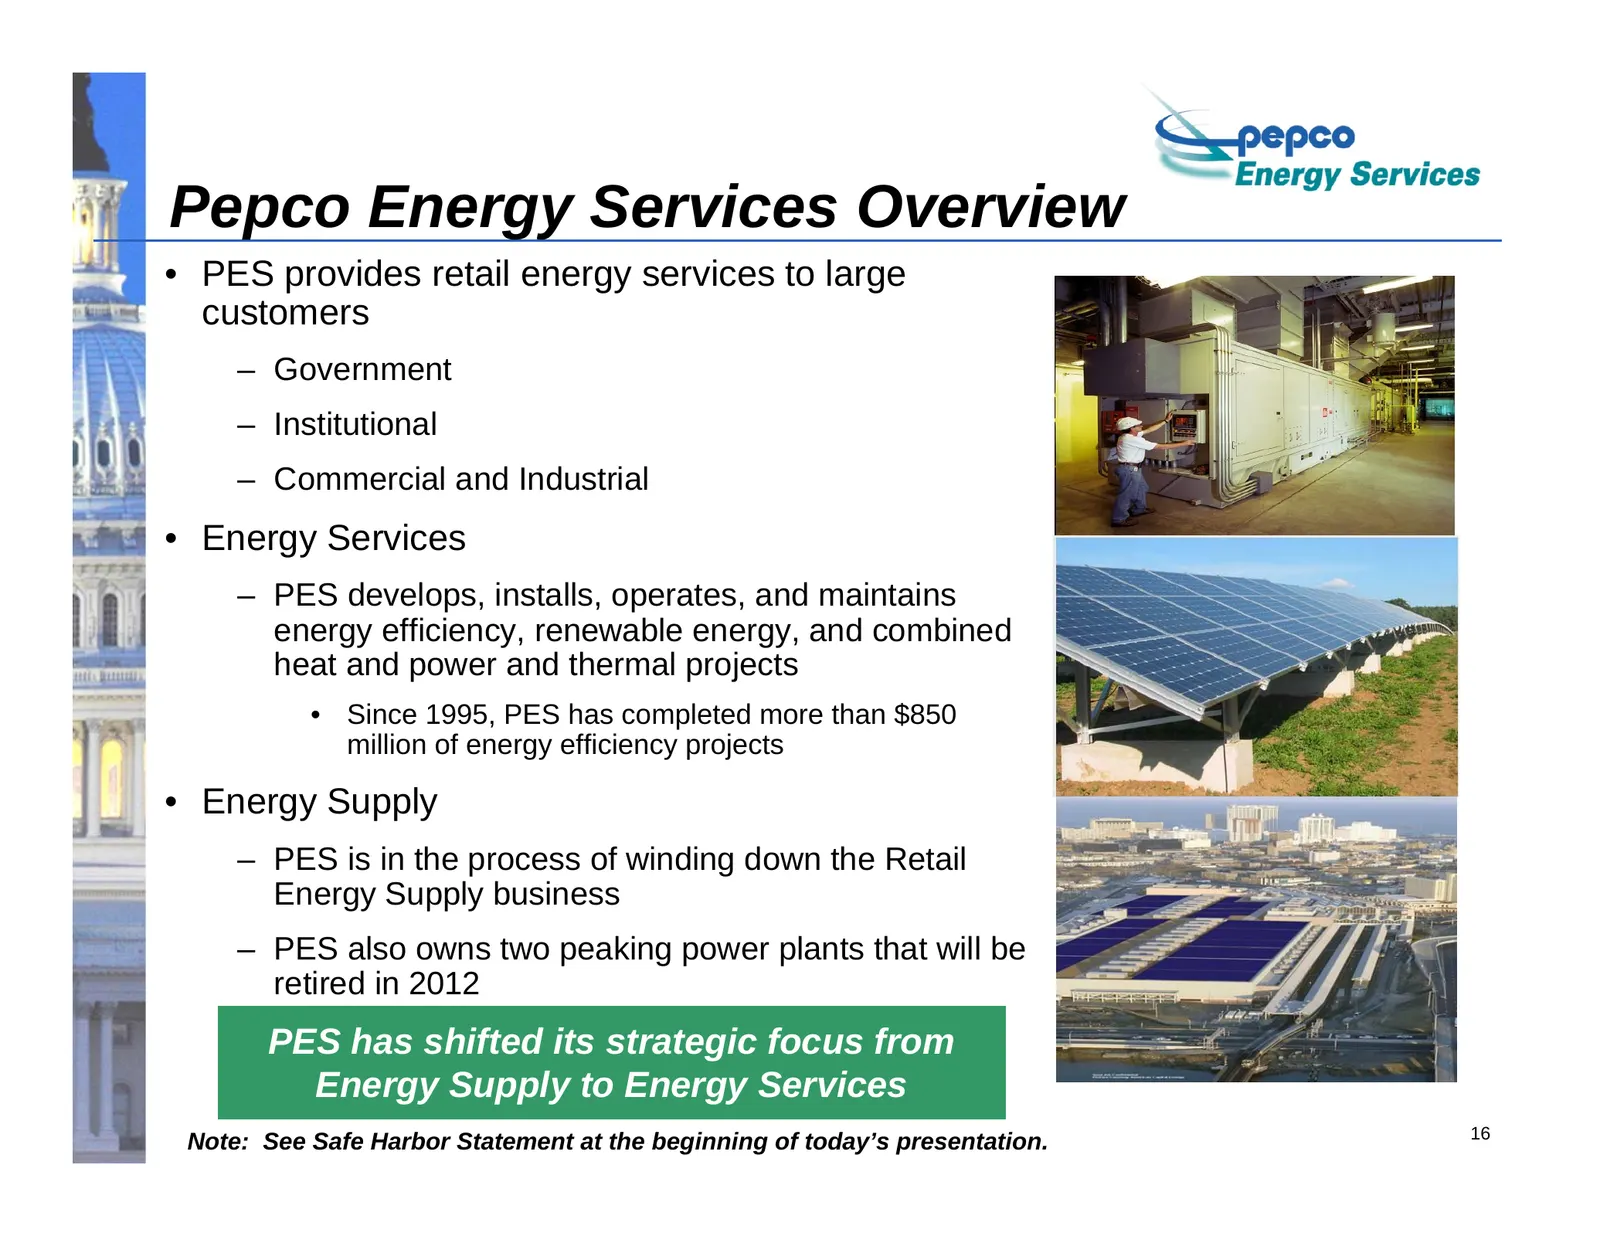
Pepco Energy Services Overview • PES provides retail energy services to large customers – Government – Institutional – Commercial and Industrial • Energy Services – PES develops, installs, operates, and maintains energy efficiency, renewable energy, and combined heat and power and thermal projects •
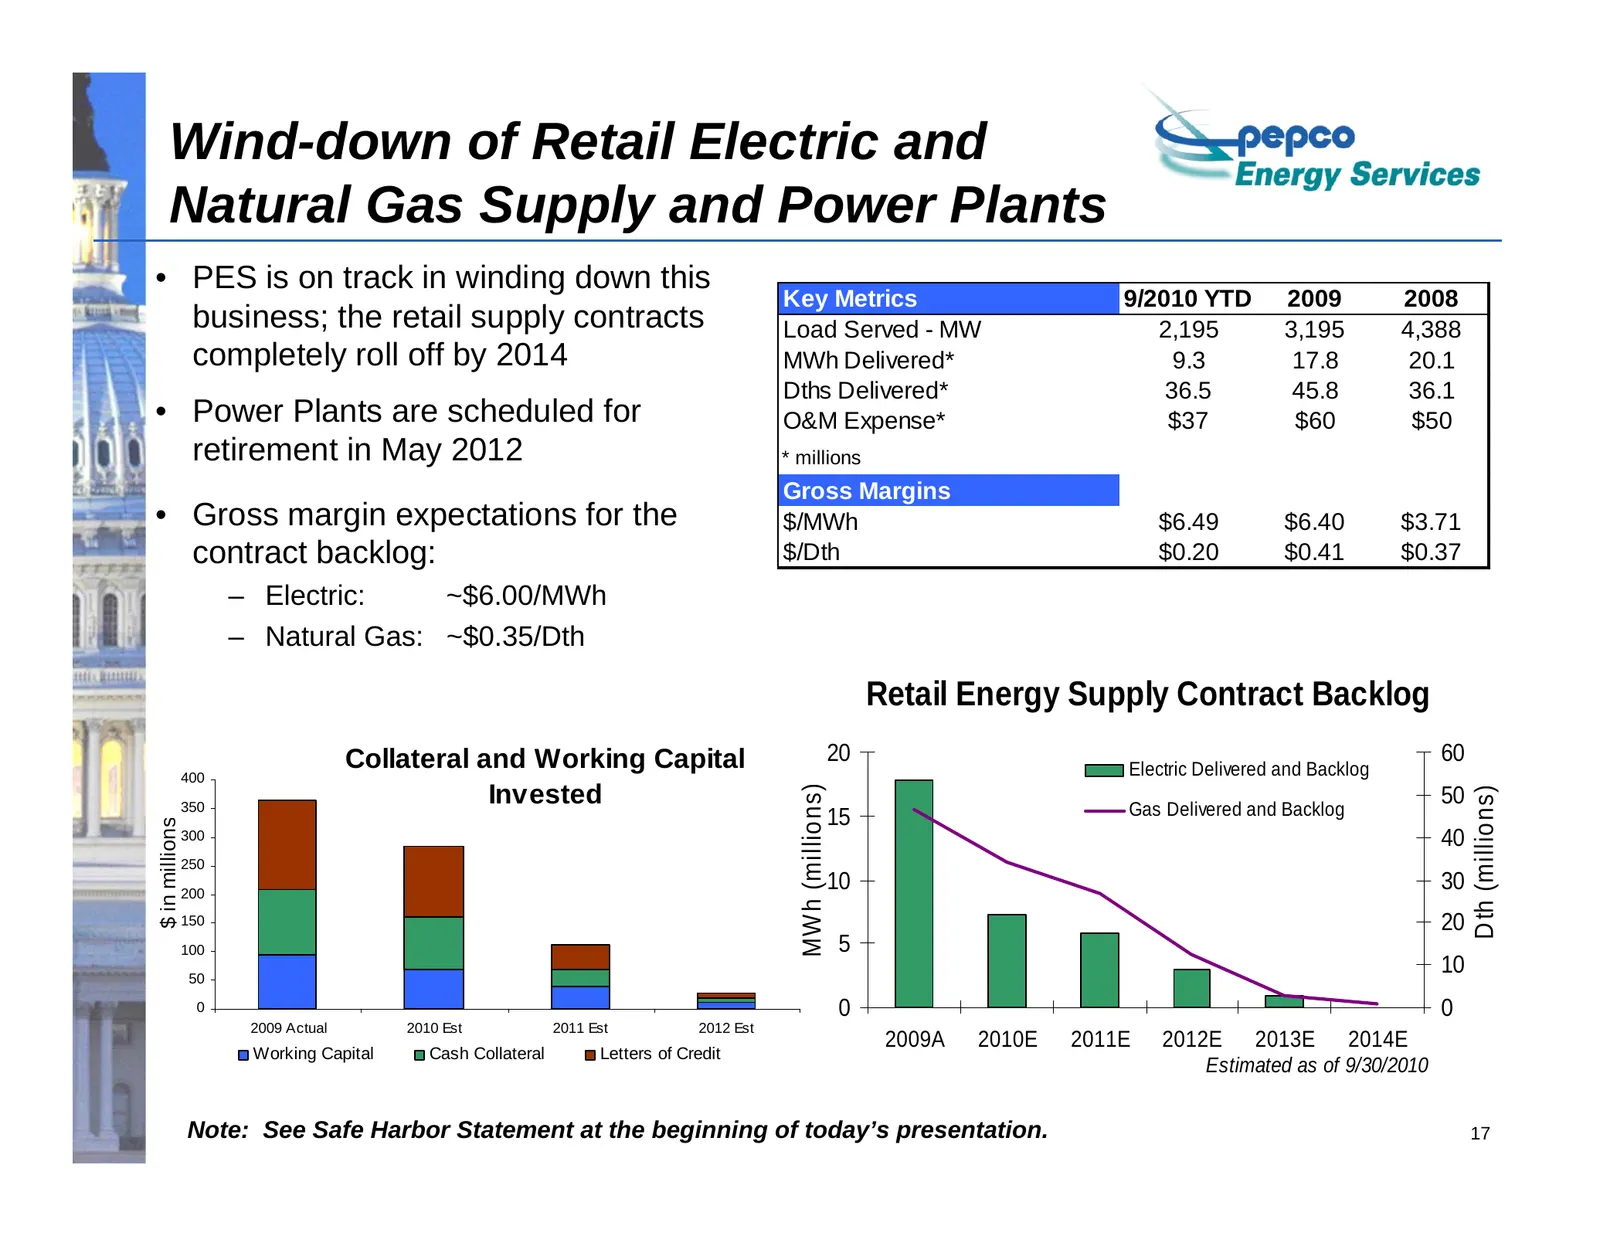
Slide 18: Wind-down of Retail Electric and Natural Gas Supply and Power Plants
Wind-down of Retail Electric and Natural Gas Supply and Power Plants • PES is on track in winding down this Key Metrics 9/2010 YTD 2009 2008 business; the retail supply contracts Load Served - MW 2,195 3,195 4,388 completely roll off by 2014 MWh Delivered* 9.3 17.8 20.1 Dths Delivered* 36.5 45.8 36.
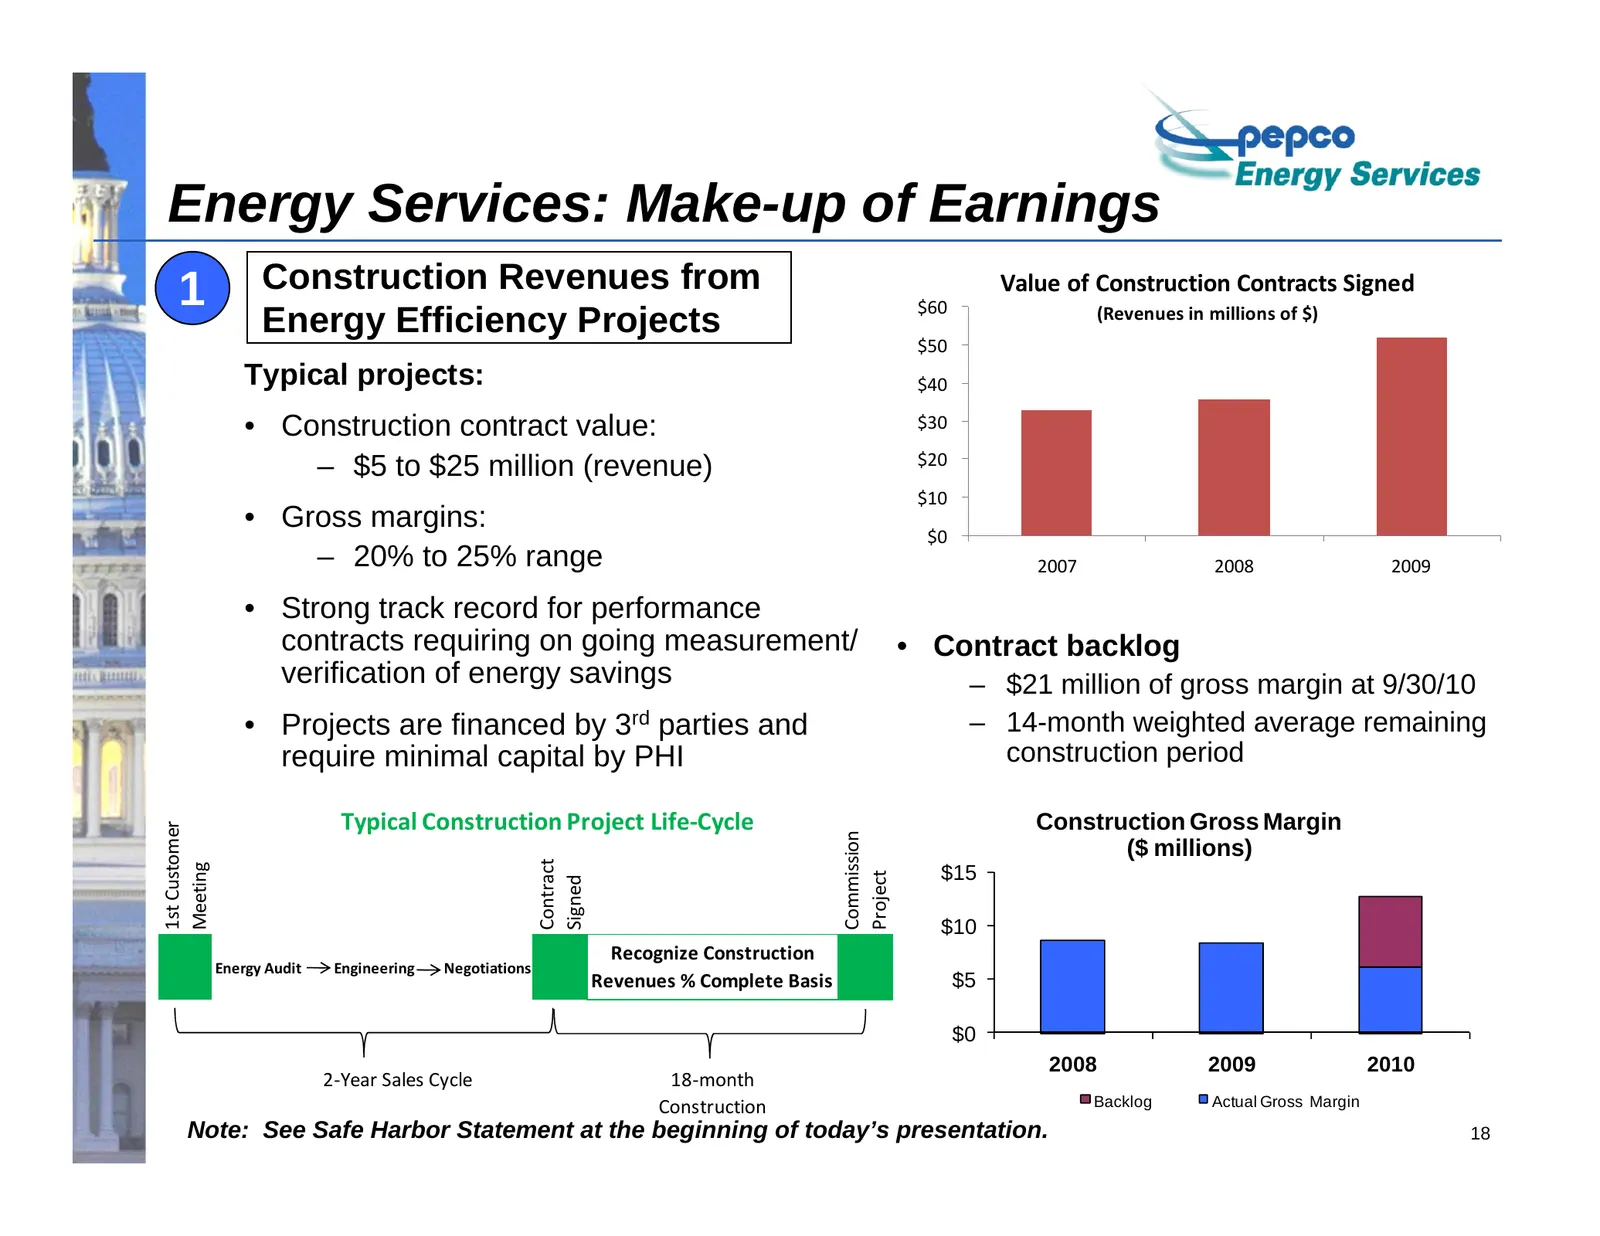
Slide 19: Energy Services: Make-up of Earnings
Energy Services: Make-up of Earnings 1 Construction Revenues from Value of Construction Contracts Signed $60 (Revenues in millions of $) Energy Efficiency Projects $50 Typical projects: $40 • Construction contract value: $30 – $5 to $25 million (revenue) $20 $10 • Gross margins: $0 – 20% to 25% rang
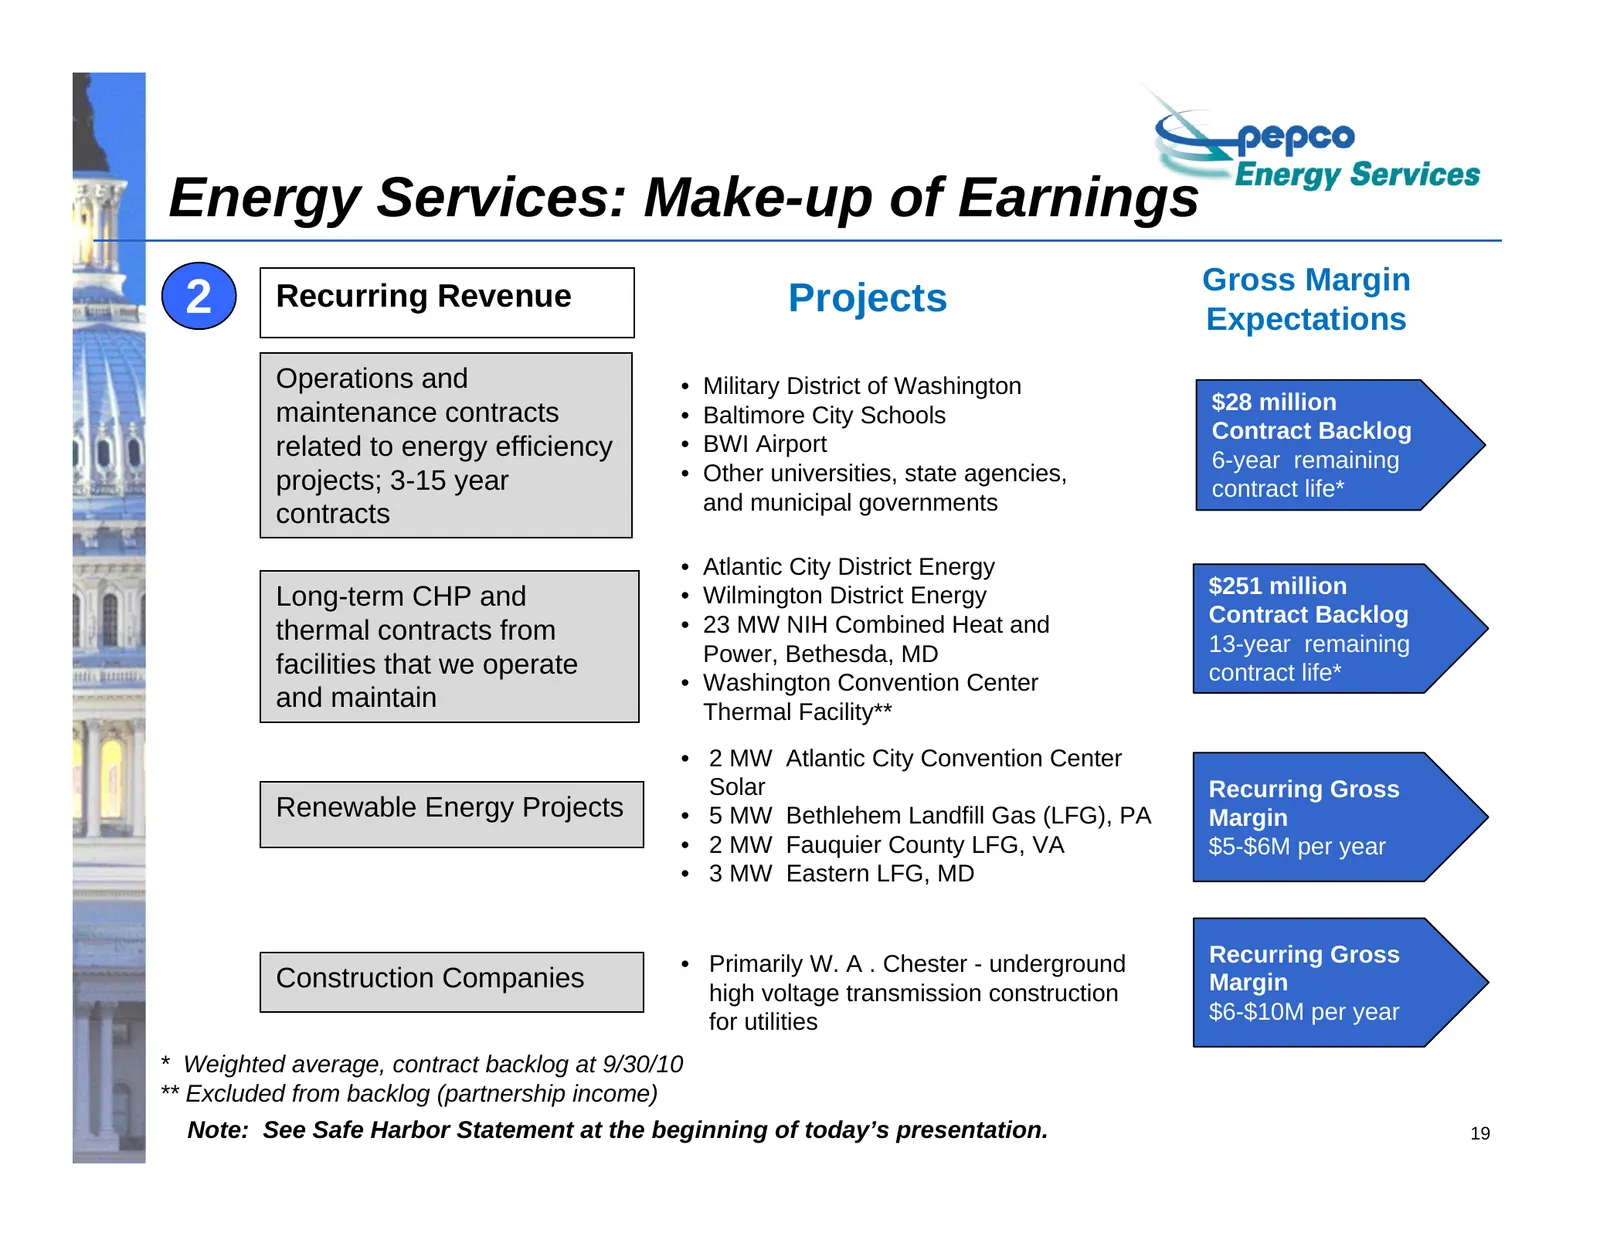
Slide 20: Energy Services: Make-up of Earnings
Energy Services: Make-up of Earnings Gross Margin 2 Recurring Revenue Projects Expectations Operations and • Military District of Washington maintenance contracts $28 million • Baltimore City Schools Contract Backlog related to energy efficiency • BWI Airport 6-year remaining projects; 3-15 year • O
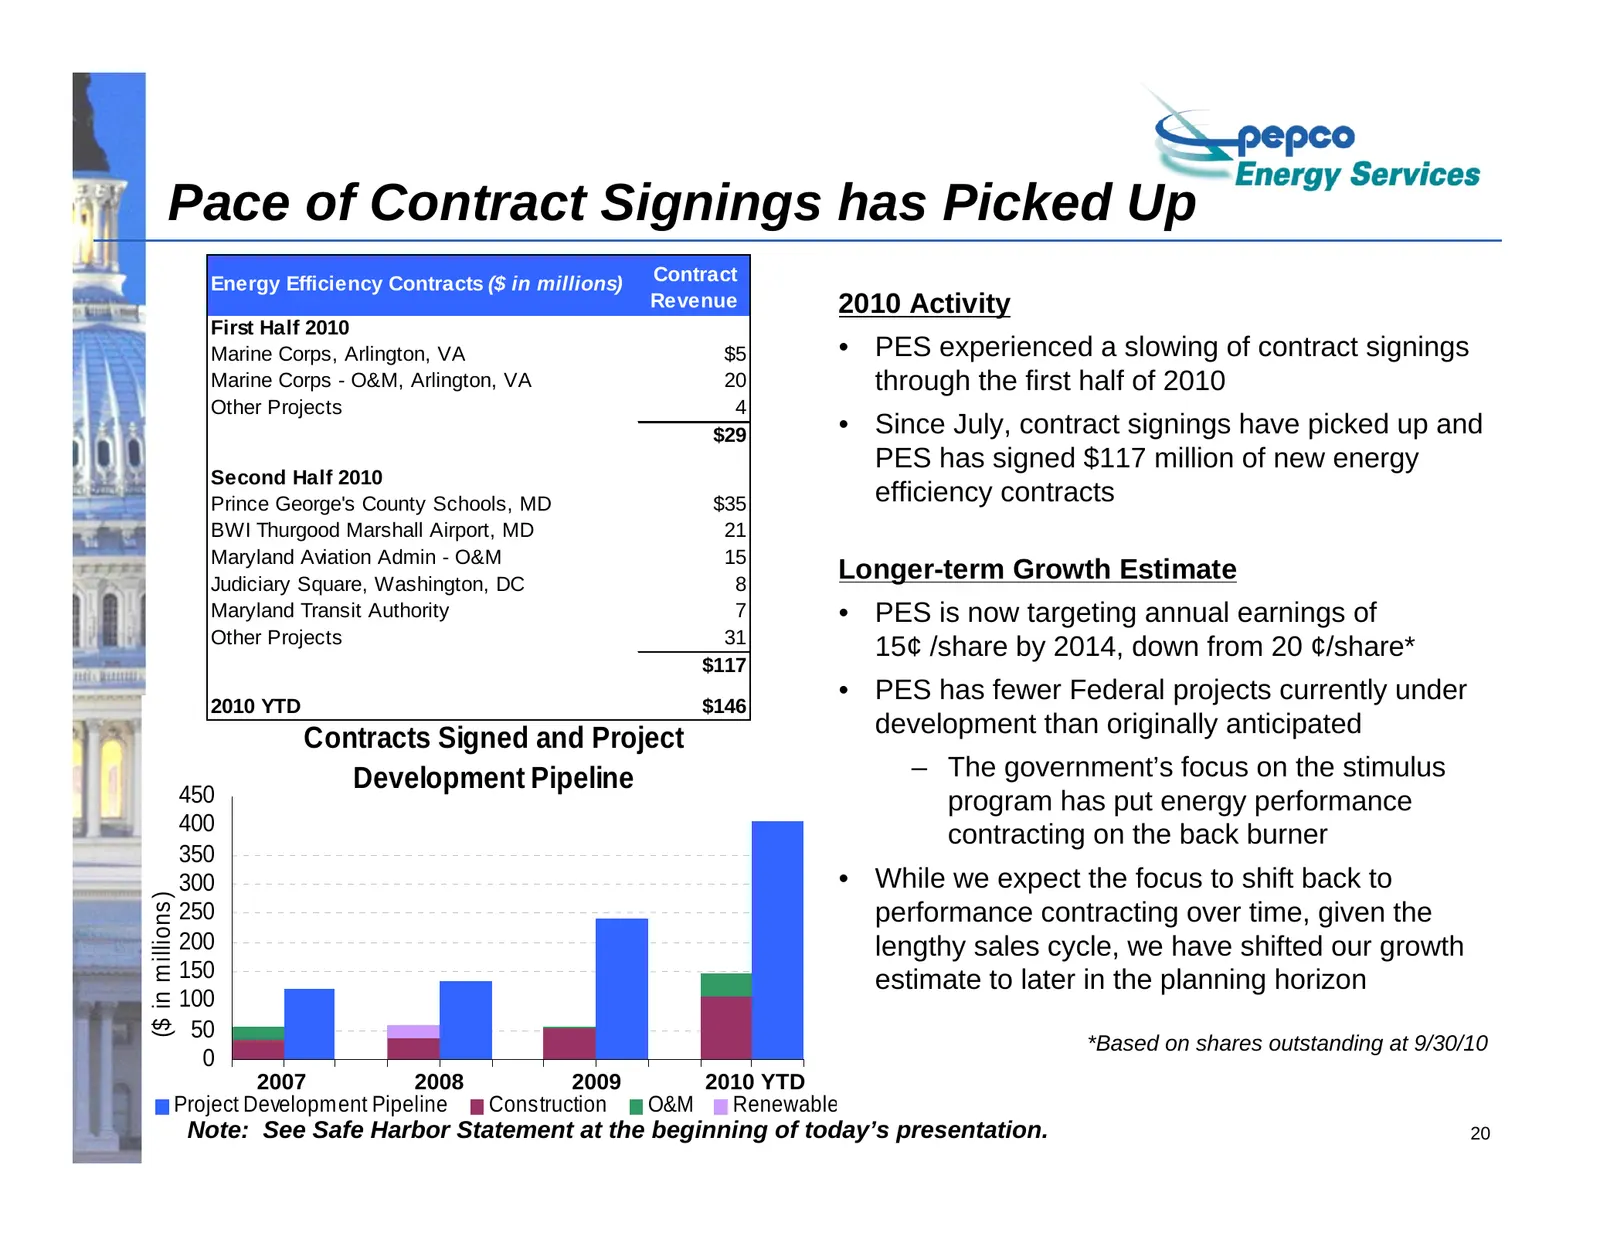
Slide 21: Pace of Contract Signings has Picked Up
Pace of Contract Signings has Picked Up Energy Efficiency Contracts ($ in millions) Contract Revenue 2010 Activity First Half 2010 Marine Corps, Arlington, VA $5 • PES experienced a slowing of contract signings Marine Corps - O&M, Arlington, VA 20 through the first half of 2010 Other Projects 4 $29
Slide 22: BWI Thurgood Marshall Airport Project
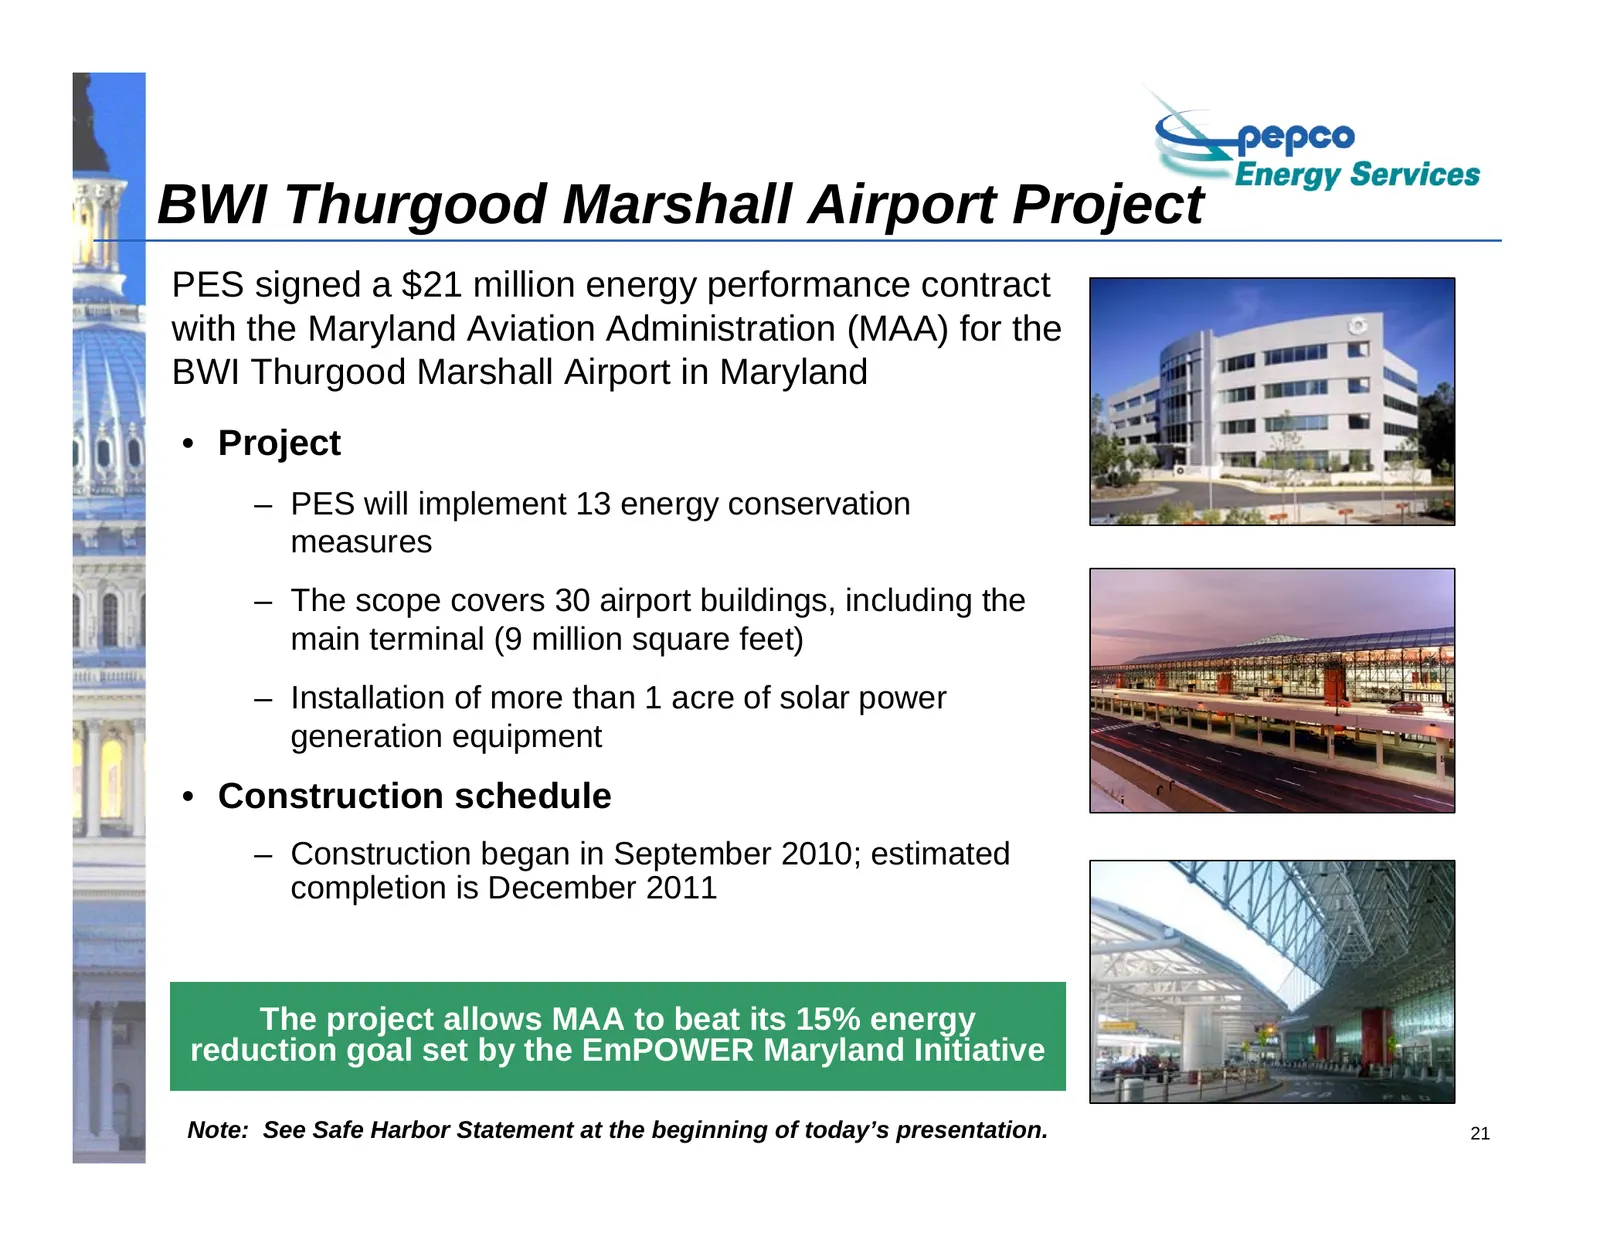
BWI Thurgood Marshall Airport Project PES signed a $21 million energy performance contract with the Maryland Aviation Administration (MAA) for the BWI Thurgood Marshall Airport in Maryland • Project – PES will implement 13 energy conservation measures – The scope covers 30 airport buildings, includi
Slide 23: PHI Debt Refinancing
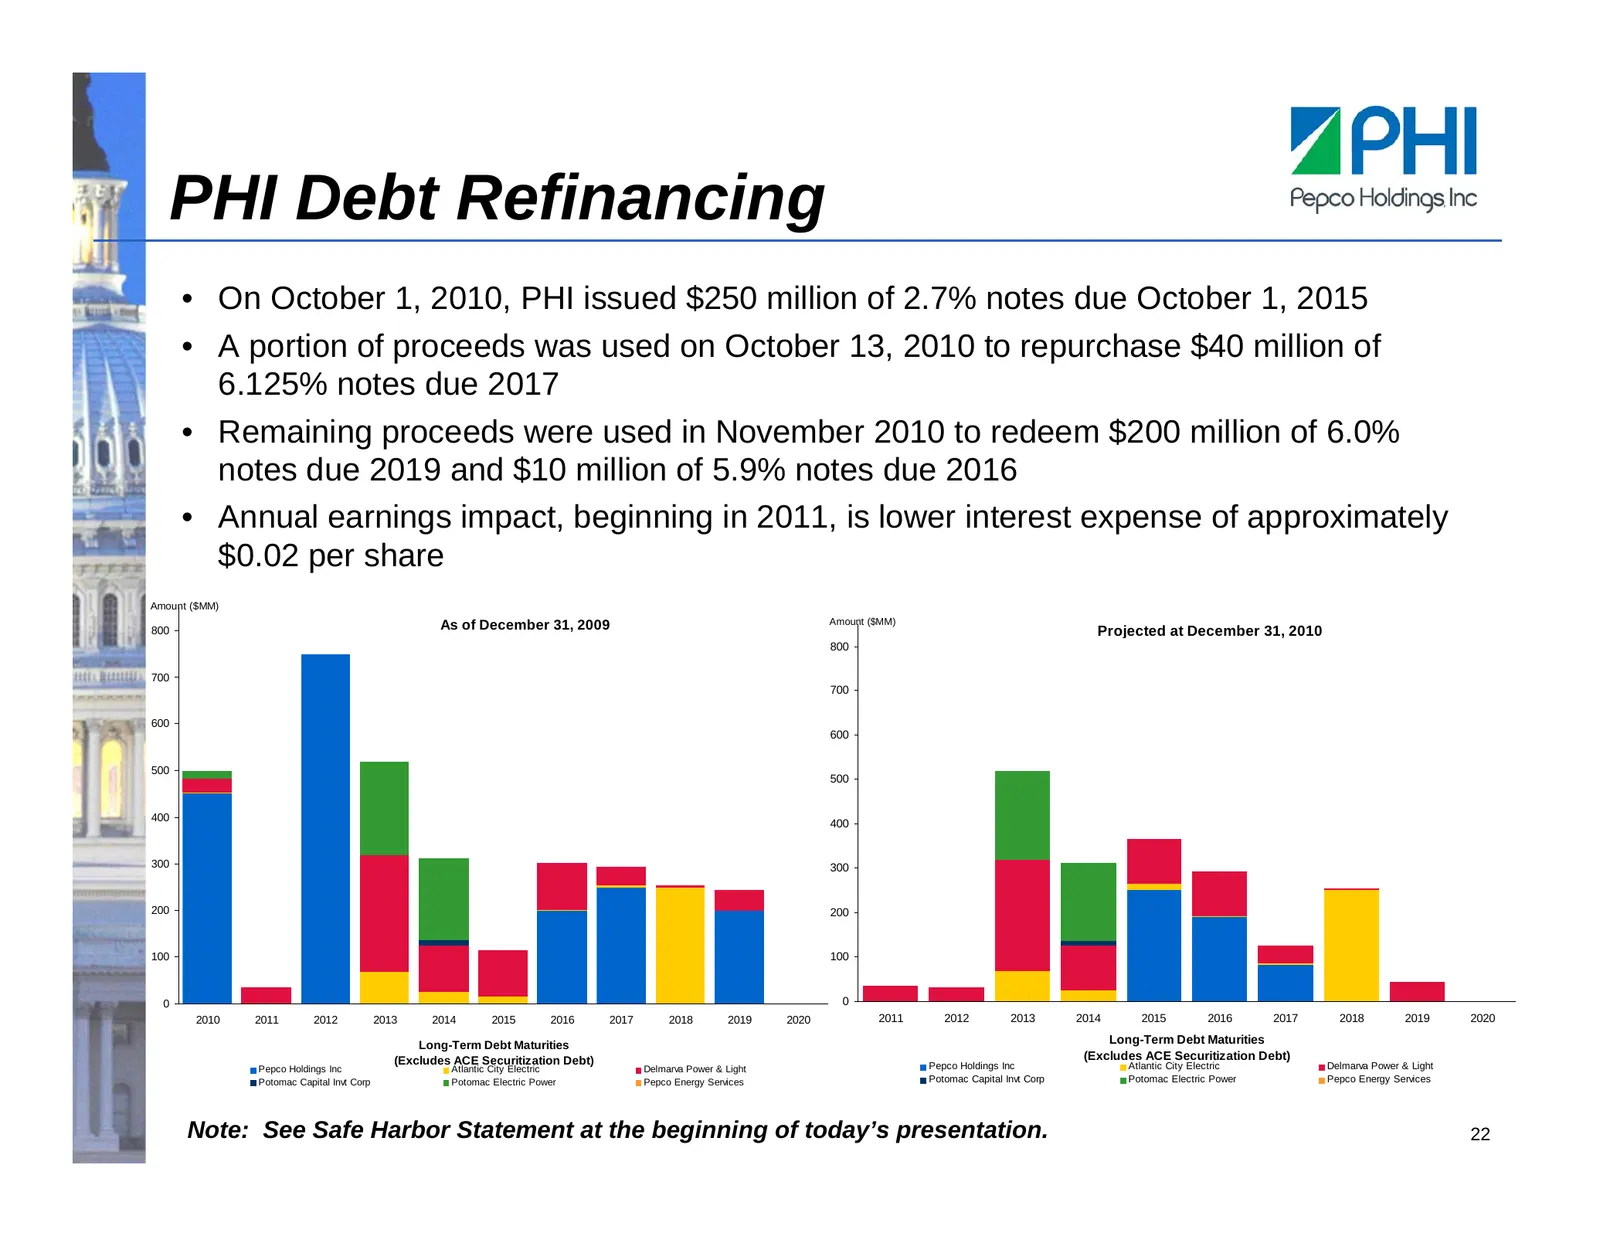
PHI Debt Refinancing • On October 1, 2010, PHI issued $250 million of 2.7% notes due October 1, 2015 • A portion of proceeds was used on October 13, 2010 to repurchase $40 million of 6.125% notes due 2017 • Remaining proceeds were used in November 2010 to redeem $200 million of 6.0% notes due 2019 a
Slide 24: Earnings Guidance and Outlook
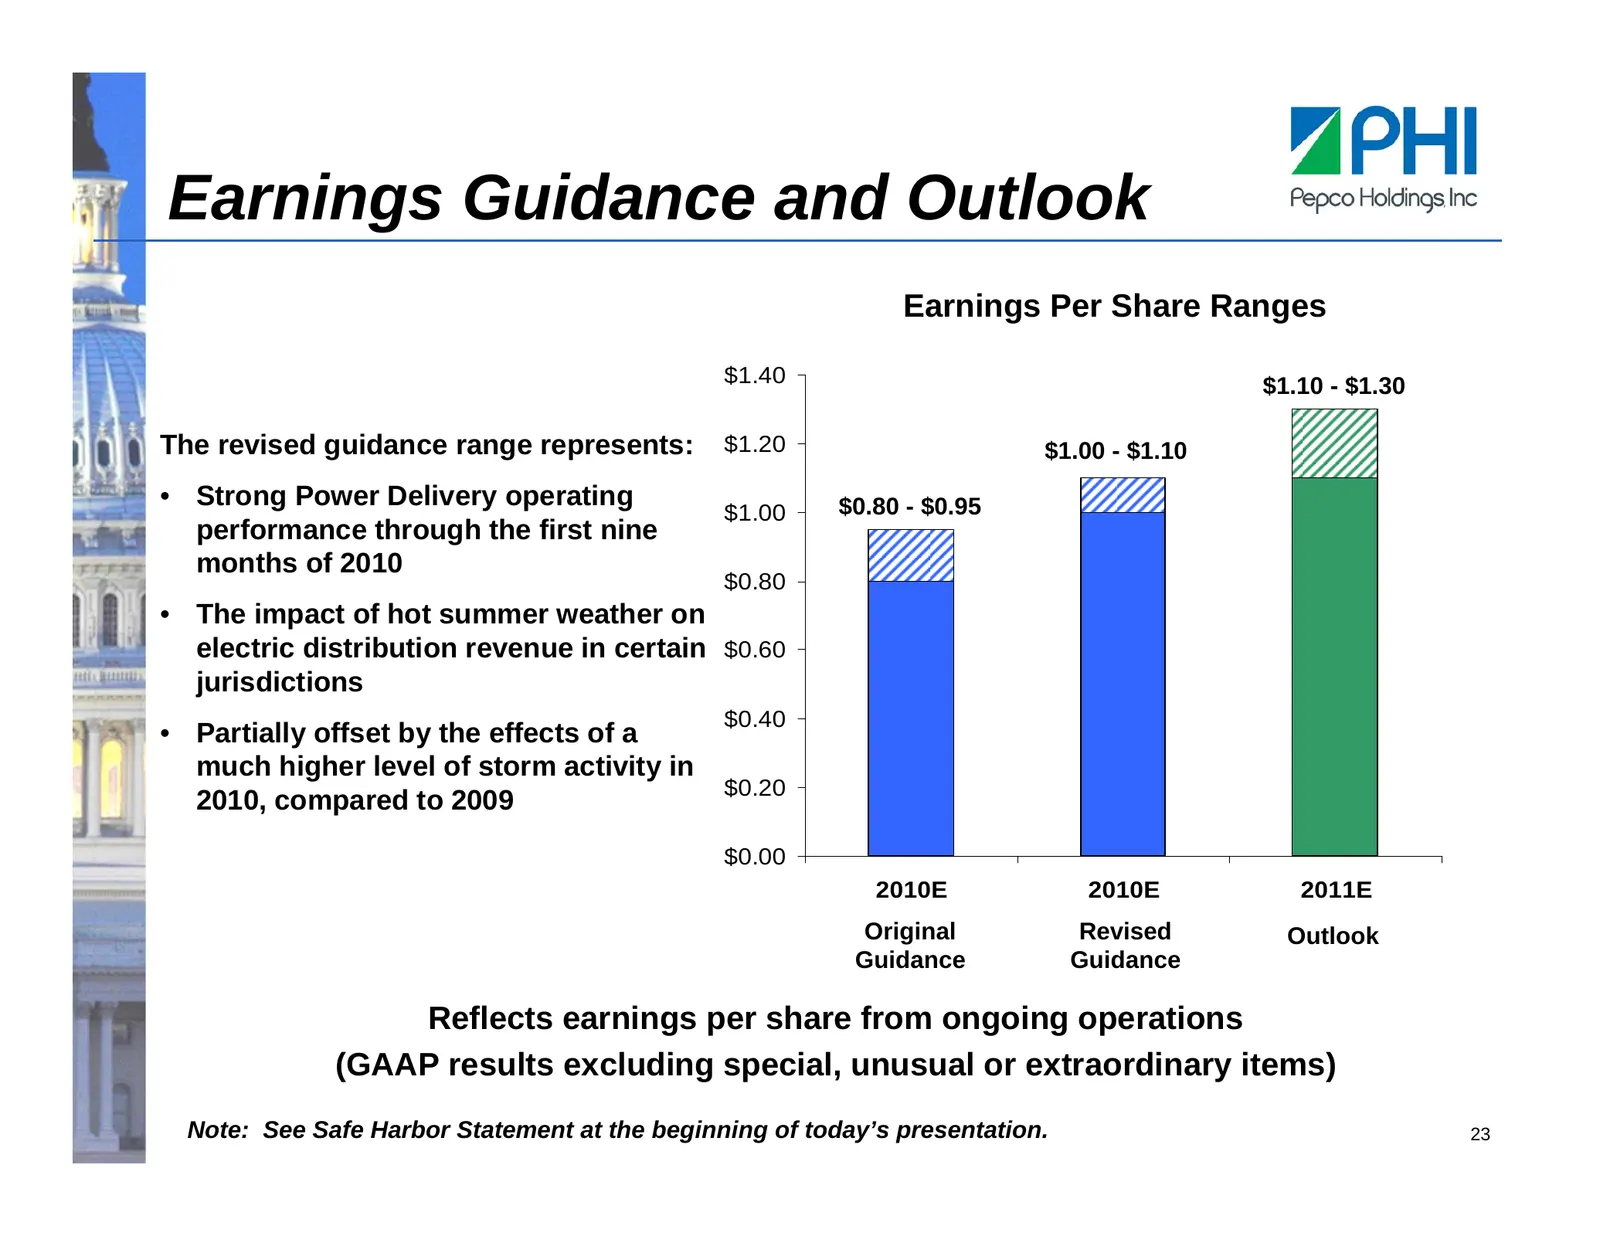
Earnings Guidance and Outlook Earnings Per Share Ranges $1.40 $1.10 - $1.30 The revised guidance range represents: $1.20 $1.00 - $1.10 • Strong Power Delivery operating $0.80 - $0.95 $1.00 performance through the first nine months of 2010 $0.80 • The impact of hot summer weather on electric distribu
Slide 25: POM Investment Case
POM Investment Case • Robust T&D growth – over $5 billion planned investment, 41% in transmission • Smart grid underway – aided by $168 million in stimulus funds • Reasonable regulatory outlook – including FERC formula rates • No equity issuance needs until at least 2012 • Commitment to the dividend
Source: SEC EDGAR · 8-K filed Dec 7, 2010
More decks from Pepco Holdings Inc
 Merger or Acquisition (August 2014)15 slides · Aug 19, 2014
 Merger or Acquisition (May 2014)44 slides · May 23, 2014
 Q1 2014 Earnings Presentation14 slides · May 7, 2014
 Williams Capital Group Midwest Utilities Seminar (April 2014)35 slides · Apr 9, 2014
 Investor Day (March 2014)109 slides · Mar 21, 2014
 Morgan Stanley Utilities Conference 201439 slides · Feb 28, 2014