Spirit Realty Capital — Q3 2021 Earnings Presentation
20 slides from Spirit Realty Capital's earnings presentation, Nov 2, 2021
Slide 1: Supplemental Financial & Operating Information Third Quarter 2021
Supplemental Financial & Operating Information third QUARTER ENDED September 30, 2021 Exhibit 99.2
Slide 2: Table of Contents
TABLE OF CONTENTS Corporate Headquarters 2727 N. Harwood St. Suite 300 Dallas, Texas 75201 Phone: 972-476-1900 www.spiritrealty.com Investor Relations 972-476-1903 [email protected] Transfer Agent American Stock Transfer & Trust Company, LLC Phone: 866-703-9065 www.amstock.com Pleas
Slide 3: Q3 2021 Highlights
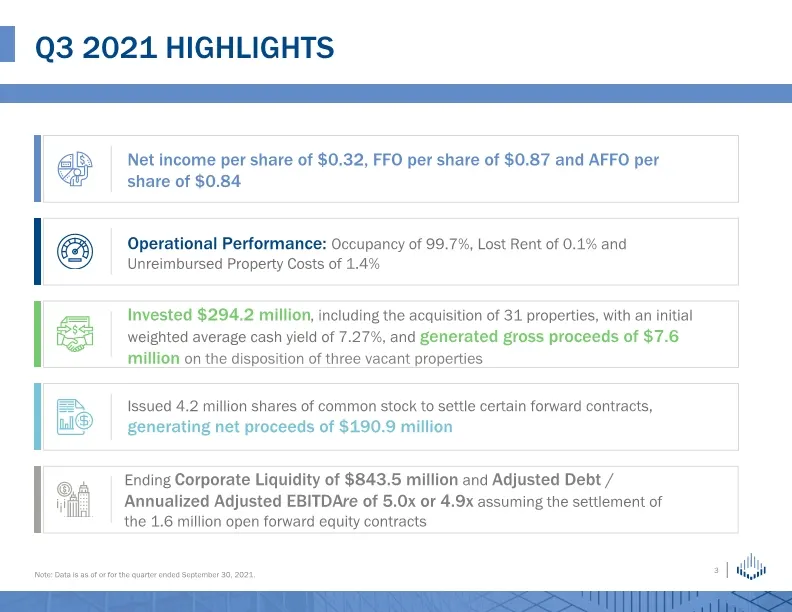
Q3 2021 highlights Net income per share of $0.32, FFO per share of $0.87 and AFFO per share of $0.84 Operational Performance: Occupancy of 99.7%, Lost Rent of 0.1% and Unreimbursed Property Costs of 1.4% Invested $294.2 million, including the acquisition of 31 properties, with an initial weighted av
Slide 4: Q3 2021 Overview
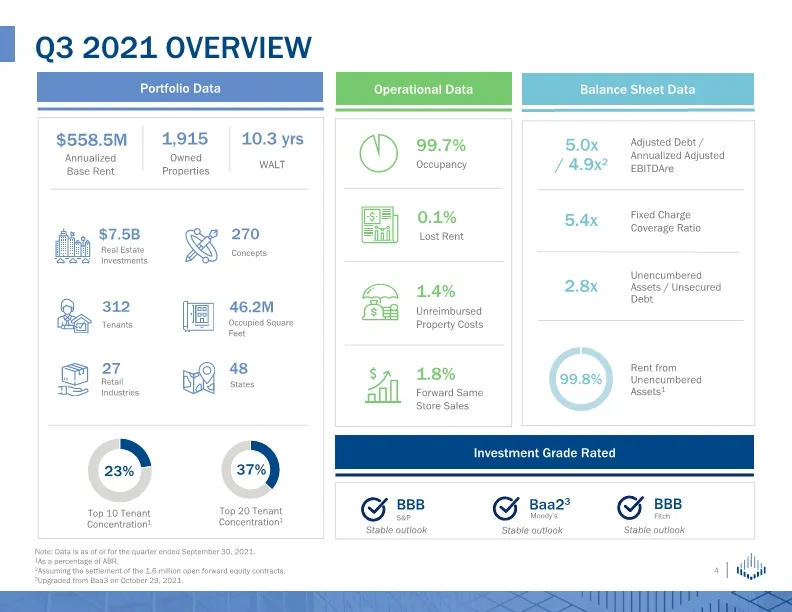
Q3 2021 Overview Portfolio Data Operational Data Balance Sheet Data $558.5M 37% Top 10 Tenant Concentration1 23% Investment Grade Rated Baa23 Moody’s Annualized Base Rent Top 20 Tenant Concentration1 5.0x / 4.9x2 Adjusted Debt / Annualized Adjusted EBITDAre 5.4x Fixed Charge Coverage Ratio Concepts
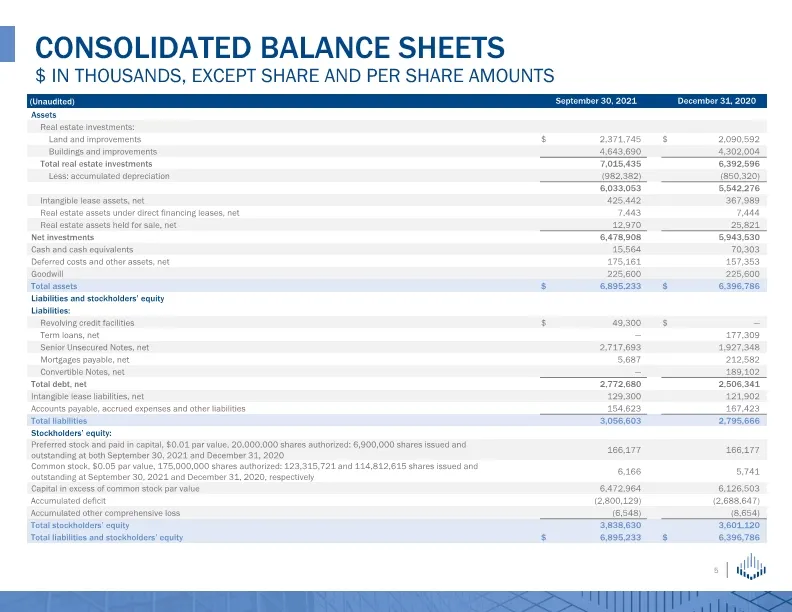
Slide 5: Consolidated Balance Sheets
CONSOLIDATED BALANCE SHEETS $ IN THOUSANDS, EXCEPT SHARE AND PER SHARE AMOUNTS
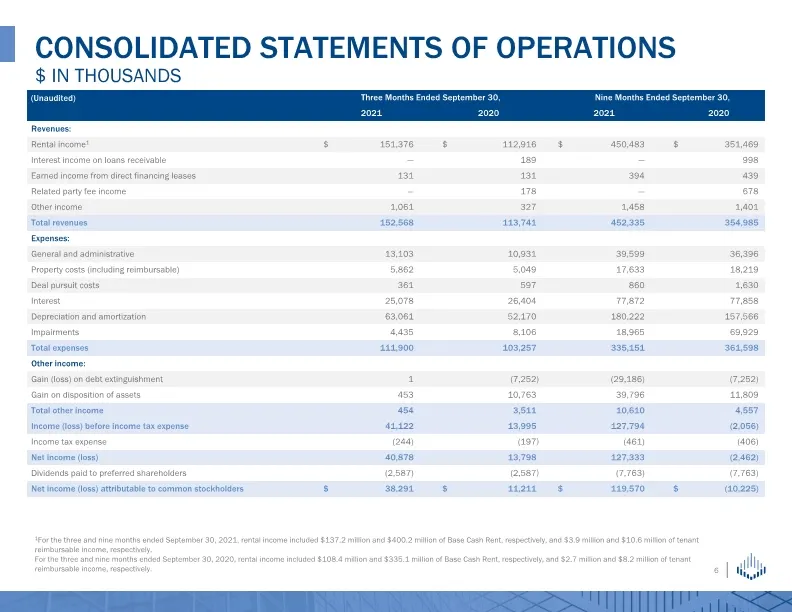
Slide 6: Consolidated Statements of Operations
CONSOLIDATED STATEMENTS OF OPERATIONS $ IN THOUSANDS 1For the three and nine months ended September 30, 2021, rental income included $137.2 million and $400.2 million of Base Cash Rent, respectively, and $3.9 million and $10.6 million of tenant reimbursable income, respectively. For the three and ni
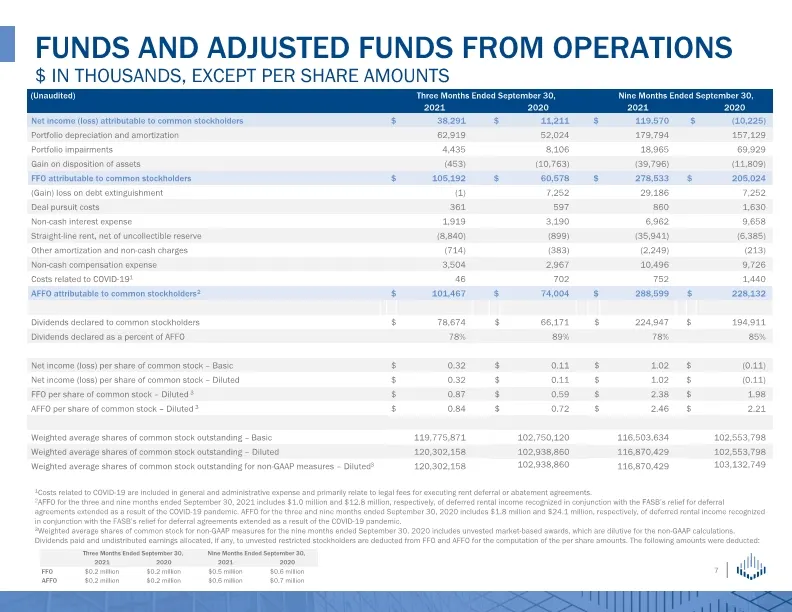
Slide 7: FFO and AFFO Reconciliation
1Costs related to COVID-19 are included in general and administrative expense and primarily relate to legal fees for executing rent deferral or abatement agreements. 2AFFO for the three and nine months ended September 30, 2021 includes $1.0 million and $12.8 million, respectively, of deferred rental
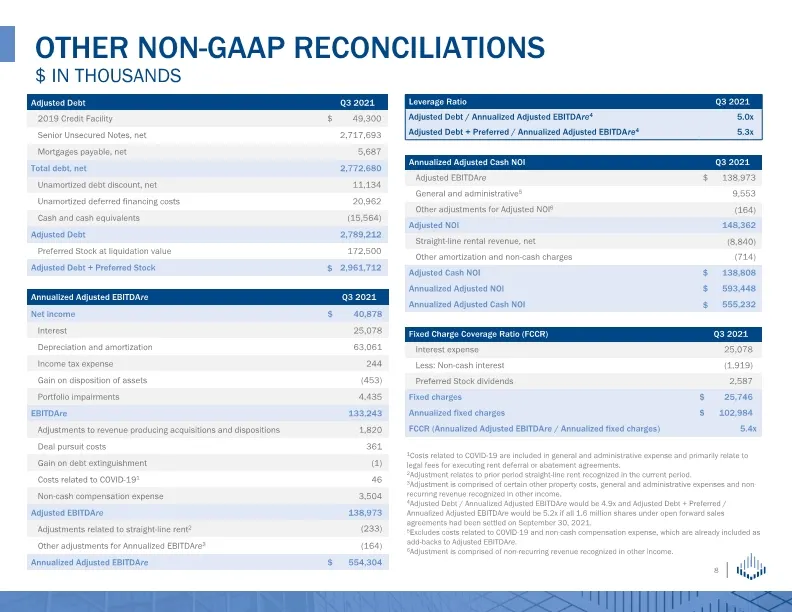
Slide 8: Other Non-GAAP Reconciliations
Other NON-GAAP RECONCILIATIONS $ in thousands 1Costs related to COVID-19 are included in general and administrative expense and primarily relate to legal fees for executing rent deferral or abatement agreements. 2Adjustment relates to prior period straight-line rent recognized in the current period.
Slide 9: Debt Summary and Market Capitalization
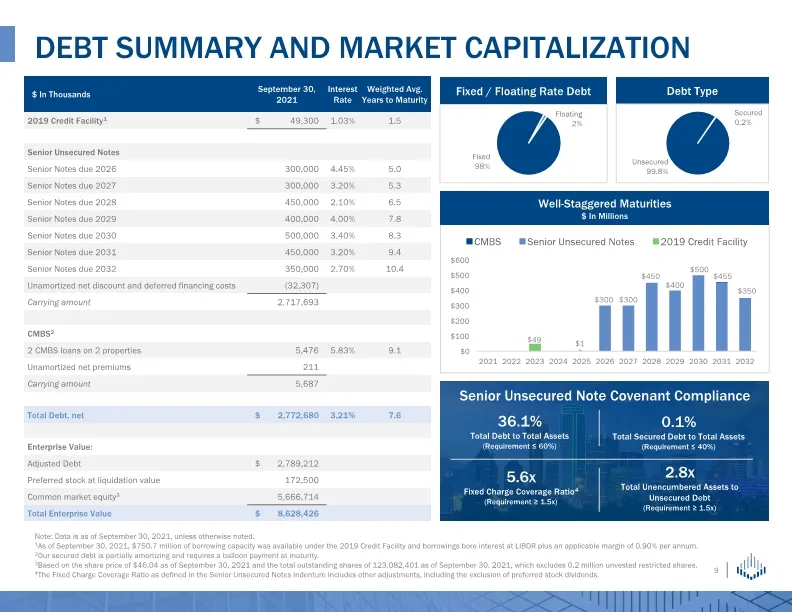
Debt Summary and Market Capitalization Note: Data is as of September 30, 2021, unless otherwise noted. 1As of September 30, 2021, $750.7 million of borrowing capacity was available under the 2019 Credit Facility and borrowings bore interest at LIBOR plus an applicable margin of 0.90% per annum. 2Our
Slide 10: Net Asset Value (NAV) Components
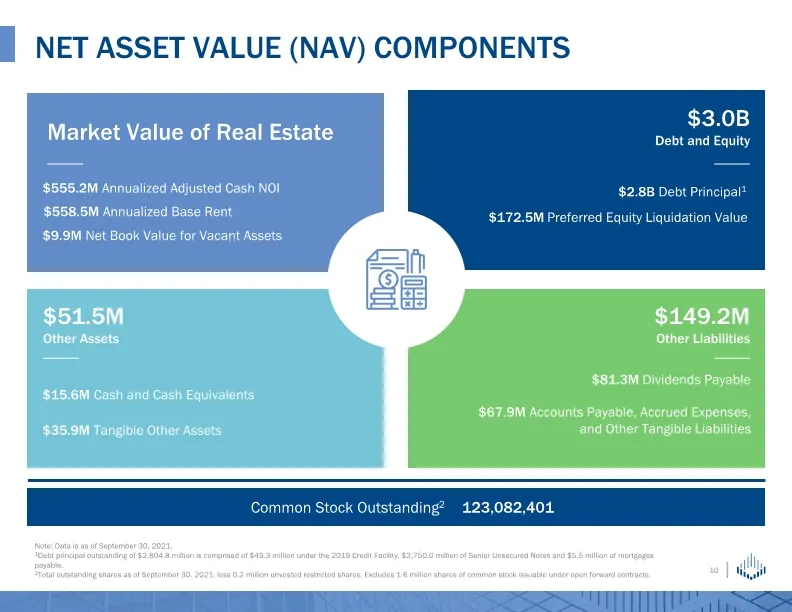
Net Asset Value (NAV) Components Market Value of Real Estate $3.0B Debt and Equity $51.5M Other Assets $149.2M Other Liabilities $558.5M Annualized Base Rent $9.9M Net Book Value for Vacant Assets $2.8B Debt Principal1 $172.5M Preferred Equity Liquidation Value $15.6M Cash and Cash Equivalents $35.9
Slide 11: Net Investment Activity
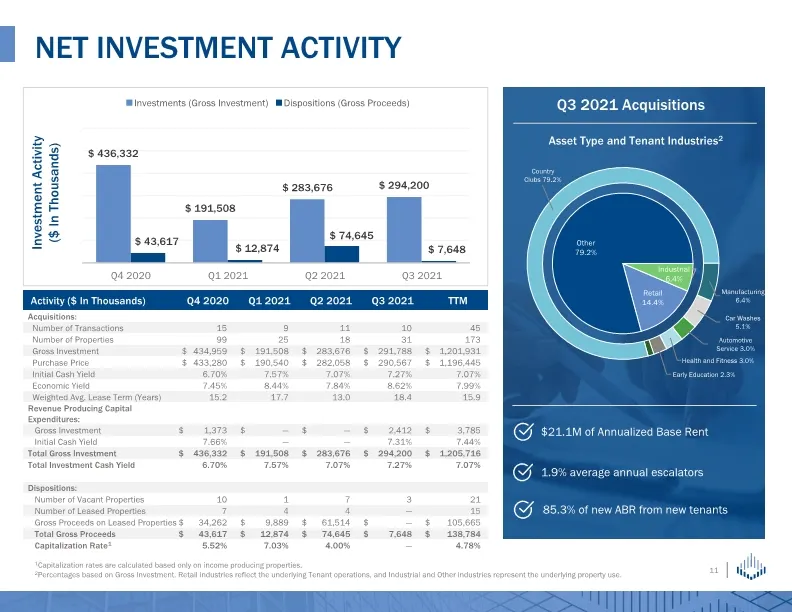
NET INVESTMENT ACTIVITY Asset Type and Tenant Industries2 1Capitalization rates are calculated based only on income producing properties. 2Percentages based on Gross Investment. Retail industries reflect the underlying Tenant operations, and Industrial and Other industries represent the underlying p
Slide 12: Top Tenancy and Portfolio Mix
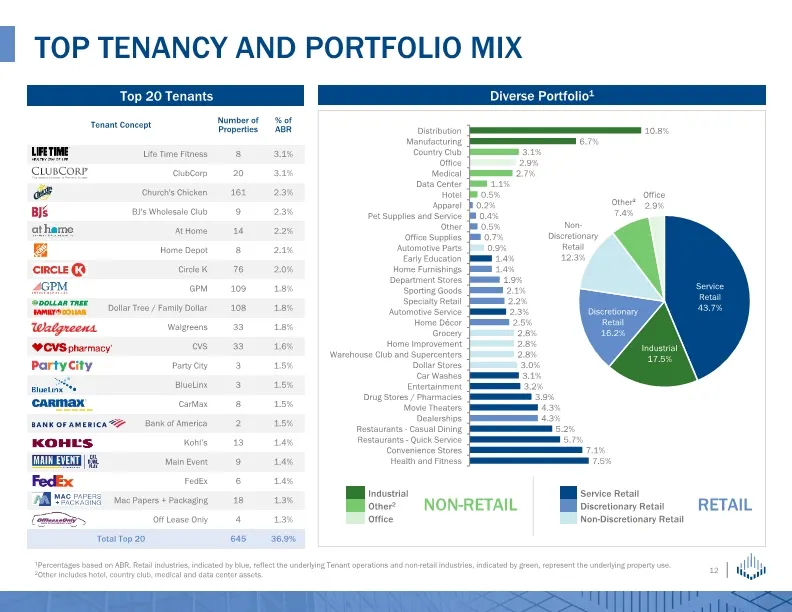
Top Tenancy and Portfolio Mix 1Percentages based on ABR. Retail industries, indicated by blue, reflect the underlying Tenant operations and non-retail industries, indicated by green, represent the underlying property use. 2Other includes hotel, country club, medical and data center assets. Diverse P
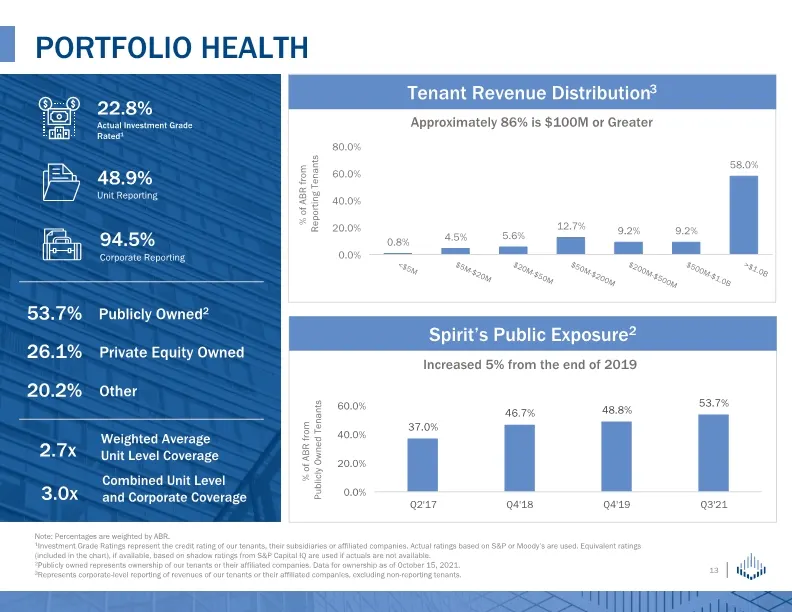
Slide 13: Portfolio Health
Portfolio Health % of ABR from Reporting Tenants Note: Percentages are weighted by ABR. 1Investment Grade Ratings represent the credit rating of our tenants, their subsidiaries or affiliated companies. Actual ratings based on S&P or Moody’s are used. Equivalent ratings (included in the chart), if av
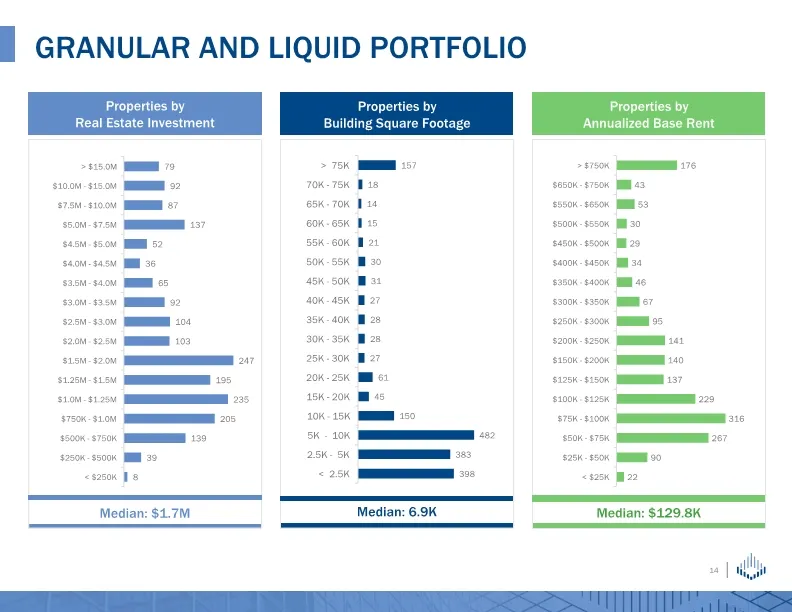
Slide 14: Granular and Liquid Portfolio
Granular and Liquid Portfolio
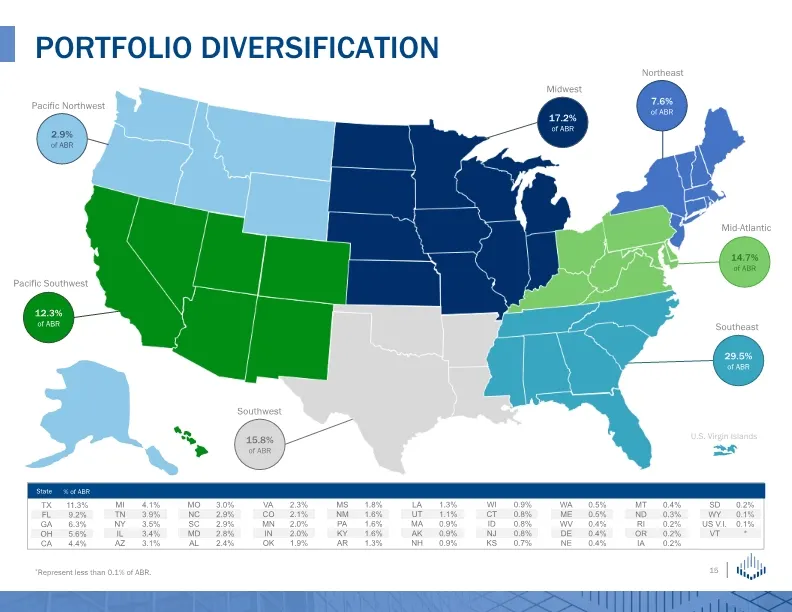
Slide 15: Portfolio Diversification
PORTFOLIO DIVERSIFICATION *Represent less than 0.1% of ABR. % of ABR State Southeast Mid-Atlantic Pacific Southwest Pacific Northwest 15.8% of ABR Southwest Midwest Northeast 7.6% of ABR 29.5% of ABR 14.7% of ABR 12.3% of ABR 2.9% of ABR 17.2% of ABR U.S. Virgin Islands
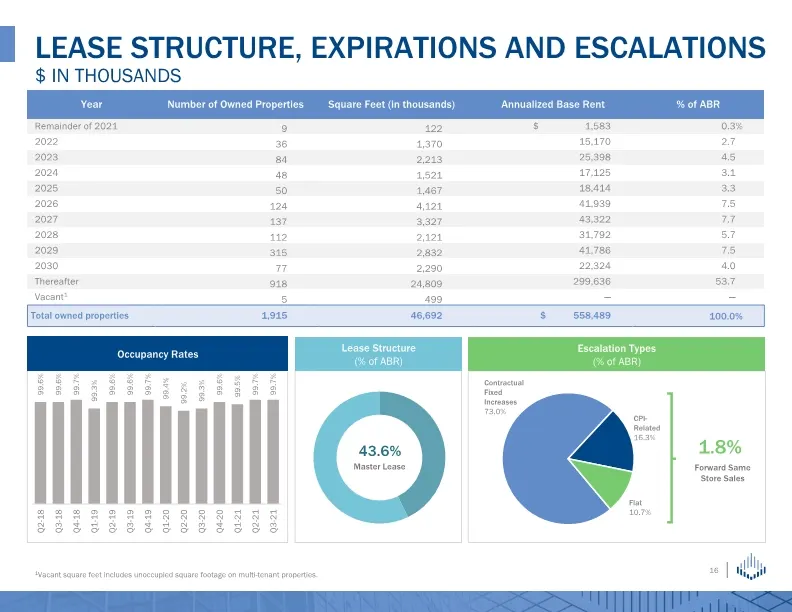
Slide 16: Lease Structure, Expirations and Escalations
LEASE STRUCTURE, EXPIRATIONS AND ESCALATIONS $ in thousands 1.8% Forward Same Store Sales Occupancy Rates Lease Structure (% of ABR) 43.6% Master Lease Escalation Types (% of ABR) 1Vacant square feet includes unoccupied square footage on multi-tenant properties.
Slide 17: Appendix
Appendix
Slide 18: Non-GAAP Definitions and Explanations
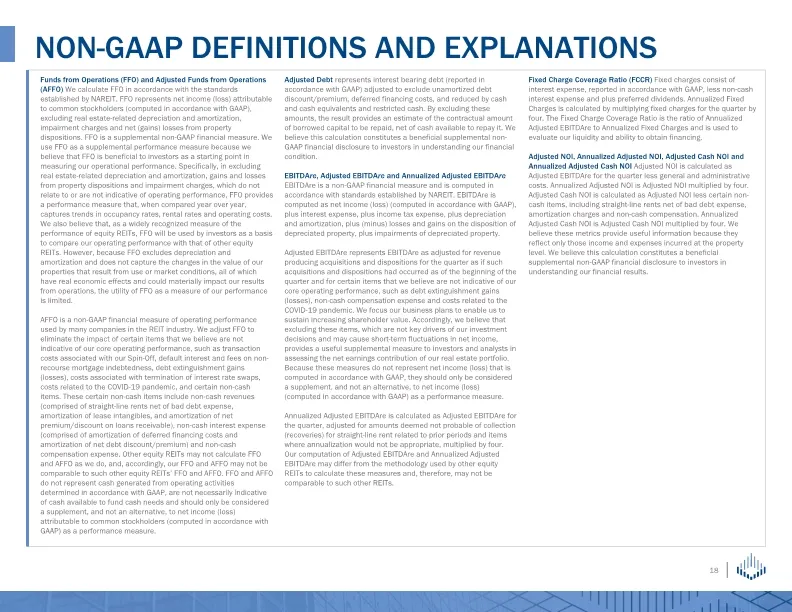
NON-GAAP DEFINITIONS AND EXPLANATIONS
Slide 19: Other Definitions and Explanations
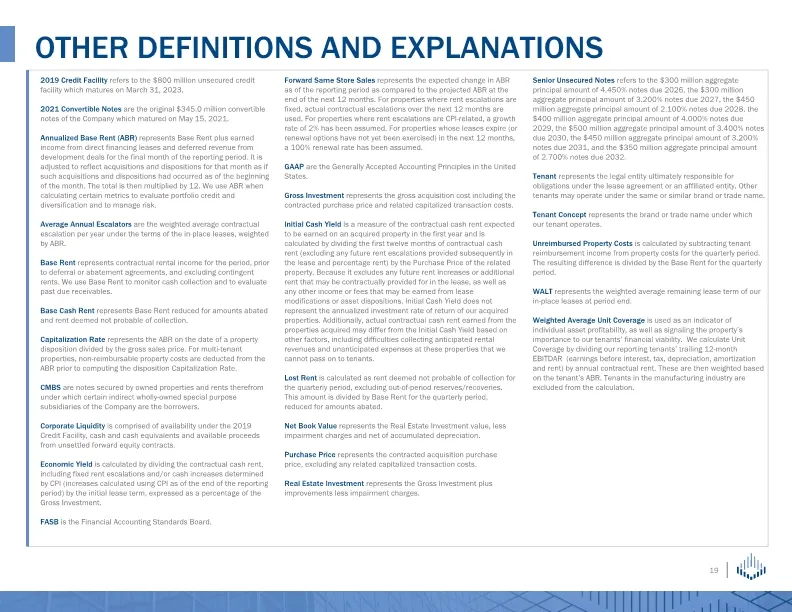
OTHER DEFINITIONS AND EXPLANATIONS
Slide 20: Forward-Looking Statements and Risk Factors
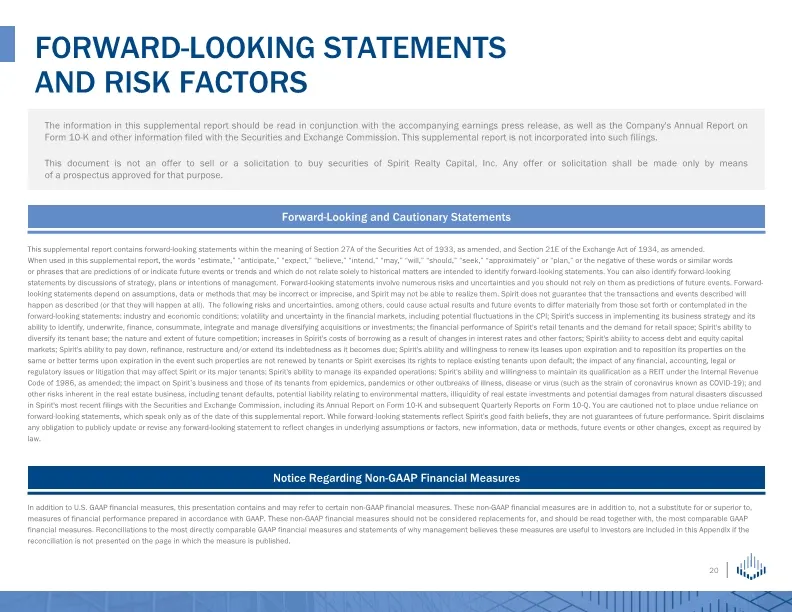
FORWARD-LOOKING STATEMENTS AND RISK FACTORS The information in this supplemental report should be read in conjunction with the accompanying earnings press release, as well as the Company's Annual Report on Form 10-K and other information filed with the Securities and Exchange Commission. This supple
Source: SEC EDGAR · 8-K filed Nov 2, 2021
More decks from Spirit Realty Capital Inc
 Q3 2023 Earnings Presentation28 slides · Nov 2, 2023
 Merger or Acquisition (October 2023)20 slides · Oct 30, 2023
 Q2 2023 Earnings Presentation26 slides · Aug 7, 2023
 Q2 2023 Earnings Presentation26 slides · August 2023
 Q1 2023 Earnings Presentation27 slides · May 3, 2023
 Q4 2022 Earnings Presentation31 slides · Feb 28, 2023