Huttig Building Products — Investor Presentation (September 2016)
23 slides from Huttig Building Products's investor presentation, Sep 13, 2016
Slide 1: Huttig Building Products Investor Presentation Fall 2016
Huttig Building Products Nasdaq: HBP Investor Presentation Fall 2016 Exhibit 99.1
Slide 2: Safe Harbor / Forward Looking Statement
SAFE HARBOR / FORWARD LOOKING STATEMENT These presentation materials may contain forward-looking statements as defined by the U.S. Private Securities Litigation Reform Act of 1995 (“Reform Act”). Statements made in this presentation looking forward in time, including, but not limited to, statements
Slide 3: Executive Overview
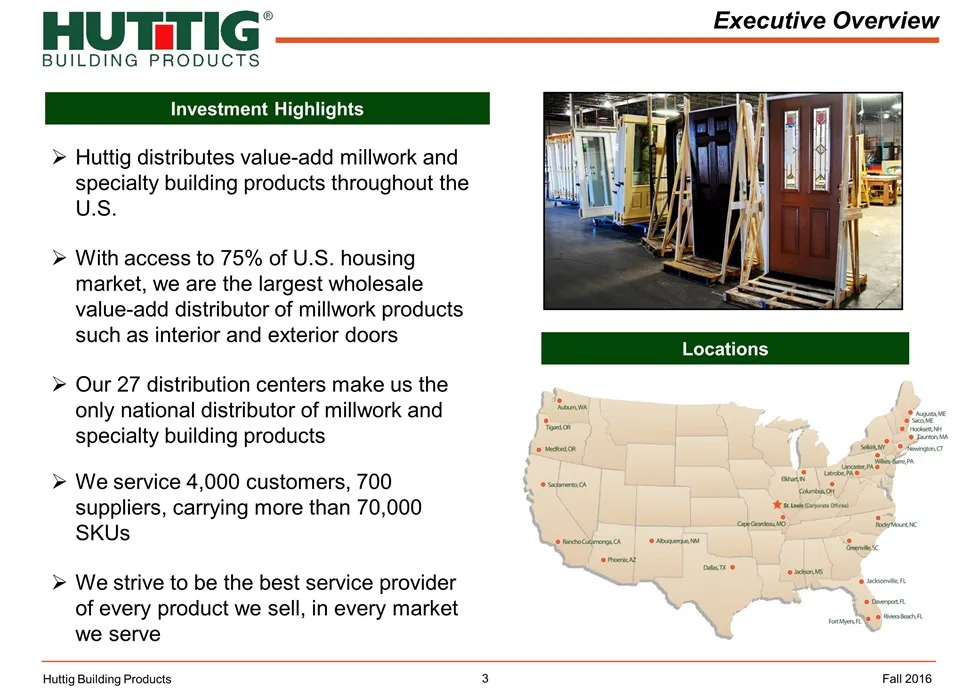
Executive Overview Huttig Building Products Locations Fall 2016 Investment Highlights Huttig distributes value-add millwork and specialty building products throughout the U.S. With access to 75% of U.S. housing market, we are the largest wholesale value-add distributor of millwork products such as i
Slide 4: Company / Industry Overview; Value Proposition / Strategy; Financial Overview; Summary / Q&A
Company / Industry Overview Value Proposition / Strategy Overview Financial Overview Summary / Q&A Huttig Building Products Fall 2016
Slide 5: Company / Industry Overview
Company / Industry Overview Huttig Building Products Fall 2016
Slide 6: Growth Concentrated in Strategic Products
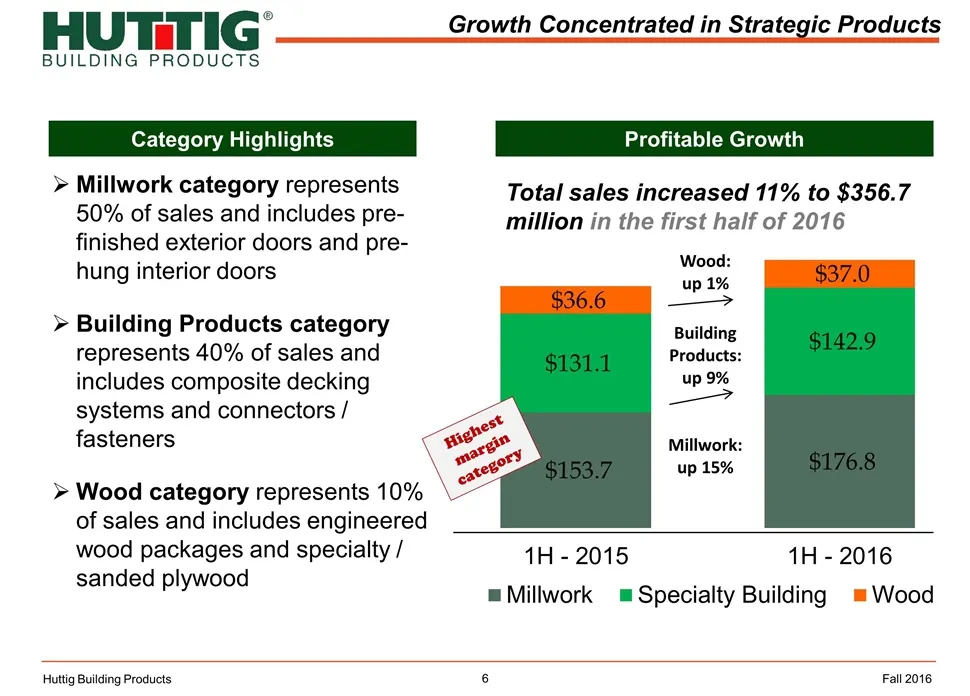
Growth Concentrated in Strategic Products Total sales increased 11% to $356.7 million in the first half of 2016 Millwork: up 15% Wood: up 1% Building Products: up 9% Category Highlights Profitable Growth Millwork category represents 50% of sales and includes pre-finished exterior doors and pre-hung
Slide 7: The Value of Wholesale Distribution
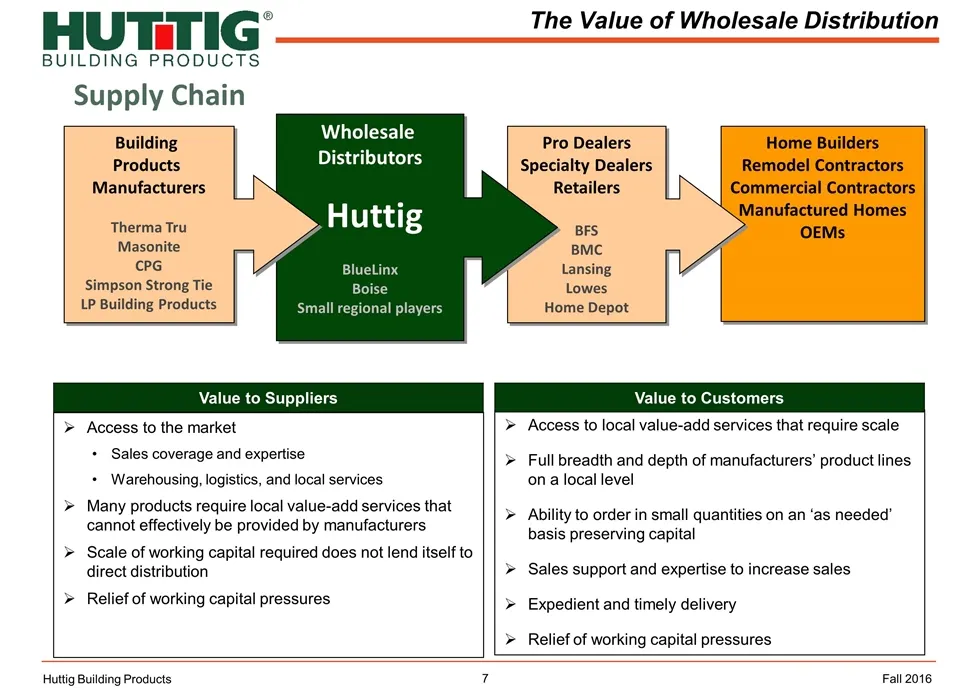
Home Builders Remodel Contractors Commercial Contractors Manufactured Homes OEMs Pro Dealers Specialty Dealers Retailers BFS BMC Lansing Lowes Home Depot Wholesale Distributors Huttig BlueLinx Boise Small regional players Building Products Manufacturers Therma Tru Masonite CPG Simpson Strong Tie LP
Slide 8: Overview of U.S. Housing Market
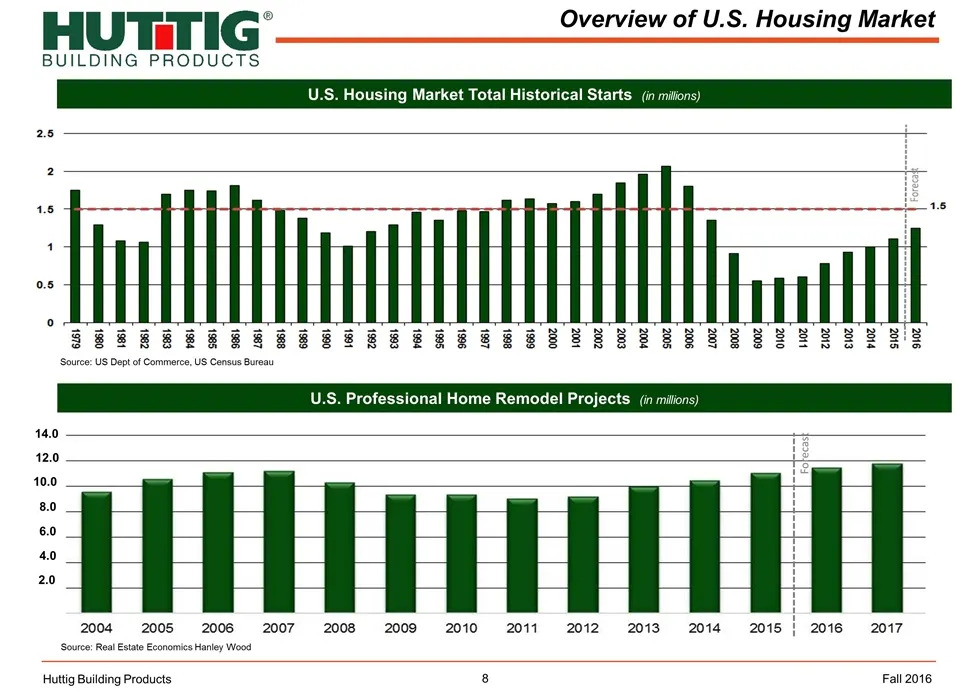
Overview of U.S. Housing Market Source: US Dept of Commerce, US Census Bureau U.S. Housing Market Total Historical Starts (in millions) Huttig Building Products U.S. Professional Home Remodel Projects (in millions) Source: Real Estate Economics Hanley Wood Forecast 14.0 12.0 10.0 8.0 4.0 6.0 2.0 Fal
Slide 9: Industry Outlook
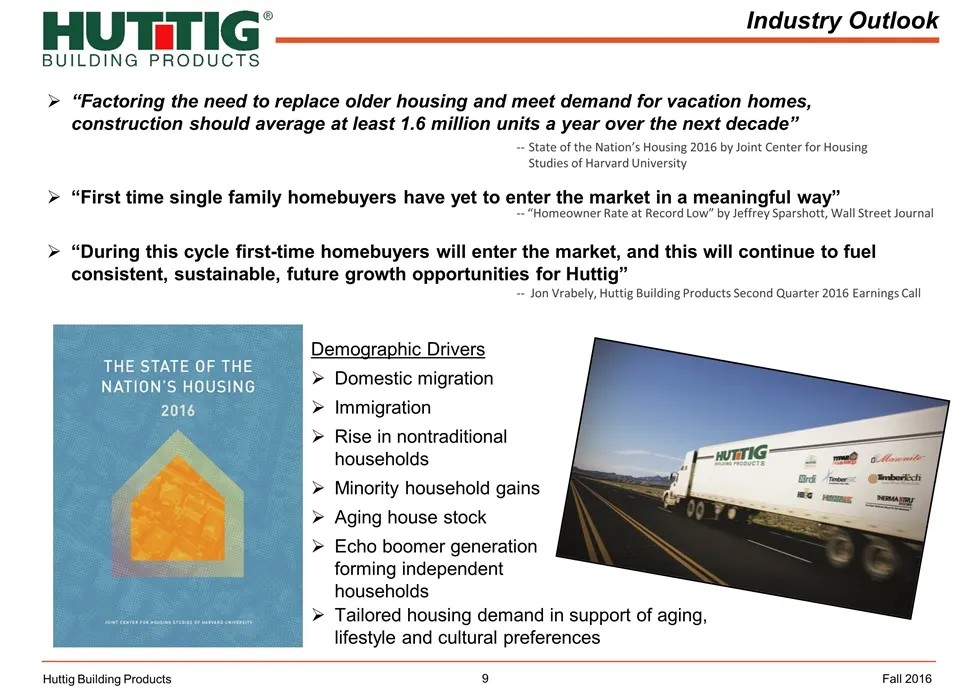
Industry Outlook Huttig Building Products “Factoring the need to replace older housing and meet demand for vacation homes, construction should average at least 1.6 million units a year over the next decade” “First time single family homebuyers have yet to enter the market in a meaningful way” “Durin
Slide 10: Value Proposition / Strategy Overview
Value Proposition / Strategy Overview Huttig Building Products Fall 2016
Slide 11: Our Value Proposition
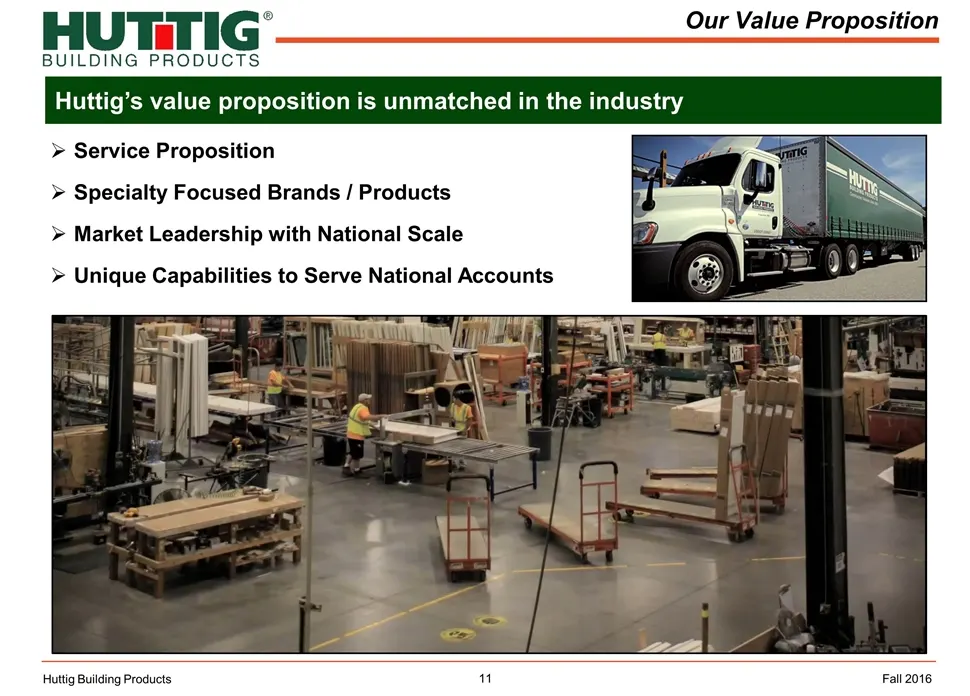
Service Proposition Specialty Focused Brands / Products Market Leadership with National Scale Unique Capabilities to Serve National Accounts Huttig’s value proposition is unmatched in the industry Our Value Proposition Huttig Building Products Fall 2016
Slide 12: Service Proposition
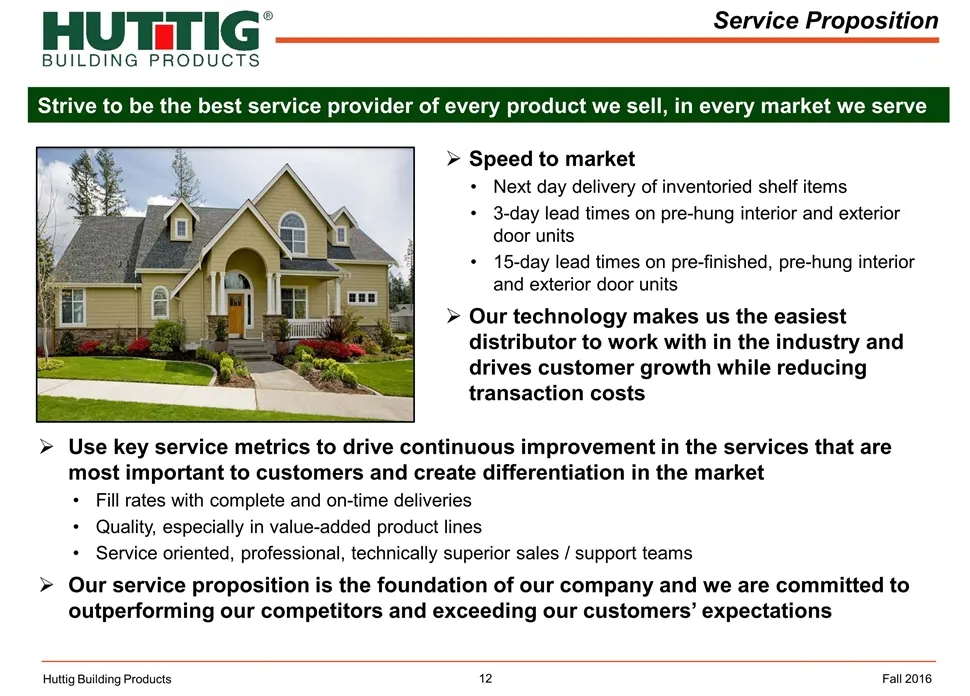
Service Proposition Huttig Building Products Fall 2016 Speed to market Next day delivery of inventoried shelf items 3-day lead times on pre-hung interior and exterior door units 15-day lead times on pre-finished, pre-hung interior and exterior door units Our technology makes us the easiest distribut
Slide 13: Specialty Focused Brand Portfolio
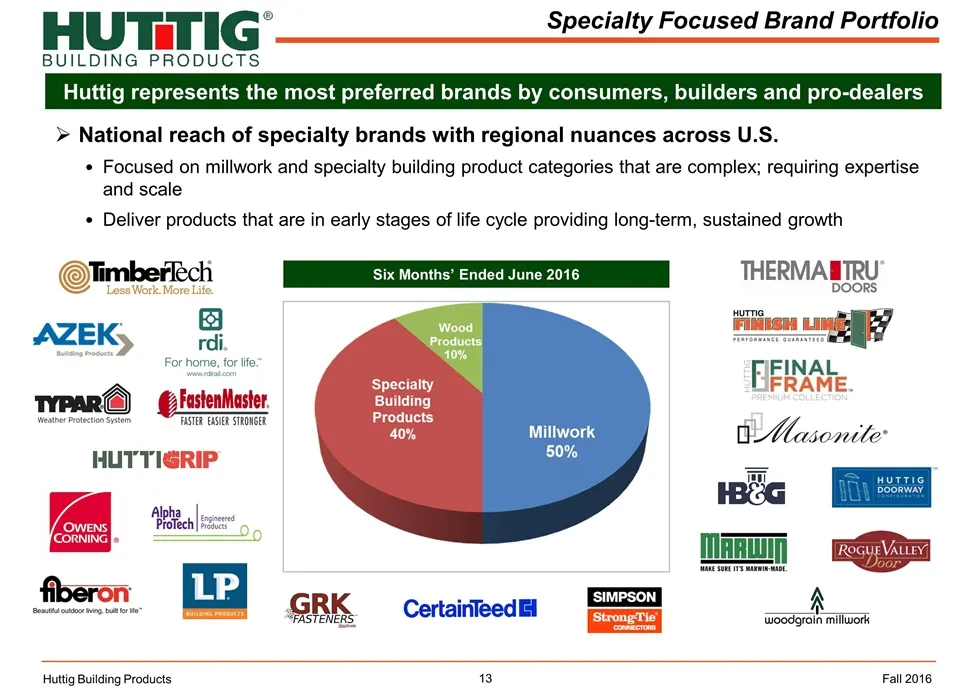
Specialty Focused Brand Portfolio Huttig represents the most preferred brands by consumers, builders and pro-dealers Huttig Building Products Six Months’ Ended June 2016 Fall 2016 National reach of specialty brands with regional nuances across U.S. Focused on millwork and specialty building product
Slide 14: Market Leadership with National Scale
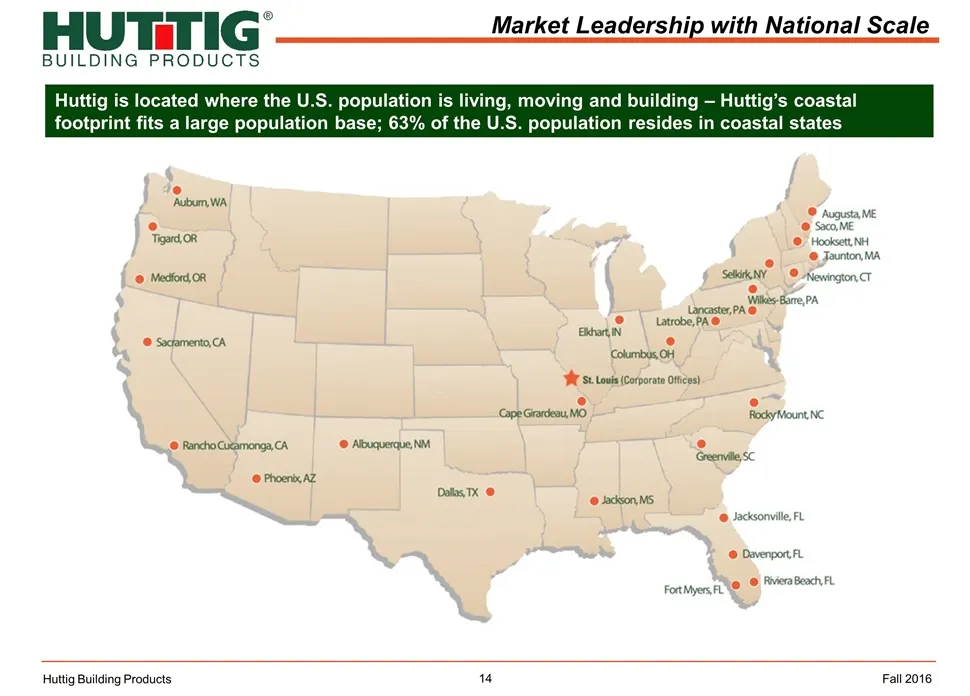
Huttig is located where the U.S. population is living, moving and building – Huttig’s coastal footprint fits a large population base; 63% of the U.S. population resides in coastal states Market Leadership with National Scale Huttig Building Products Fall 2016
Slide 15: Unique Capabilities to Serve National Accounts
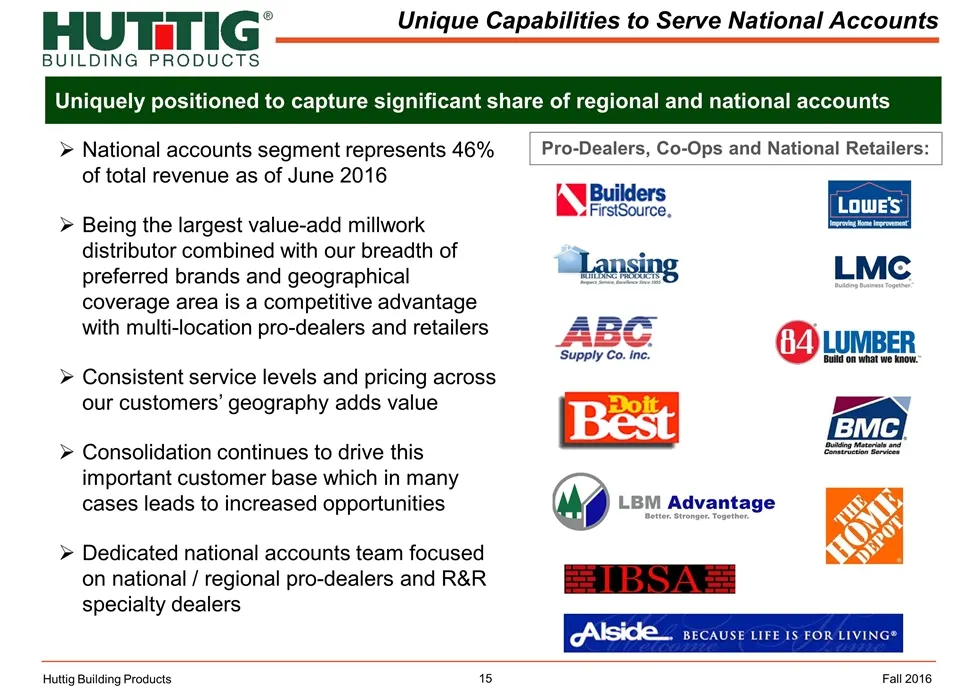
Unique Capabilities to Serve National Accounts Uniquely positioned to capture significant share of regional and national accounts Huttig Building Products National accounts segment represents 46% of total revenue as of June 2016 Being the largest value-add millwork distributor combined with our brea
Slide 16: Strategies & Key Initiatives
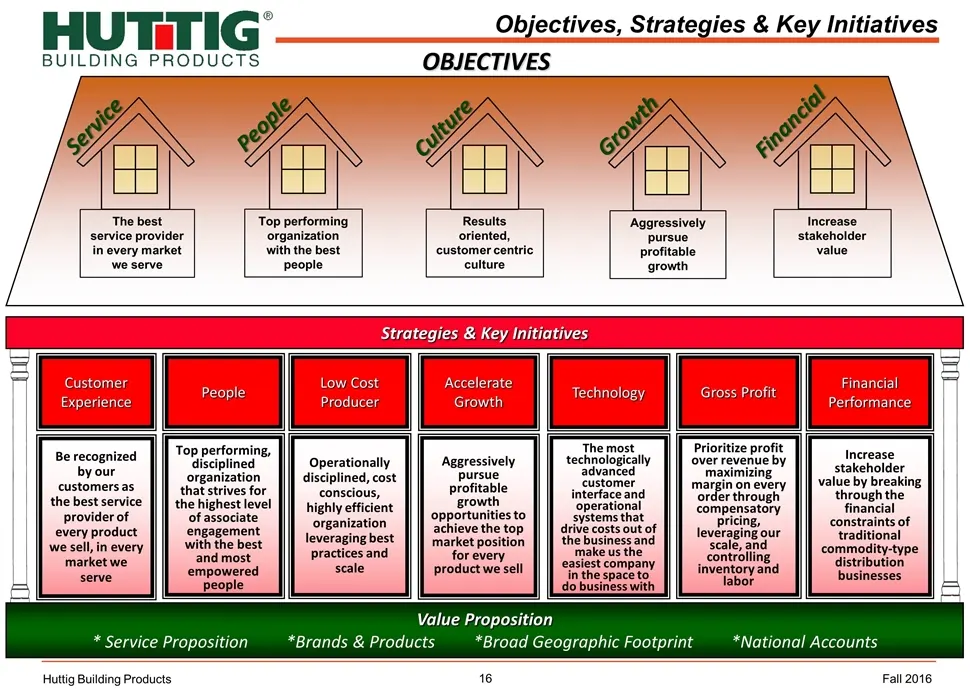
Strategies & Key Initiatives Objectives, Strategies & Key Initiatives OBJECTIVES Value Proposition * Service Proposition *Brands & Products *Broad Geographic Footprint *National Accounts Accelerate Growth Aggressively pursue profitable growth opportunities to achieve the top market position for ever
Slide 17: Our Path to Accelerate Growth and Performance
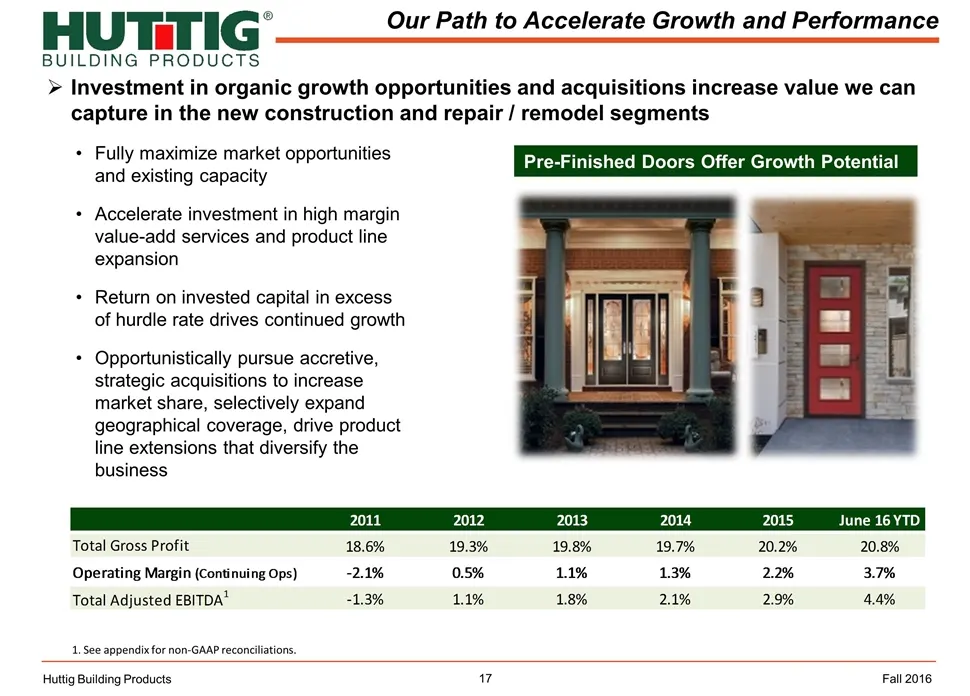
Investment in organic growth opportunities and acquisitions increase value we can capture in the new construction and repair / remodel segments Our Path to Accelerate Growth and Performance Huttig Building Products 1. See appendix for non-GAAP reconciliations. Fully maximize market opportunities and
Slide 18: Financial Overview
Financial Overview Huttig Building Products Fall 2016
Slide 19: Consolidated Financial Information
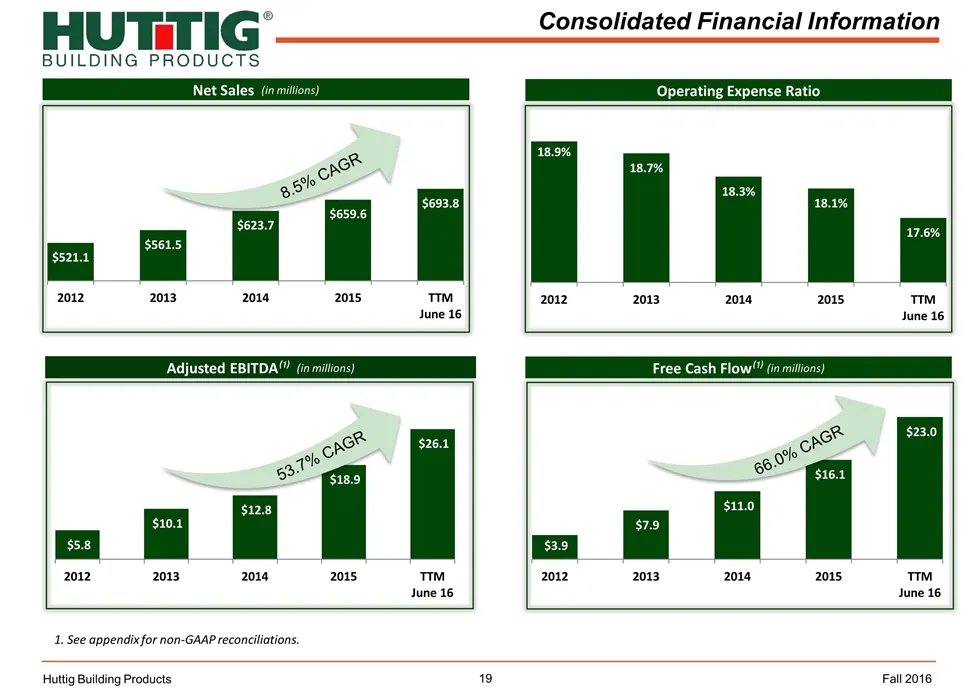
Consolidated Financial Information Huttig Building Products Net Sales (in millions) Operating Expense Ratio Free Cash Flow⁽¹⁾ (in millions) 1. See appendix for non-GAAP reconciliations. Adjusted EBITDA⁽¹⁾ (in millions) Fall 2016 53.7% CAGR 66.0% CAGR 8.5% CAGR
Slide 20: Balance Sheet / Access to Capital
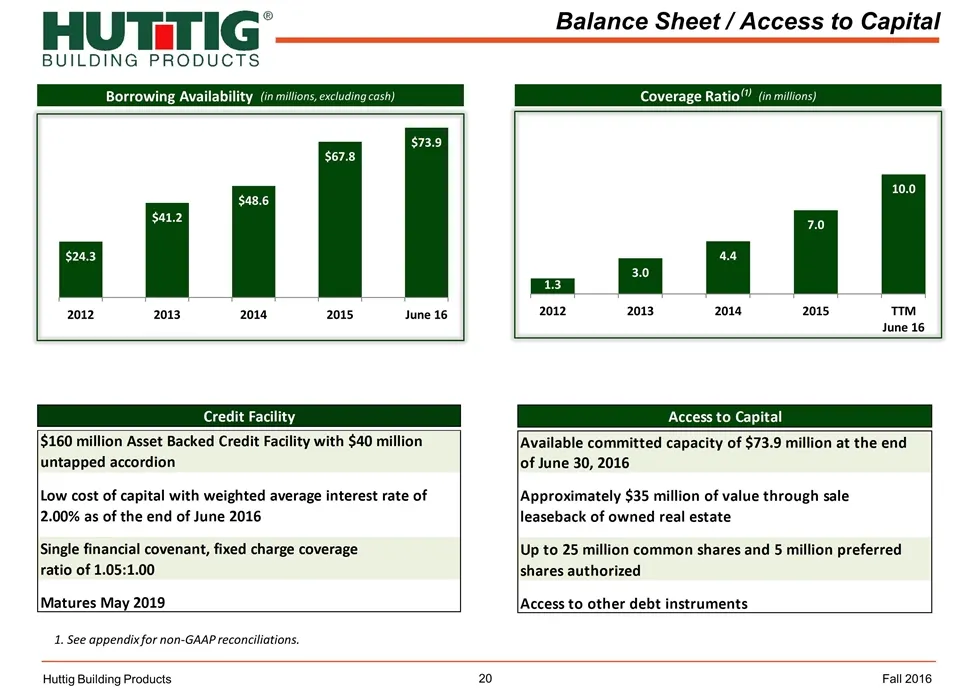
Balance Sheet / Access to Capital Huttig Building Products Borrowing Availability (in millions, excluding cash) Coverage Ratio⁽¹⁾ (in millions) Fall 2016 1. See appendix for non-GAAP reconciliations. Credit Facility Bal Sheet $160 million Asset Backed Credit Facility with $40 million untapped accord
Slide 21: Summary
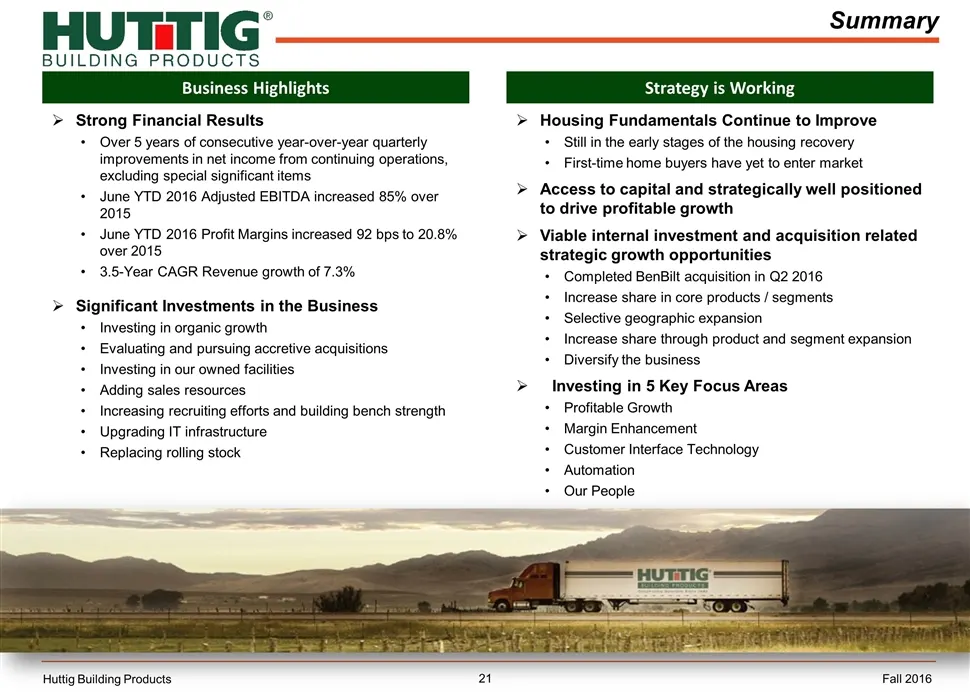
Summary Housing Fundamentals Continue to Improve Still in the early stages of the housing recovery First-time home buyers have yet to enter market Access to capital and strategically well positioned to drive profitable growth Viable internal investment and acquisition related strategic growth opport
Slide 22: Appendix
APPENDIX Huttig Building Products Fall 2016
Slide 23: Reconciliation of Adjusted EBITDA to Net Income (Loss)
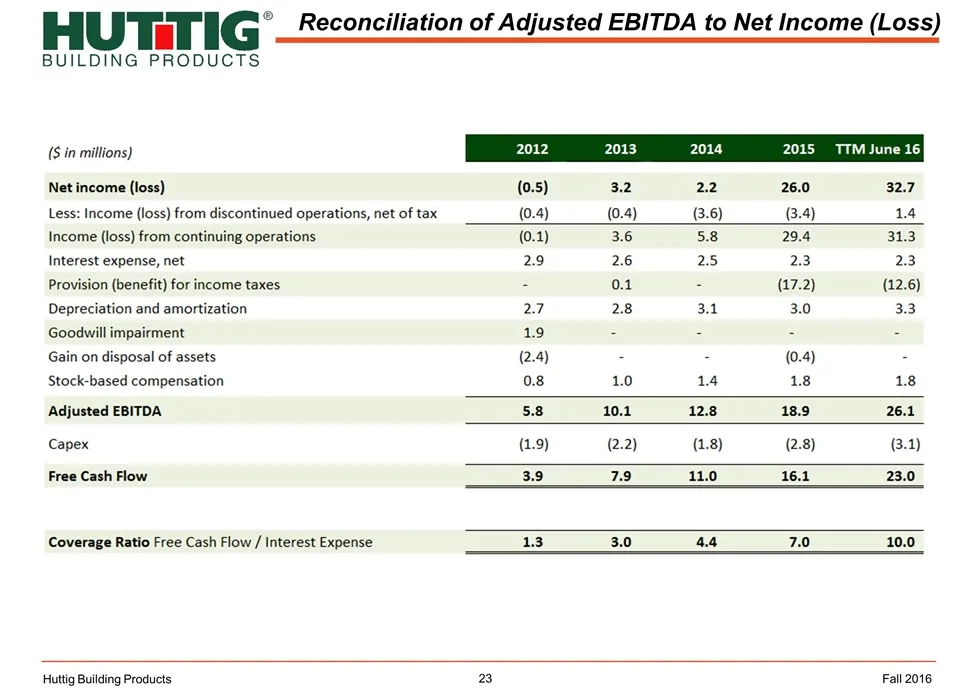
Reconciliation of Adjusted EBITDA to Net Income (Loss) Huttig Building Products Fall 2016
Source: SEC EDGAR · 8-K filed Sep 13, 2016
More decks from Huttig Building Products Inc
 Investor Presentation (November 2017)28 slides · Nov 14, 2017
 Investor Presentation (September 2017)25 slides · Sep 18, 2017
 Investor Presentation (June 2017)26 slides · Jun 1, 2017
 Investor Presentation (March 2017)25 slides · Mar 31, 2017
 Investor Presentation (March 2017)24 slides · Mar 29, 2017
 Investor Presentation (March 2016)27 slides · Mar 31, 2016