Huttig Building Products — Investor Presentation (March 2016)
27 slides from Huttig Building Products's investor presentation, Mar 31, 2016
Slide 1: Huttig Building Products Investor Presentation Spring 2016
555 Maryville University Drive - Suite 400, St. Louis , Missouri 63141 | 800.325.4466 | www.huttig.com Huttig Building Products Investor Presentation NASDAQ: HBP Spring 2016 Exhibit 99.2
Slide 2: Safe Harbor / Non-GAAP Financial Measure
Safe Harbor / Non-GAAP Financial Measure SAFE HARBOR / FORWARD LOOKING STATEMENT These presentation materials may contain forward-looking statements as defined by the U.S. Private Securities Litigation Reform Act of 1995 (“Reform Act”). Statements made in this presentation looking forward in time, i
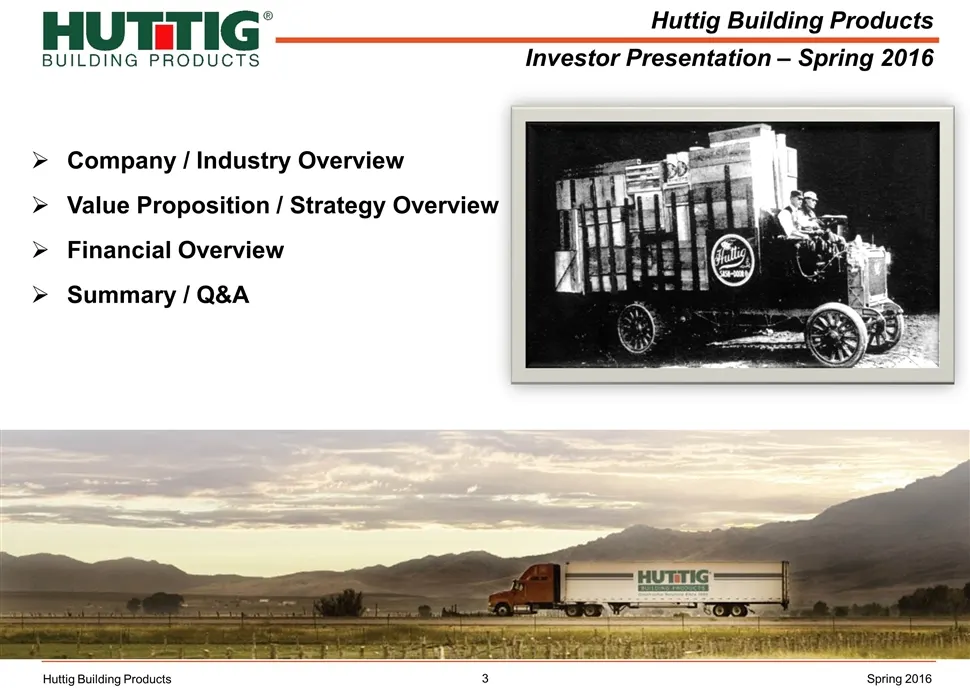
Slide 3: Huttig Building Products Spring 2016 agenda
Huttig Building Products Investor Presentation – Spring 2016 Company / Industry Overview Value Proposition / Strategy Overview Financial Overview Summary / Q&A Huttig Building Products Spring 2016
Slide 4: Company / Industry Overview
Company / Industry Overview Huttig Building Products Spring 2016
Slide 5: Company Overview
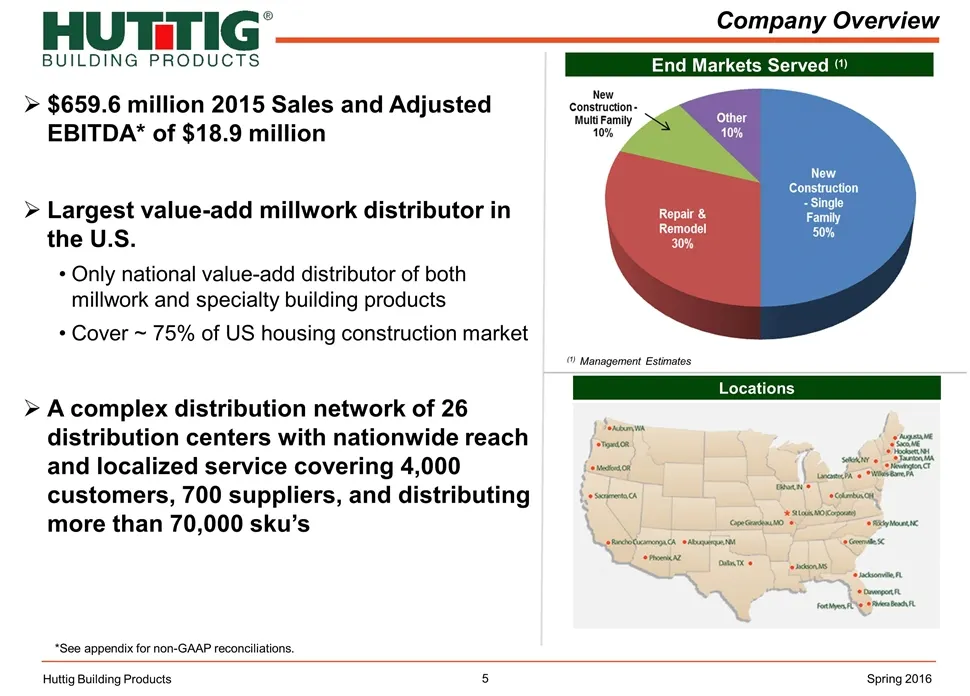
Company Overview $659.6 million 2015 Sales and Adjusted EBITDA* of $18.9 million Largest value-add millwork distributor in the U.S. Only national value-add distributor of both millwork and specialty building products Cover ~ 75% of US housing construction market A complex distribution network of 26
Slide 6: Broad Specialty Product Offering
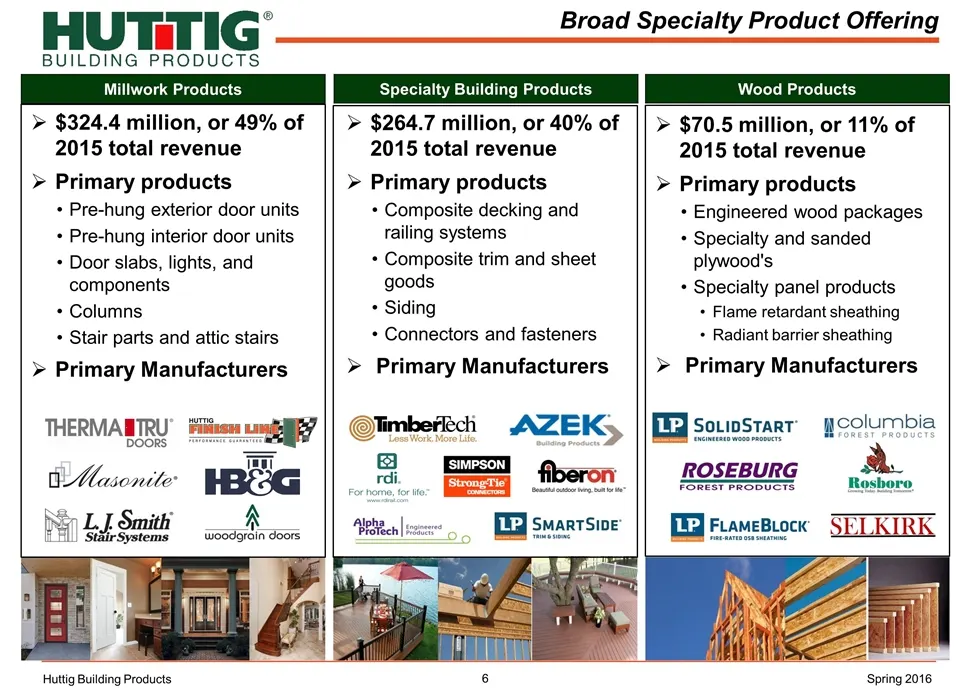
Broad Specialty Product Offering Huttig Building Products $324.4 million, or 49% of 2015 total revenue Primary products Pre-hung exterior door units Pre-hung interior door units Door slabs, lights, and components Columns Stair parts and attic stairs Primary Manufacturers $264.7 million, or 40% of 20
Slide 7: Huttig provides value in the channel through sales, material handling and logistical expertise
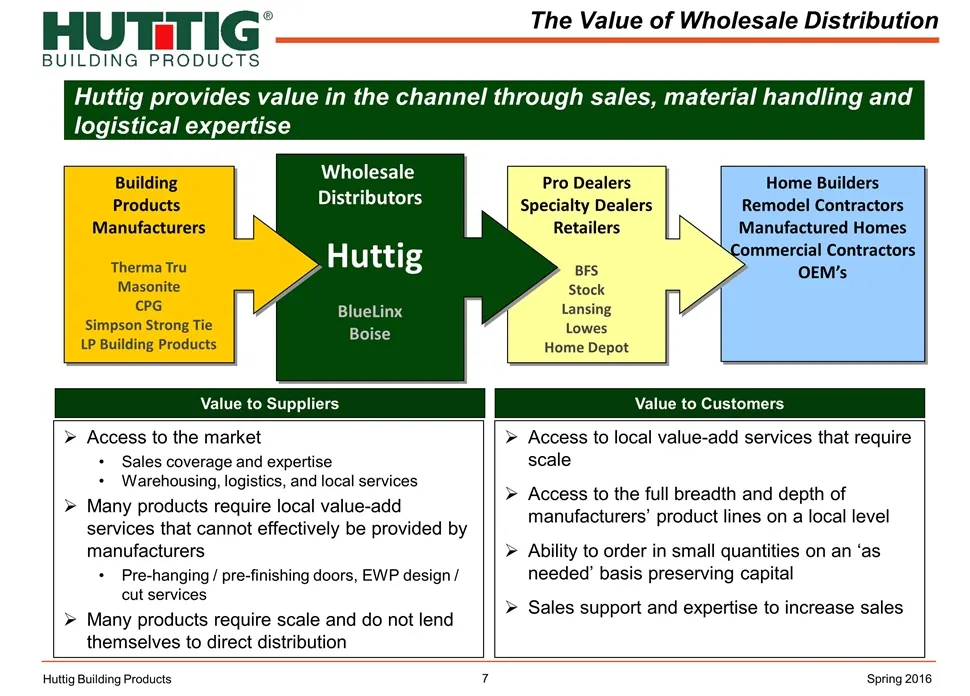
Huttig provides value in the channel through sales, material handling and logistical expertise Home Builders Remodel Contractors Manufactured Homes Commercial Contractors OEM’s Pro Dealers Specialty Dealers Retailers BFS Stock Lansing Lowes Home Depot Wholesale Distributors Huttig BlueLinx Boise Bui
Slide 8: Overview of U.S. Housing Market
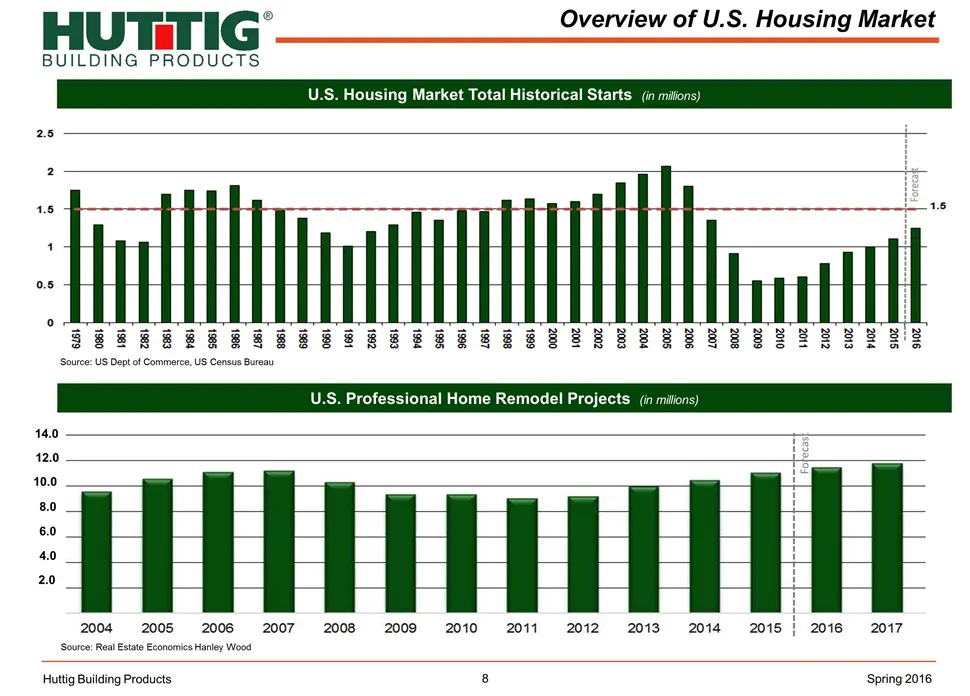
Overview of U.S. Housing Market Source: US Dept of Commerce, US Census Bureau U.S. Housing Market Total Historical Starts (in millions) Huttig Building Products U.S. Professional Home Remodel Projects (in millions) Source: Real Estate Economics Hanley Wood Forecast 14.0 12.0 10.0 8.0 4.0 6.0 2.0 Spr
Slide 9: The Opportunity Tomorrow
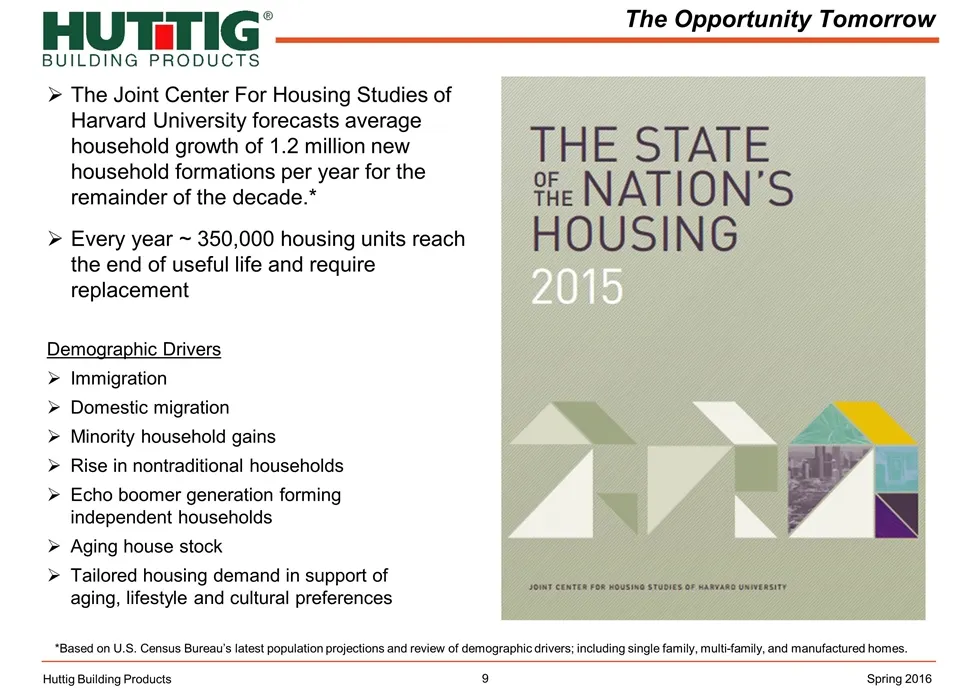
The Opportunity Tomorrow Demographic Drivers Immigration Domestic migration Minority household gains Rise in nontraditional households Echo boomer generation forming independent households Aging house stock Tailored housing demand in support of aging, lifestyle and cultural preferences The Joint Cen
Slide 10: Value Proposition / Strategy Overview
Value Proposition / Strategy Overview Huttig Building Products Spring 2016
Slide 11: Service Proposition
Service Proposition Speed to Market – Next day delivery on inventoried items, 3 day production lead-times Technology – Customer interface, EDI, Pricing Continuous improvement through the use of metrics and reporting Service oriented, professional, technically superior sales / support teams Specialty
Slide 12: Speed to market
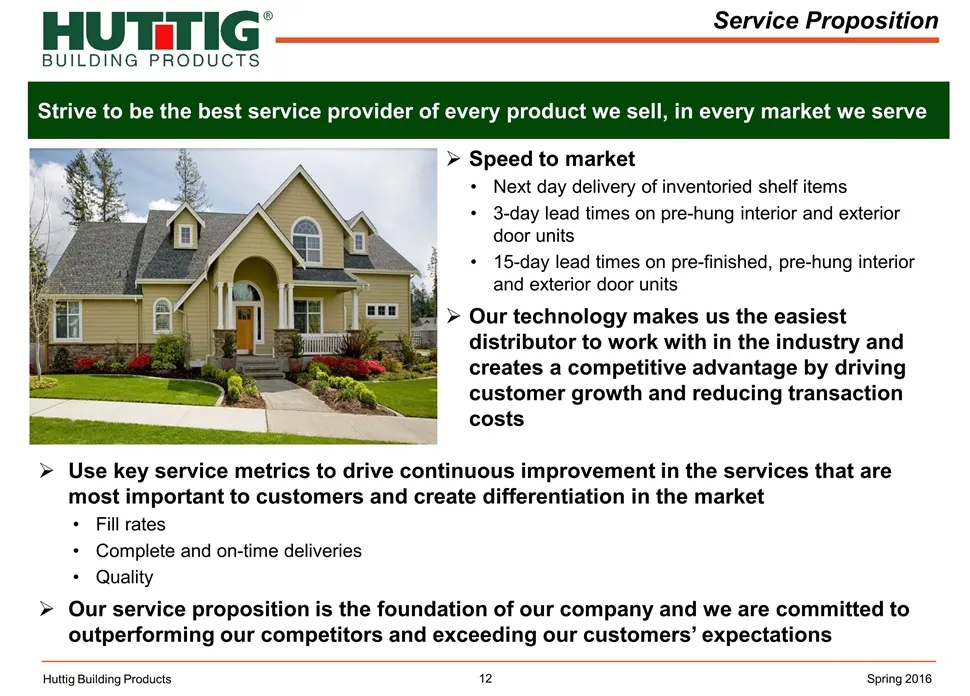
Speed to market Next day delivery of inventoried shelf items 3-day lead times on pre-hung interior and exterior door units 15-day lead times on pre-finished, pre-hung interior and exterior door units Our technology makes us the easiest distributor to work with in the industry and creates a competiti
Slide 13: Specialty Focused Brand Portfolio
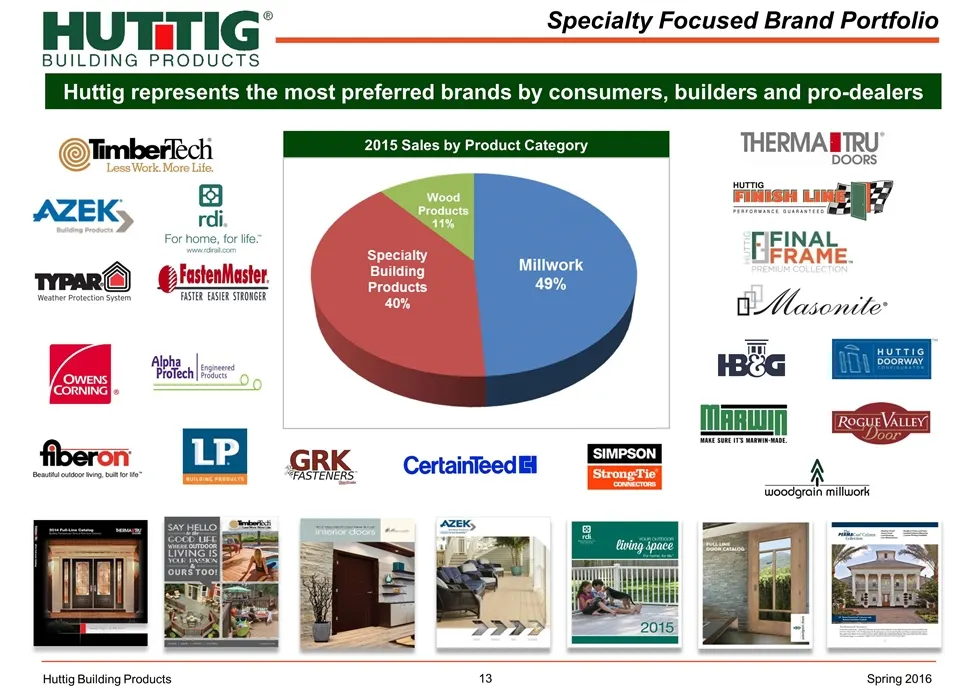
Specialty Focused Brand Portfolio Huttig represents the most preferred brands by consumers, builders and pro-dealers Huttig Building Products 2015 Sales by Product Category Spring 2016
Slide 14: Market Leadership with National Scale
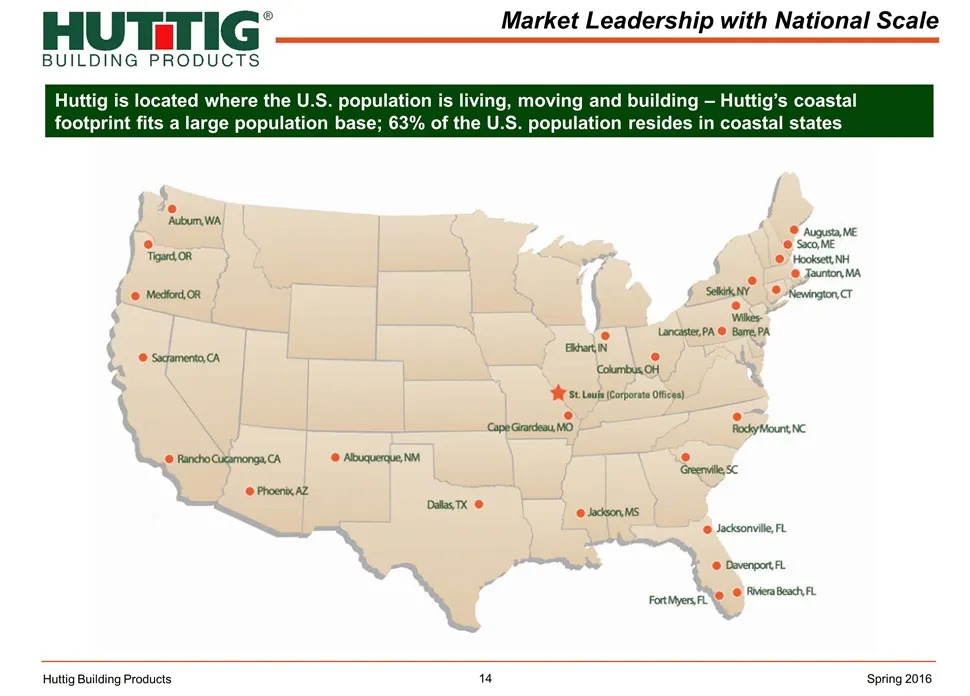
Market Leadership with National Scale Huttig is located where the U.S. population is living, moving and building – Huttig’s coastal footprint fits a large population base; 63% of the U.S. population resides in coastal states Huttig Building Products Spring 2016
Slide 15: Unique Capabilities to Serve National Accounts
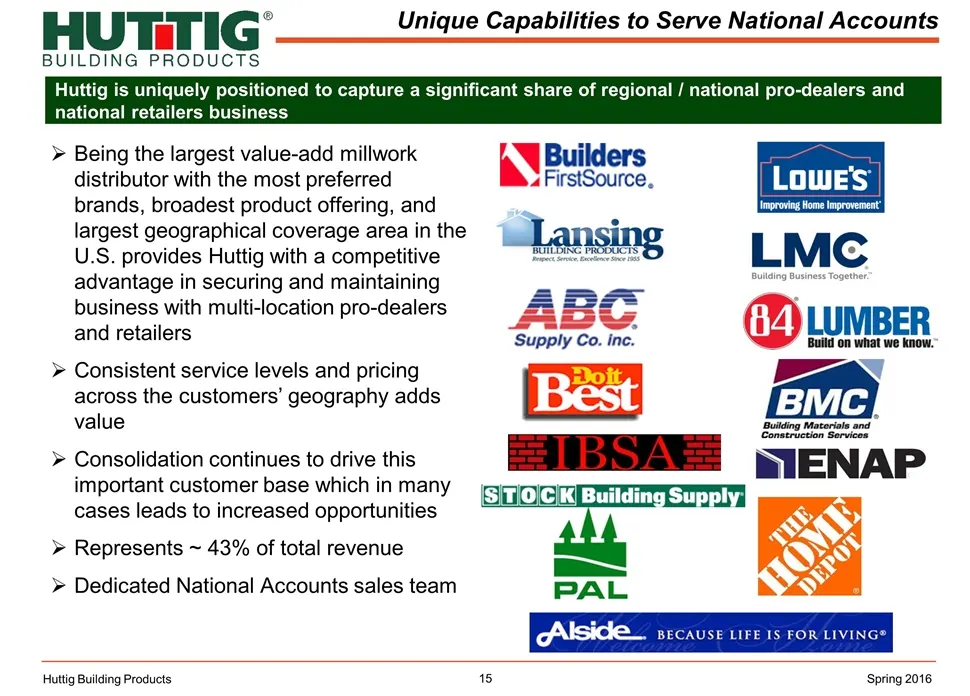
Being the largest value-add millwork distributor with the most preferred brands, broadest product offering, and largest geographical coverage area in the U.S. provides Huttig with a competitive advantage in securing and maintaining business with multi-location pro-dealers and retailers Consistent se
Slide 16: Strategic Overview - Timeline
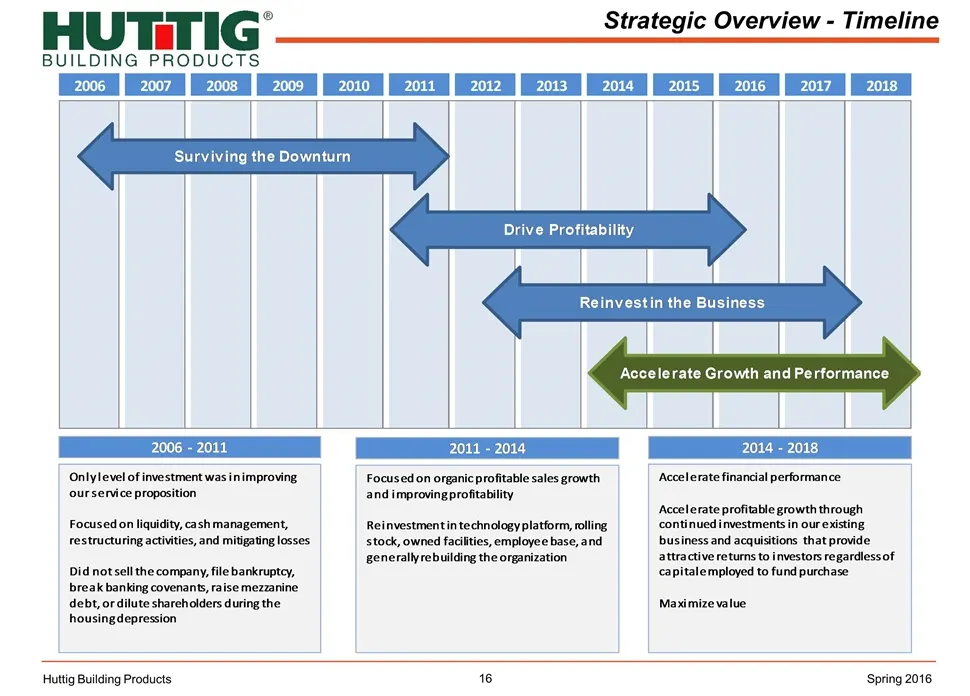
Strategic Overview - Timeline Huttig Building Products Spring 2016
Slide 17: Our Path to Accelerate Growth and Performance
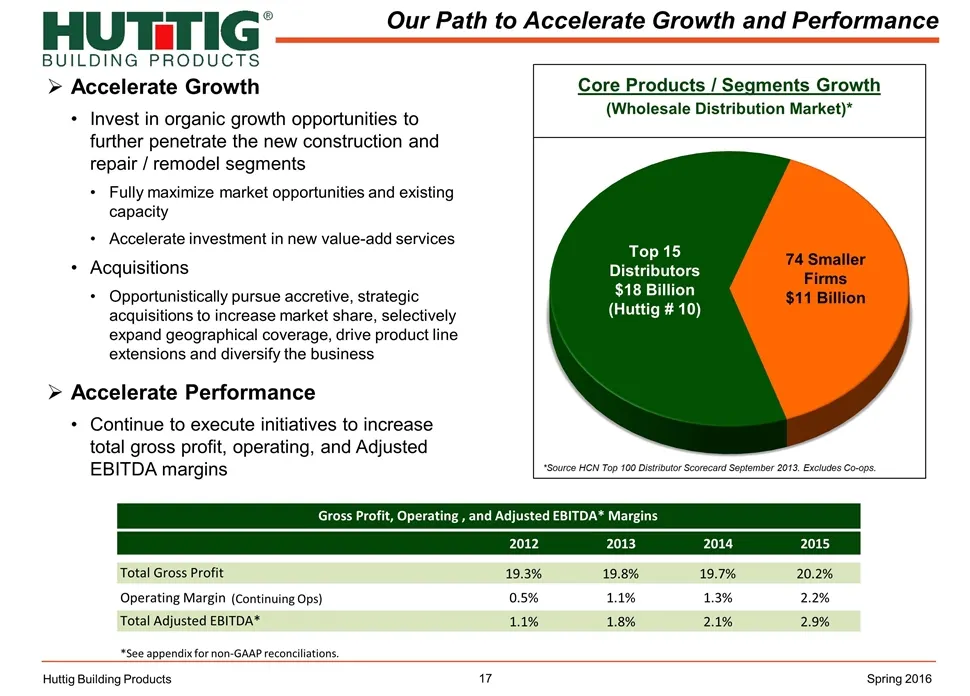
Accelerate Growth Invest in organic growth opportunities to further penetrate the new construction and repair / remodel segments Fully maximize market opportunities and existing capacity Accelerate investment in new value-add services Acquisitions Opportunistically pursue accretive, strategic acquis
Slide 18: Financial Overview
Financial Overview Huttig Building Products Spring 2016
Slide 19: Financial Review
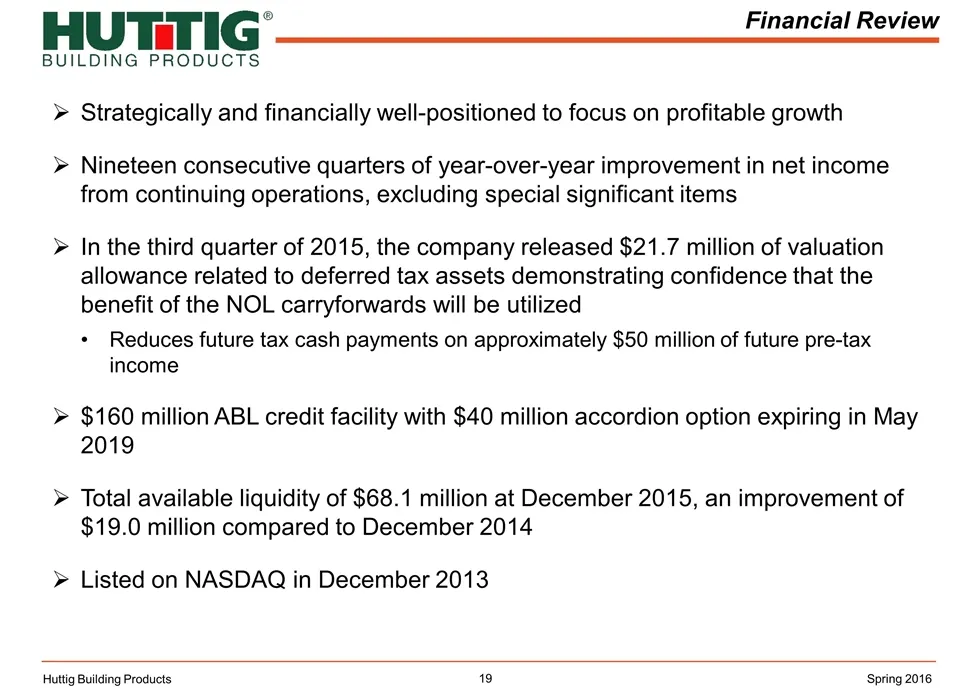
Strategically and financially well-positioned to focus on profitable growth Nineteen consecutive quarters of year-over-year improvement in net income from continuing operations, excluding special significant items In the third quarter of 2015, the company released $21.7 million of valuation allowanc
Slide 20: Consolidated Financial Information
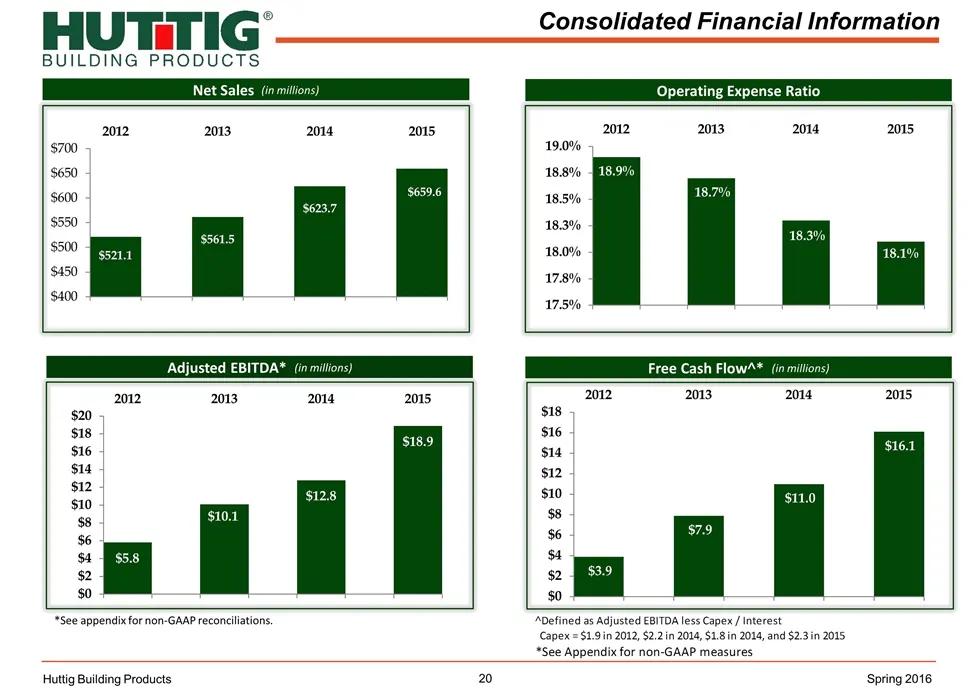
Consolidated Financial Information Huttig Building Products Net Sales (in millions) Adjusted EBITDA* (in millions) Operating Expense Ratio Free Cash Flow˄* (in millions) *See appendix for non-GAAP reconciliations. Spring 2016 Internal Notes Net Sales (in millions) CFI $521.1 $561.5 $623.700000000000
Slide 21: Balance Sheet / Access to Capital
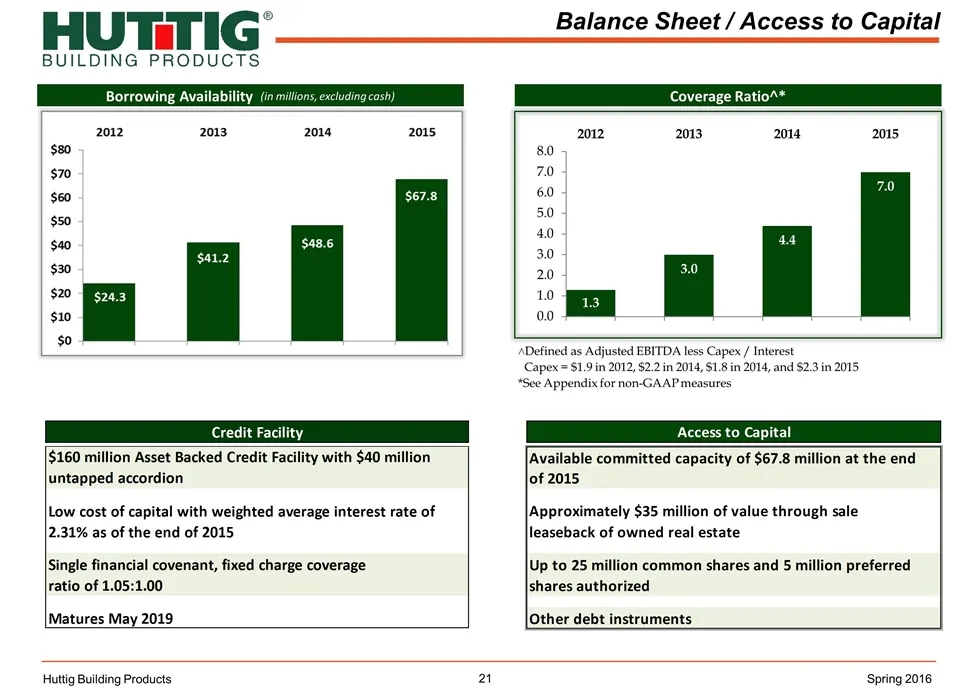
Balance Sheet / Access to Capital Huttig Building Products Borrowing Availability (in millions, excluding cash) Coverage Ratio˄* Spring 2016 ˄Defined as Adjusted EBITDA less Capex / Interest Capex = $1.9 in 2012, $2.2 in 2014, $1.8 in 2014, and $2.3 in 2015 *See Appendix for non-GAAP measures Credit
Slide 22: Strong Financial Momentum
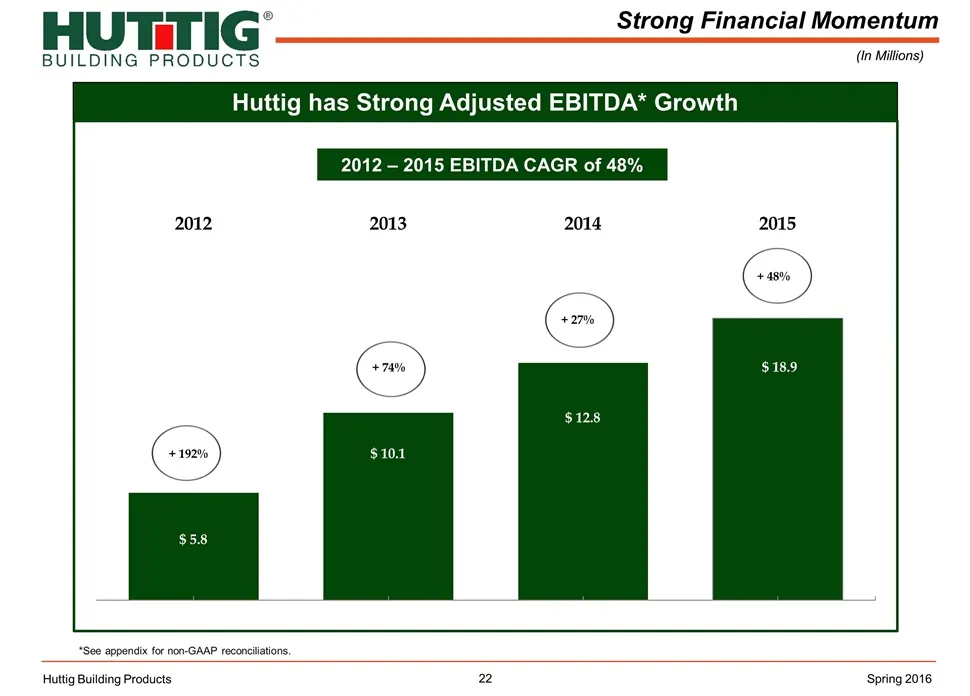
Strong Financial Momentum (In Millions) *See appendix for non-GAAP reconciliations. Huttig Building Products Huttig has Strong Adjusted EBITDA* Growth Spring 2016 2012 – 2015 EBITDA CAGR of 48%
Slide 23: Summary / Q&A
Summary / Q&A Huttig Building Products Spring 2016
Slide 24: Strong Financial Results
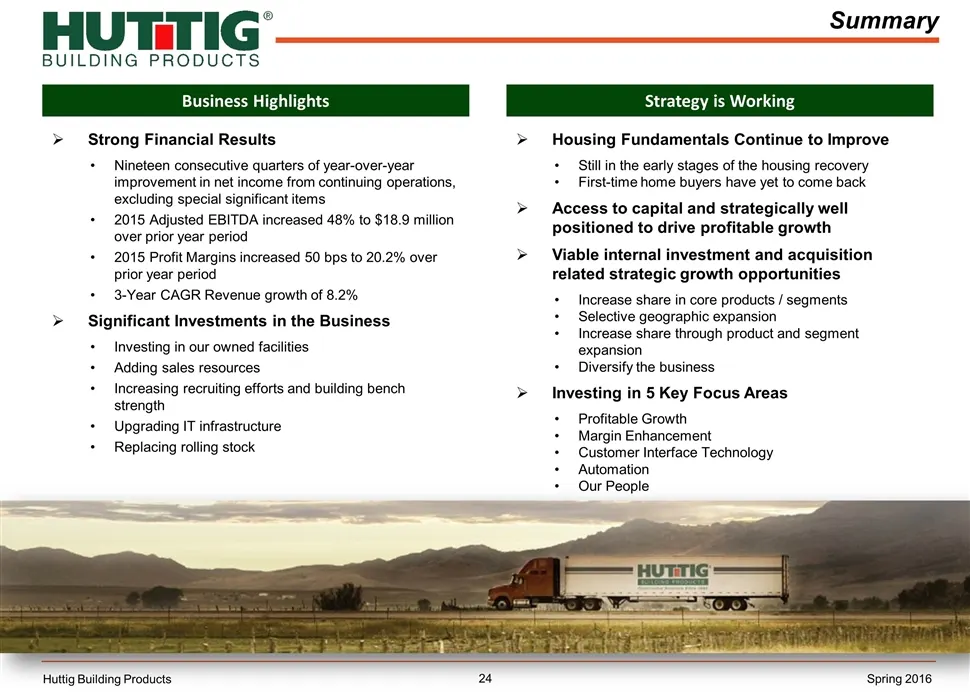
Strong Financial Results Nineteen consecutive quarters of year-over-year improvement in net income from continuing operations, excluding special significant items 2015 Adjusted EBITDA increased 48% to $18.9 million over prior year period 2015 Profit Margins increased 50 bps to 20.2% over prior year
Slide 25: Appendix
APPENDIX Spring 2016 Huttig Building Products
Slide 26: Reconciliation of Adjusted EBITDA to Net Income (Loss)
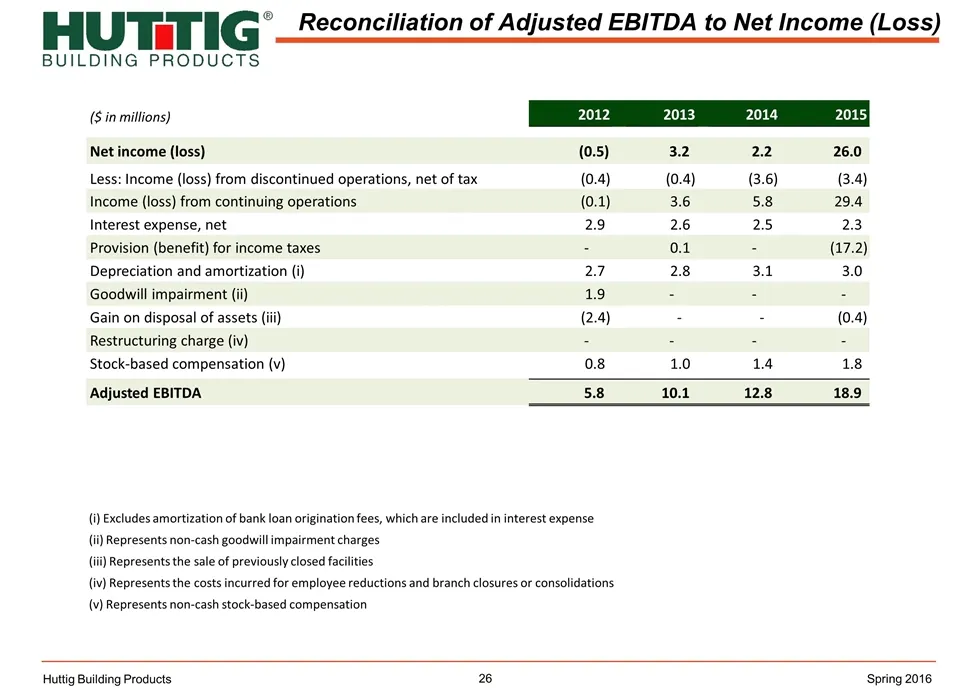
Reconciliation of Adjusted EBITDA to Net Income (Loss) Huttig Building Products Spring 2016 ($ in millions) 2012 2013 2014 2015 Net income (loss) (0.5) 3.2 2.2 26.0 Less: Income (loss) from discontinued operations, net of tax (0.4) (0.4) (3.6) (3.4) Income (loss) from continuing operations (0.1) 3.6
Slide 27: Investor Relations Contacts
555 Maryville University Drive - Suite 400, St. Louis , Missouri 63141 | 800.325.4466 | www.huttig.com Huttig Building Products Investor Presentation NASDAQ: HBP Spring 2016 Don Hake Corporate Controller & Treasurer Huttig Building Products, Inc. 314-216-2600 [email protected] Rebecca Kujawa Gener
Source: SEC EDGAR · 8-K filed Mar 31, 2016
More decks from Huttig Building Products Inc
 Investor Presentation (November 2017)28 slides · Nov 14, 2017
 Investor Presentation (September 2017)25 slides · Sep 18, 2017
 Investor Presentation (June 2017)26 slides · Jun 1, 2017
 Investor Presentation (March 2017)25 slides · Mar 31, 2017
 Investor Presentation (March 2017)24 slides · Mar 29, 2017
 Investor Presentation (September 2016)23 slides · Sep 13, 2016