Cloud Peak Energy — Raymond James 4th Annual Coal Investors Conference 2012
27 slides from Cloud Peak Energy's conference presentation, Jun 19, 2012
Slide 1: Raymond James 4th Annual Coal Investors Conference
Raymond James 4th Annual Coal Investors Conference June 19, 2012
Slide 2: Cautionary Note Regarding Forward-Looking Statements
1 Cloud Peak Energy Inc. Financial Data Cloud Peak Energy Inc. is the sole owner of Cloud Peak Energy Resources LLC. Unless expressly stated otherwise in this presentation, all financial data included herein is consolidated financial data of Cloud Peak Energy Inc. Cautionary Note Regarding Forward-L
Slide 3: Cloud Peak Energy Profile
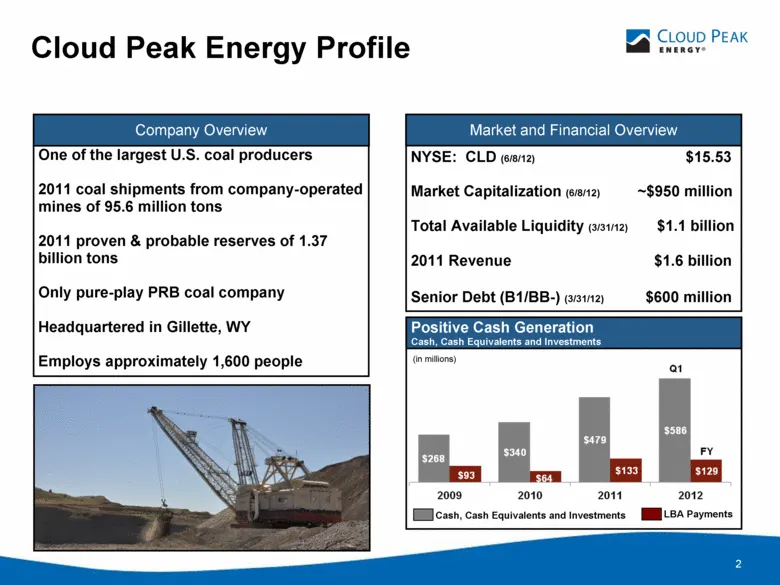
2 Cloud Peak Energy Profile One of the largest U.S. coal producers 2011 coal shipments from company-operated mines of 95.6 million tons 2011 proven & probable reserves of 1.37 billion tons Only pure-play PRB coal company Headquartered in Gillette, WY Employs approximately 1,600 people Cash, Cash Equ
Slide 4: Good Safety Record Indicates Well-Run Operations
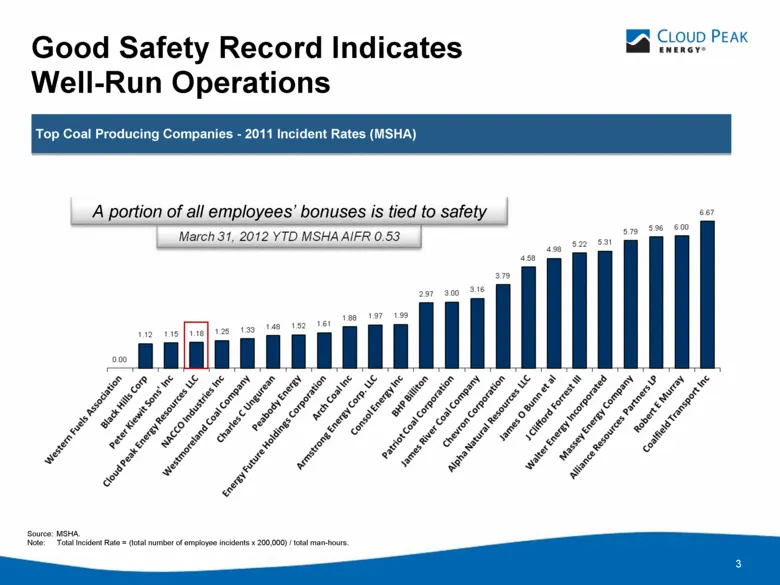
3 Top Coal Producing Companies - 2011 Incident Rates (MSHA) Source: MSHA. Note: Total Incident Rate = (total number of employee incidents x 200,000) / total man-hours. Good Safety Record Indicates Well-Run Operations A portion of all employees’ bonuses is tied to safety
Slide 5: Resilient Business
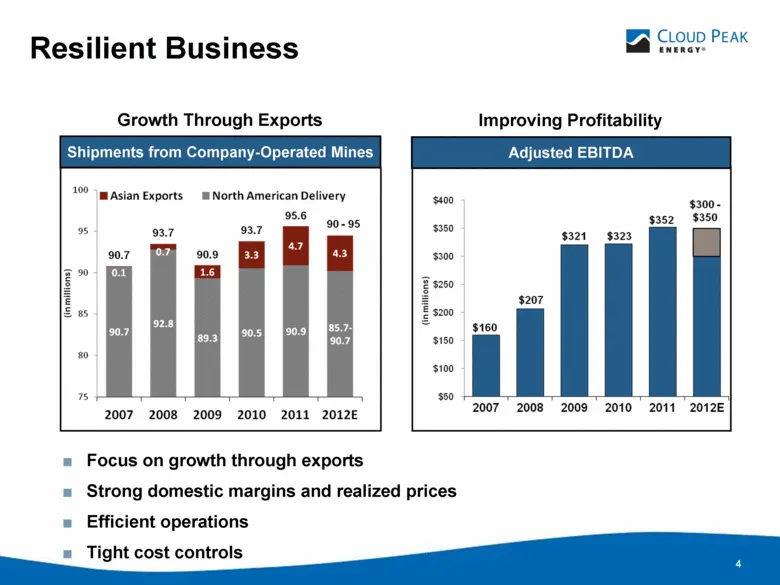
4 Resilient Business Adjusted EBITDA Improving Profitability Shipments from Company-Operated Mines Growth Through Exports Focus on growth through exports Strong domestic margins and realized prices Efficient operations Tight cost controls
Slide 6: Challenging Environment
Challenging Environment 5 Fourth warmest winter on record for contiguous U.S. Mild winter resulted in: low electric generation for heating low demand for gas-powered heating Natural gas prices coming off 10-year lows Sluggish economy Inventories at generating utilities at record levels Excess supply
Slide 7: Electric Generation
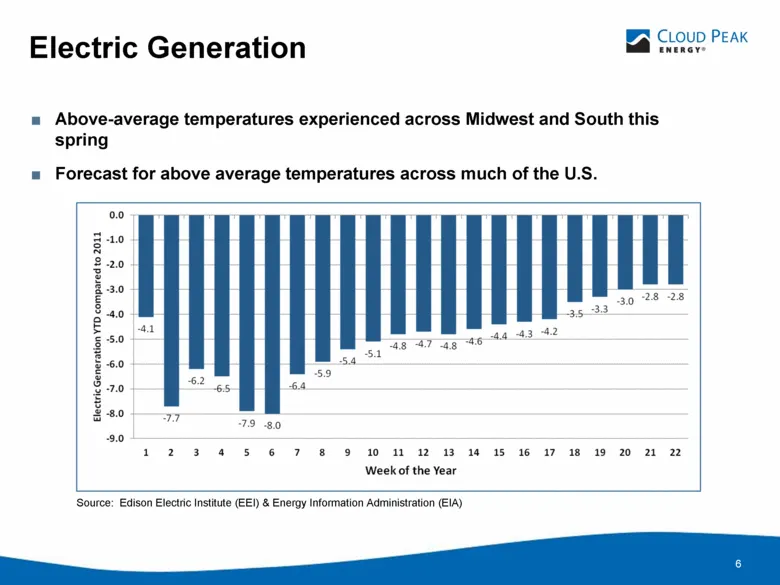
Electric Generation 6 Above-average temperatures experienced across Midwest and South this spring Forecast for above average temperatures across much of the U.S. Source: Edison Electric Institute (EEI) & Energy Information Administration (EIA)
Slide 8: Natural Gas Prices Improving
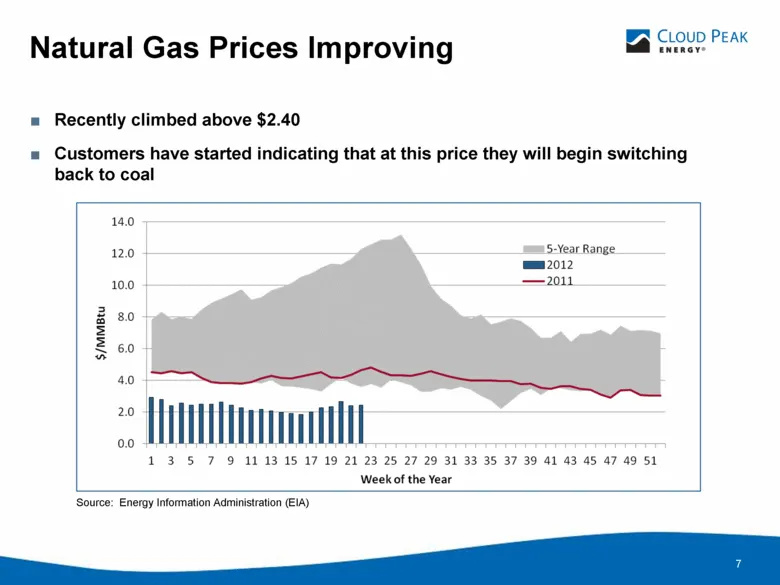
Natural Gas Prices Improving 7 Recently climbed above $2.40 Customers have started indicating that at this price they will begin switching back to coal Source: Energy Information Administration (EIA)
Slide 9: Supply Response
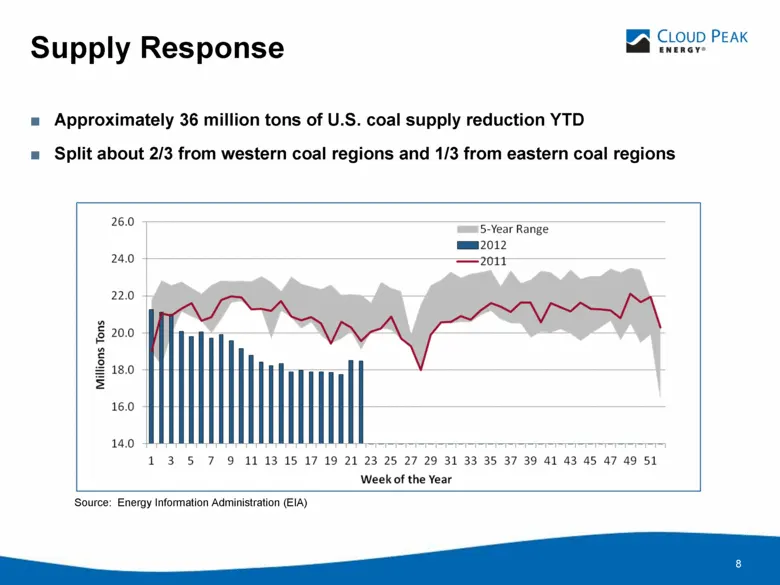
Supply Response 8 Approximately 36 million tons of U.S. coal supply reduction YTD Split about 2/3 from western coal regions and 1/3 from eastern coal regions Source: Energy Information Administration (EIA)
Slide 10: Lower Hydro Generation
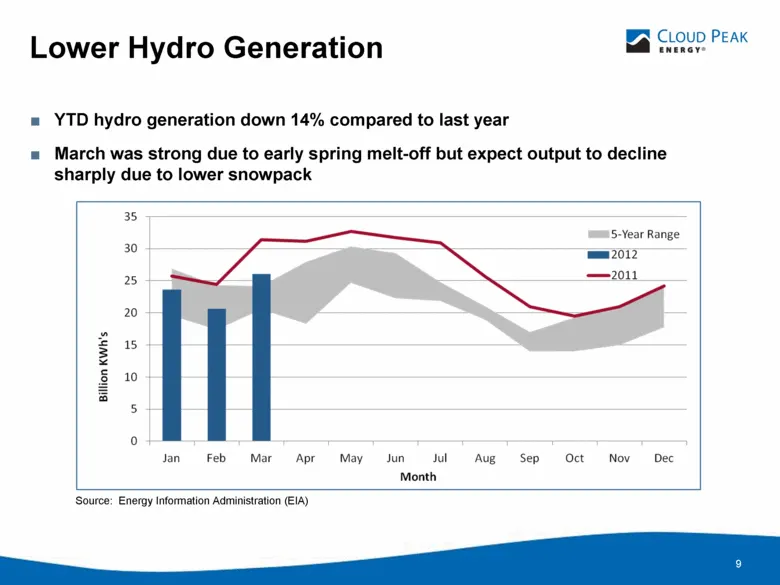
Lower Hydro Generation 9 YTD hydro generation down 14% compared to last year March was strong due to early spring melt-off but expect output to decline sharply due to lower snowpack Source: Energy Information Administration (EIA)
Slide 11: Coal Stockpiles
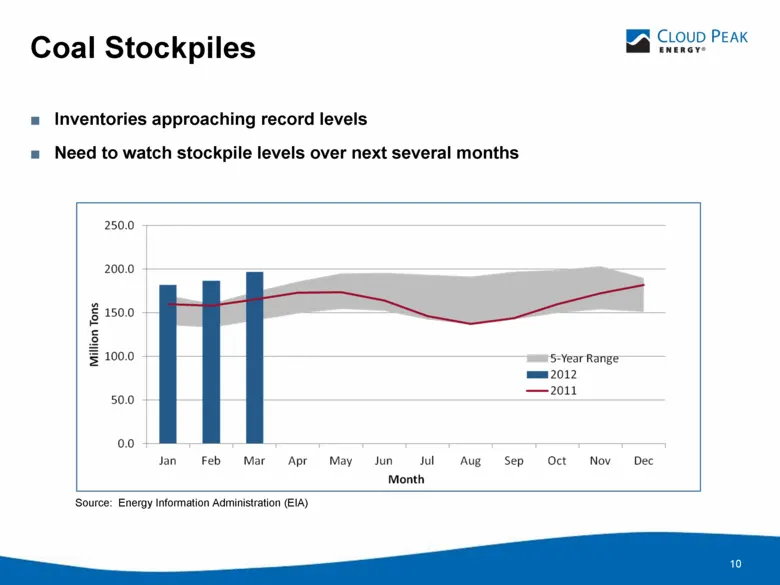
Coal Stockpiles 10 Inventories approaching record levels Need to watch stockpile levels over next several months Source: Energy Information Administration (EIA)
Slide 12: Strong Exports and Slowing Imports
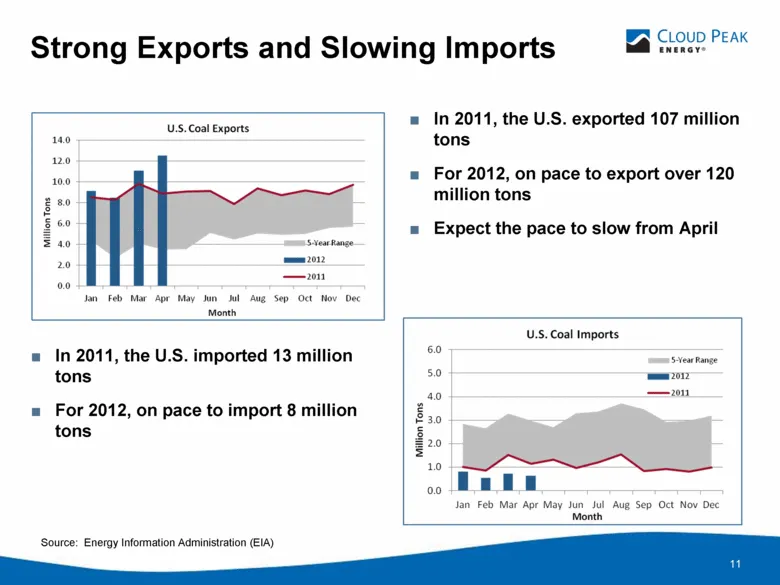
Strong Exports and Slowing Imports 11 In 2011, the U.S. exported 107 million tons For 2012, on pace to export over 120 million tons Expect the pace to slow from April In 2011, the U.S. imported 13 million tons For 2012, on pace to import 8 million tons Source: Energy Information Administration (EIA)
Slide 13: Strong Contracted Position for Cloud Peak Energy
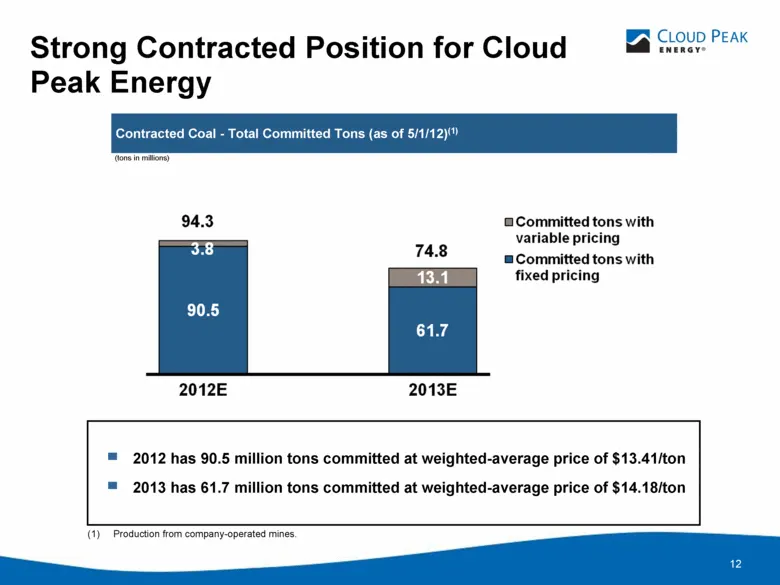
12 Strong Contracted Position for Cloud Peak Energy (tons in millions) (1) Production from company-operated mines. 2012 has 90.5 million tons committed at weighted-average price of $13.41/ton 2013 has 61.7 million tons committed at weighted-average price of $14.18/ton Contracted Coal - Total Committ
Slide 14: Strategy for Growth
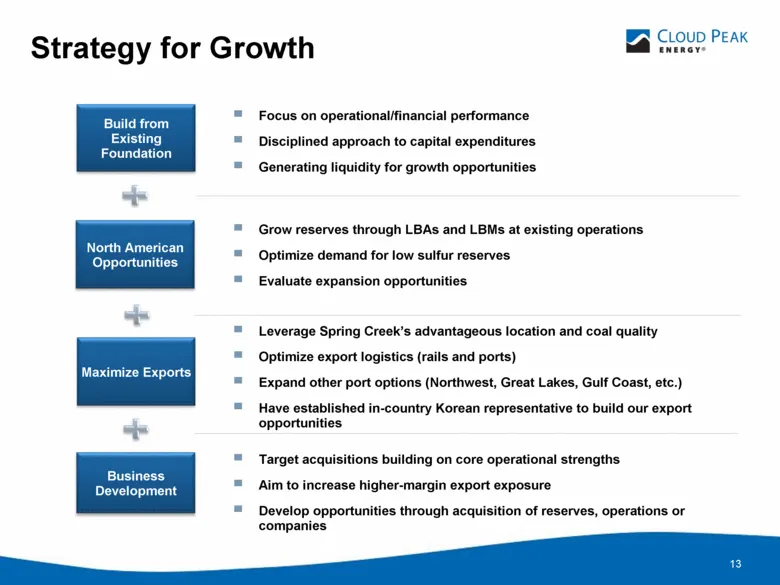
13 Strategy for Growth Focus on operational/financial performance Disciplined approach to capital expenditures Generating liquidity for growth opportunities Build from Existing Foundation North American Opportunities Business Development Grow reserves through LBAs and LBMs at existing operations Opt
Slide 15: Looking Forward
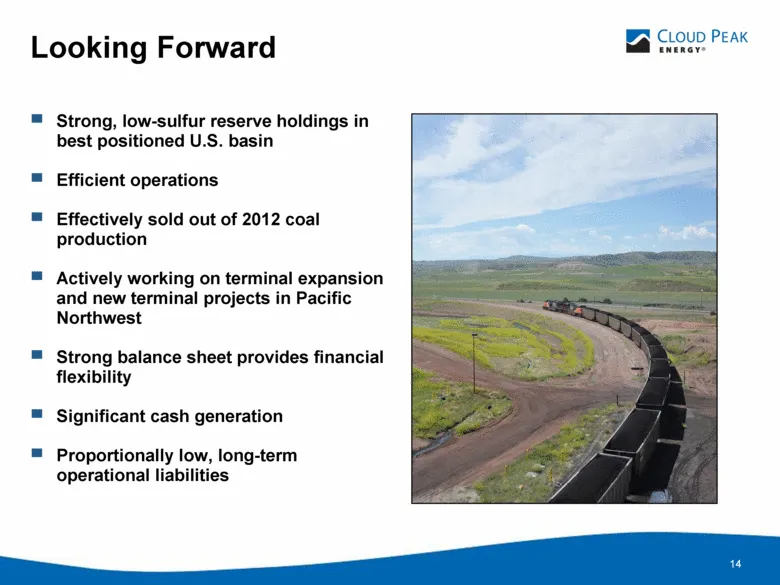
14 Looking Forward 14 Strong, low-sulfur reserve holdings in best positioned U.S. basin Efficient operations Effectively sold out of 2012 coal production Actively working on terminal expansion and new terminal projects in Pacific Northwest Strong balance sheet provides financial flexibility Signific
Slide 16: Appendices
15 Appendices (Cloud Peak Energy Inc.)
Slide 17: 2012 Guidance – Estimates and 2011 Actuals
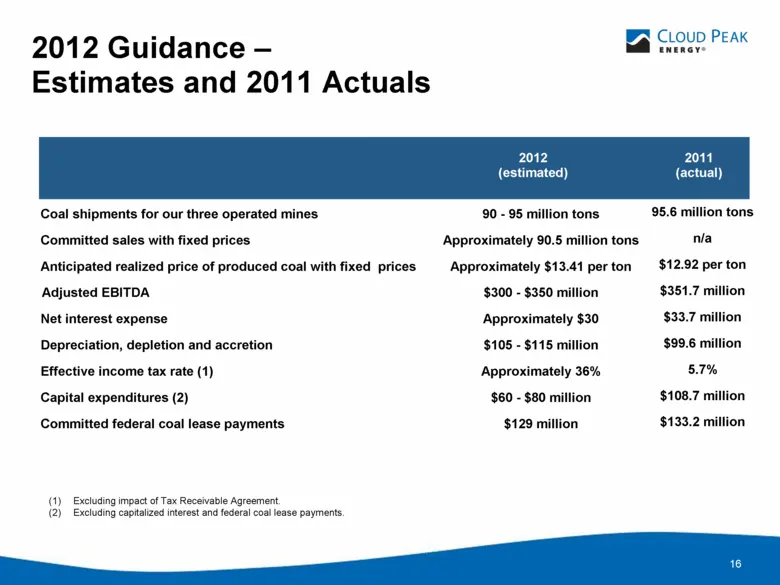
16 2012 Guidance – Estimates and 2011 Actuals 2012 (estimated) 2011 (actual) (1) Excluding impact of Tax Receivable Agreement. (2) Excluding capitalized interest and federal coal lease payments. Coal shipments for our three operated mines 90 - 95 million tons 95.6 million tons Committed sales with f
Slide 18: Average Cost of Produced Coal
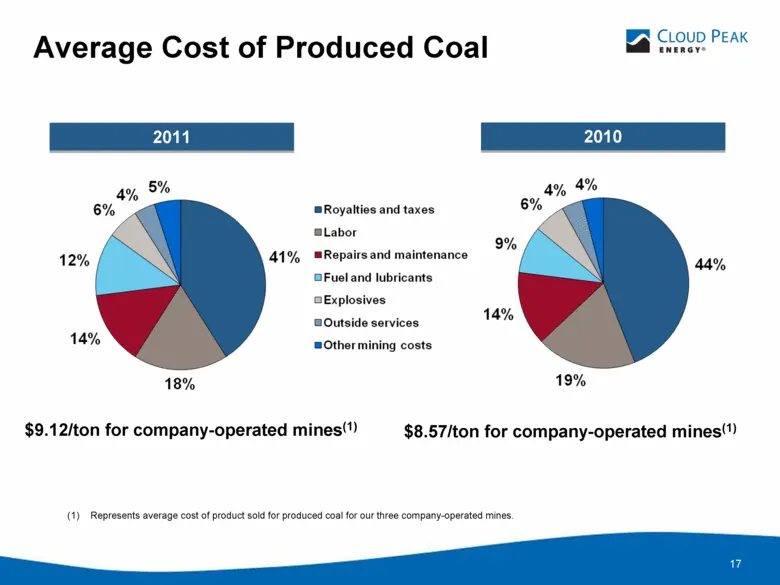
17 Average Cost of Produced Coal (1) Represents average cost of product sold for produced coal for our three company-operated mines. $8.57/ton for company-operated mines(1) $9.12/ton for company-operated mines(1) 2010 2011
Slide 19: Statement of Operations Data
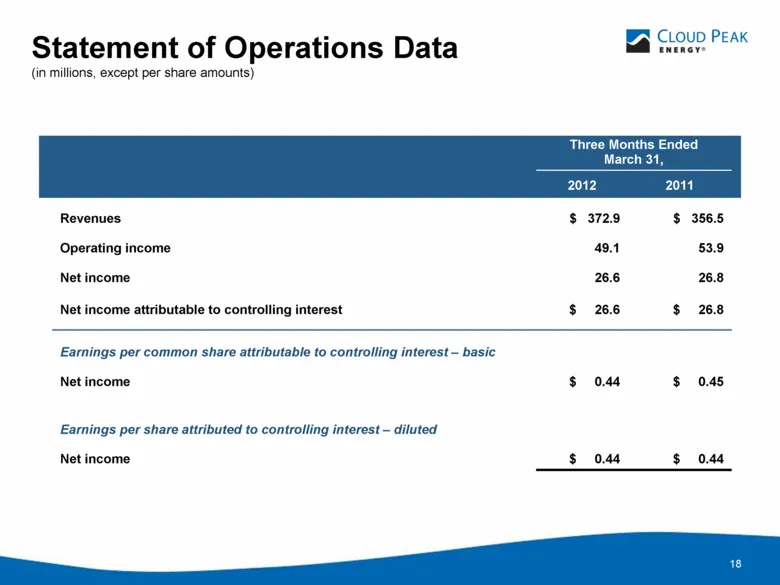
18 Statement of Operations Data (in millions, except per share amounts) Three Months Ended March 31, 2012 2011 Revenues $ 372.9 $ 356.5 Operating income 49.1 53.9 Net income 26.6 26.8 Net income attributable to controlling interest $ 26.6 $ 26.8 Earnings per common share attributable to controlling
Slide 20: Statement of Operations Data
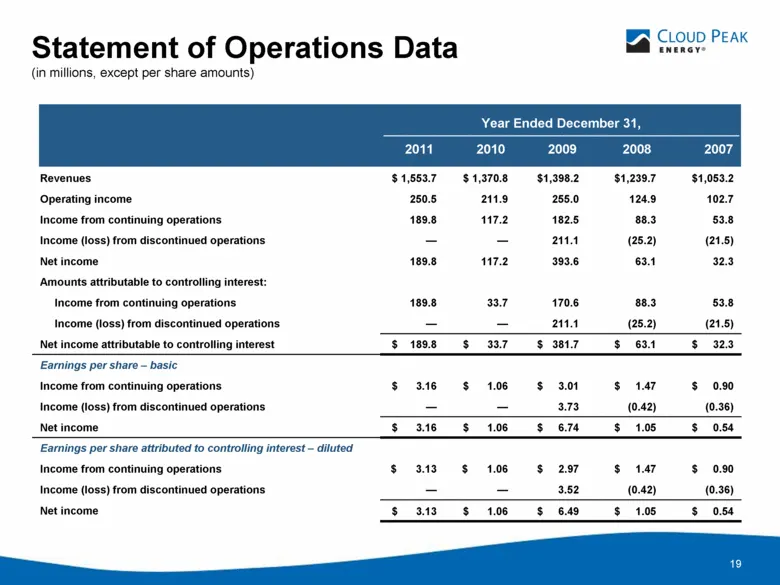
19 Statement of Operations Data (in millions, except per share amounts) Revenues $ 1,553.7 $ 1,370.8 $1,398.2 $1,239.7 $1,053.2 Operating income 250.5 211.9 255.0 124.9 102.7 Income from continuing operations 189.8 117.2 182.5 88.3 53.8 Income (loss) from discontinued operations — — 211.1 (25.2) (21
Slide 21: Balance Sheet Data
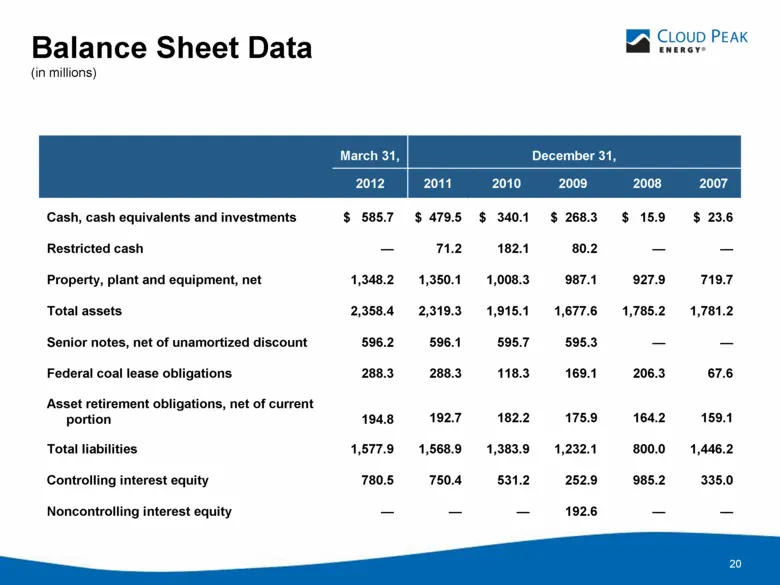
20 Balance Sheet Data (in millions) Cash, cash equivalents and investments $ 585.7 $ 479.5 $ 340.1 $ 268.3 $ 15.9 $ 23.6 Restricted cash — 71.2 182.1 80.2 — — Property, plant and equipment, net 1,348.2 1,350.1 1,008.3 987.1 927.9 719.7 Total assets 2,358.4 2,319.3 1,915.1 1,677.6 1,785.2 1,781.2 Sen
Slide 22: Reconciliation of Non-GAAP Measures – Adjusted EBITDA
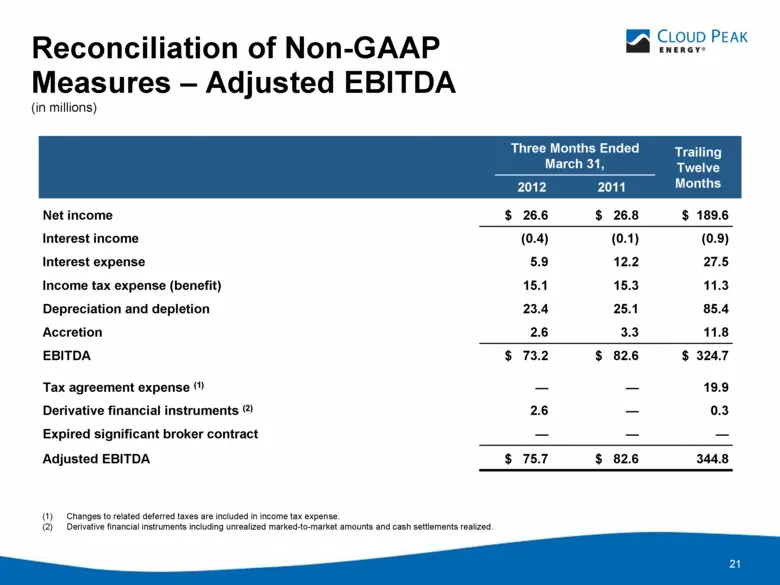
21 Reconciliation of Non-GAAP Measures – Adjusted EBITDA (in millions) Nine Months Ended September 30, 2010 2009 Net income $ 26.6 $ 26.8 $ 189.6 Interest income (0.4) (0.1) (0.9) Interest expense 5.9 12.2 27.5 Income tax expense (benefit) 15.1 15.3 11.3 Depreciation and depletion 23.4 25.1 85.4 Acc
Slide 23: Reconciliation of Non-GAAP Measures – Adjusted EBITDA
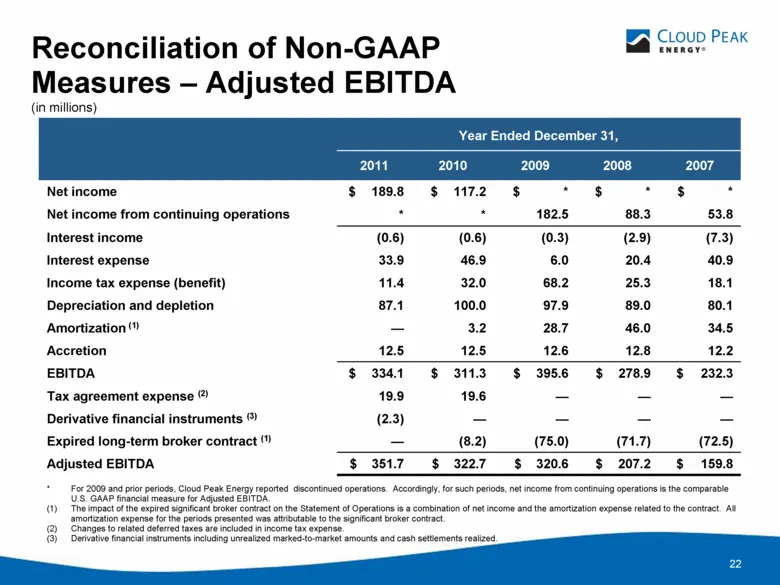
22 Reconciliation of Non-GAAP Measures – Adjusted EBITDA (in millions) Year Ended December 31, 2011 2010 2009 2008 2007 Net income $ 189.8 $ 117.2 $ * $ * $ * Net income from continuing operations * * 182.5 88.3 53.8 Interest income (0.6) (0.6) (0.3) (2.9) (7.3) Interest expense 33.9 46.9 6.0 20.4 4
Slide 24: Reconciliation of Non-GAAP Measures – Adjusted EPS
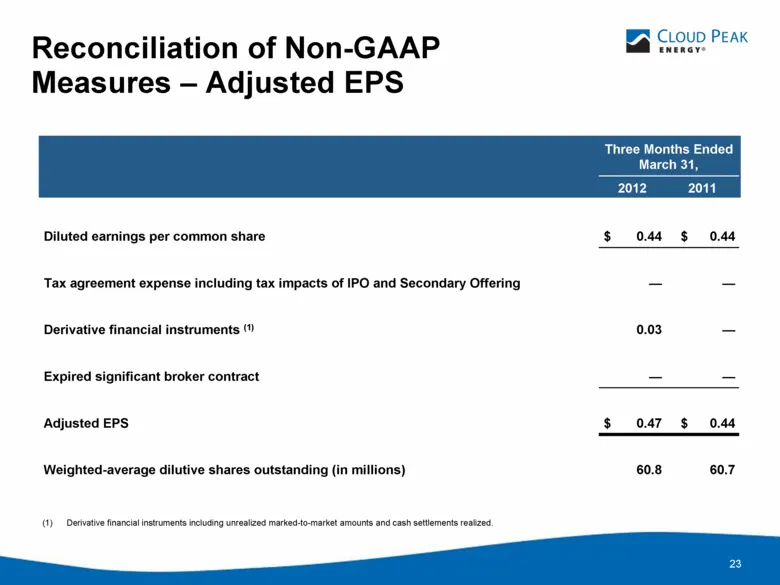
23 Reconciliation of Non-GAAP Measures – Adjusted EPS Three Months Ended March 31, 2012 2011 Diluted earnings per common share $ 0.44 $ 0.44 Tax agreement expense including tax impacts of IPO and Secondary Offering — — Derivative financial instruments (1) 0.03 — Expired significant broker contract —
Slide 25: Reconciliation of Non-GAAP Measures – Adjusted EPS
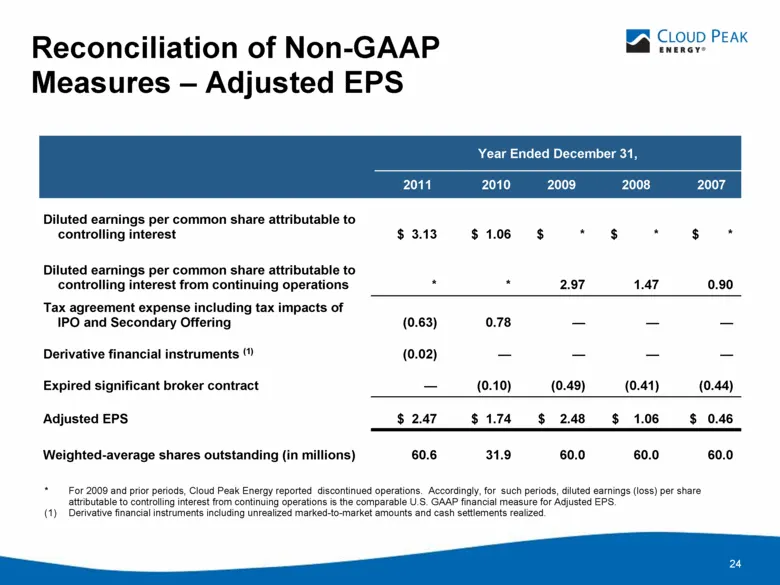
24 Diluted earnings per common share attributable to controlling interest $ 3.13 $ 1.06 $ * $ * $ * Diluted earnings per common share attributable to controlling interest from continuing operations * * 2.97 1.47 0.90 Tax agreement expense including tax impacts of IPO and Secondary Offering (0.63) 0.
Slide 26: Other Data
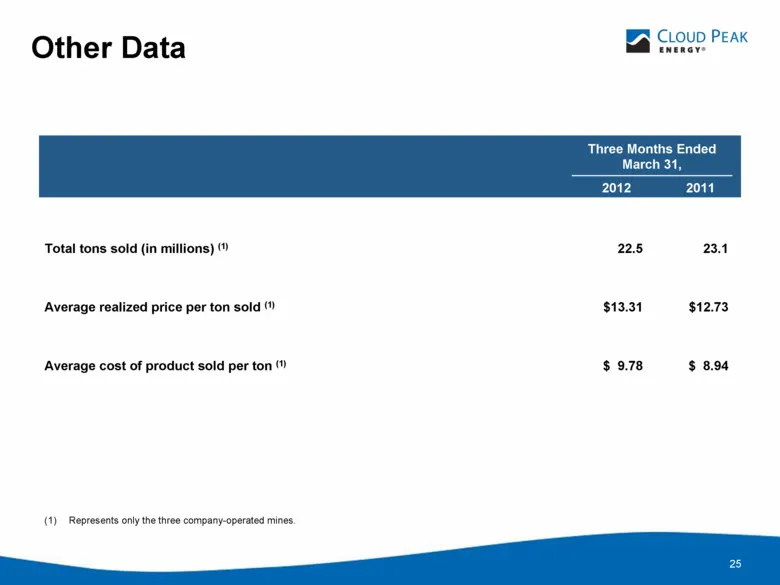
25 Other Data Three Months Ended March 31, 2012 2011 Total tons sold (in millions) (1) 22.5 23.1 Average realized price per ton sold (1) $13.31 $12.73 Average cost of product sold per ton (1) $ 9.78 $ 8.94 (1) Represents only the three company-operated mines.
Slide 27: Other Data
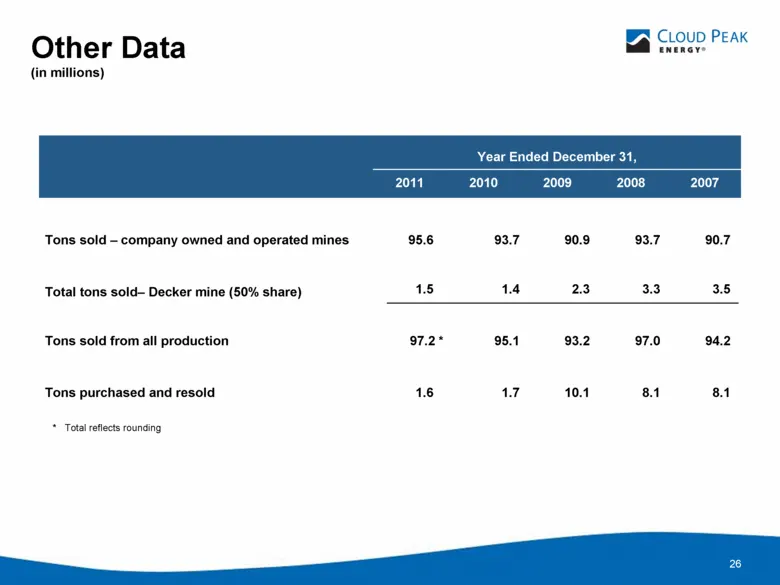
26 Other Data (in millions) Tons sold – company owned and operated mines 95.6 93.7 90.9 93.7 90.7 Total tons sold– Decker mine (50% share) 1.5 1.4 2.3 3.3 3.5 Tons sold from all production 97.2 * 95.1 93.2 97.0 94.2 Tons purchased and resold 1.6 1.7 10.1 8.1 8.1 Year Ended December 31, 2011 2010 200
Source: SEC EDGAR · 8-K filed Jun 19, 2012
More decks from Cloud Peak Energy Inc
 Investor Presentation (May 2019)56 slides · May 10, 2019
 Q3 2018 Earnings Presentation41 slides · Oct 30, 2018
 Shareholder Meeting (May 2018)21 slides · May 9, 2018
 FY2017 Earnings Presentation41 slides · Feb 23, 2018
 Investor Presentation (November 2017)39 slides · Nov 7, 2017
 Investor Presentation (August 2017)40 slides · Aug 7, 2017