Copano Energy L.L.C — Wachovia Pipeline and MLP Symposium (December 2008)
42 slides from Copano Energy L.L.C's conference presentation, Dec 9, 2008
Slide 1: Wachovia Pipeline and MLP Symposium
Wachovia Pipeline and MLP Symposium New York, NY NASDAQ: CPNO December 9, 2008
Slide 2: Disclaimer
2 Disclaimer Statements made by representatives of Copano Energy, L.L.C. ("Copano") during this presentation will include "forward-looking statements," as defined in the federal securities laws. All statements that address activities, events or developments that Copano expects, believes or anticipat
Slide 3: Introduction to Copano
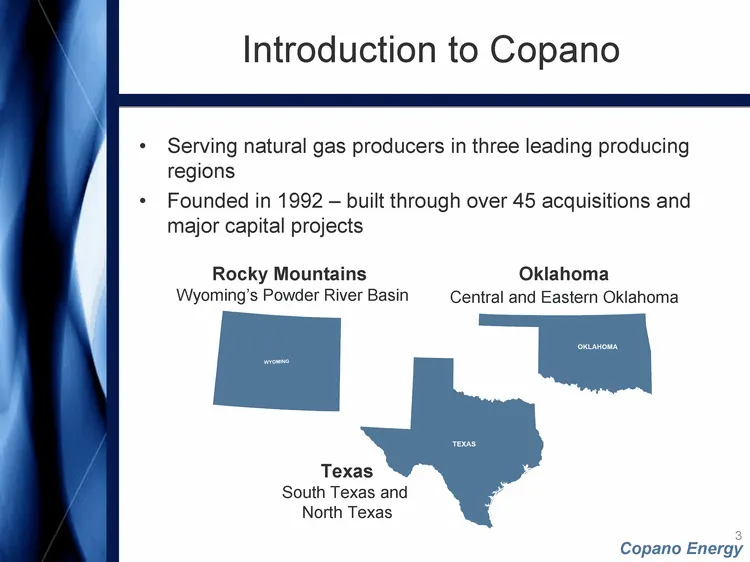
3 Introduction to Copano Serving natural gas producers in three leading producing regions Founded in 1992 - built through over 45 acquisitions and major capital projects Texas South Texas and North Texas Oklahoma Central and Eastern Oklahoma Rocky Mountains Wyoming's Powder River Basin
Slide 4: Introduction to Copano
4 Introduction to Copano Service throughput volumes approximate 1,700,000 MMBtu per day of natural gas(1) Equity market cap: $640 million(2) Enterprise value: $1.3 billion(2) Copano has outperformed its peer group since IPO with a total return of 35%(2) compared to the Alerian MLP Total Return Index
Slide 5: Copano's LLC Structure
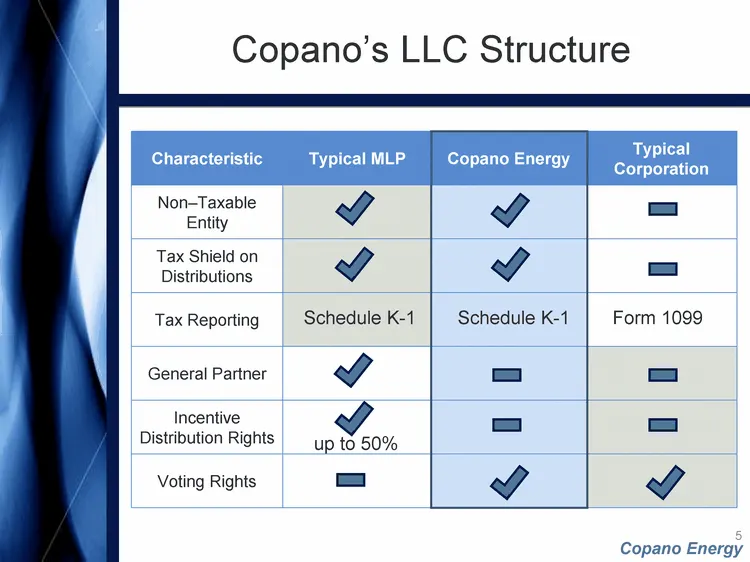
5 Copano's LLC Structure Characteristic Typical MLP Copano Energy Typical Corporation Non-Taxable Entity Tax Shield on Distributions Tax Reporting General Partner Incentive Distribution Rights Voting Rights up to 50% Schedule K-1 Schedule K-1 Form 1099
Slide 6: Today's Agenda
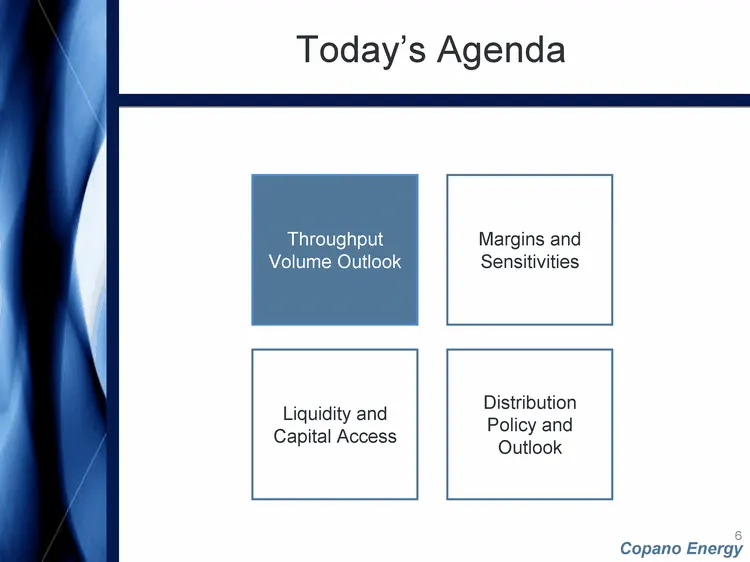
6 Today's Agenda Throughput Volume Outlook Margins and Sensitivities Liquidity and Capital Access Distribution Policy and Outlook
Slide 7: Oklahoma Volume Outlook
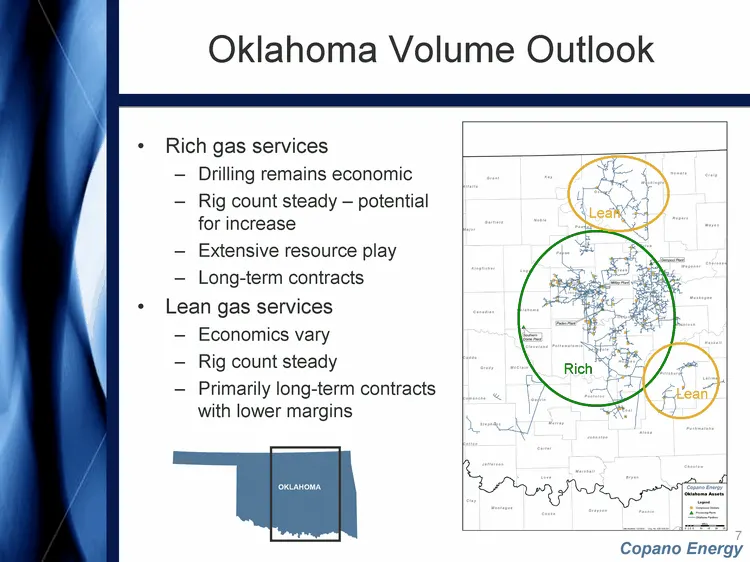
7 Rich gas services Drilling remains economic Rig count steady - potential for increase Extensive resource play Long-term contracts Lean gas services Economics vary Rig count steady Primarily long-term contracts with lower margins Oklahoma Volume Outlook Rich Lean Lean
Slide 8: Texas Volume Outlook
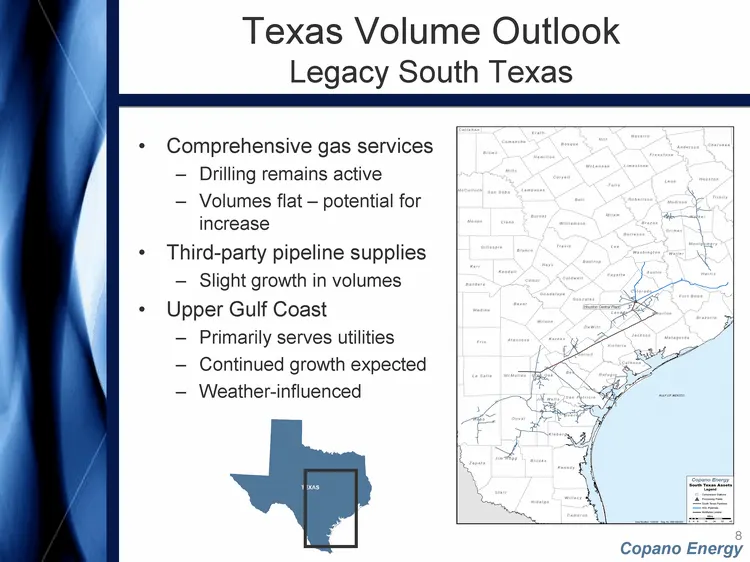
8 Texas Volume Outlook Legacy South Texas Comprehensive gas services Drilling remains active Volumes flat - potential for increase Third-party pipeline supplies Slight growth in volumes Upper Gulf Coast Primarily serves utilities Continued growth expected Weather-influenced
Slide 9: Texas Volume Outlook - North Texas
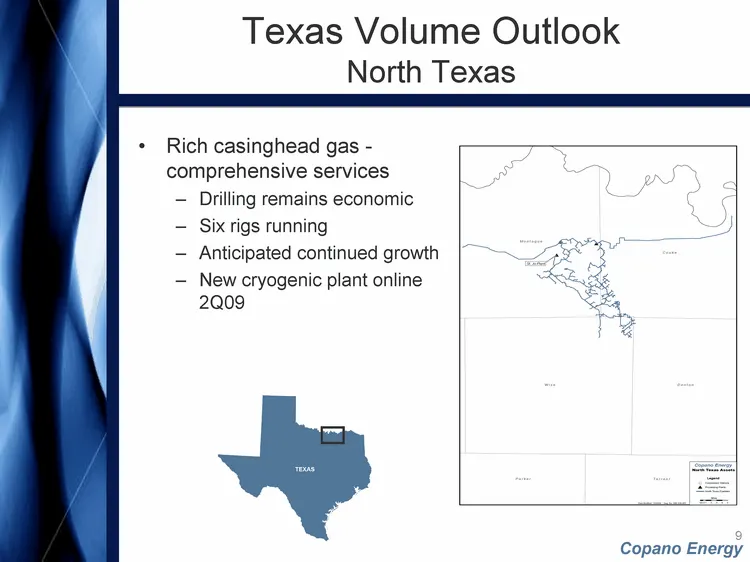
9 Texas Volume Outlook North Texas Rich casinghead gas - comprehensive services Drilling remains economic Six rigs running Anticipated continued growth New cryogenic plant online 2Q09
Slide 10: Rocky Mountains Volume Outlook - Bighorn
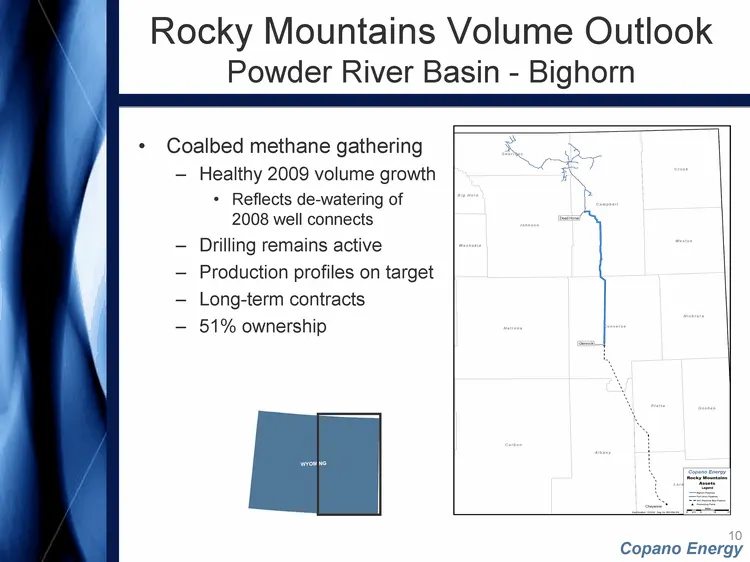
10 Rocky Mountains Volume Outlook Powder River Basin - Bighorn Coalbed methane gathering Healthy 2009 volume growth Reflects de-watering of 2008 well connects Drilling remains active Production profiles on target Long-term contracts 51% ownership
Slide 11: Rocky Mountains Volume Outlook - Fort Union
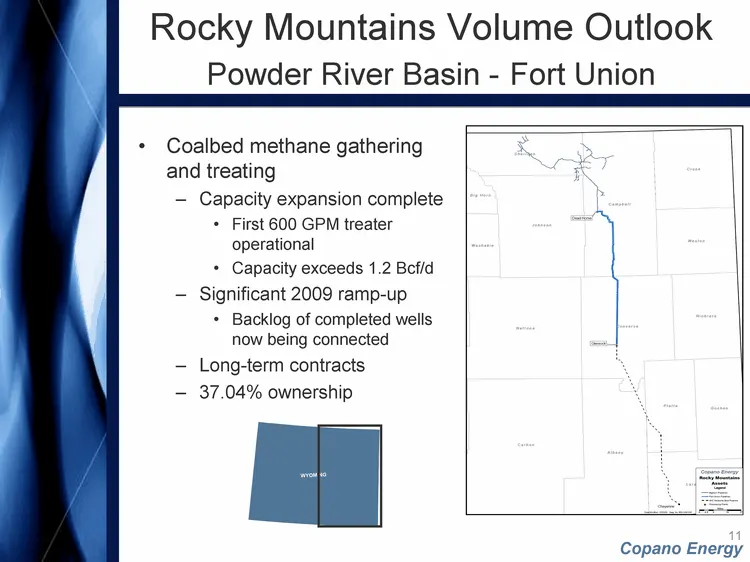
11 Rocky Mountains Volume Outlook Powder River Basin - Fort Union Coalbed methane gathering and treating Capacity expansion complete First 600 GPM treater operational Capacity exceeds 1.2 Bcf/d Significant 2009 ramp-up Backlog of completed wells now being connected Long-term contracts 37.04% ownersh
Slide 12: Margins and Sensitivities
12 Margins and Sensitivities Margins and Sensitivities Distribution Policy and Outlook Liquidity and Capital Access Throughput Volume Outlook
Slide 13: Oklahoma Contract Mix
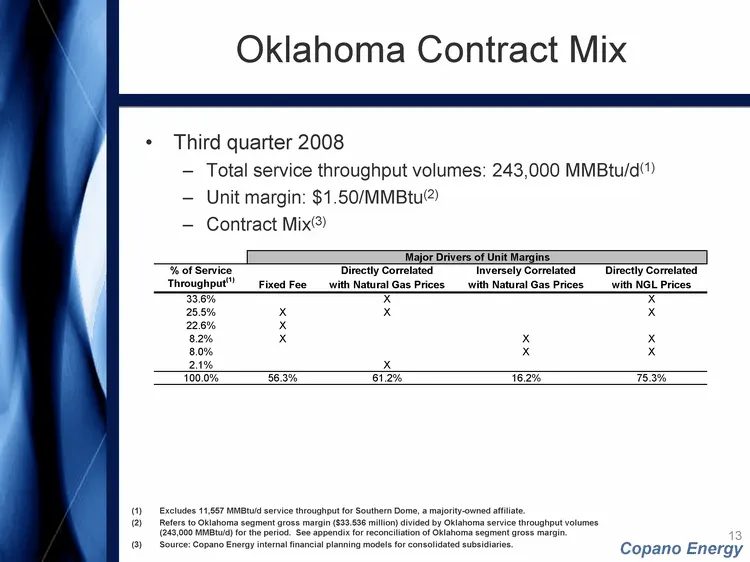
13 Oklahoma Contract Mix Third quarter 2008 Total service throughput volumes: 243,000 MMBtu/d(1) Unit margin: $1.50/MMBtu(2) Contract Mix(3) Excludes 11,557 MMBtu/d service throughput for Southern Dome, a majority-owned affiliate. Refers to Oklahoma segment gross margin ($33.536 million) divided by
Slide 14: Oklahoma Volumes
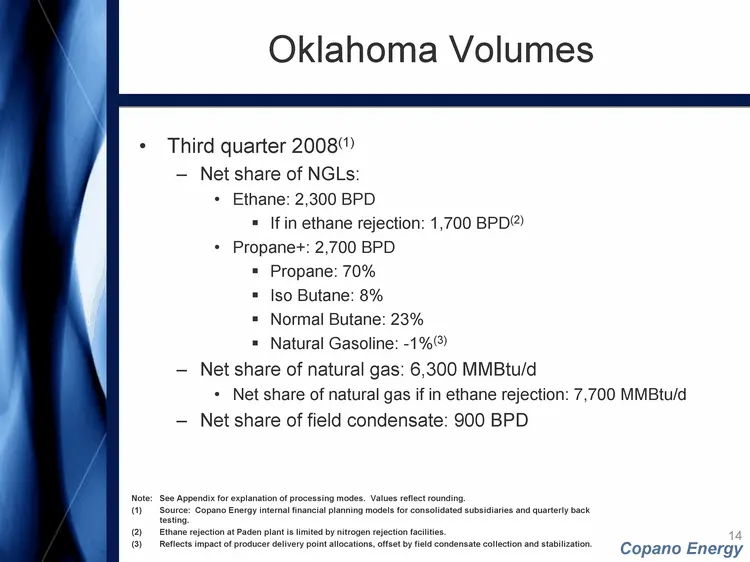
14 Oklahoma Volumes Third quarter 2008(1) Net share of NGLs: Ethane: 2,300 BPD If in ethane rejection: 1,700 BPD(2) Propane+: 2,700 BPD Propane: 70% Iso Butane: 8% Normal Butane: 23% Natural Gasoline: -1%(3) Net share of natural gas: 6,300 MMBtu/d Net share of natural gas if in ethane rejection: 7,7
Slide 15: Oklahoma Margin Sensitivities - Full Recovery
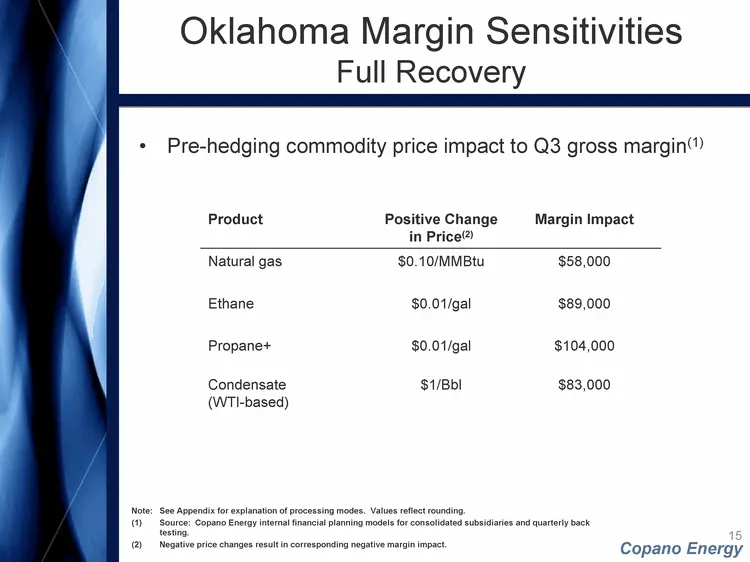
15 Oklahoma Margin Sensitivities Full Recovery Pre-hedging commodity price impact to Q3 gross margin(1) Product Positive Change in Price(2) Margin Impact Natural gas $0.10/MMBtu $58,000 Ethane $0.01/gal $89,000 Propane+ $0.01/gal $104,000 Condensate (WTI-based) $1/Bbl $83,000 Note: See Appendix for
Slide 16: Oklahoma Margin Sensitivities - Ethane Rejection
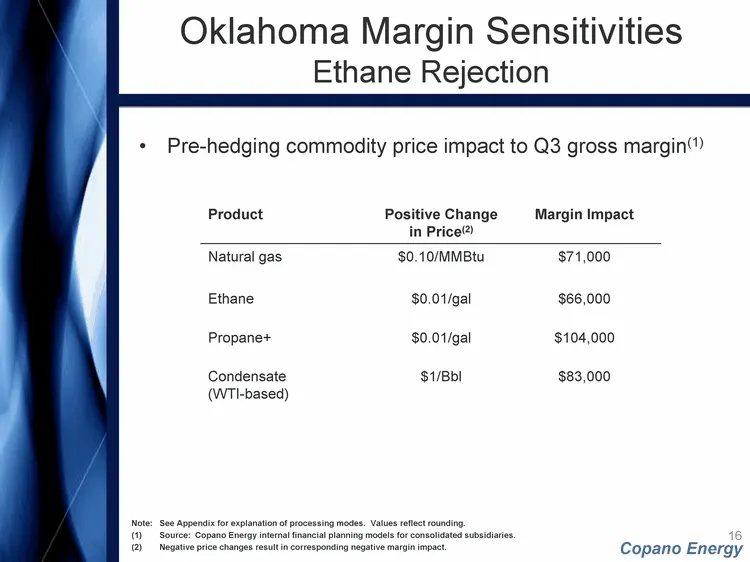
16 Oklahoma Margin Sensitivities Ethane Rejection Pre-hedging commodity price impact to Q3 gross margin(1) Product Positive Change in Price(2) Margin Impact Natural gas $0.10/MMBtu $71,000 Ethane $0.01/gal $66,000 Propane+ $0.01/gal $104,000 Condensate (WTI-based) $1/Bbl $83,000 Note: See Appendix f
Slide 17: Texas Contract Mix
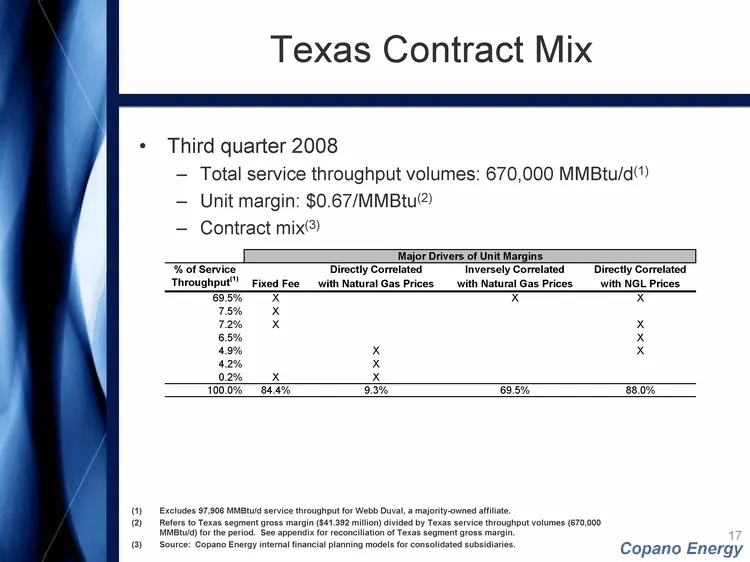
17 Texas Contract Mix Third quarter 2008 Total service throughput volumes: 670,000 MMBtu/d(1) Unit margin: $0.67/MMBtu(2) Contract mix(3) Excludes 97,906 MMBtu/d service throughput for Webb Duval, a majority-owned affiliate. Refers to Texas segment gross margin ($41.392 million) divided by Texas ser
Slide 18: Texas Volumes
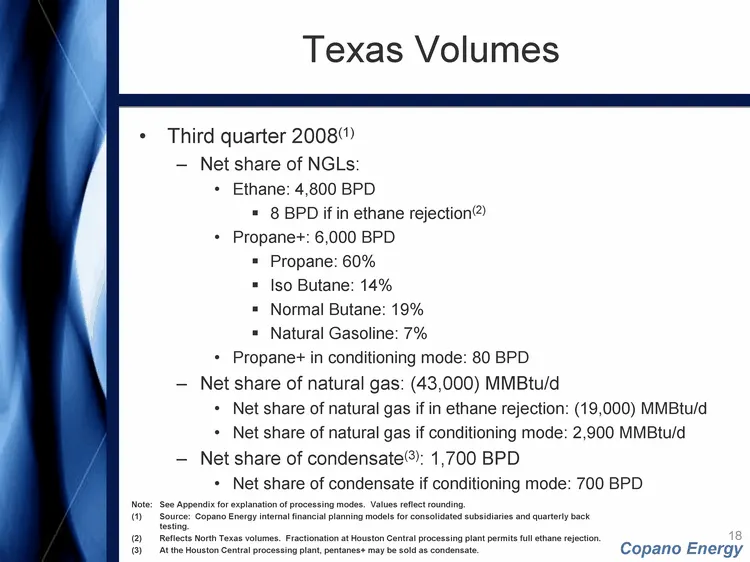
18 Texas Volumes Third quarter 2008(1) Net share of NGLs: Ethane: 4,800 BPD 8 BPD if in ethane rejection(2) Propane+: 6,000 BPD Propane: 60% Iso Butane: 14% Normal Butane: 19% Natural Gasoline: 7% Propane+ in conditioning mode: 80 BPD Net share of natural gas: (43,000) MMBtu/d Net share of natural g
Slide 19: Texas Margin Sensitivities - Full Recovery
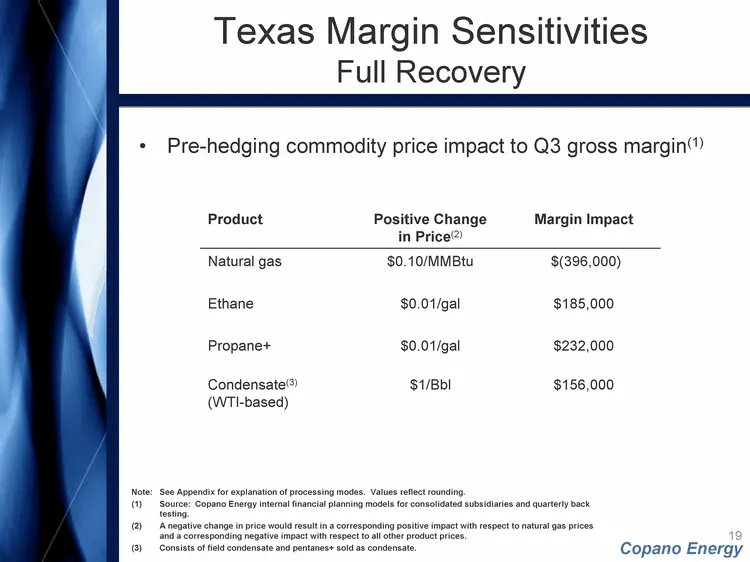
19 Texas Margin Sensitivities Full Recovery Pre-hedging commodity price impact to Q3 gross margin(1) Product Positive Change in Price(2) Margin Impact Natural gas $0.10/MMBtu $(396,000) Ethane $0.01/gal $185,000 Propane+ $0.01/gal $232,000 Condensate(3) (WTI-based) $1/Bbl $156,000 Note: See Appendix
Slide 20: Texas Margin Sensitivities - Ethane Rejection
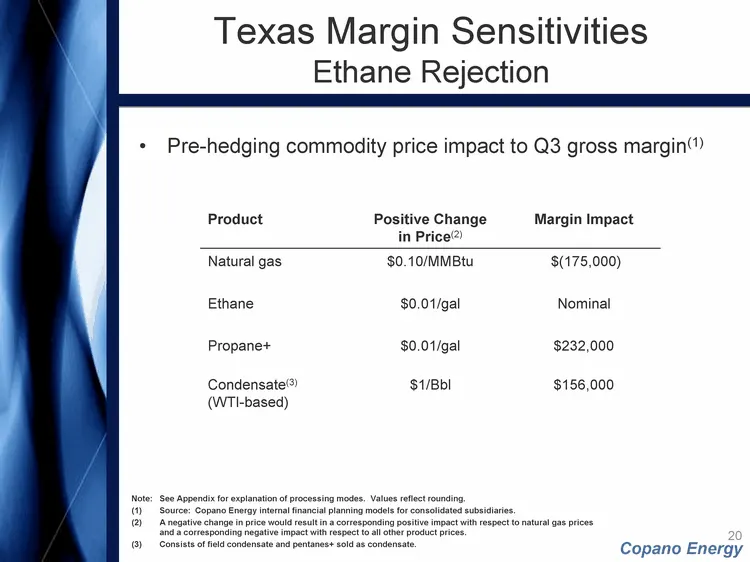
20 Texas Margin Sensitivities Ethane Rejection Pre-hedging commodity price impact to Q3 gross margin(1) Product Positive Change in Price(2) Margin Impact Natural gas $0.10/MMBtu $(175,000) Ethane $0.01/gal Nominal Propane+ $0.01/gal $232,000 Condensate(3) (WTI-based) $1/Bbl $156,000 Note: See Append
Slide 21: Texas Margin Sensitivities - Conditioning Mode
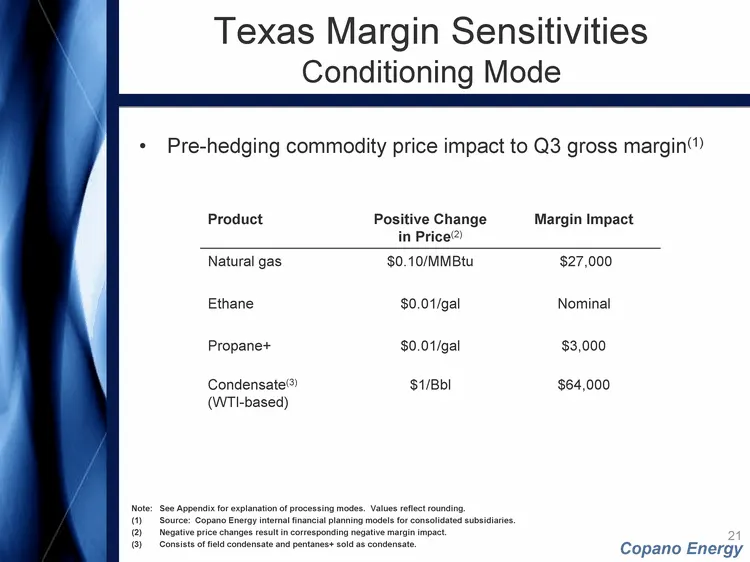
21 Texas Margin Sensitivities Conditioning Mode Pre-hedging commodity price impact to Q3 gross margin(1) Product Positive Change in Price(2) Margin Impact Natural gas $0.10/MMBtu $27,000 Ethane $0.01/gal Nominal Propane+ $0.01/gal $3,000 Condensate(3) (WTI-based) $1/Bbl $64,000 Note: See Appendix fo
Slide 22: Rocky Mountains Volumes and Sensitivities
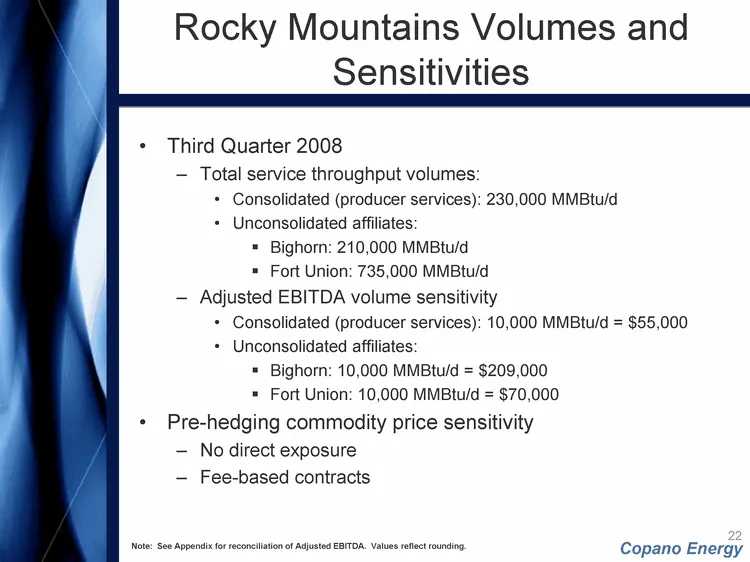
22 Rocky Mountains Volumes and Sensitivities Third Quarter 2008 Total service throughput volumes: Consolidated (producer services): 230,000 MMBtu/d Unconsolidated affiliates: Bighorn: 210,000 MMBtu/d Fort Union: 735,000 MMBtu/d Adjusted EBITDA volume sensitivity Consolidated (producer services): 10,
Slide 23: Hedging Impact 2009 NGLs
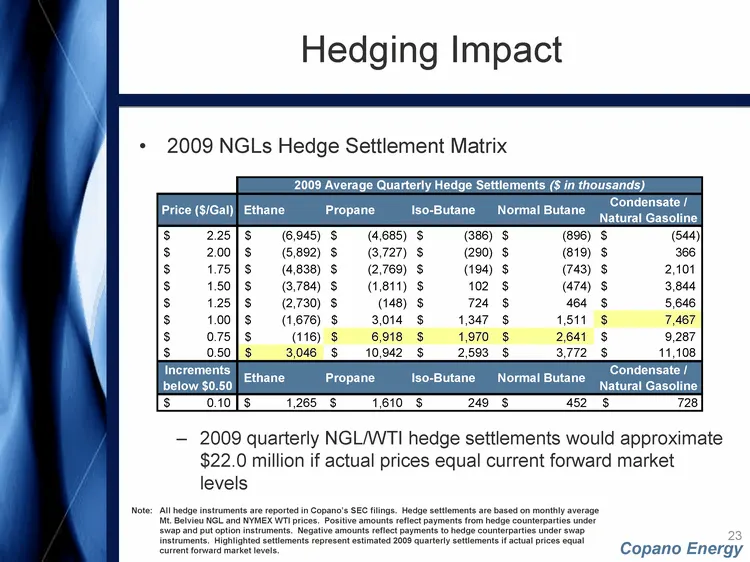
23 Hedging Impact 2009 NGLs Hedge Settlement Matrix 2009 quarterly NGL/WTI hedge settlements would approximate $22.0 million if actual prices equal current forward market levels Note: All hedge instruments are reported in Copano's SEC filings. Hedge settlements are based on monthly average Mt. Belvi
Slide 24: Hedging Impact 2010 NGLs
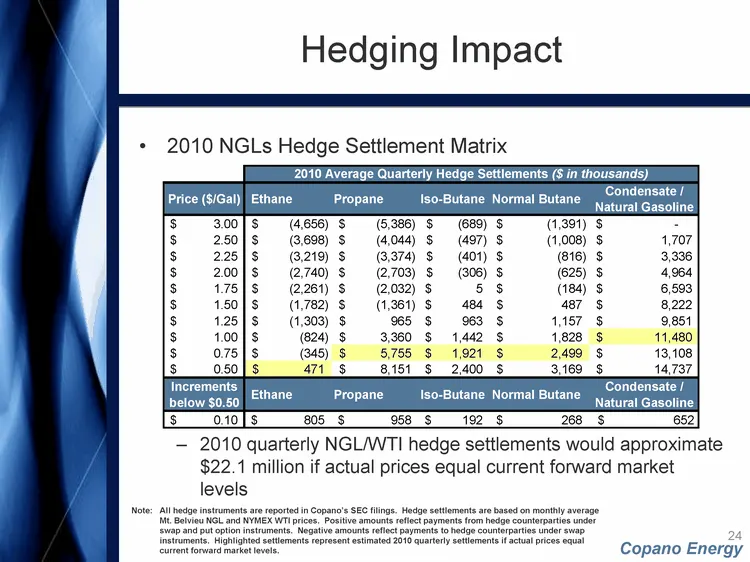
24 Hedging Impact 2010 NGLs Hedge Settlement Matrix 2010 quarterly NGL/WTI hedge settlements would approximate $22.1 million if actual prices equal current forward market levels Note: All hedge instruments are reported in Copano's SEC filings. Hedge settlements are based on monthly average Mt. Belvi
Slide 25: Hedging Impact 2009 and 2010 Natural Gas
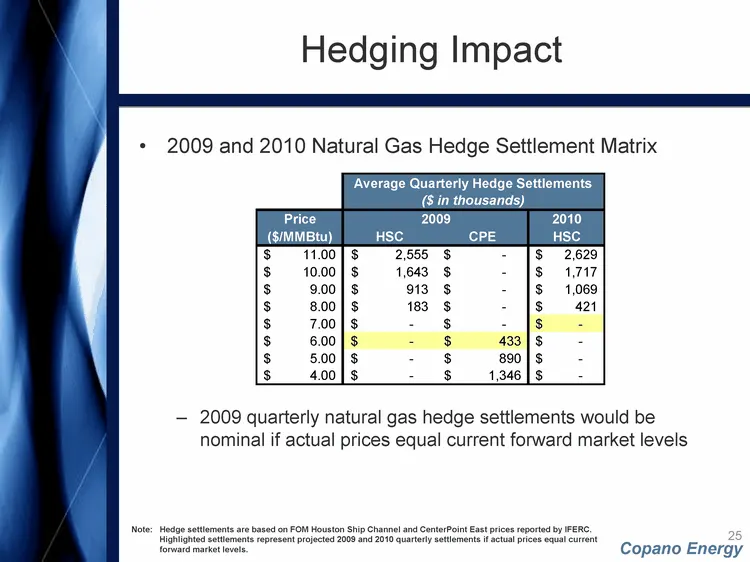
25 Hedging Impact 2009 and 2010 Natural Gas Hedge Settlement Matrix 2009 quarterly natural gas hedge settlements would be nominal if actual prices equal current forward market levels Note: Hedge settlements are based on FOM Houston Ship Channel and CenterPoint East prices reported by IFERC. Highligh
Slide 26: Liquidity and Capital Access
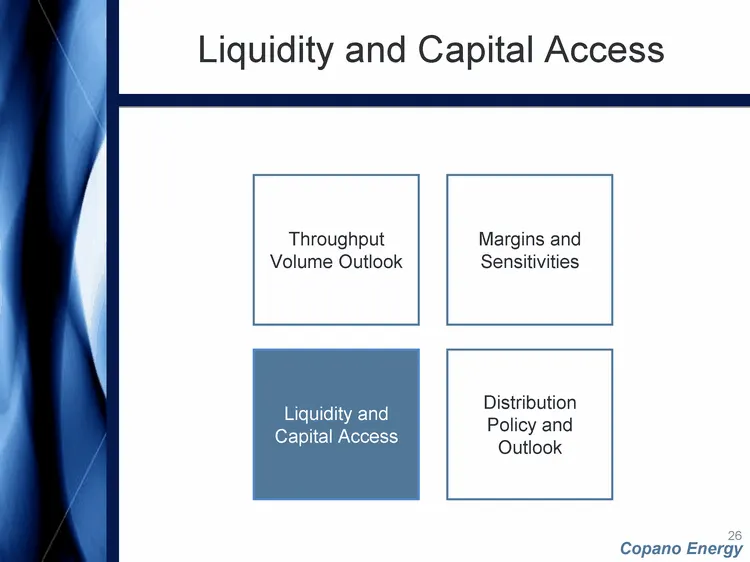
26 Liquidity and Capital Access Liquidity and Capital Access Distribution Policy and Outlook Margins and Sensitivities Throughput Volume Outlook
Slide 27: Liquidity
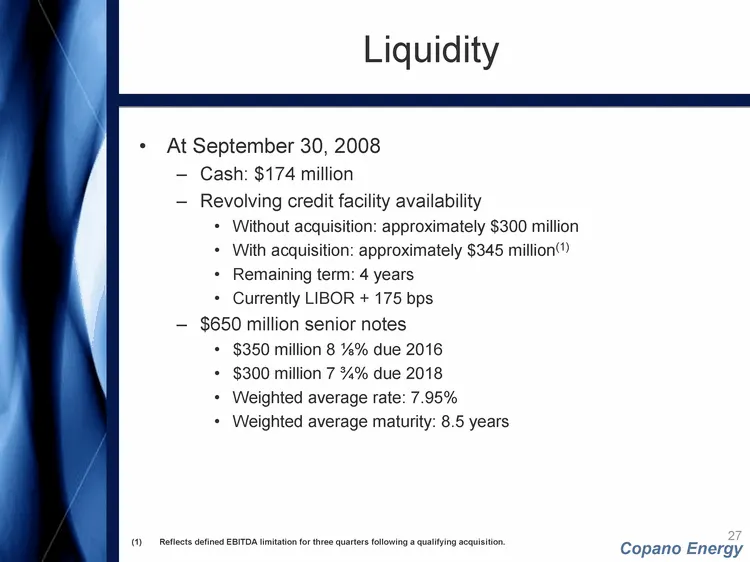
27 Liquidity At September 30, 2008 Cash: $174 million Revolving credit facility availability Without acquisition: approximately $300 million With acquisition: approximately $345 million(1) Remaining term: 4 years Currently LIBOR + 175 bps $650 million senior notes $350 million 8 ^% due 2016 $300 mil
Slide 28: Key Debt Terms and Covenants - Credit Facility
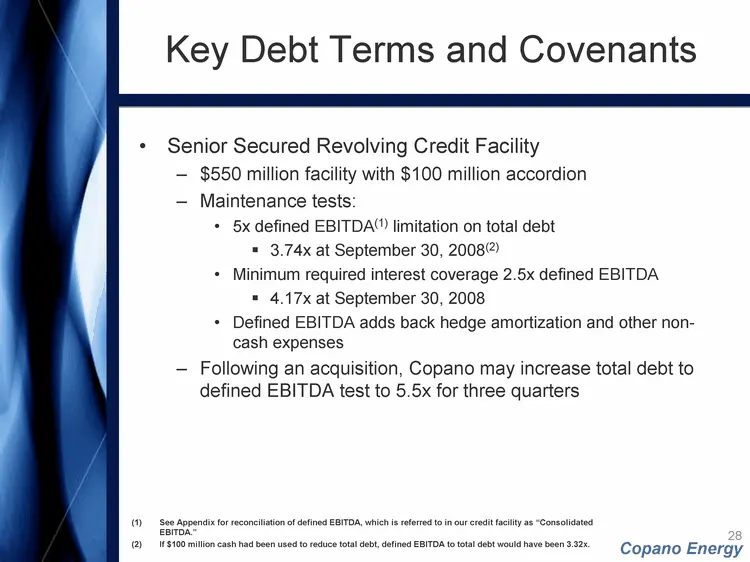
28 Key Debt Terms and Covenants Senior Secured Revolving Credit Facility $550 million facility with $100 million accordion Maintenance tests: 5x defined EBITDA(1) limitation on total debt 3.74x at September 30, 2008(2) Minimum required interest coverage 2.5x defined EBITDA 4.17x at September 30, 200
Slide 29: Key Debt Terms and Covenants - Senior Notes
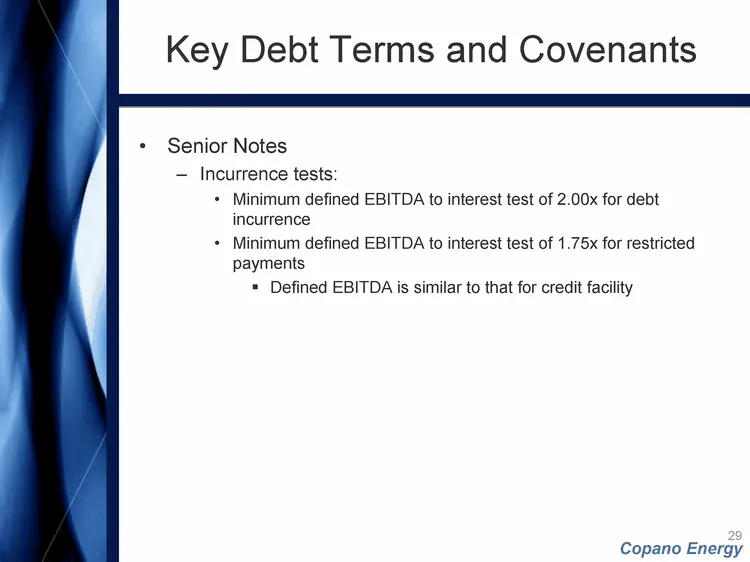
29 Key Debt Terms and Covenants Senior Notes Incurrence tests: Minimum defined EBITDA to interest test of 2.00x for debt incurrence Minimum defined EBITDA to interest test of 1.75x for restricted payments Defined EBITDA is similar to that for credit facility
Slide 30: Capital Access
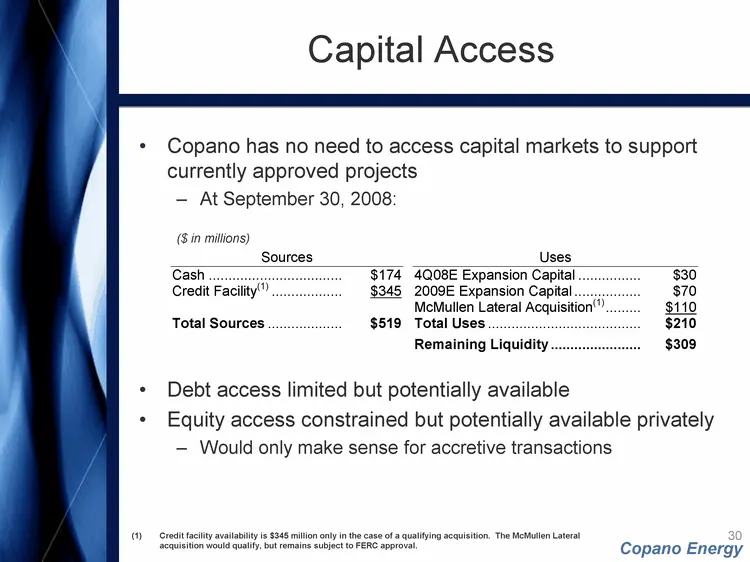
30 Capital Access Copano has no need to access capital markets to support currently approved projects At September 30, 2008: ($ in millions) Debt access limited but potentially available Equity access constrained but potentially available privately Would only make sense for accretive transactions Cr
Slide 31: Distribution Policy and Outlook
31 Distribution Policy and Outlook Distribution Policy and Outlook Liquidity and Capital Access Margins and Sensitivities Throughput Volume Outlook
Slide 32: Limited Liability Company Agreement
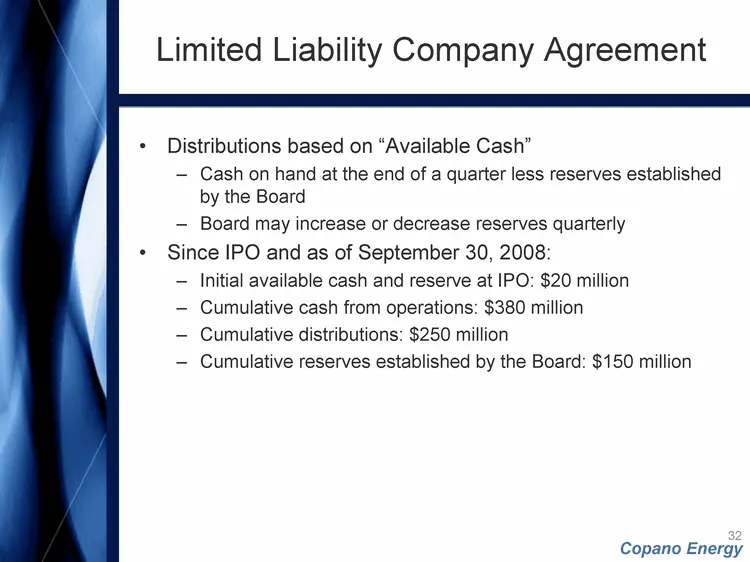
32 Limited Liability Company Agreement Distributions based on "Available Cash" Cash on hand at the end of a quarter less reserves established by the Board Board may increase or decrease reserves quarterly Since IPO and as of September 30, 2008: Initial available cash and reserve at IPO: $20 million
Slide 33: Distribution Track Record
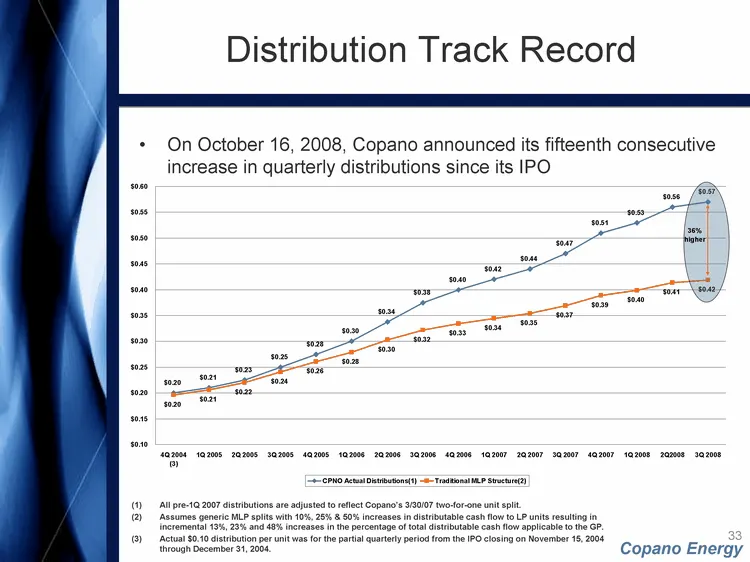
33 Distribution Track Record On October 16, 2008, Copano announced its fifteenth consecutive increase in quarterly distributions since its IPO All pre-1Q 2007 distributions are adjusted to reflect Copano's 3/30/07 two-for-one unit split. Assumes generic MLP splits with 10%, 25% & 50% increases in di
Slide 34: Distribution Outlook
34 Distribution Outlook Key drivers: Growth of Rocky Mountains volumes North Texas cryogenic plant and volume growth Oklahoma volume growth Transco McMullen Lateral spin-down and successful integration in South Texas Balance sheet management Cost management Commodity price trends Hedge portfolio imp
Slide 35: Oil Price Trends
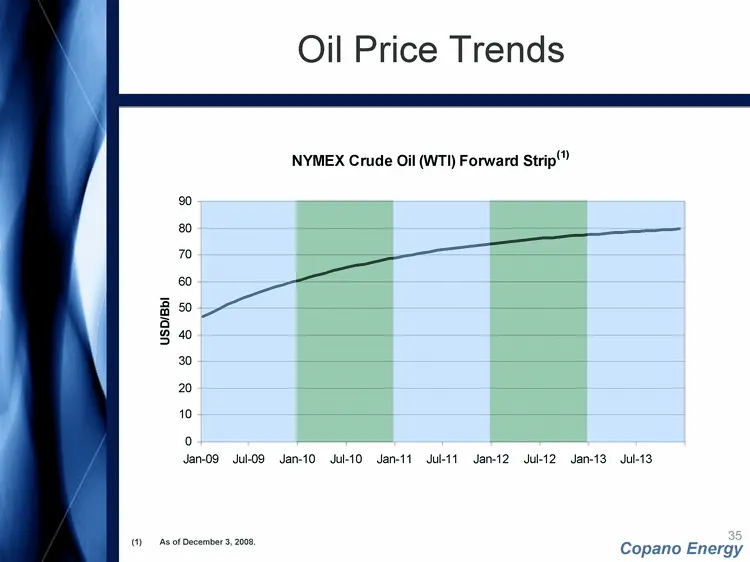
35 Oil Price Trends As of December 3, 2008.
Slide 36: Natural Gas Price Trends
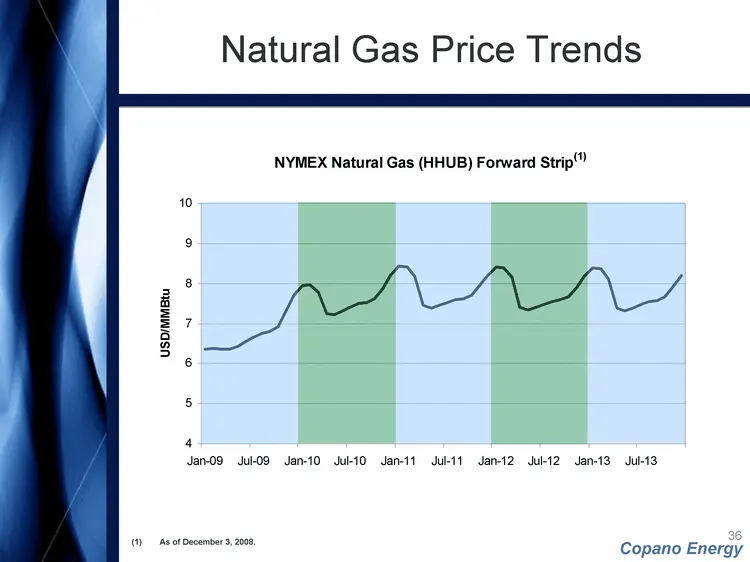
36 Natural Gas Price Trends As of December 3, 2008.
Slide 37: Appendix
Appendix Copano Energy
Slide 38: Reconciliation of Non-GAAP Financial Measures - Segment Gross Margin
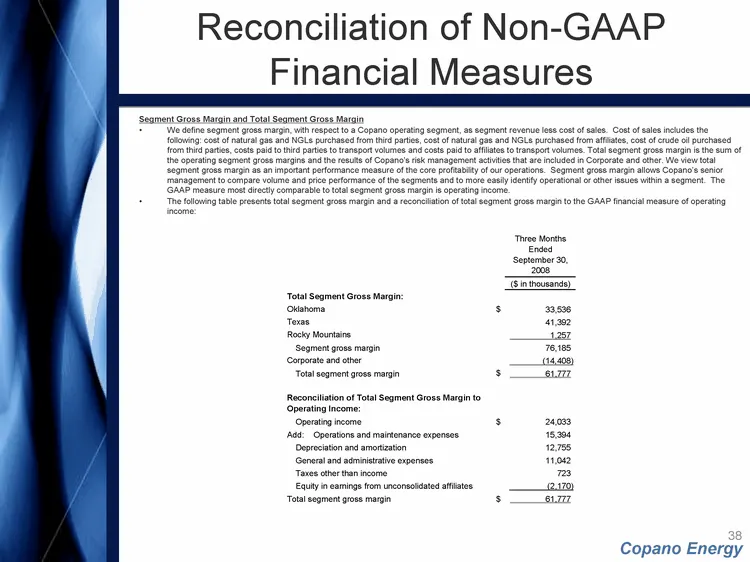
38 Reconciliation of Non-GAAP Financial Measures Segment Gross Margin and Total Segment Gross Margin We define segment gross margin, with respect to a Copano operating segment, as segment revenue less cost of sales. Cost of sales includes the following: cost of natural gas and NGLs purchased from th
Slide 39: Reconciliation of Non-GAAP Financial Measures - Adjusted EBITDA
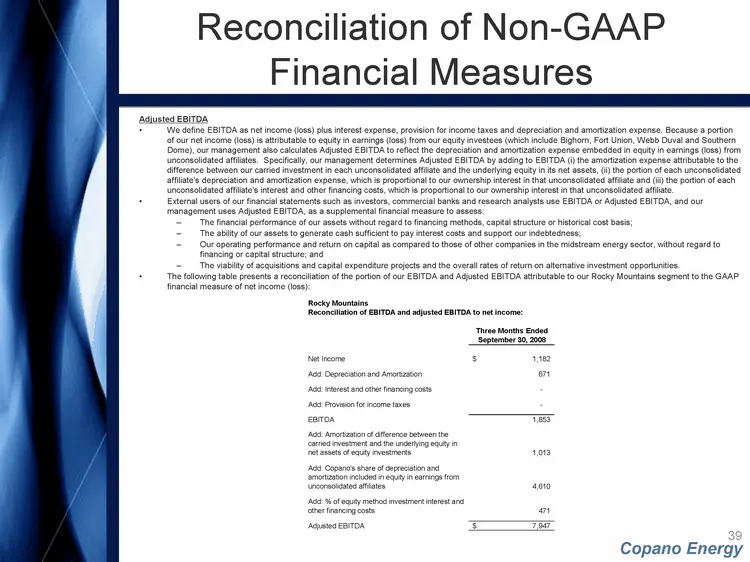
39 Reconciliation of Non-GAAP Financial Measures Adjusted EBITDA We define EBITDA as net income (loss) plus interest expense, provision for income taxes and depreciation and amortization expense. Because a portion of our net income (loss) is attributable to equity in earnings (loss) from our equity
Slide 40: Reconciliation of Non-GAAP Financial Measures - Consolidated EBITDA
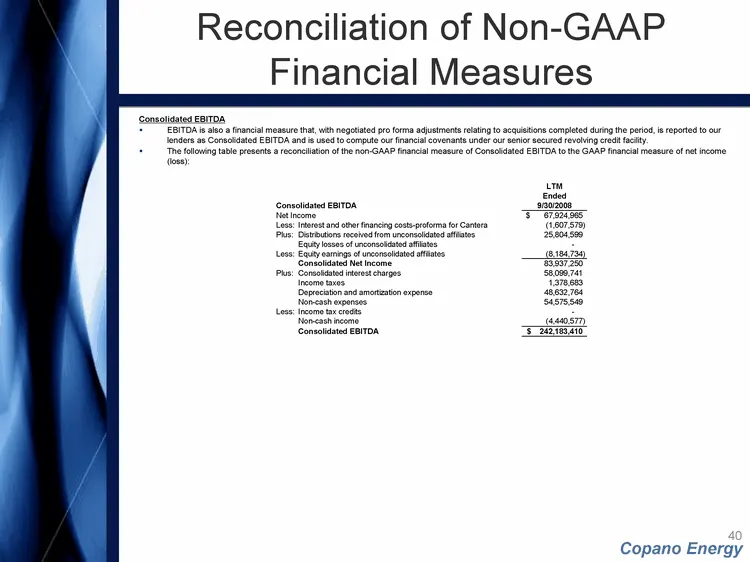
40 Reconciliation of Non-GAAP Financial Measures Consolidated EBITDA EBITDA is also a financial measure that, with negotiated pro forma adjustments relating to acquisitions completed during the period, is reported to our lenders as Consolidated EBITDA and is used to compute our financial covenants u
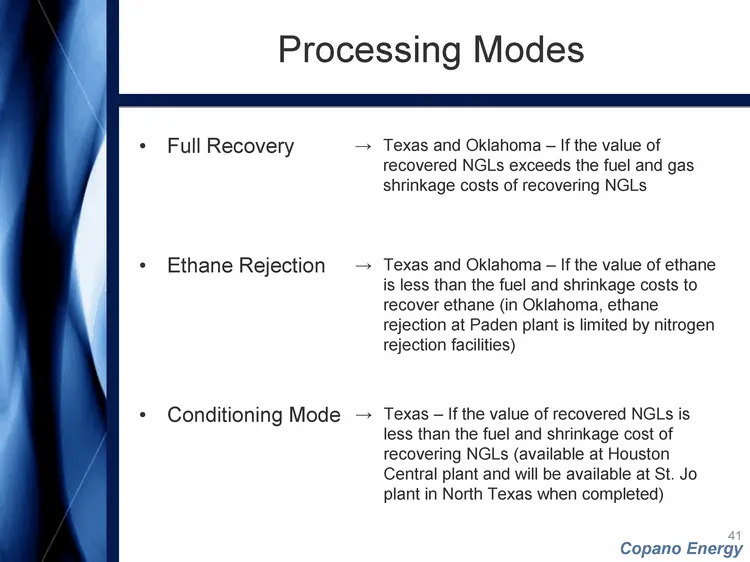
Slide 41: Processing Modes
41 Processing Modes Full Recovery Ethane Rejection Conditioning Mode Texas and Oklahoma - If the value of recovered NGLs exceeds the fuel and gas shrinkage costs of recovering NGLs Texas - If the value of recovered NGLs is less than the fuel and shrinkage cost of recovering NGLs (available at Housto
Slide 42: Copano Energy
Copano Energy NASDAQ: CPNO. December 2008
Source: SEC EDGAR · 8-K filed Dec 9, 2008
More decks from Copano Energy L.L.C.
 2012 RBC Capital Markets MLP Conference35 slides · Nov 15, 2012
 2012 Citi One-on-One MLP/Midstream Infrastructure Conference35 slides · Aug 21, 2012
 Investor Presentation (June 2012)34 slides · Jun 18, 2012
 NAPTP 2012 MLP Investor Conference34 slides · May 22, 2012
 Morgan Stanley MLP and Diversified Natural Gas Corporate Access Day 201245 slides · Mar 7, 2012
 2011 RBC Capital Markets MLP Conference42 slides · Nov 17, 2011