Fauquier Bankshares — Investor Presentation (May 2011)
46 slides from Fauquier Bankshares's investor presentation, May 19, 2011

Slide 1: Deeply rooted in our community
Deeply rooted in our community. May 17, 2011
Slide 2: Safe Harbor Statement
2 FAUQUIER BANKSHARES, INC. Safe Harbor Statement Today’s presentations may include forward-looking statements. These statements represent the company's beliefs regarding future events that, by their nature, are uncertain and outside of the company’s control. The company’s actual results and financi
Slide 3: Recession….and Aftermath
3 FAUQUIER BANKSHARES, INC. Recession….and Aftermath Recession began in late 2007 and “ended” late 2009. The post-recessionary impacts during 2010 and 2011 include: Ø National uncertainty regarding employment, commodity prices, regulation and taxation, etc. Ø Businesses reluctant to make changes. Ø
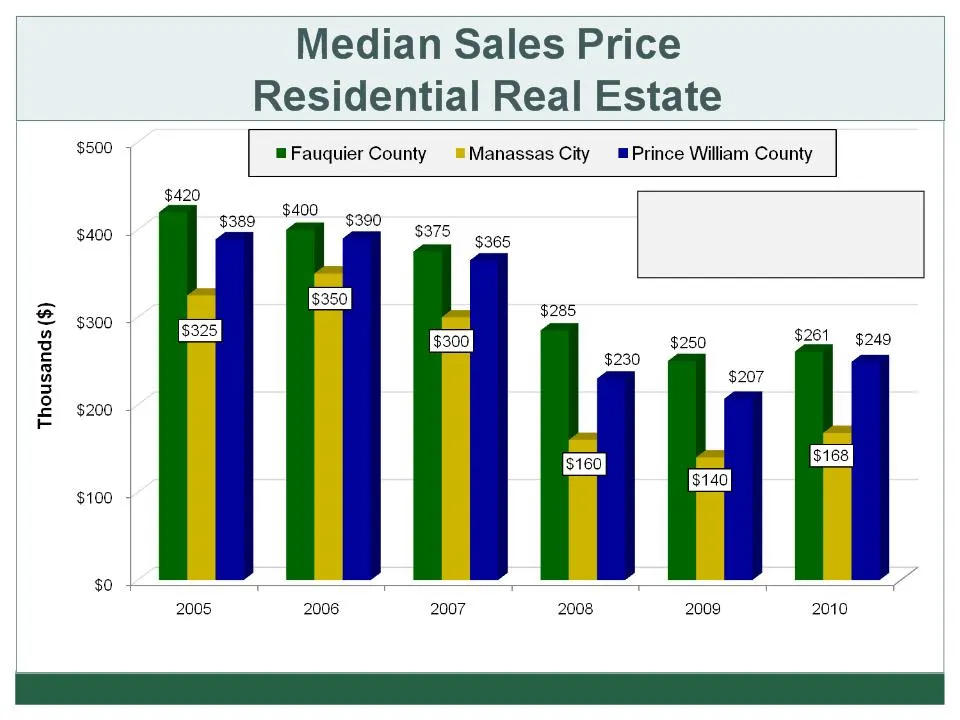
Slide 4: Percent Change in Foreclosures (2010-2009)
4 FAUQUIER BANKSHARES, INC . Source: MRIS Percent Change (2010 - 2009) Fauquier 4.40% Manassas City 20.00% Prince William County 20.29%
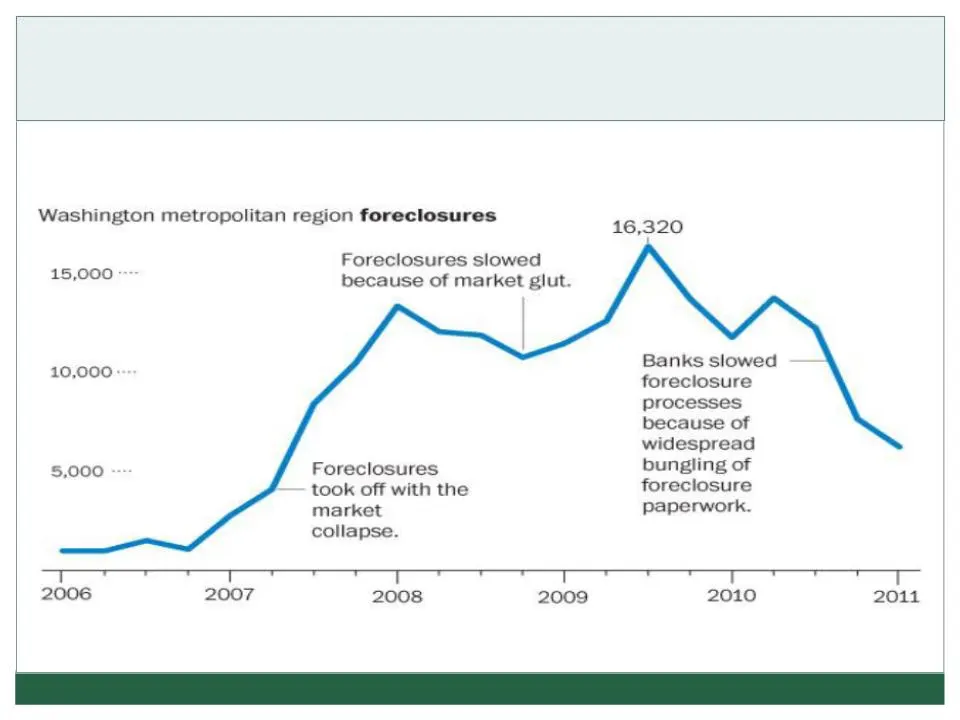
Slide 5: Foreclosures fall in D.C. Region
FAUQUIER BANKSHARES, INC. 5 Foreclosures fall in D. C. Region Bank industry experts say, however, that home foreclosures probably will pick up now that lenders have lifted a moratorium that allowed them to sort through foreclosure paperwork errors. SOURCE: RealtyTrac. The Washington Post. Published
Slide 6: Unemployment Rates
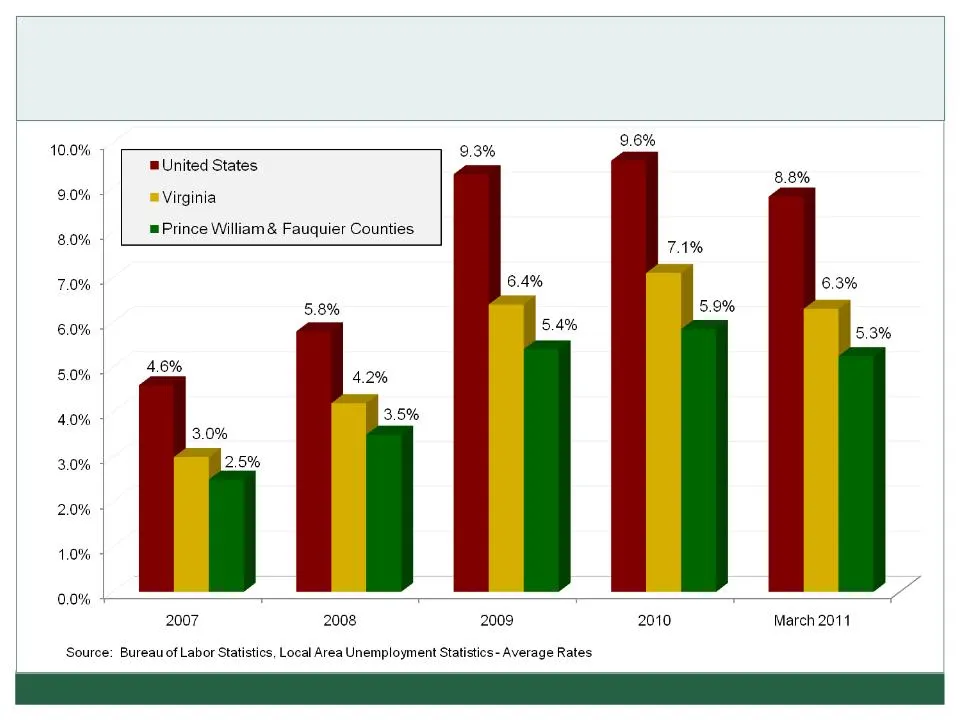
6 FAUQUIER BANKSHARES, INC . Unemployment Rates
Slide 7: Bank Failures and Bank Stocks
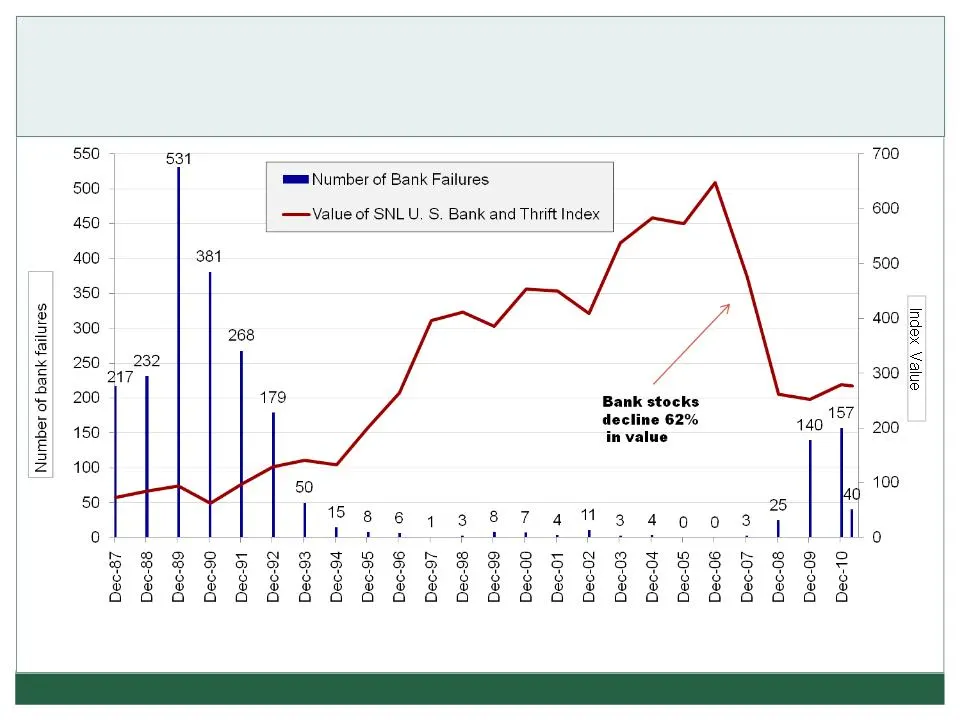
7 FAUQUIER BANKSHARES, INC. Bank Failures and Bank Stocks 1987 - 2011 Sources: SNL Financial and FDIC Number of bank failures excludes transactions classified by the FDIC as “assistance transactions”.
Slide 8: Dividend Data - Banking Industry
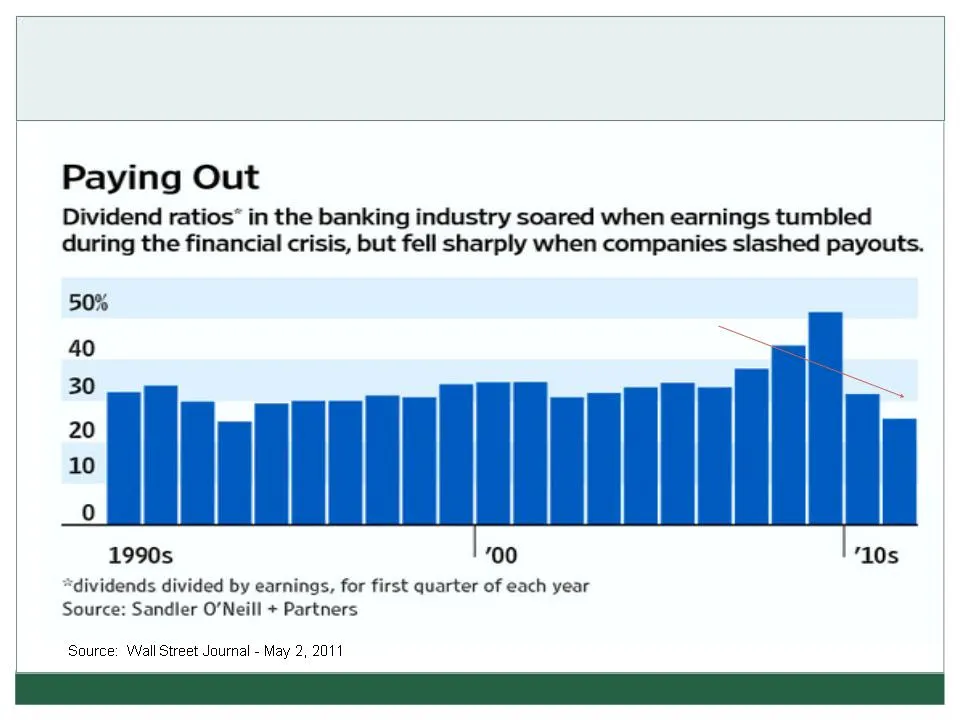
FAUQUIER BANKSHARES, INC. 8 Dividend Data - Banking Industry Dividends cut over 50% nationwide
Slide 9: Stock Chart - Price/Tangible Book
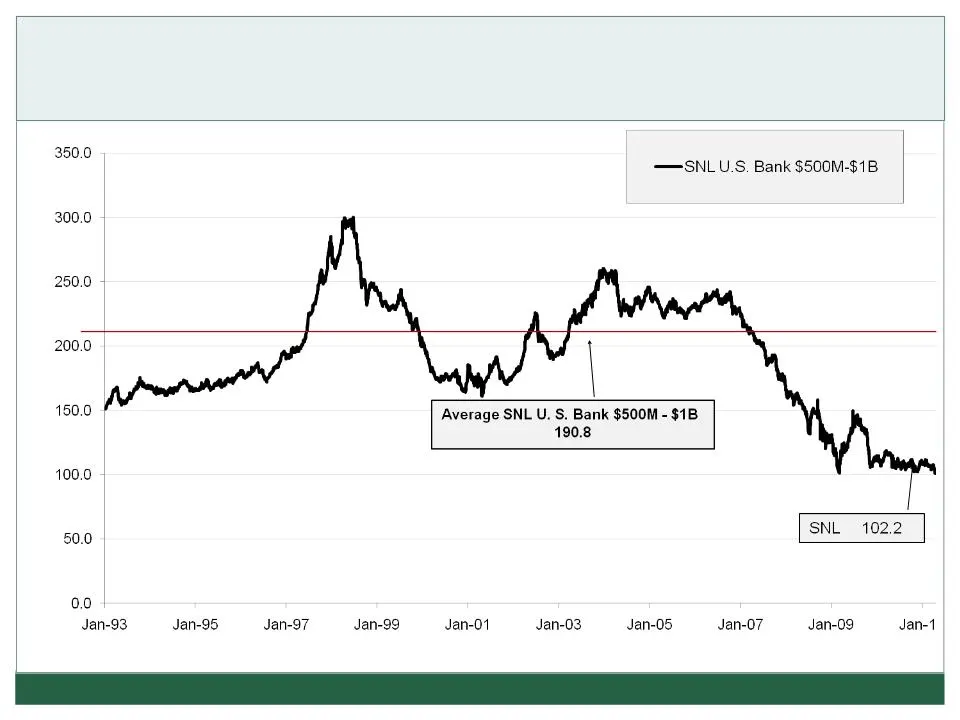
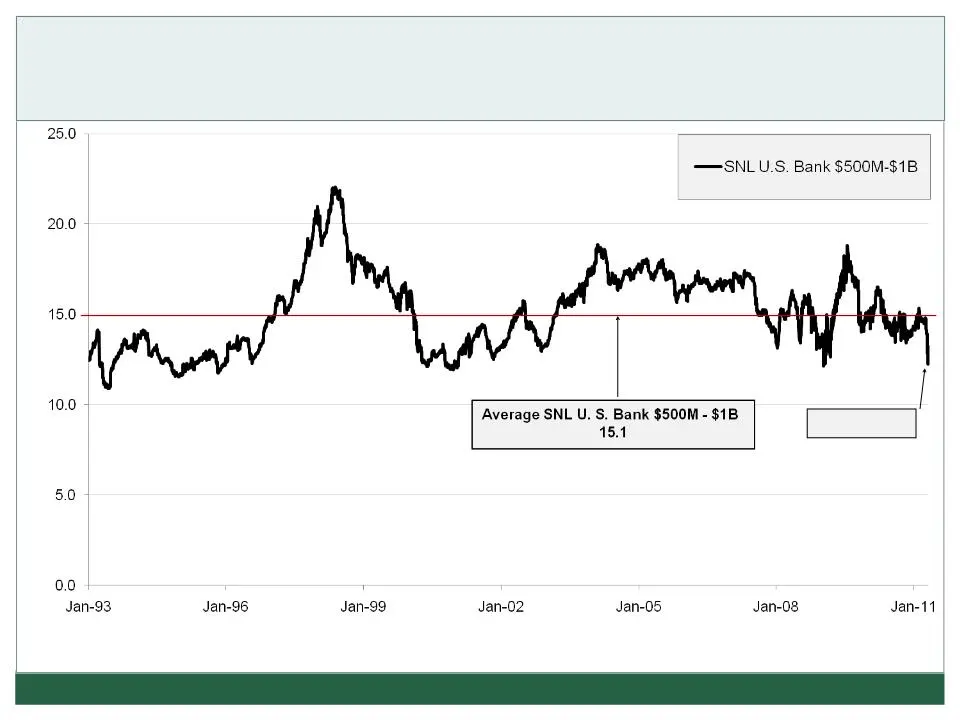
FAUQUIER BANKSHARES, INC. 9 Source: SNL Financial - As of May 5, 2011 Stock Chart - Price/Tangible Book (January 4, 1993 - April 30, 2011)
Slide 10: Stock Chart - Price/EPS
FAUQUIER BANKSHARES, INC. 10 Source: SNL Financial - As of May 5, 2011 Stock Chart - Price/EPS (January 4, 1993 - April 30, 2011) SNL 13.2

Slide 11: Financial Condition
FAUQUIER BANKSHARES, INC. 11 Financial Condition
Slide 12: 12 FAUQUIER BANKSHARES, INC.
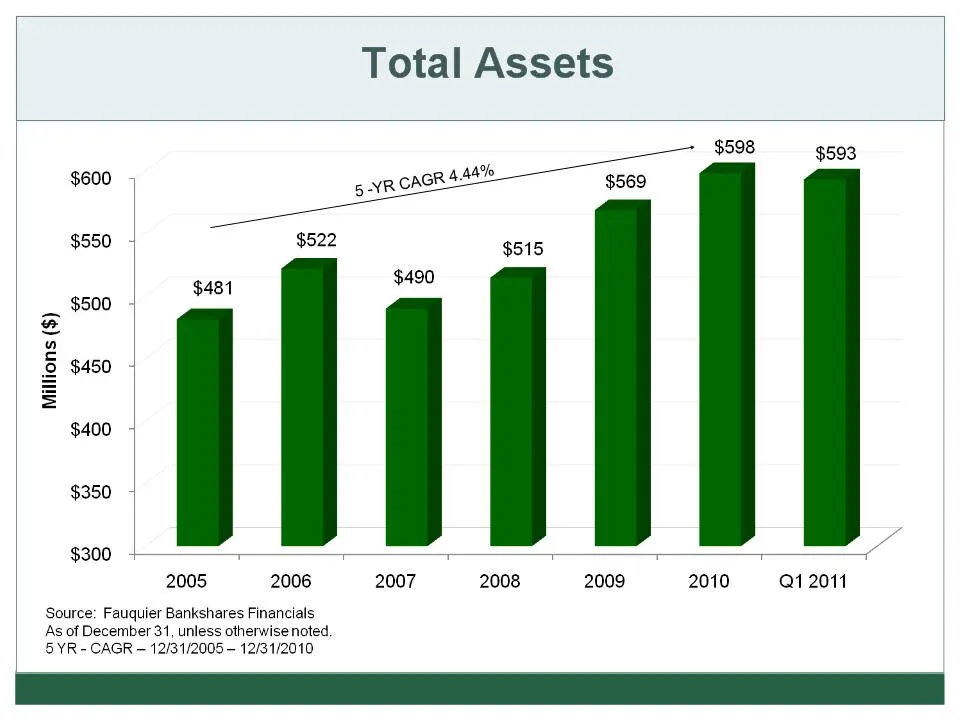
12 FAUQUIER BANKSHARES, INC.
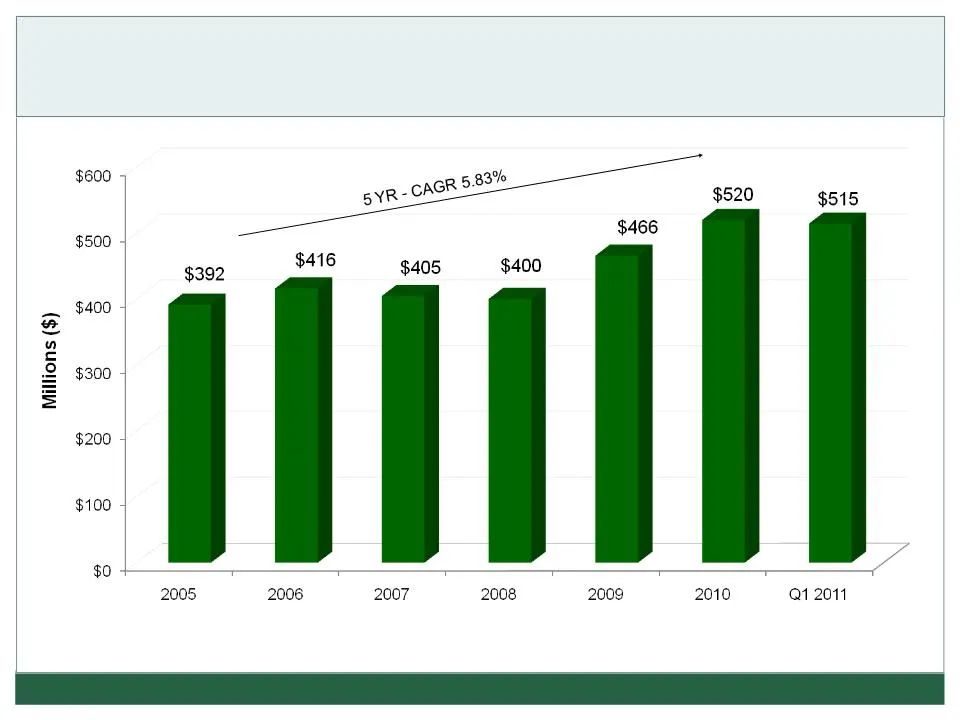
Slide 13: Loans, Net
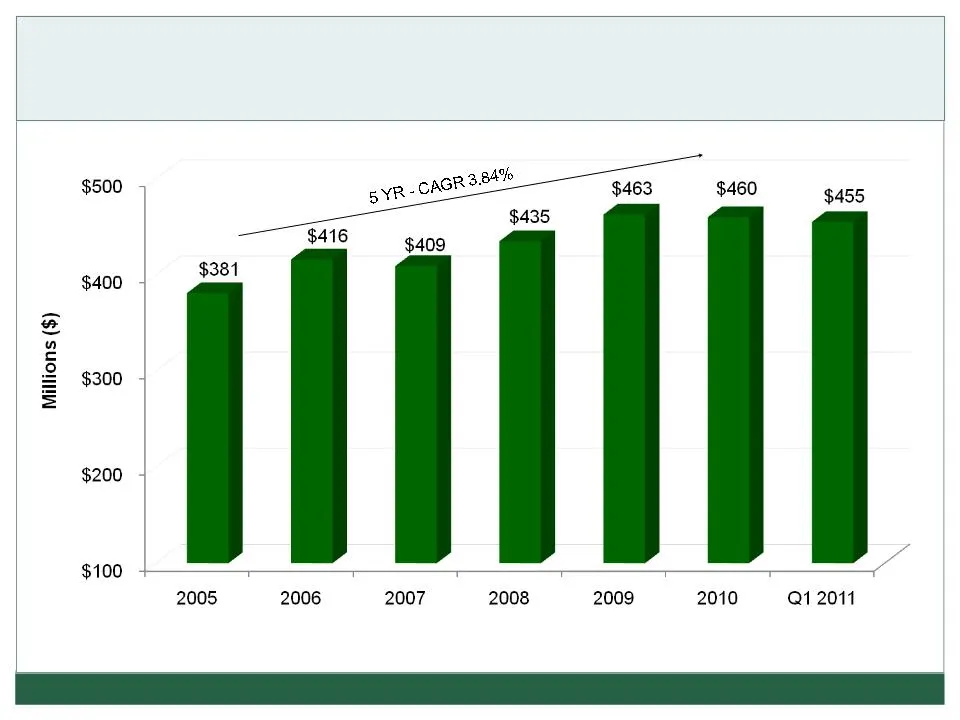
13 FAUQUIER BANKSHARES, INC. Loans, Net Source: Fauquier Bankshares Financials As of December 31, unless otherwise noted. 5 YR - CAGR - 12/31/2005 - 12/31/2010
Slide 14: Nonperforming Loans to Period End Loans
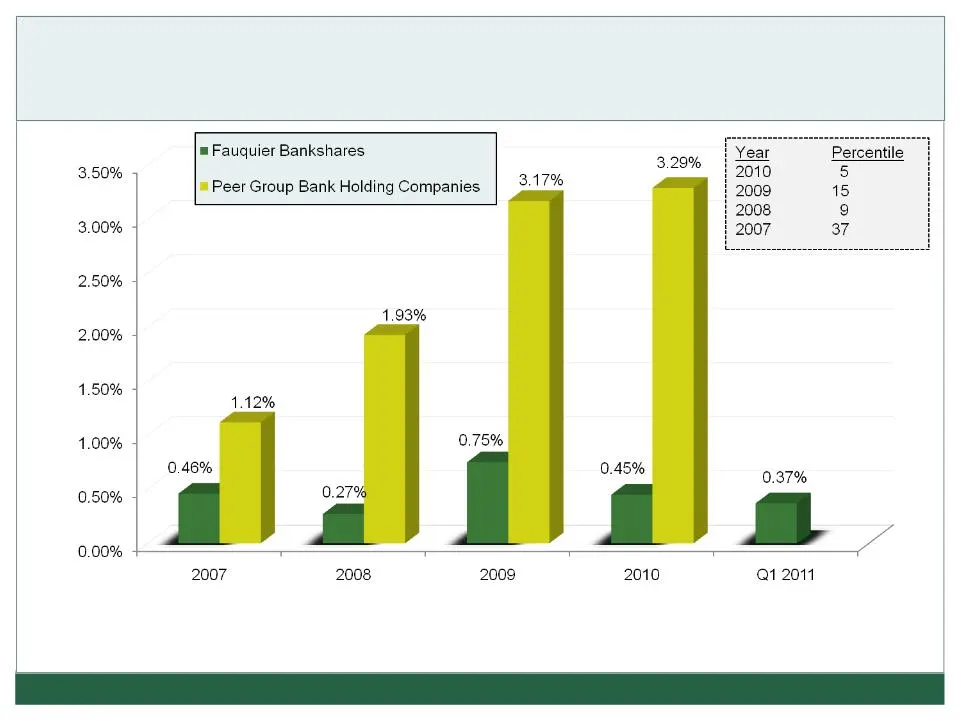
14 FAUQUIER BANKSHARES, INC. Nonperforming Loans to Period End Loans Peer Group - Bank Holding Companies with Consolidated Assets of $500MM - $1B (2010/2009/2008) - Data currently not available for peer Q1 2011 Peer Group - Bank Holding Companies with Consolidated Assets less than $500MM (2007) Sour
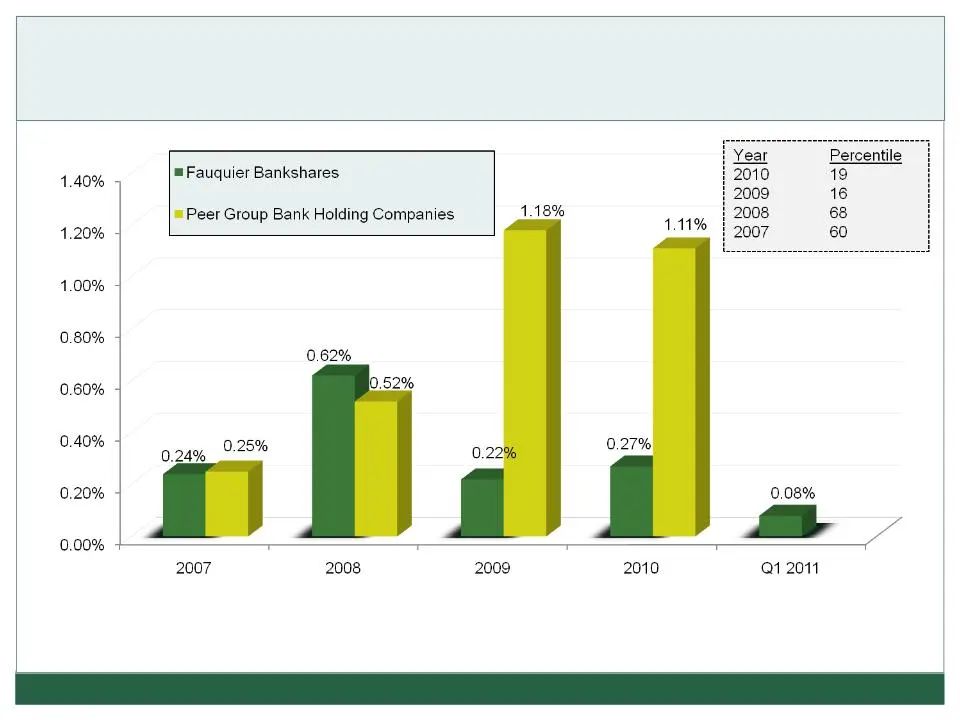
Slide 15: Loan Losses (Net of Recoveries)
15 FAUQUIER BANKSHARES, INC. Loan Losses (Net of Recoveries) As a Percentage of Average Total Loans Peer Group - Bank Holding Companies with Consolidated Assets of $500MM - $1B (2010/2009/2008) - Data currently not available for peer Q1 2011 Peer Group - Bank Holding Companies with Consolidated Asse
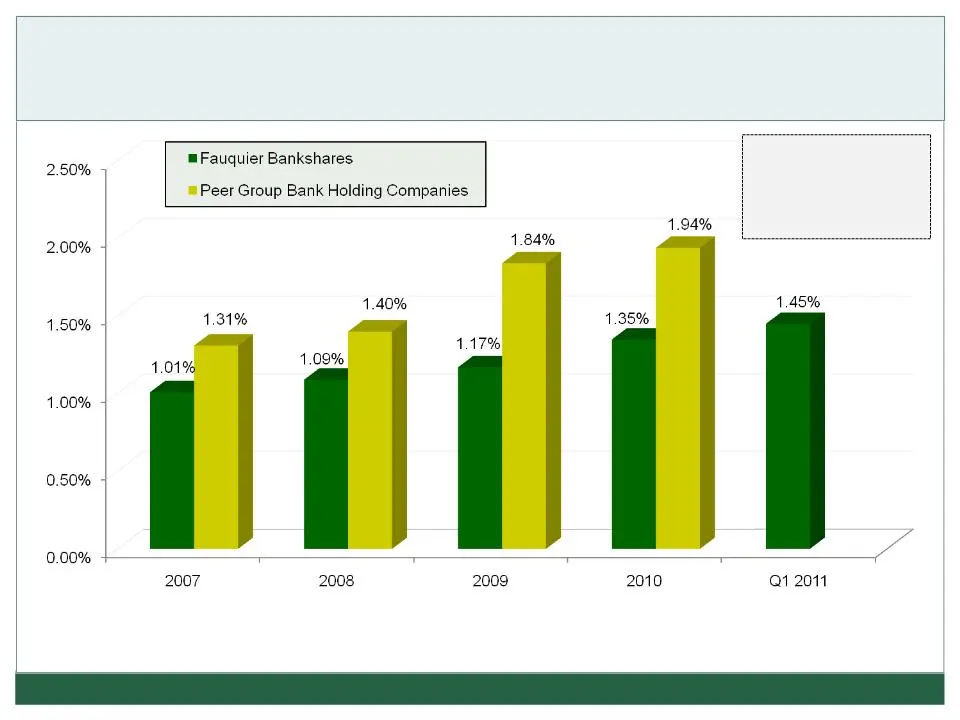
Slide 16: Allowance for Loan Loss
16 FAUQUIER BANKSHARES, INC. Allowance for Loan Loss As a Percentage of Total Loans Year Percentile 2010 23 2009 16 2008 28 2007 27 Peer Group - Bank Holding Companies with Consolidated Assets of $500MM - $1B (2010/2009/2008) - Data currently not available for peer Q1 2011 Peer Group - Bank Holding
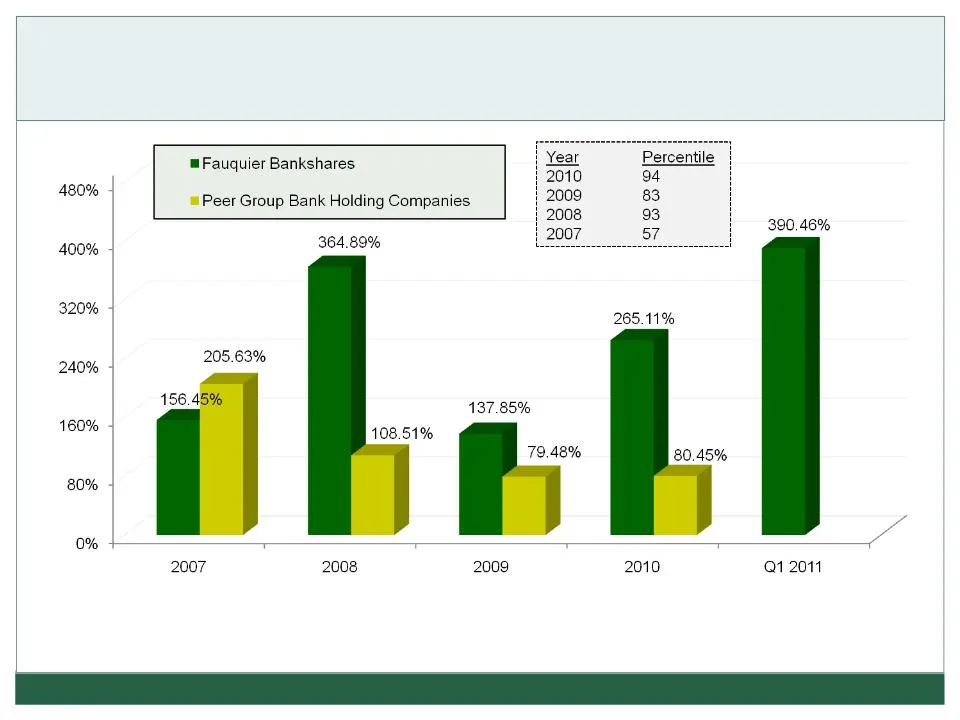
Slide 17: Allowance for Loan Loss
17 FAUQUIER BANKSHARES, INC. Allowance for Loan Loss As a Percentage of 90 Days Past Due & Nonaccrual Loans Peer Group - Bank Holding Companies with Consolidated Assets of $500MM - $1B (2010/2009/2008) - Data currently not available for peer Q1 2011 Peer Group - Bank Holding Companies with Consolida
Slide 18: Total Deposits
18 FAUQUIER BANKSHARES, INC. Total Deposits Source: Fauquier Bankshares Financials As of December 31, unless otherwise noted. 5 YR - CAGR - 12/31/2005 - 12/31/2010
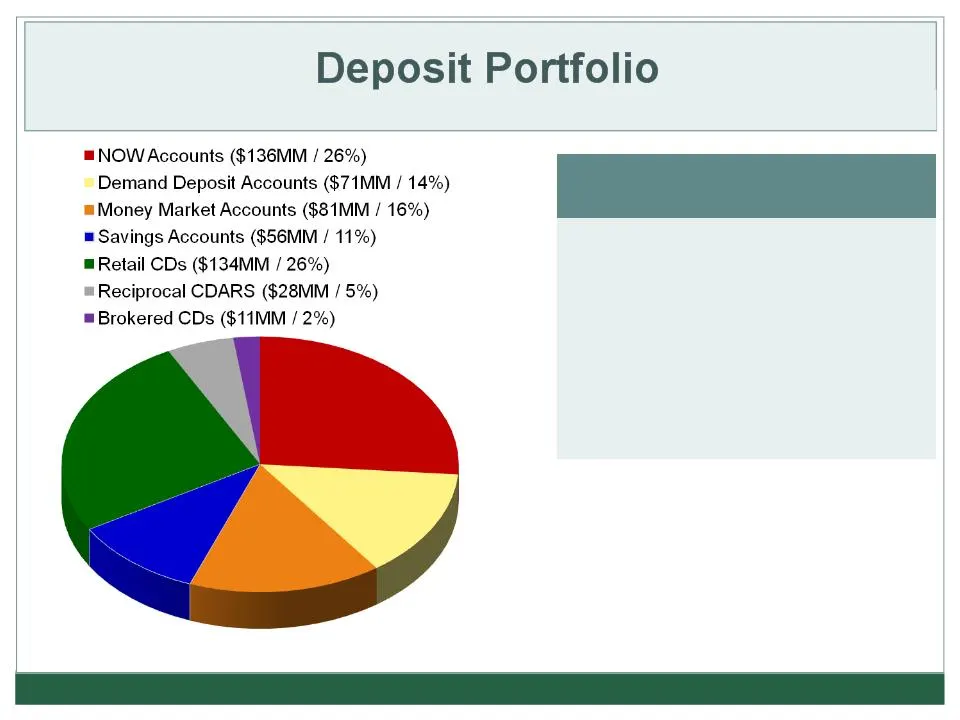
Slide 19: Transaction Account Growth
FAUQUIER BANKSHARES, INC. Transaction Account Growth Average Daily Balances for Three Months Ended March 31 2011 2010 % Change DDA $71,194 $63,722 11.73% NOW $135,822 $90,863 49.48% Totals $207,016 $154,585 33.92% 19 Average Daily Balances for Three Months Ended March 31, 2011 Source: Fauquier Banks
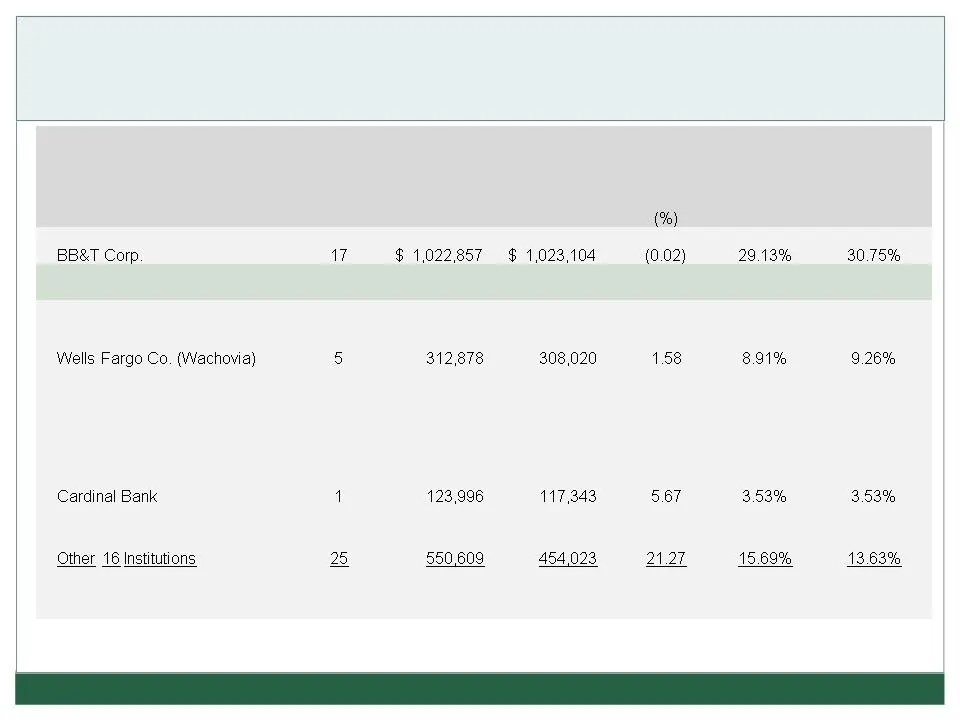
Slide 20: Deposit Market Share
20 Financial Institution Current Number of Branches Total Deposits 2010 ($000) Total Deposits 2009 ($000) Year to Year Deposit Change 2010 Market Share 2010 Market Share 2009 Fauquier Bankshares 10 493,053 412,892 19.41 14.04% 12.41% Suntrust Bank 7 428,557 417,666 2.61 12.20% 12.55% Bank of America
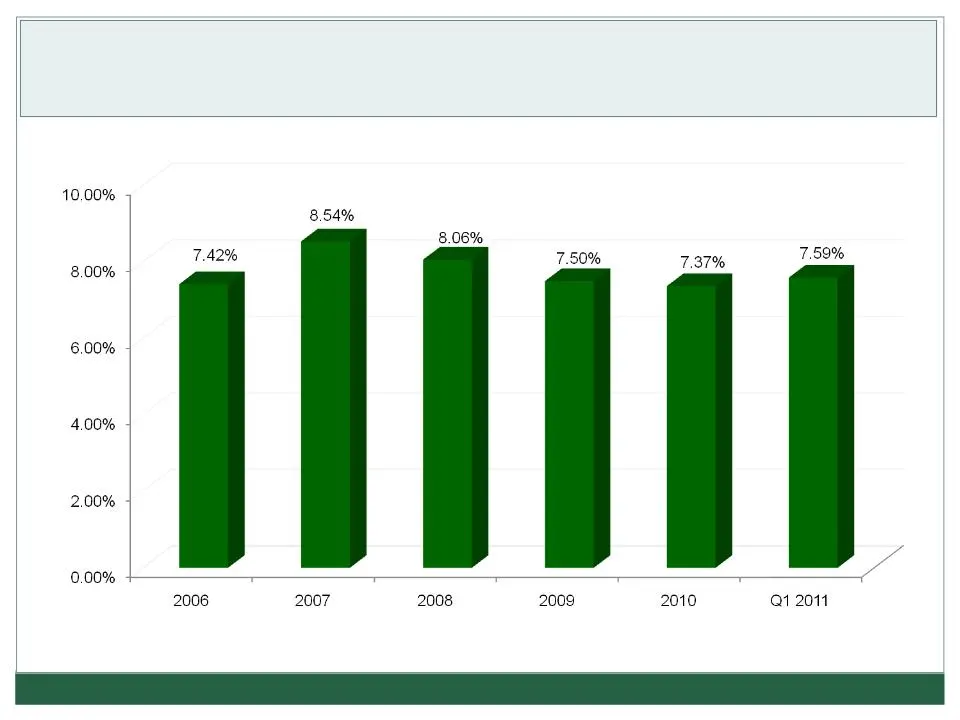
Slide 21: Tangible Equity to Assets Ratio
21 FAUQUIER BANKSHARES, INC. Tangible Equity to Assets Ratio Source: Fauquier Bankshares Financials As of December 31, unless otherwise noted.
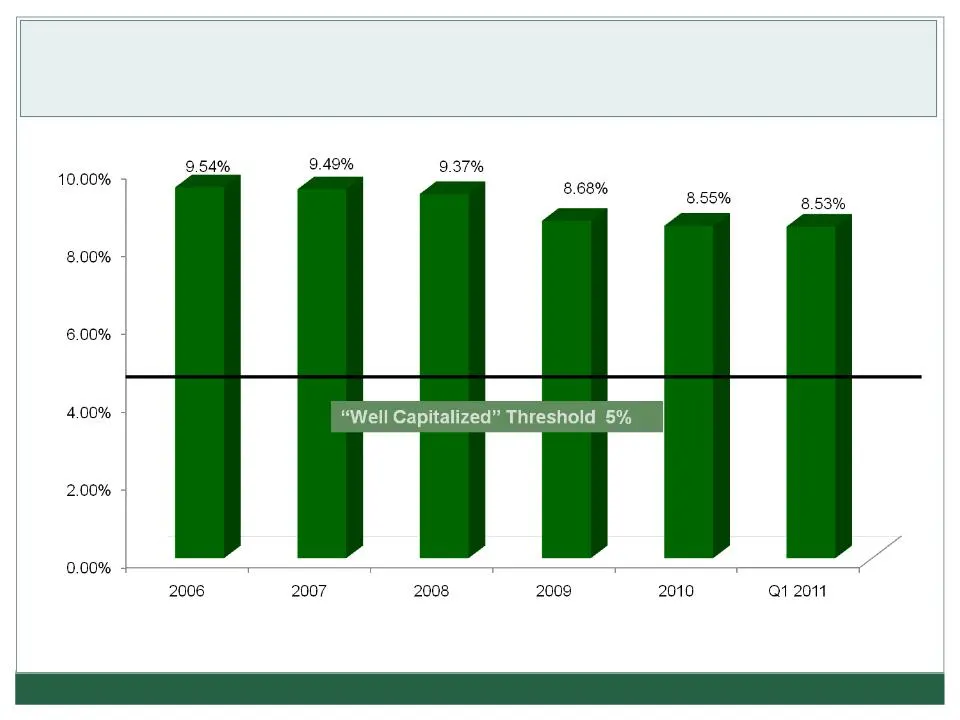
Slide 22: Leverage Ratio
22 FAUQUIER BANKSHARES, INC. Leverage Ratio Source: Fauquier Bankshares Financials As of December 31, unless otherwise noted.
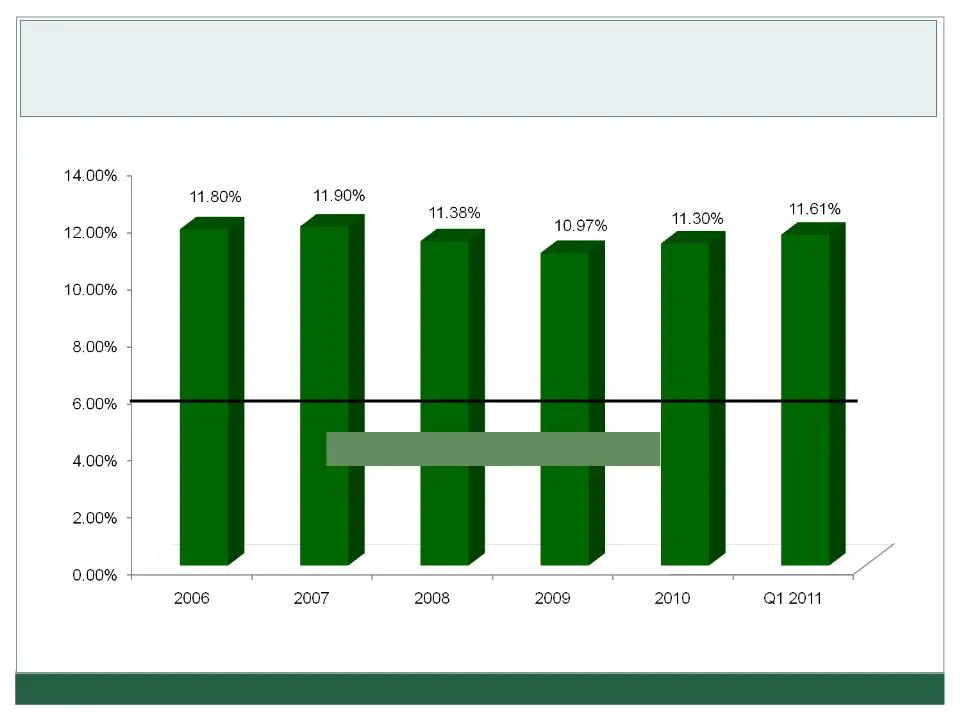
Slide 23: Tier Risk-Based Capital Ratio
23 FAUQUIER BANKSHARES, INC. Tier 1 Risk-Based Capital Ratio “Well Capitalized” Threshold 6% Source: Fauquier Bankshares Financials As of December 31, unless otherwise noted.
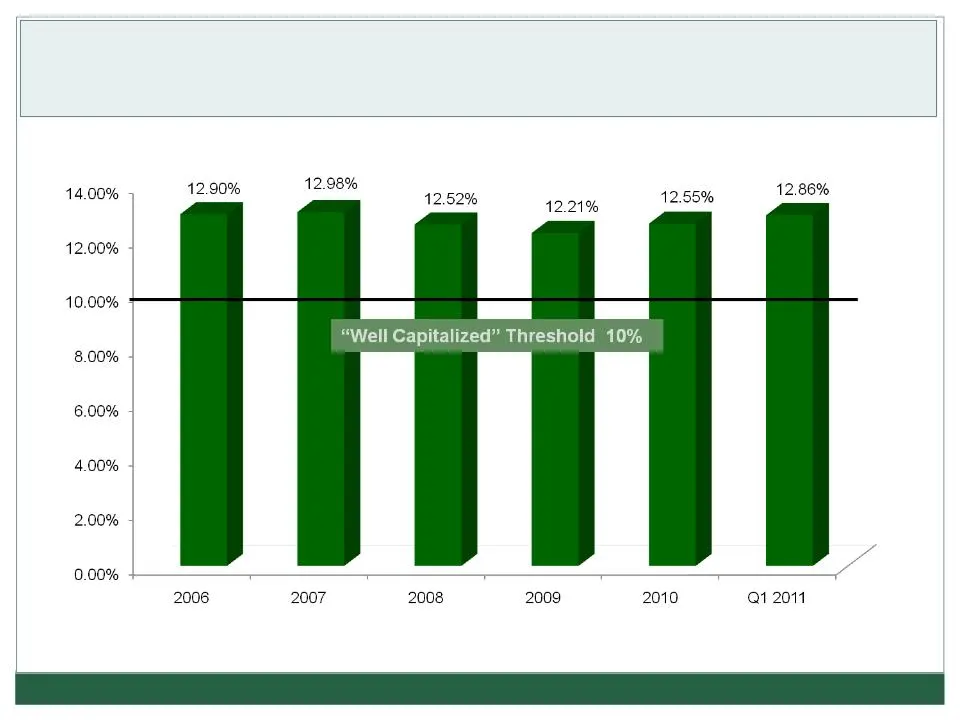
Slide 24: Total Risk-Based Capital Ratio
24 FAUQUIER BANKSHARES, INC. Total Risk-Based Capital Ratio Source: Fauquier Bankshares Financials As of December 31, unless otherwise noted.

Slide 25: Financial Performance and Goals
FAUQUIER BANKSHARES, INC. 25 Financial Performance and Goals
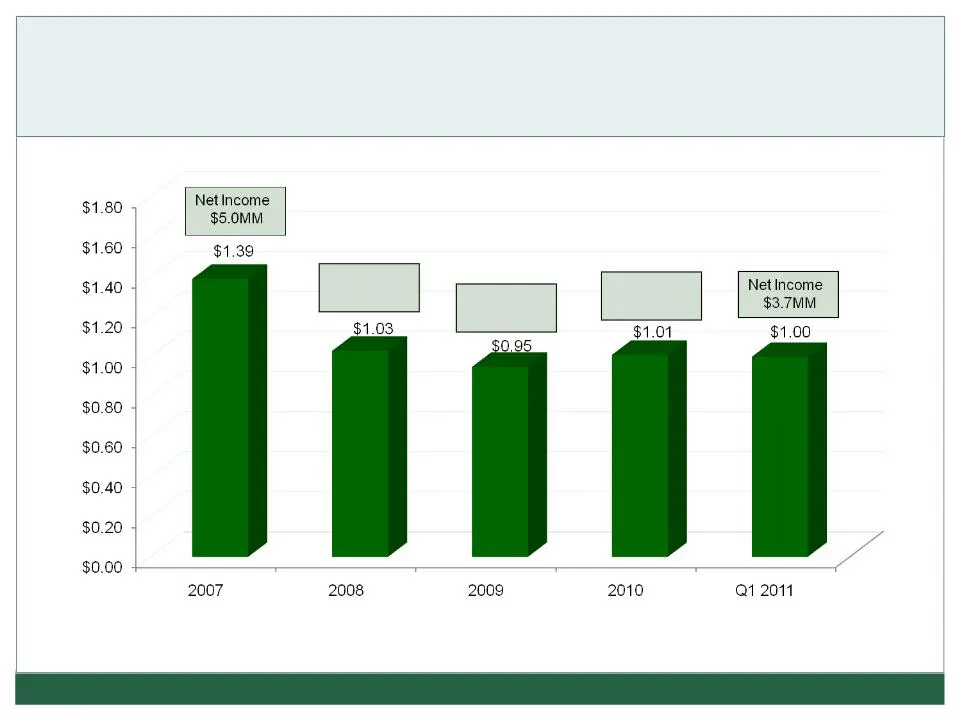
Slide 26: Earnings Per Share, Diluted
FAUQUIER BANKSHARES, INC. 26 Earnings Per Share, Diluted Net Income $3.4MM Net Income $3.7MM Net Income $3.7MM Source: Fauquier Bankshares Financials As of December 31, unless otherwise noted. 1Q 2011 data is annualized based on $.25 per share and net income of $921,000 as of March 31, 2011.
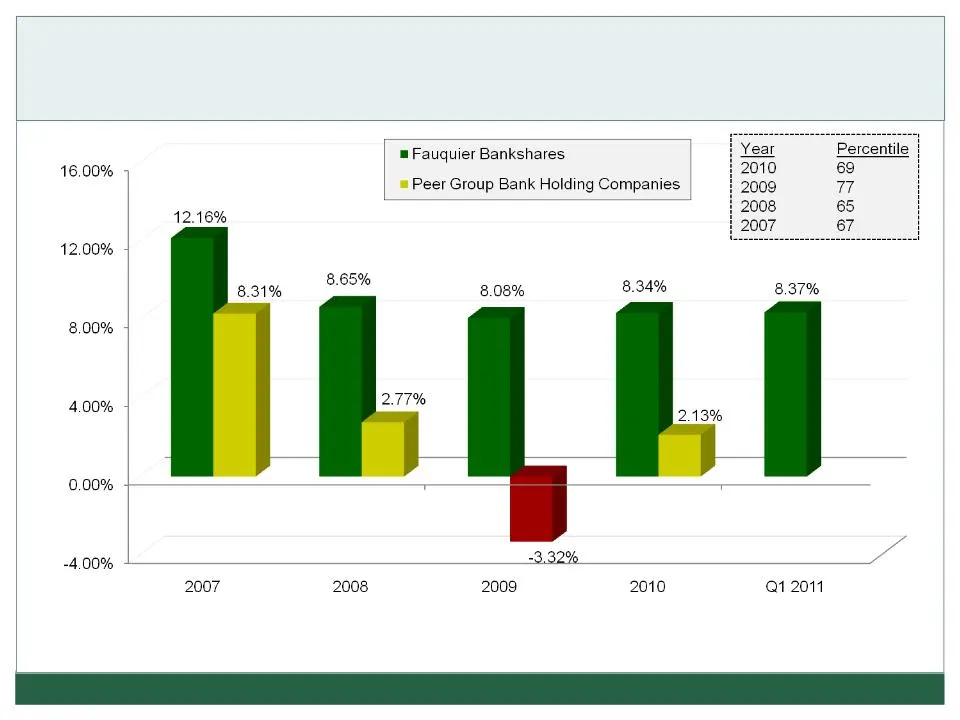
Slide 27: Return on Average Equity (ROAE)
FAUQUIER BANKSHARES, INC. Return on Average Equity (ROAE) Peer Group - Bank Holding Companies with Consolidated Assets of $500MM - $1B (2010/2009/2008) - Data currently not available for peer Q1 2011 Peer Group - Bank Holding Companies with Consolidated Assets less than $500MM (2007) Sources: BHC Pe
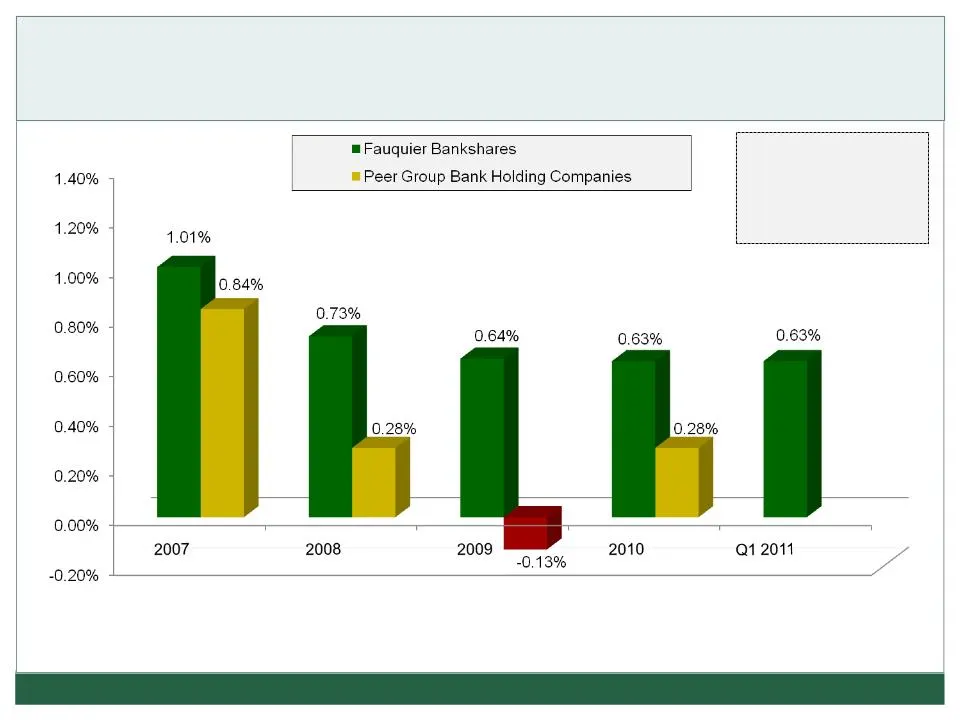
Slide 28: Net Income (ROAA)
28 FAUQUIER BANKSHARES, INC. Net Income (ROAA) (As a Percent of Average Assets) Year Percentile 2010 61 2009 69 2008 65 2007 59 Peer Group - Bank Holding Companies with Consolidated Assets of $500MM - $1B (2010/2009/2008) - Data currently not available for peer Q1 2011 Peer Group - Bank Holding Comp
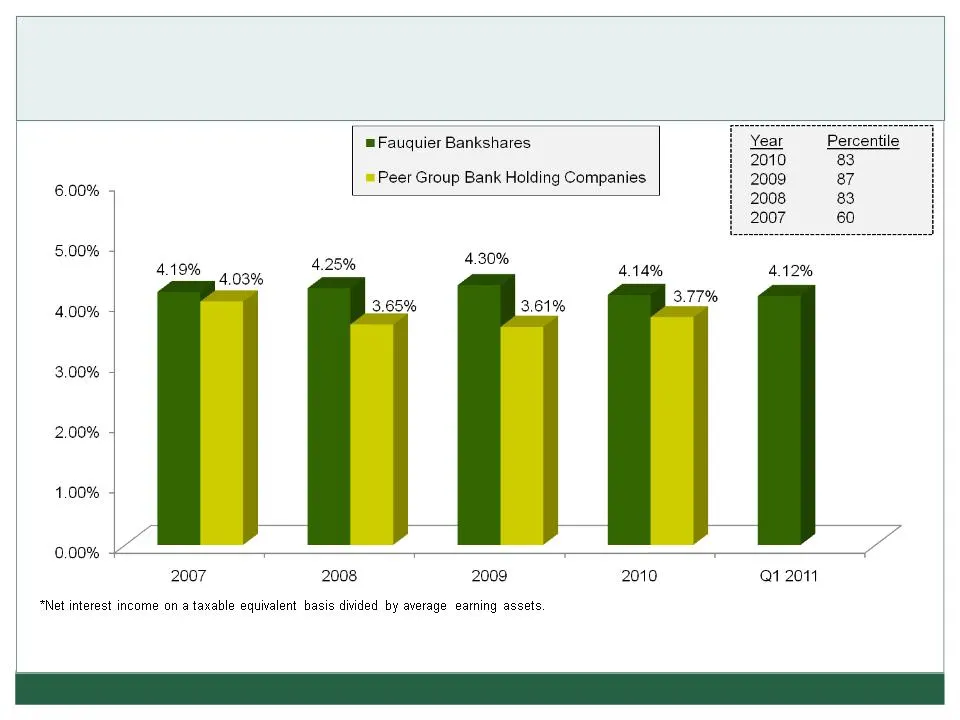
Slide 29: Net Interest Margin
29 FAUQUIER BANKSHARES, INC. Net Interest Margin* Peer Group - Bank Holding Companies with Consolidated Assets of $500MM - $1B (2010/2009/2008) - Data currently not available for peer Q1 2011 Peer Group - Bank Holding Companies with Consolidated Assets less than $500MM (2007) Source: BHC Performance
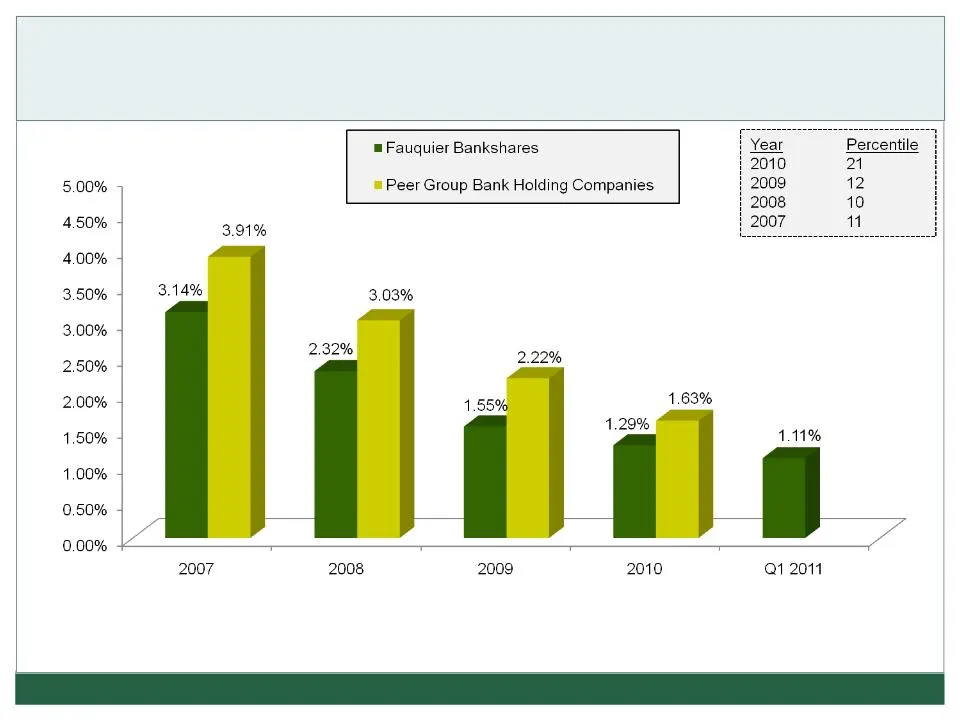
Slide 30: Cost of Funds
30 FAUQUIER BANKSHARES, INC. Cost of Funds Peer Group - Bank Holding Companies with Consolidated Assets of $500MM - $1B (2010/2009/2008) - Data currently not available for peer Q1 2011 Peer Group - Bank Holding Companies with Consolidated Assets less than $500MM (2007) Sources: BHC Performance Repor
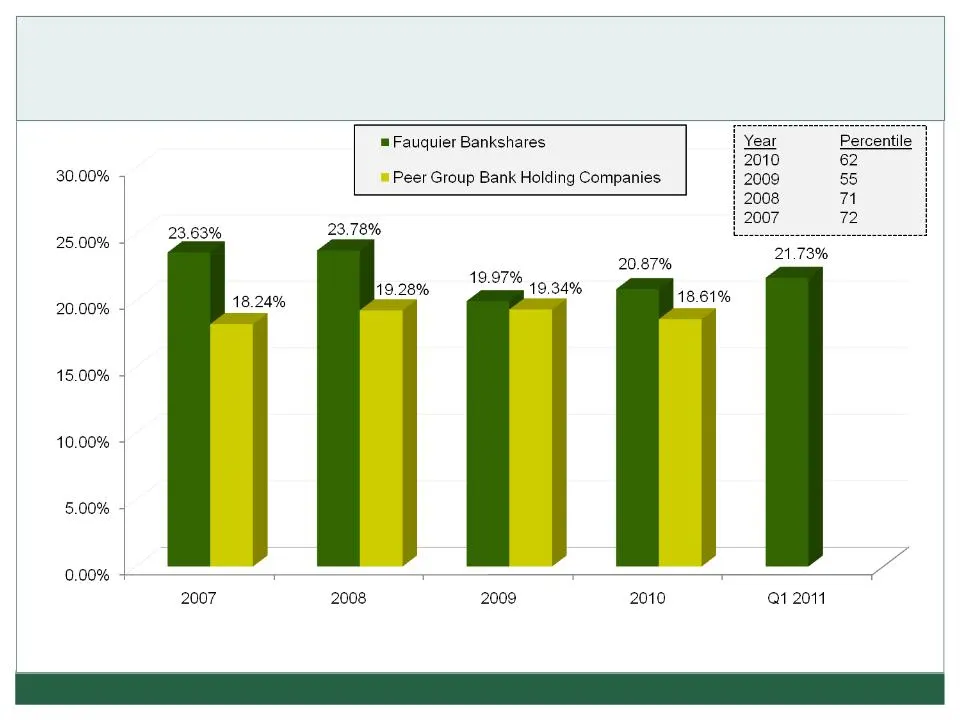
Slide 31: Total Non-Interest Income
FAUQUIER BANKSHARES, INC. 31 Total Non-Interest Income As a Percent of Adjusted Operating Income (TE) Peer Group - Bank Holding Companies with Consolidated Assets of $500MM - $1B (2010/2009/2008) - Data currently not available for peer Q1 2011 Peer Group - Bank Holding Companies with Consolidated As
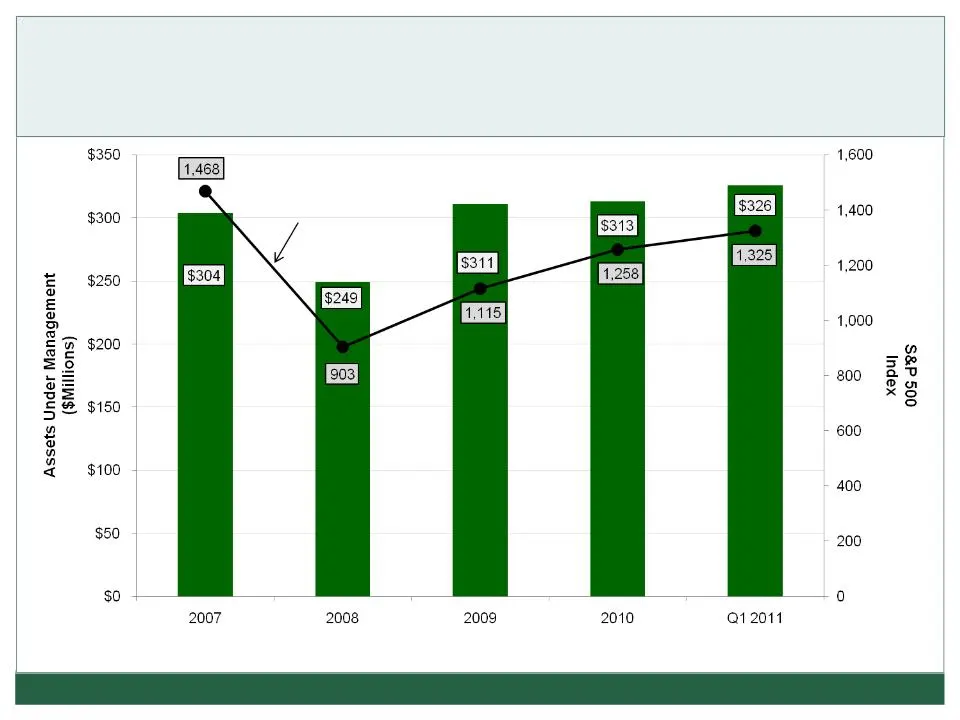
Slide 32: Assets Under Management
32 FAUQUIER BANKSHARES, INC. Assets Under Management (At Market Value) Source: Wealth Management Services Statement of Condition and SNL - As of December 31, unless otherwise noted S&P 500 Index
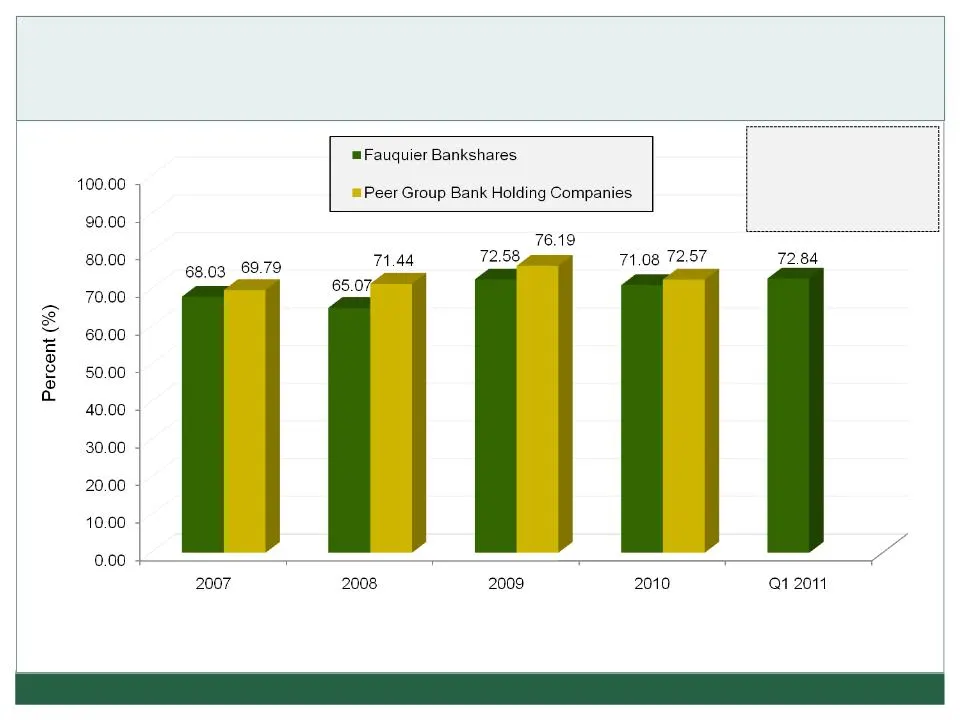
Slide 33: Efficiency Ratio
FAUQUIER BANKSHARES, INC. 33 Efficiency Ratio Peer Group - Bank Holding Companies with Consolidated Assets of $500MM - $1B (2010/2009/2008) - Data currently not available for peer Q1 2011 Peer Group - Bank Holding Companies with Consolidated Assets less than $500MM (2007) Sources: BHC Performance Re
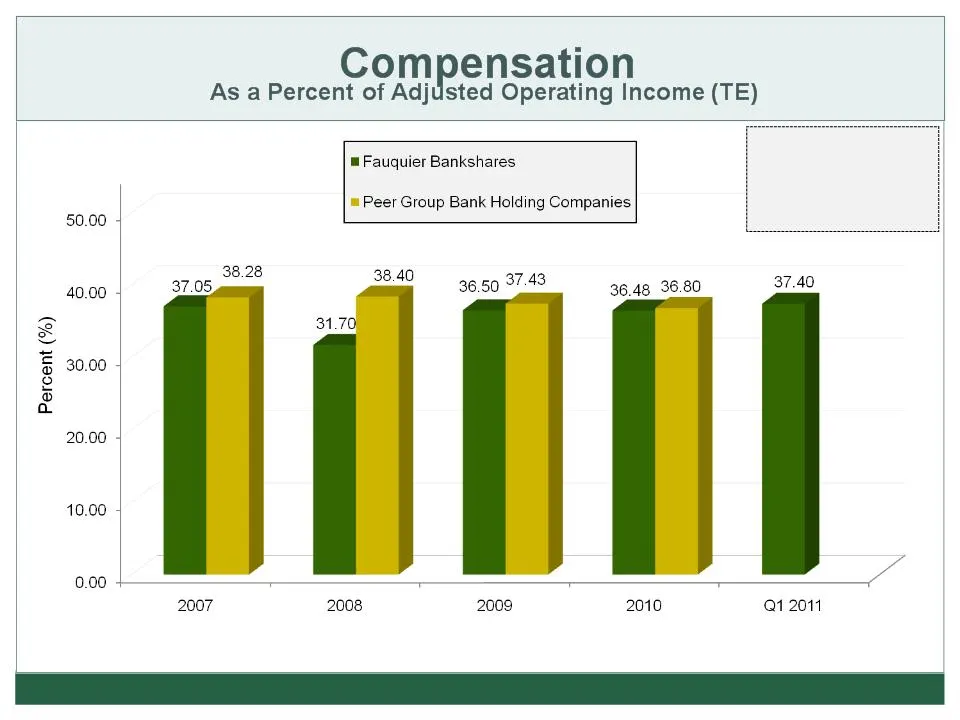
Slide 34: Year Percentile
FAUQUIER BANKSHARES, INC. 34 Year Percentile 2010 50 2009 46 2008 18 2007 45 Peer Group - Bank Holding Companies with Consolidated Assets of $500MM - $1B (2010/2009/2008) - Data currently not available for peer Q1 2011 Peer Group - Bank Holding Companies with Consolidated Assets less than $500MM (20
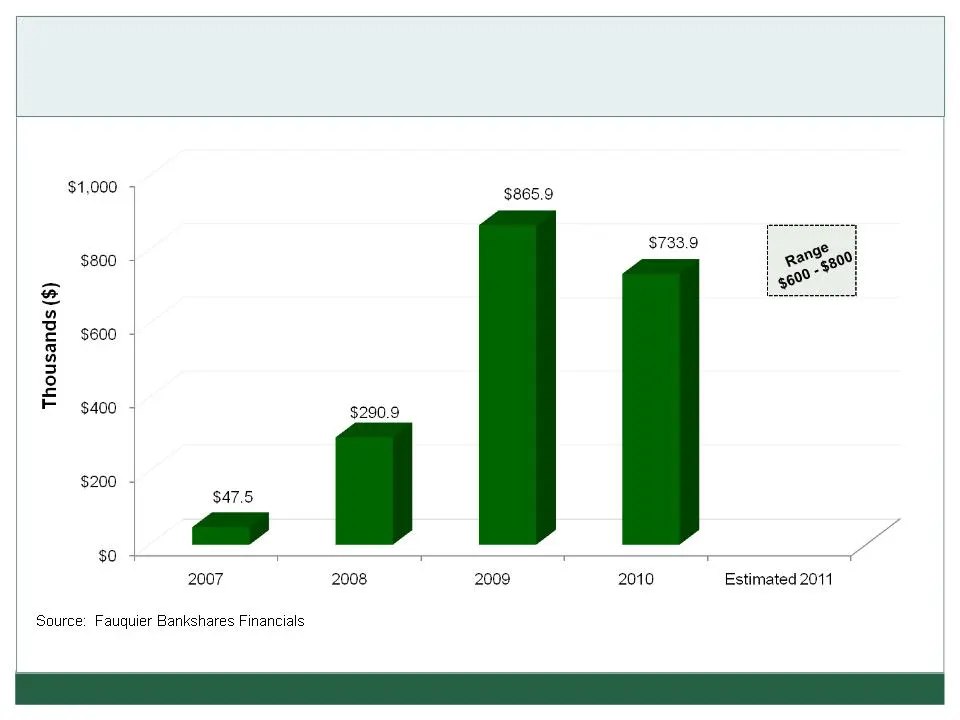
Slide 35: FDIC Expense
35 FAUQUIER BANKSHARES, INC. FDIC Expense In April 2007, the Bank received a one-time assessment credit in the amount of $208,820. The credit was taken over the last three quarters of 2007 and first quarter of 2008.
Slide 36: Pooled Trust Preferred Securities
36 FAUQUIER BANKSHARES, INC. Pooled Trust Preferred Securities Ø In 1996, The Federal Reserve first approved issuance of Preferred Trust Securities. In 2000, Pooled Trust Securities were developed. Ø These pooled securities are corporate bonds that are “Class B” or subordinated “mezzanine” tranche o
Slide 37: Pooled Trust Preferred Securities
37 FAUQUIER BANKSHARES, INC. Issue X XI XIV XV Total Date of purchase 6/26/2003 9/17/2003 6/17/2004 9/20/2004 Issue size ($M) $ 581 $ 670 $ 504 $ 625 $ 2,380 Financial institutions (No.) 61 69 65 60 228* States (No.) 29 28 34 30 30** TFB's share of the pool 0.17% 0.30% 0.40% 0.16% .029%*** TFB’s Inv
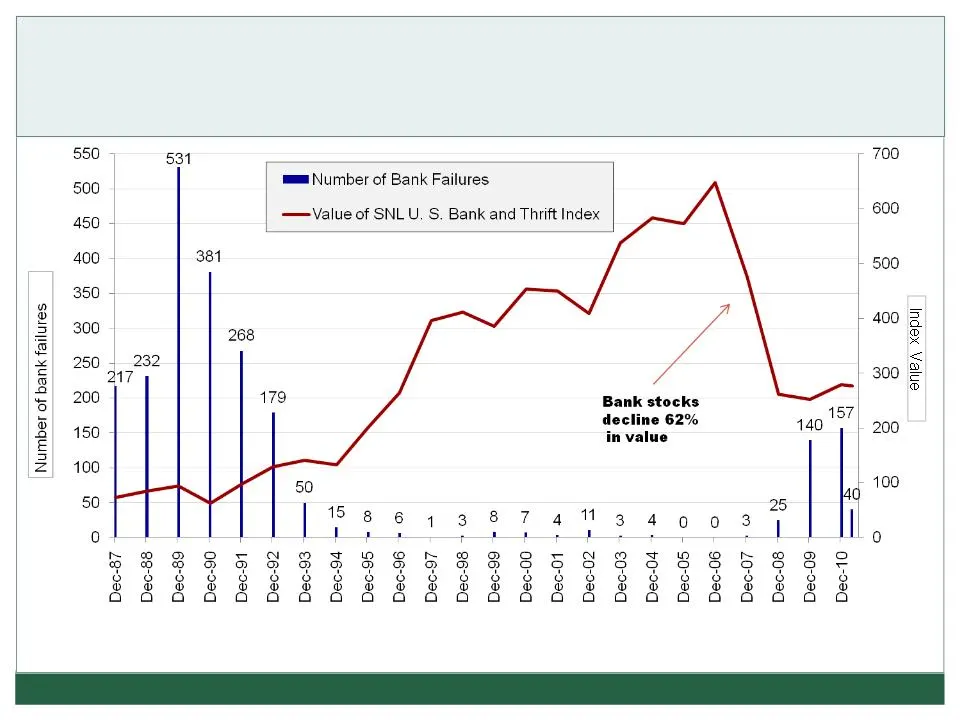
Slide 38: Bank Failures and Bank Stocks
38 FAUQUIER BANKSHARES, INC. Bank Failures and Bank Stocks 1987 - 2011 Sources: SNL Financial and FDIC Number of bank failures excludes transactions classified by the FDIC as “assistance transactions”.
Slide 39: Stock Total Return Performance
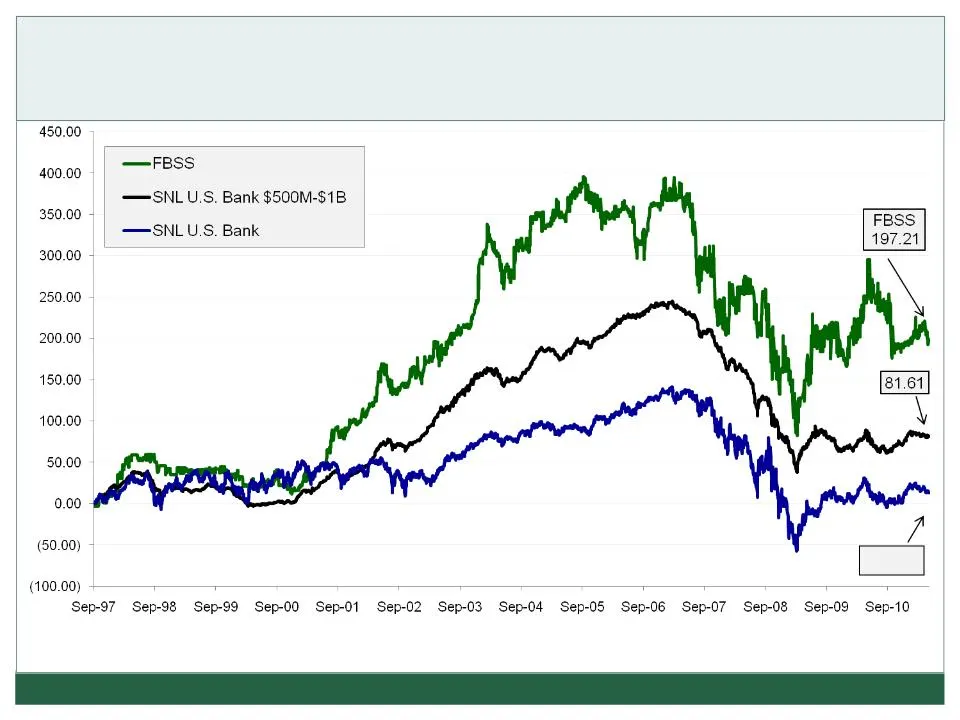
FAUQUIER BANKSHARES, INC. 39 Index Over Last Year Over Last Two Years Over Last Three Years Over Last Five Years Over Last Ten Years Since Going Public (1997) FBSS (24.80%) 10.36% (17.99%) (36.31%) 105.95% 197.21% SNL $500M - $1B 3.09% 5.22% (29.44%) (44.40%) 49.31% 81.61% SNL $250M - $500M (0.93%)
Slide 40: Stock Total Return Performance
40 FAUQUIER BANKSHARES, INC. Stock Total Return Performance (September 1, 1997 - May 9, 2011) Source: SNL Financial - May 10, 2011 12.82
Slide 41: Stock Chart - Price/EPS
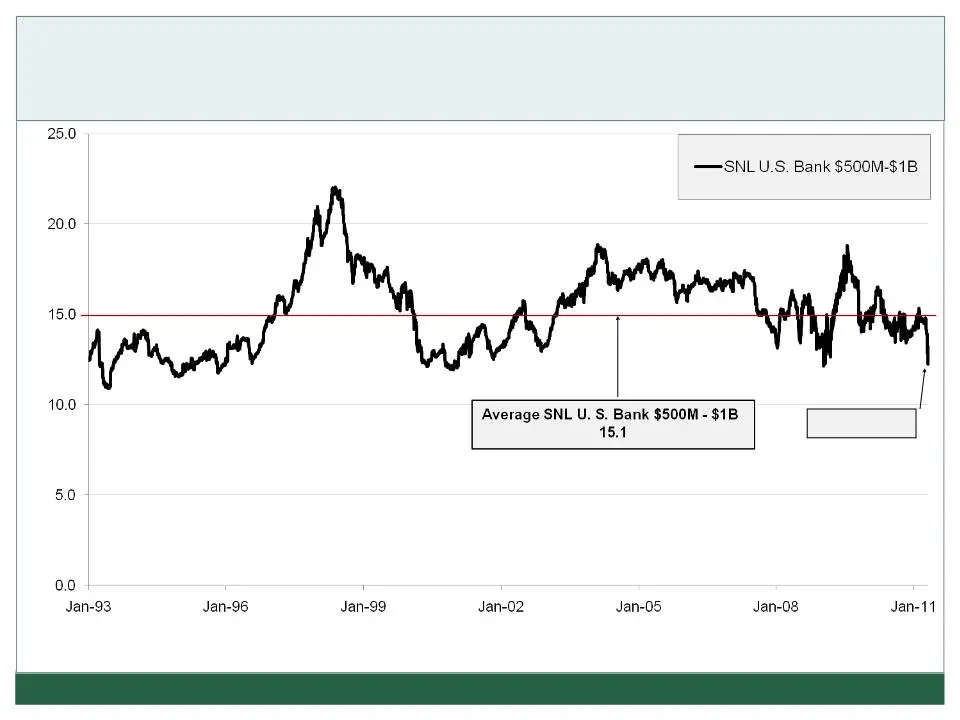
FAUQUIER BANKSHARES, INC. 41 Source: SNL Financial - As of May 5, 2011 Stock Chart - Price/EPS (January 4, 1993 - April 30, 2011) SNL 13.2
Slide 42: Stock Chart - Price/EPS
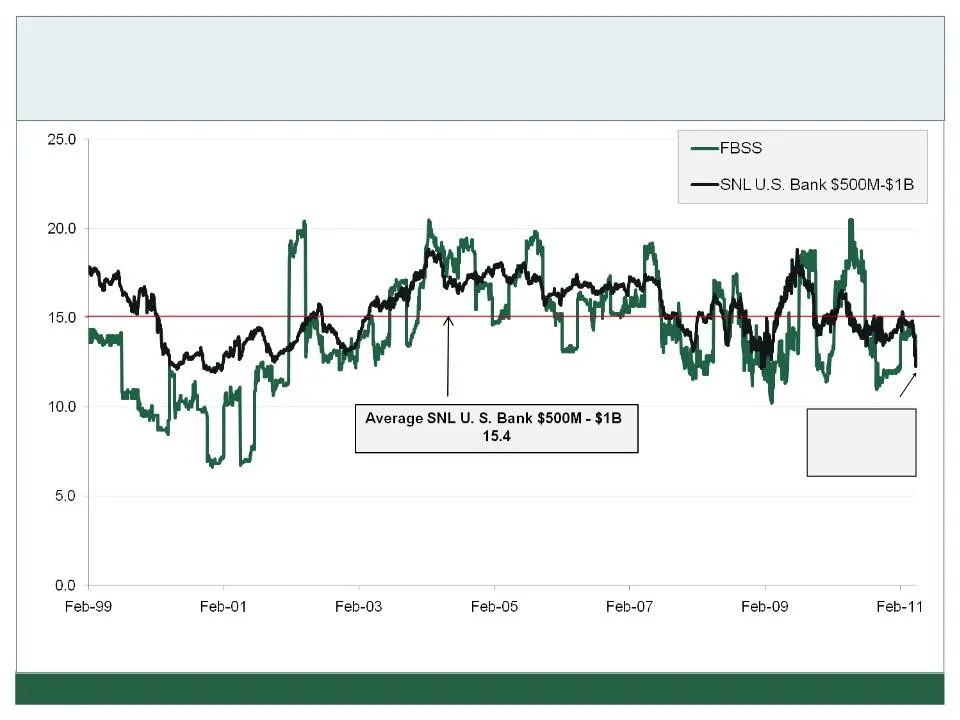
FAUQUIER BANKSHARES, INC. 42 Source: SNL Financial - As of May 5, 2011 Stock Chart - Price/EPS (Feb 1, 1999- April 30, 2011) FBSS 13.1 SNL 13.2
Slide 43: Stock Chart - Price/Tangible Book
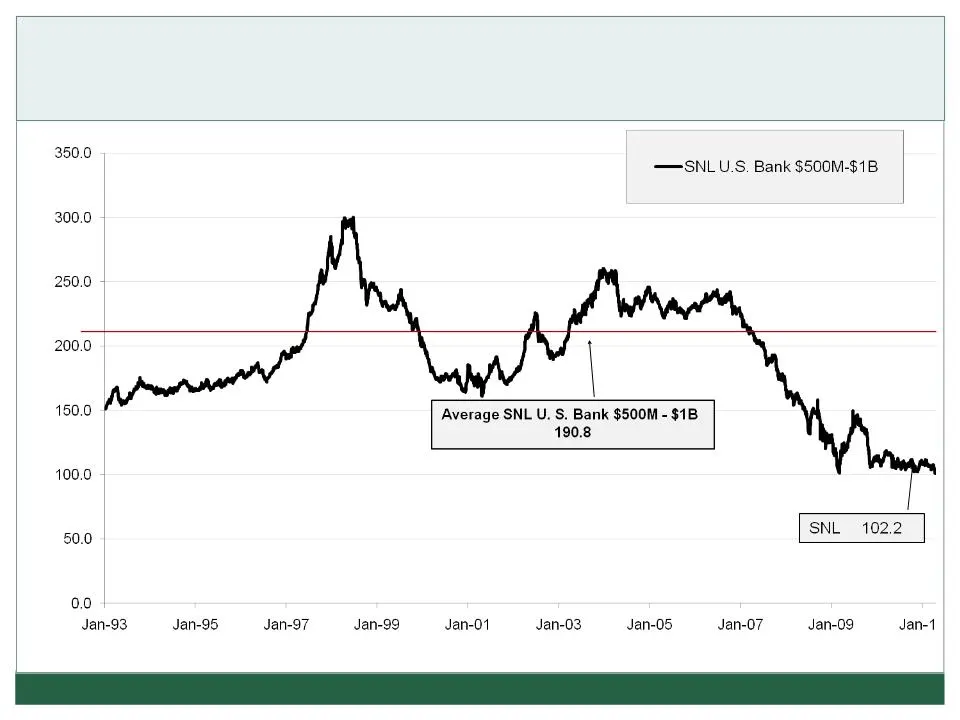
FAUQUIER BANKSHARES, INC. 43 Source: SNL Financial - As of May 5, 2011 Stock Chart - Price/Tangible Book (January 4, 1993 - April 30, 2011)
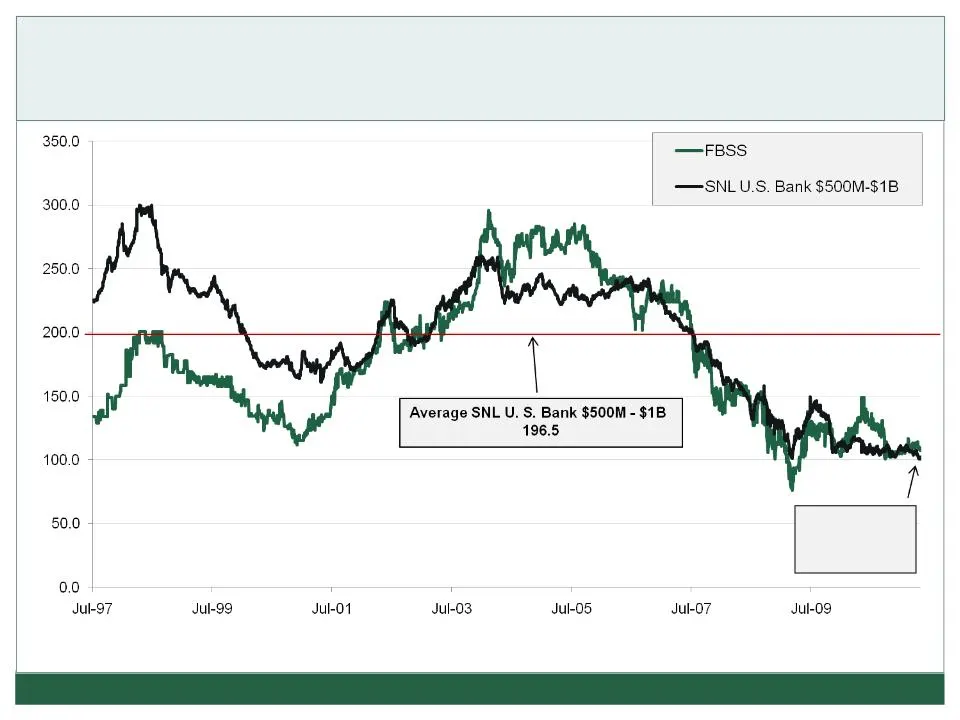
Slide 44: Stock Chart - Price/Tangible Book
FAUQUIER BANKSHARES, INC. 44 Source: SNL Financial - As of May 5, 2011 Stock Chart - Price/Tangible Book (July 1, 1997- April 30, 2011) FBSS 107.0 SNL 102.2
Slide 45: Virginia Banks - Dividend Comparison
45 FAUQUIER BANKSHARES, INC. Virginia Banks - Dividend Comparison Ø 62 Virginia banks on North American Exchanges Ø 41 paid dividends during the past three years Ø 27 banks, or 66%, have cut their dividend Ø Average cut was 75% with10 banks cutting their dividend by 100% Ø 5 banks, or 12%, have incr
Slide 46: Contact Information
FAUQUIER BANKSHARES, INC. 46 Contact Information Investor Relations Contacts Randy K. Ferrell President & Chief Executive Officer [email protected] Eric P. Graap Executive Vice President & Chief Financial Officer [email protected] Valerie Barlowe Investor Relations Coordinator
Source: SEC EDGAR · 8-K filed May 19, 2011
More decks from Fauquier Bankshares Inc
 Merger or Acquisition (October 2020)20 slides · Oct 1, 2020
 Shareholder Meeting (May 2020)30 slides · May 19, 2020
 Investor Presentation (August 2019)20 slides · Aug 7, 2019
 Shareholder Meeting (May 2019)31 slides · May 21, 2019
 Investor Presentation (October 2018)18 slides · Oct 22, 2018
 Shareholder Meeting (May 2018)33 slides · May 15, 2018