PHH — Keefe, Bruyette & Woods 2009 Diversified Financial Services Conference
41 slides from PHH's conference presentation, Jun 3, 2009
Slide 1: KBW 2009 Diversified Financial Services Conference Investor Presentation
PHH Keefe, Bruyette & Woods 2009 Diversified Financial Services Conference Investor Presentation June 3, 2009
Slide 2: Forward Looking Statements
Forward Looking Statements Statements in this presentation that are not historical facts are forward-looking statements within the meaning of Section 27A of the Securities Act of 1933, as amended, and Section 21E of the Securities Exchange Act of 1934, as amended. Such forward-looking statements are
Slide 3: Important Disclosures
Important Disclosures Basis of Presentation of Financial Data Unless noted otherwise in this presentation, all reported financial data is being presented as of the period ended March 31, 2009 (unaudited). Non-GAAP Financial Measures This presentation, in slides nos. 6, 8, 12, 18, and 30, contains ce
Slide 4: Speakers
Speakers ??Terry Edwards, President & Chief Executive Officer, PHH Corporation ??Sandra Bell, Executive Vice President & Chief Financial Officer, PHH Corporation 4
Slide 5: Agenda
Agenda ??Overview of First Quarter??Mortgage Segments Summary ??Fleet Management Services Segment Summary??Combined Segments in a New Mortgage World??Funding Strategy??Questions and Answers 5
Slide 6: Highlights for Q109
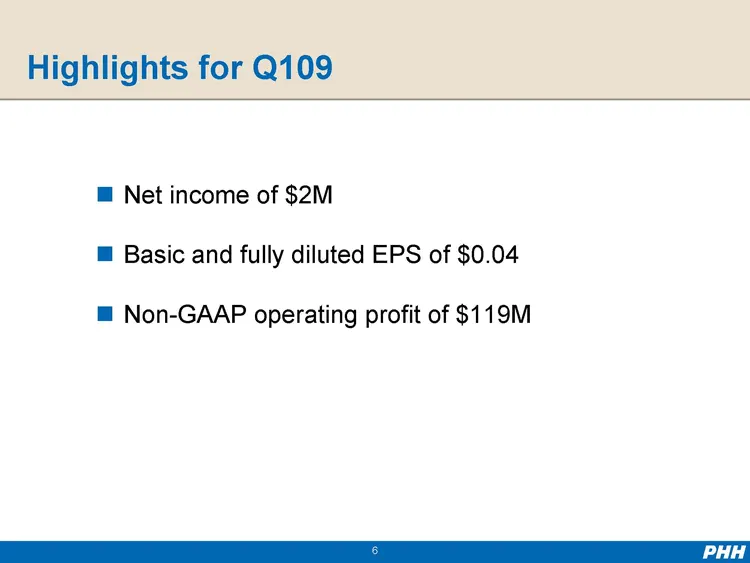
Highlights for Q109 ?Net income of $2M ?Basic and fully diluted EPS of $0.04 ?Non-GAAP operating profit of $119M 6
Slide 7: Quarterly Results (unaudited)
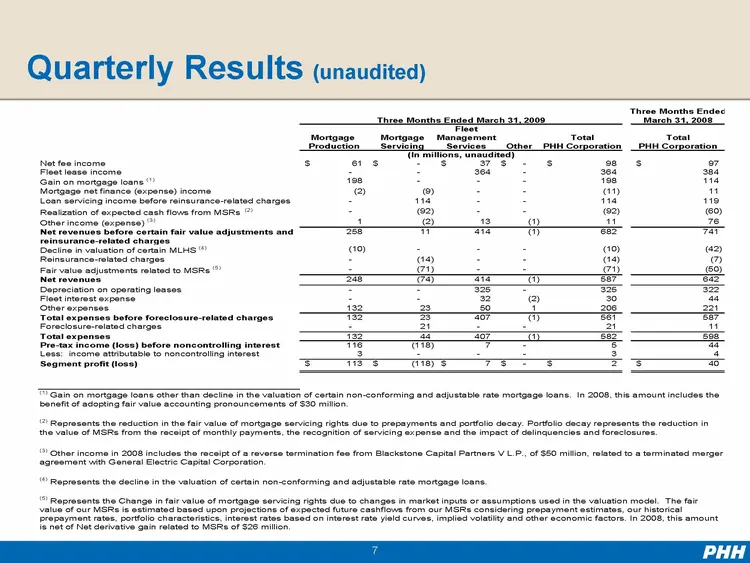
Quarterly Results (unaudited) Three Months Ende Three Months Ended March 31, 2009 March 31, 2008 Fleet Mort gage Mortgage Mana gement Total Total Production Servicing Services Othe PHH Cor poration PHH Cor poration (In millions, unaudited) Net fee income $61 $- $37 $ — $98 $97 Fleet lease income— 36
Slide 8: Non-GAAP Operating Profit
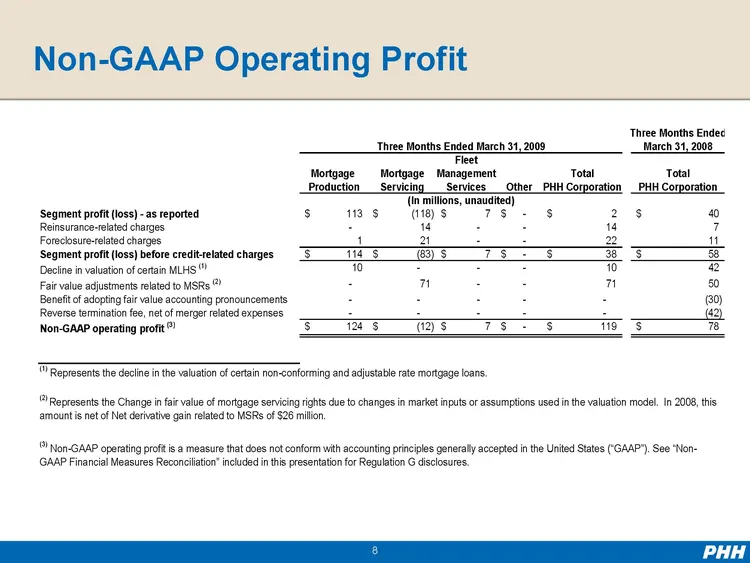
Non-GAAP Operating Profit Three Months Ende Three Months Ended March 31, 2009 March 31, 2008 Fleet Mort gage Mortgage Mana gement Total Total Production Servicing Services Other PHH Cor poration PHH Cor &n bsp; poration (In millions, unaudited) Segment profit (loss) — as reported $113 $(118) $7 $- $
Slide 9: Condensed Consolidated Balance Sheet
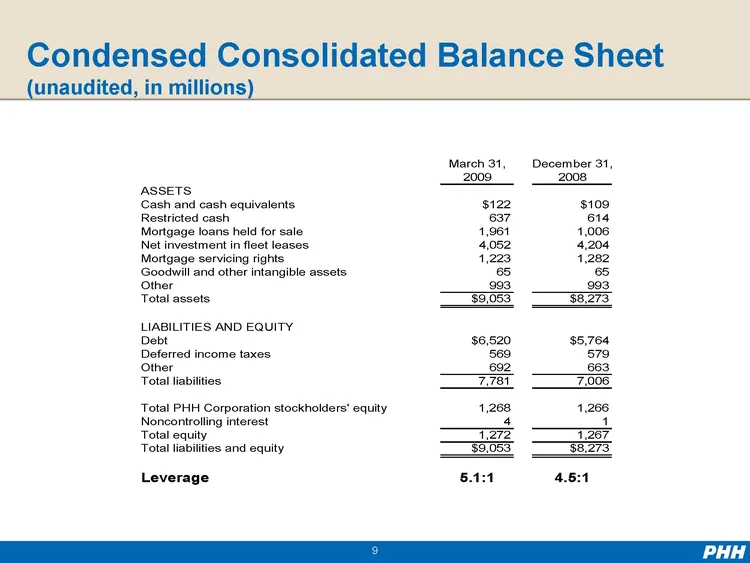
Condensed Consolidated Balance Sheet (unaudited, in millions) March 31, December 31, 2009 2008 ASSETS Cash and cash equivalents $122 $109 Restricted cash 637 614 Mortgage loans held for sale 1,961 1,006 Net investment in fleet leases 4,052 4,204 Mortgage servicing rights 1,223 1,282 Goodwill and oth
Slide 10: Mortgage Segments
Mortgage Segments PHH
Slide 11: Mortgage Production Segment Q109 Overview
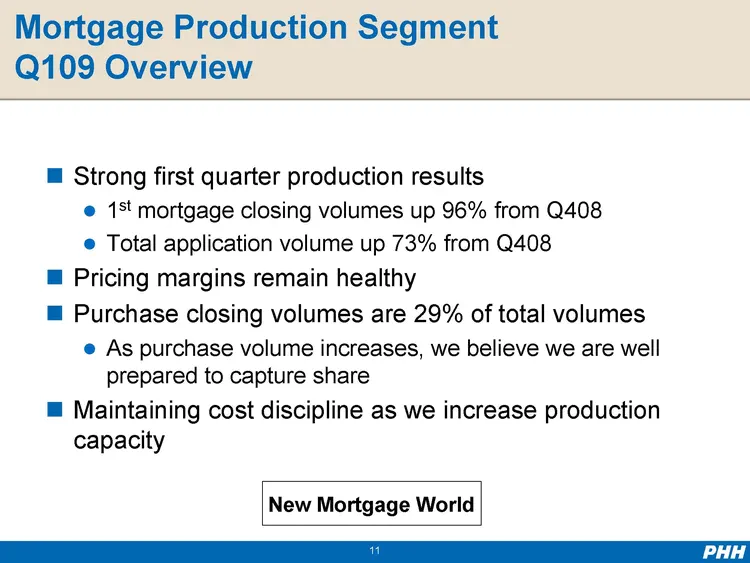
Mortgage Production Segment Q109 Overview ?Strong first quarter production results ? 1 st mortgage closing volumes up 96% from Q408?Total application volume up 73% from Q408 ?Pricing margins remain healthy ?Purchase closing volumes are 29% of total volumes ? As purchase volume increases, we believe
Slide 12: Adjusted Mortgage Production Segment Results
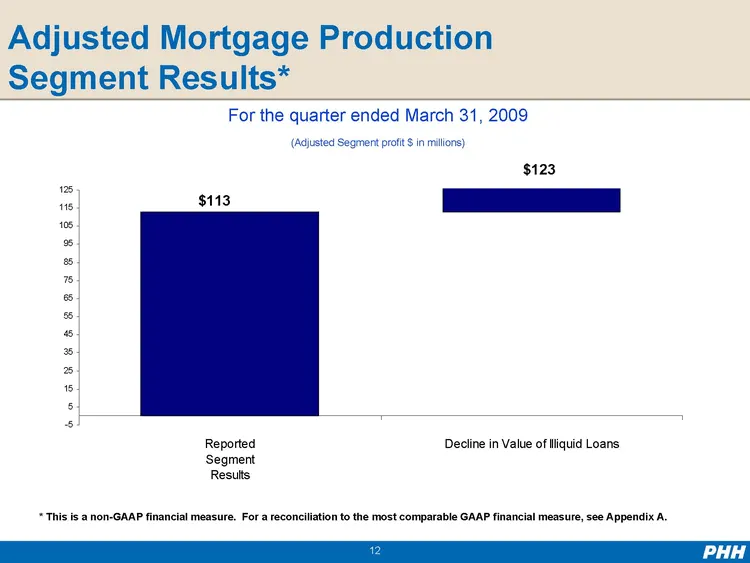
Adjusted Mortgage Production Segment Results* For the quarter ended March 31, 2009 (Adjusted Segment profit $ in millions) $123 125 $113 115 105 95 85 75 65 55 45 35 25 15 5 - -5 Reported Decline in Value of Illiquid Loans Segment Results * This is a non-GAAP financial measure. For a reconciliation
Slide 13: New Mortgage World Pricing Margin and Volume
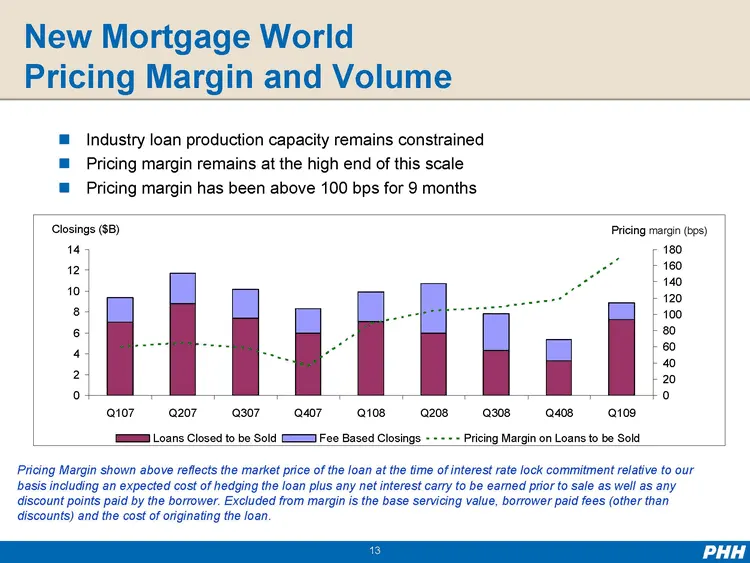
New Mortgage World Pricing Margin and Volume ??Industry loan production capacity remains constrained??Pricing margin remains atthe high end of this scale??Pricing margin has been above 100 bps for 9 months Closings ($B) Pricing margin (bps) 14 180 12 160 140 10 120 8 100 6 80 60 4 40 2 20 0 0 Q107 Q
Slide 14: Production Segment 2009 Outlook
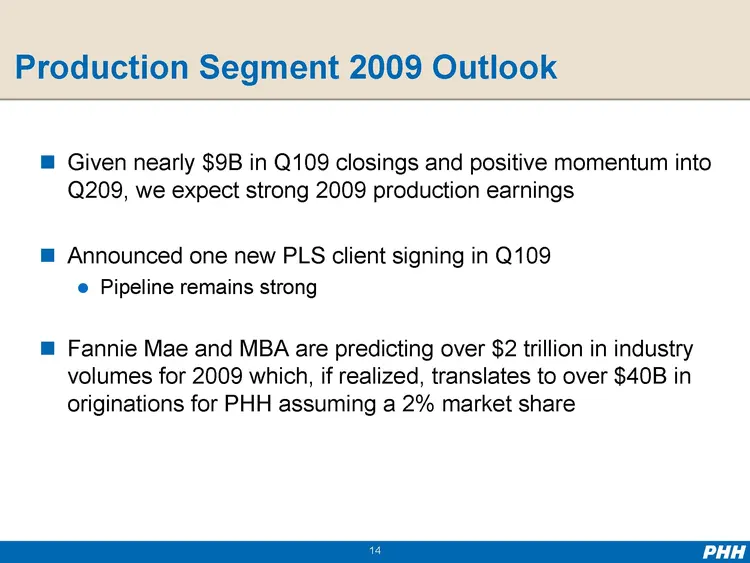
Production Segment 2009 Outlook ?Given nearly $9B in Q109 closings and positive momentum into Q209, we expect strong 2009 production earnings ?Announced one new PLS client signing in Q109 ? Pipeline remains strong ?Fannie Mae and MBA are predicting over $2 trillion in industry volumes for 2009 which
Slide 15: Mortgage Production Annualized Potential Profitability Sensitivity
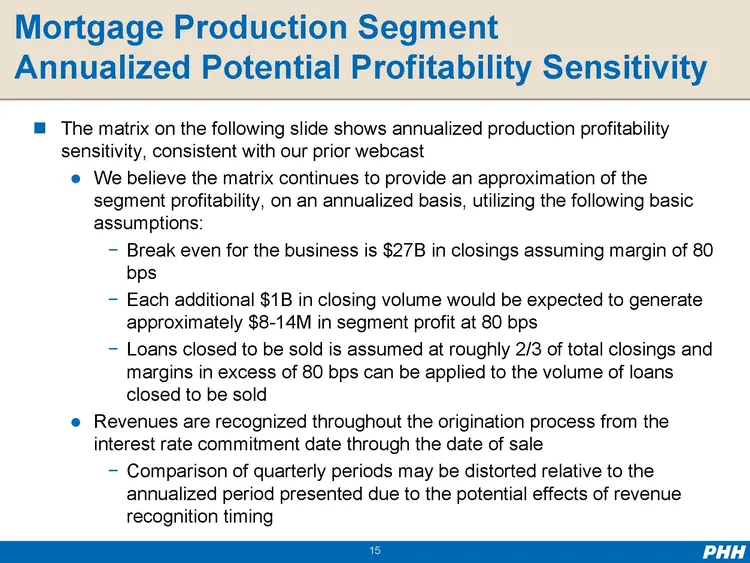
Mortgage Production Segment Annualized Potential Profitability Sensitivity ??The matrix on the following slide shows annualized production profitability sensitivity, consistent with our prior webcast??We believe the matrix continues to provide an approximation of the segment profitability, on an ann
Slide 16: Mortgage Production Annualized Profit Sensitivity Matrix
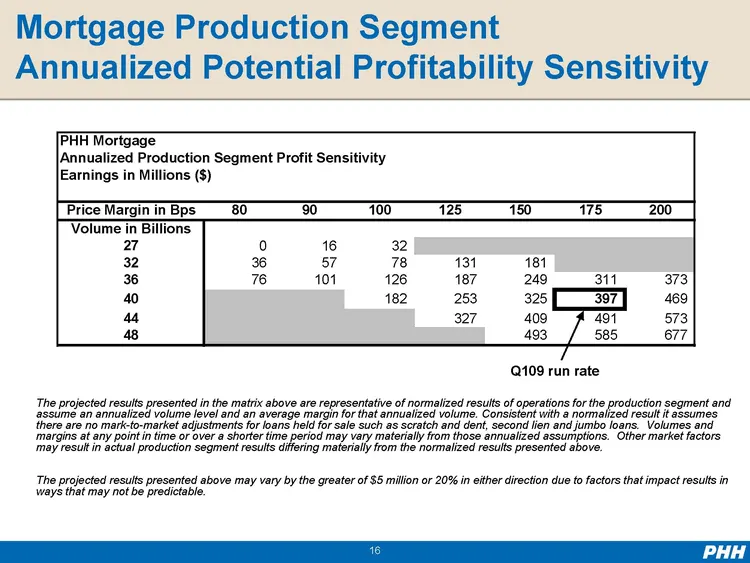
Mortgage Production Segment Annualized Potential Profitability Sensitivity PHH Mortgage Annualized Production Segm ent Profit Sensitivity Earnings in Millions ($) Price Margin in Bps 80 90 100 125 150 175 200 Volume in Billions 27 0 16 32 32 36 57 78 131 181 36 76 101 126 187 249 311 373 40 182 253
Slide 17: Mortgage Servicing Segment Q109 Overview
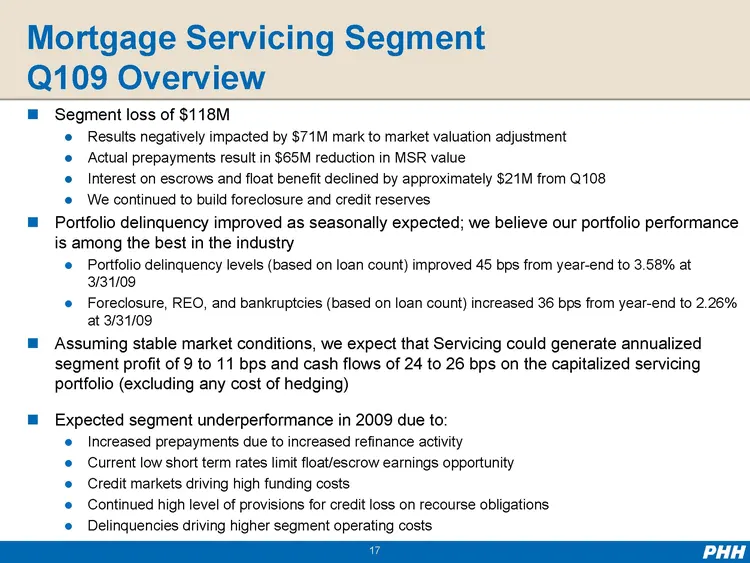
Mortgage Servicing Segment Q109 Overview ??Segment loss of $118M ??Results negatively impacted by $71M mark to market valuation adjustment ? Actual prepayments result in $65M reduction in MSR value??Interest on escrows and float benefit declined by approximately $21M from Q108??We continued to build
Slide 18: Adjusted Mortgage Servicing Segment Results
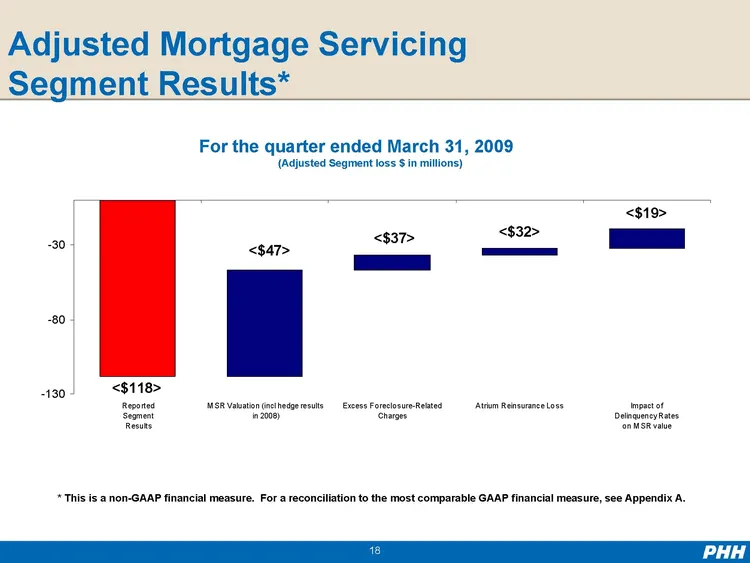
Adjusted Mortgage Servicing Segment Results* For the quarter ended March 31, 2009 (Adjusted Segment loss $ in millions) <$19> <$37> <$32> - -30 <$47> -80 -130 <$118> Reported M SR Valuation (incl hedge results Excess Foreclosure-Related Atrium Reinsurance Loss Impact of Segment in 2008) Charges Deli
Slide 19: Bridging Q109 Servicing Results to Hypothetical Annualized Profit
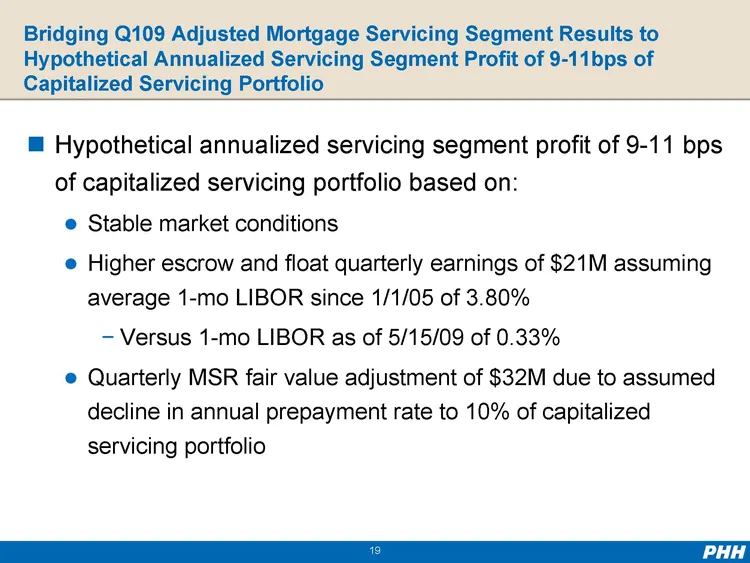
Bridging Q109 Adjusted Mortgage Servicing Segment Results to Hypothetical Annualized Servicing Segment Profit of 9-11bps of Capitalized Servicing Portfolio ?Hypothetical annualized servicing segment profit of 9-11 bps of capitalized servicing portfolio based on: ?Stable market conditions ?Higher esc
Slide 20: MSR Valuation
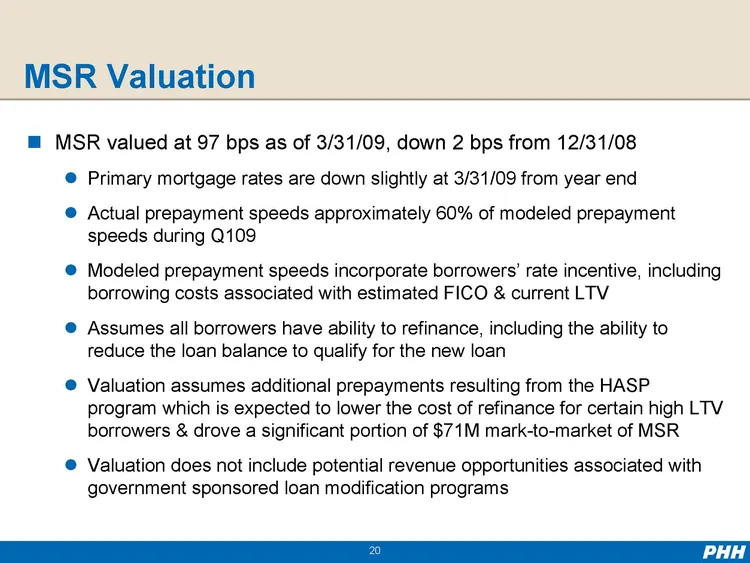
MSR Valuation ??MSR valued at 97 bps as of 3/31/09, down 2 bps from 12/31/08 ? Primary mortgage rates are down slightly at 3/31/09 from year end?Actual prepayment speeds approximately 60% of modeled prepayment speeds during Q109 ?Modeled prepayment speeds incorporate borrowers’ rate incentive, inclu
Slide 21: Superior Servicing Portfolio Performance
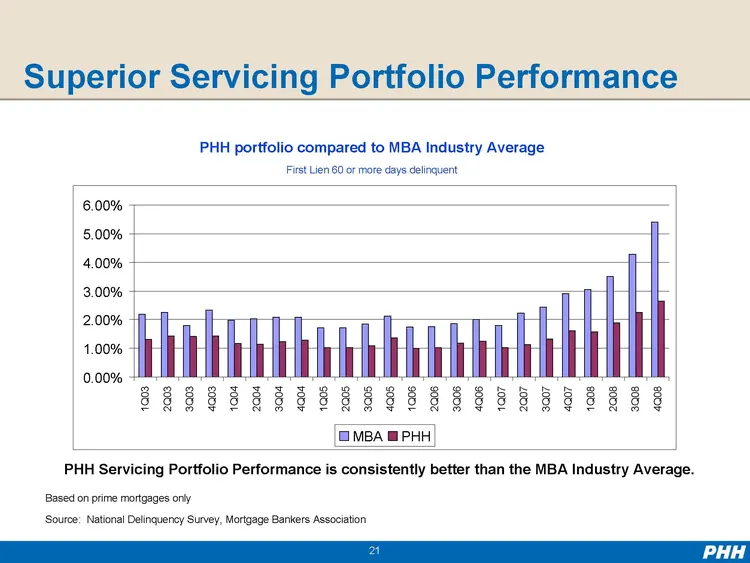
Superior Servicing Portfolio Performance PHH portfolio compared to MBA Industry Average First Lien 60 or more days delinquent 0.00% 1.00% 2.00% 3.00% 4.00% 5.00% 6.00% 1Q03 2Q03 3Q03 4Q03 1Q04 2Q04 3Q04 4Q04 1Q05 2Q05 MBA 3Q05 4Q05 PHH 1Q06 2Q06 3Q06 4Q06 1Q07 2Q07 3Q07 4Q07 1Q08 2Q08 3Q08 4Q08 PHH
Slide 22: Mortgage Recourse & Reserves
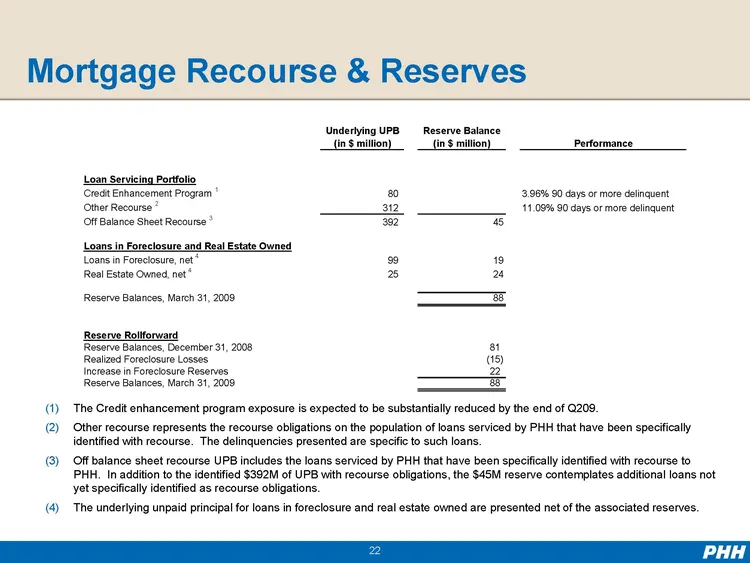
Mortgage Recourse & Reserves Underlying UPBReserve Balance (in $million)(in $million)Performance Loan Servicing Portfolio Credit Enhancement Program 1 80 3.96% 90 days or more delinquent Other Recourse 2 312 11.09% 90 days or more delinquent Off Balance Sheet Recourse 3 392 45 Loans in Foreclosure a
Slide 23: Atrium Reinsurance
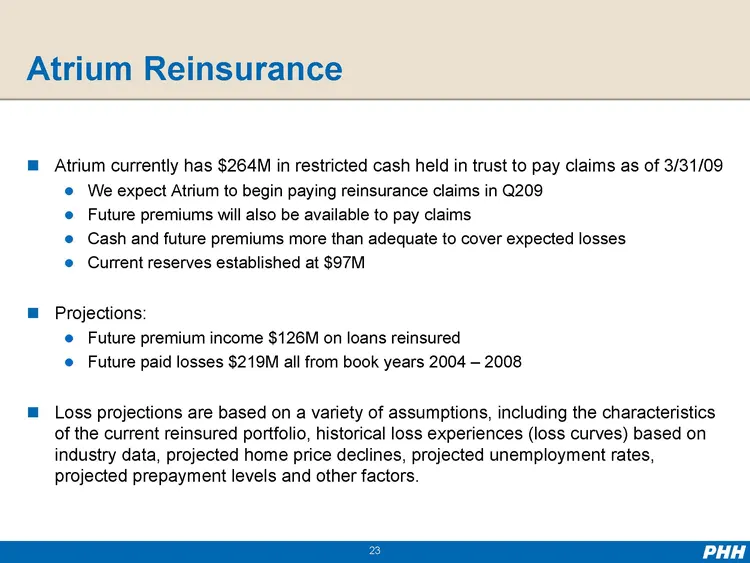
Atrium Reinsurance ??Atrium currently has $264M in restricted cash held in trust to pay claims as of 3/31/09 ??We expect Atrium to begin paying reinsurance claims in Q209??Future premiums will also be available to pay claims ??Cash and future premiums more than adequate to cover expected losses??Cur
Slide 24: Impact of Government Mortgage Programs
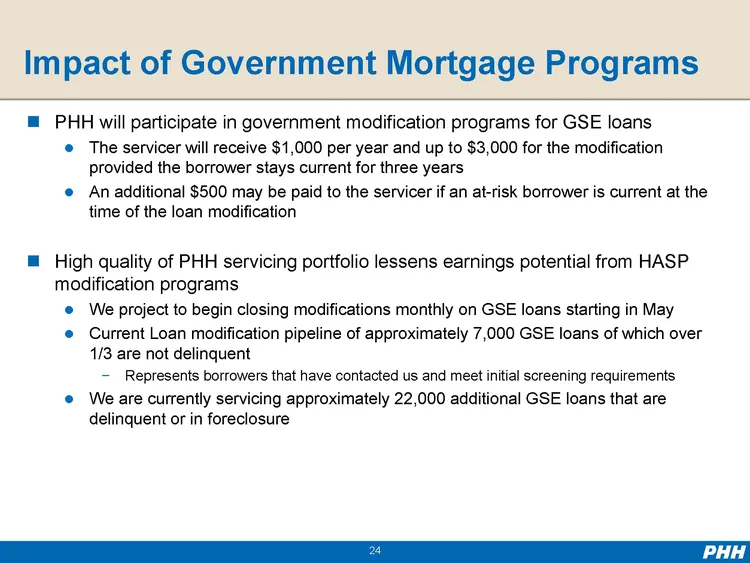
Impact of Government Mortgage Programs ??PHH will participate in government modification programs for GSE loans ??The servicer will receive $1,000 per year and up to $3,000 for the modification provided the borrower stays current for three years $ ??An additional 500 may be paid to the servicer if a
Slide 25: 2009 Mortgage Opportunities & Risks
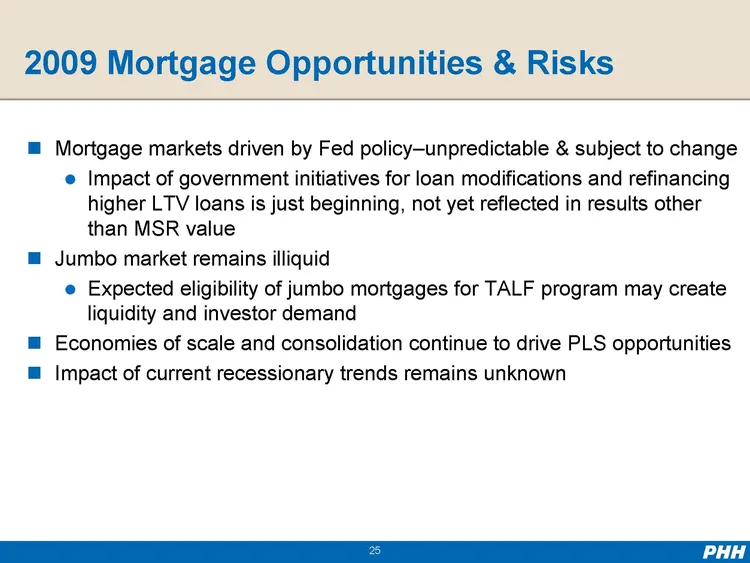
2009 Mortgage Opportunities & Risks ??Mortgage markets driven by Fed policy—unpredictable & subject to change? Impact of government initiatives for loan modifications and refinancing higher LTV loans is just beginning, not yet reflected in results other than MSR value??Jumbo market remains illiquid?
Slide 26: Mortgage Outlook — assuming stable rates
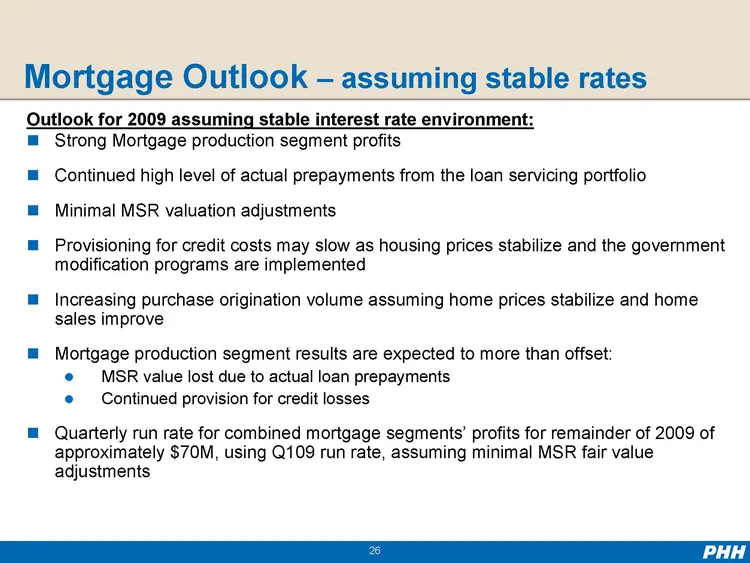
Mortgage Outlook — assuming stable rates Outlook for 2009 assuming stable interest rate environment: ??Strong Mortgage production segment profits ??Continued high level of actual prepayments from the loan servicing portfolio??Minimal MSR valuation adjustments ??Provisioning for credit costs may slow
Slide 27: New Mortgage World
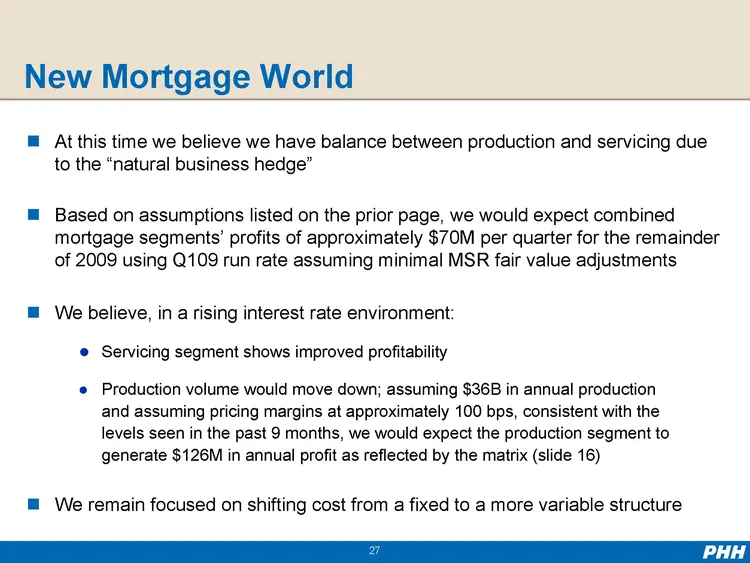
New Mortgage World ??At this time we believe we have balance between production and servicing due to the “natural business hedge” ??Based on assumptions listed on the prior page, we would expect combined mortgage segments’ profits of approximately $70M per quarter for the remainder of 2009 using Q10
Slide 28: Fleet Management Services Segment
Fleet Management Services Segment 28
Slide 29: Fleet Management Services Segment Q109 Overview
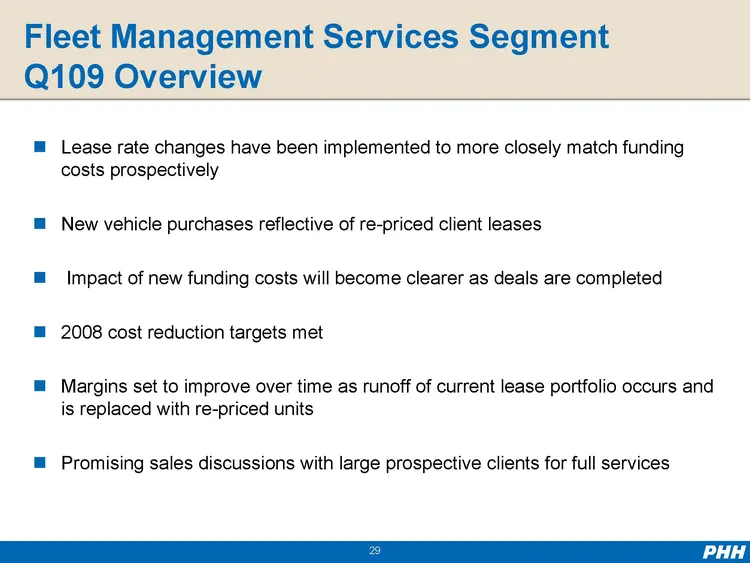
Fleet Management Services Segment Q109 Overview ??Lease rate changes have been implemented to more closely match funding costs prospectively ??New vehicle purchases reflective of re-priced client leases ??Impact of new funding costs will become clearer as deals are completed ??2008 cost reduction ta
Slide 30: Adjusted Fleet Management Services Segment Results
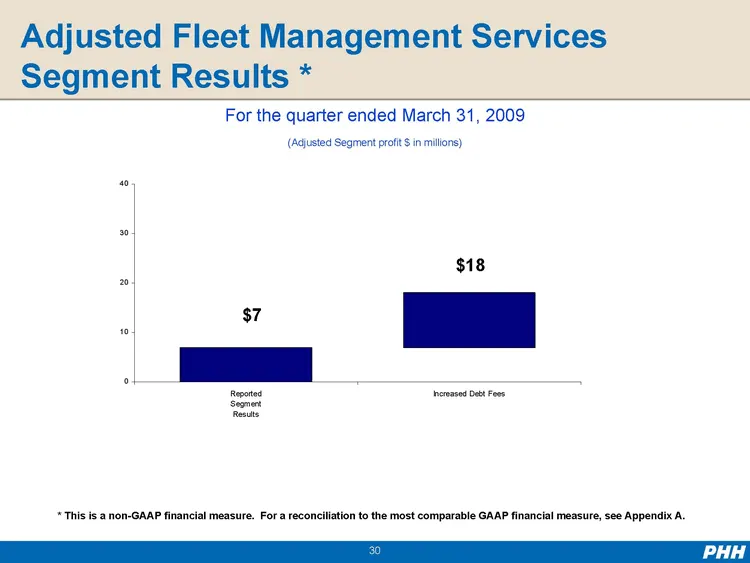
Adjusted Fleet Management Services Segment Results * For the quarter ended March 31, 2009 (Adjusted Segment profit $ in millions) 40 30 $18 20 $7 10 0 Reported Increased Debt Fees Segment Results * This is a non-GAAP financial measure. For a reconciliation to the most comparable GAAP financial measu
Slide 31: Fleet Funding Update
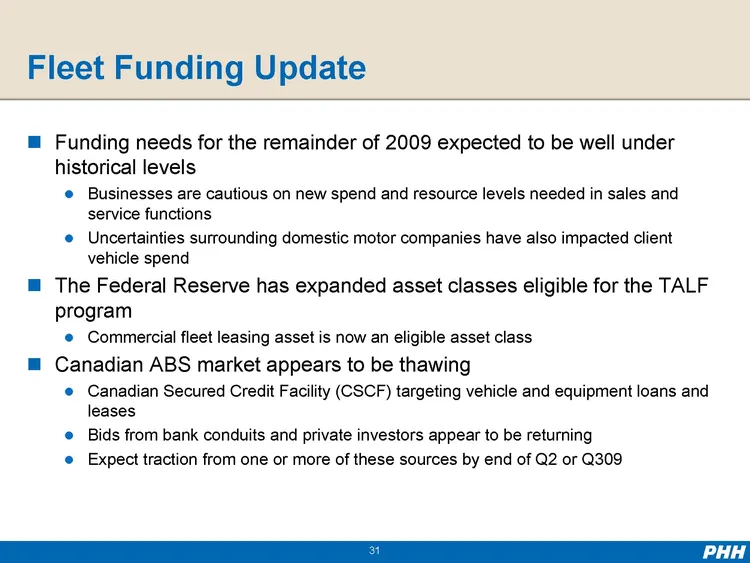
Fleet Funding Update ??Funding needs for the remainder of 2009 expected to be well under historical levels ??Businesses are cautious on new spend and resource levels needed in sales and service functions??Uncertainties surrounding domestic motor companies have also impacted client vehicle spend ??Th
Slide 32: Fleet Management Services Segment 2009 Outlook
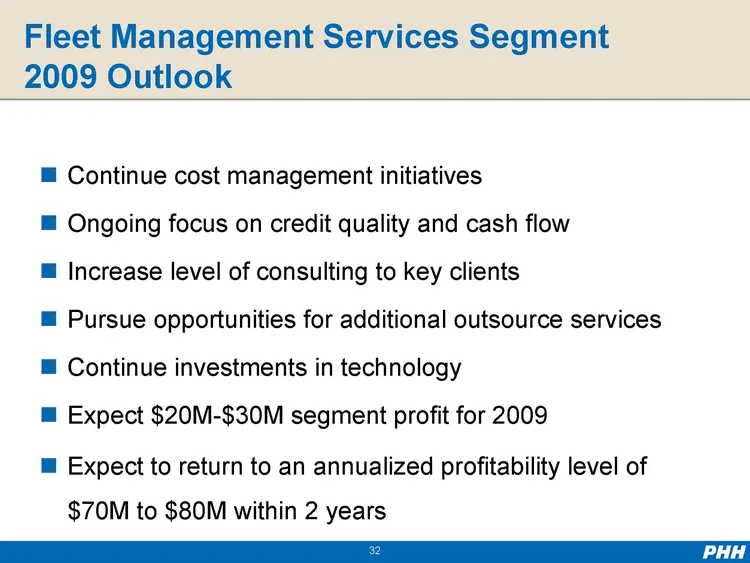
Fleet Management Services Segment 2009 Outlook ?Continue cost management initiatives?Ongoing focus on credit quality and cash flow ?Increase level of consulting to key clients ?Pursue opportunities for additional outsource services ?Continue investments in technology ?Expect $20M-$30M segment profit
Slide 33: PHH Expected Results in the New Mortgage World
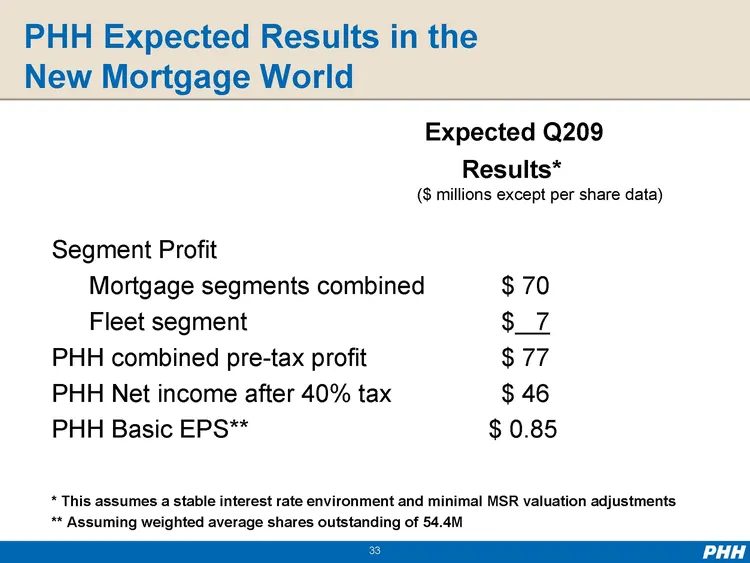
PHH Expected Results in the New Mortgage World Expected Q209 Results* ($ millions except per share data) Segment Profit Mortgage segments combined $70 Fleet segment $7 PHH combined pre-tax profit $77 PHH Net income after 40% tax $46 PHH Basic EPS** $0.85 * This assumes a stable interest rate environ
Slide 34: Funding Strategy
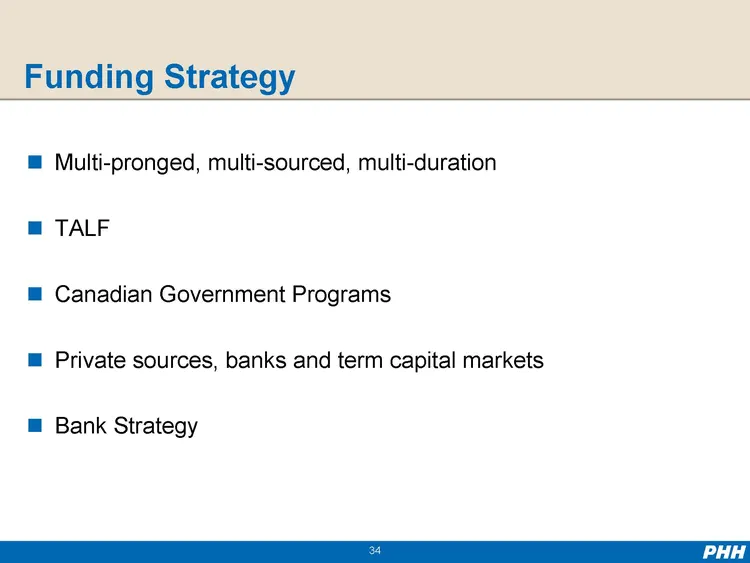
Funding Strategy ?Multi-pronged, multi-sourced, multi-duration ?TALF ?Canadian Government Programs ?Private sources, banks and term capital markets ?Bank Strategy 34
Slide 35: Summary
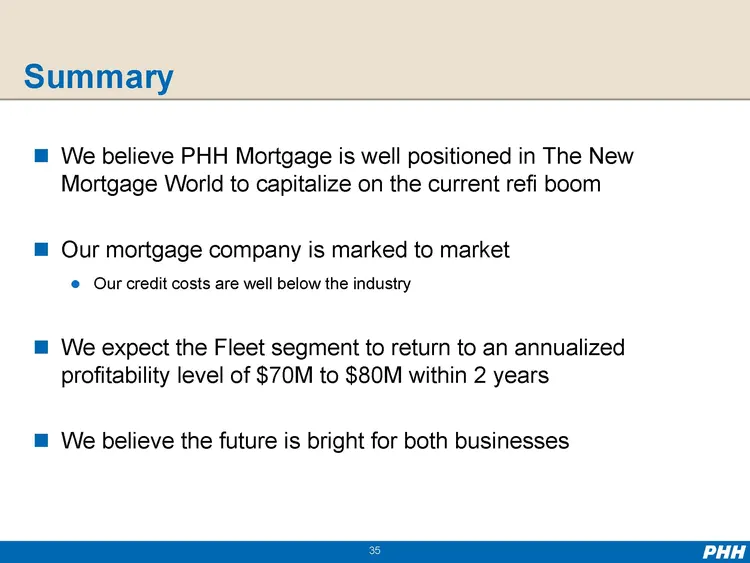
Summary ?We believe PHH Mortgage is well positioned in The New Mortgage World to capitalize on the current refi boom ?Our mortgage company is marked to market ? Our credit costs are well below the industry ?We expect the Fleet segment to return to an annualized profitability level of $70M to $80M wi

Slide 36: Questions and Answers
Questions and Answers 36
Slide 37: Appendix A
Appendix A 37
Slide 38: Non-GAAP Operating Profit Reconciliation
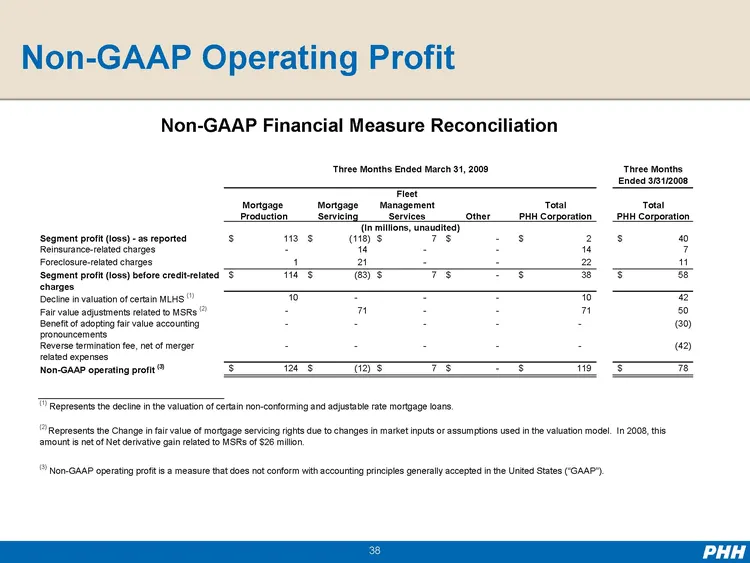
Non-GAAP Operating Profit Non-GAAP Financial Measure Reconciliation Three Months Ended March 31, 2009 Three Months Ended 3/31/2008 Fleet Mort gage Mortgage Mana gement Total Total Production Servicing Services Other PHH Cor poration PHH Cor &n bsp; poration (In millions, unaudited) Segment profit (l
Slide 39: Adjusted Mortgage Production Segment Profit
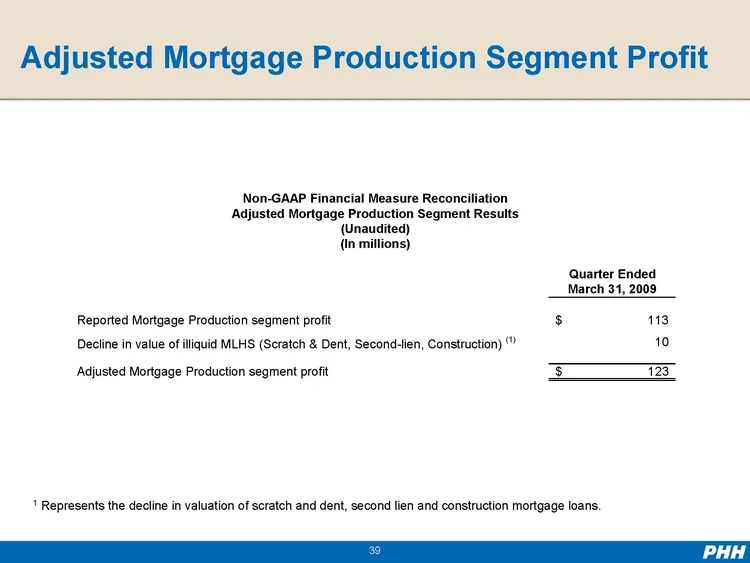
Adjusted Mortgage Production Segment Profit Non-GAAP Financial Measure Reconciliation Adjusted Mortgage Production Segment Results (Unaudited) (In millions) Quarter Ended March 31, 2009 Reported Mortgage Production segment profit $113 Decline in value of illiquid MLHS (Scratch & Dent, Second-lien, C
Slide 40: Adjusted Mortgage Servicing Segment Profit
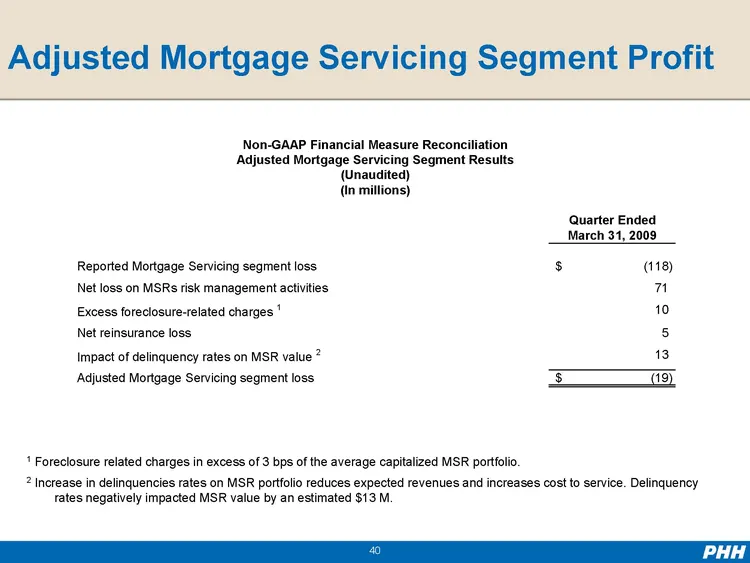
Adjusted Mortgage Servicing Segment Profit Non-GAAP Financial Measure Reconciliation Adjusted Mortgage Servicing Segment Results (Unaudited) (In millions) Quarter Ended March 31, 2009 Reported Mortgage Servicing segment loss $(118 Net loss on MSRs risk management activities 71 Excess foreclosure-rel
Slide 41: Adjusted Fleet Management Services Segment Profit
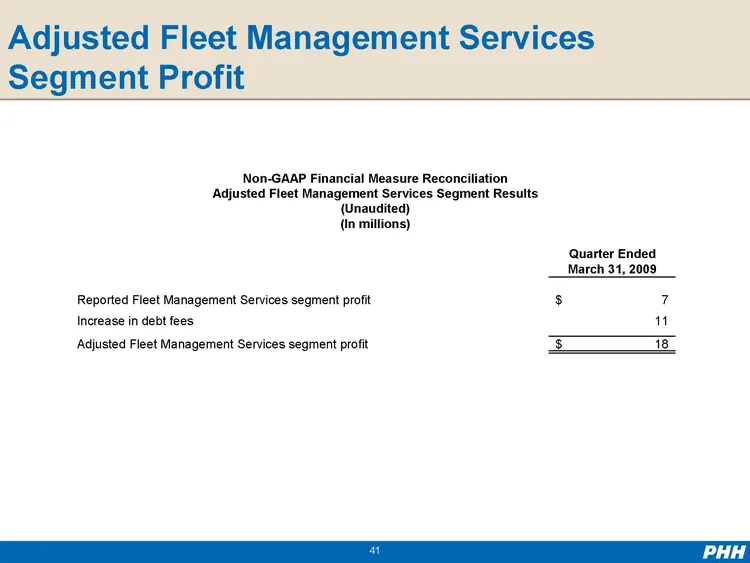
Adjusted Fleet Management Services Segment Profit Non-GAAP Financial Measure Reconciliation Adjusted Fleet Management Services Segment Results (Unaudited) (In millions) Quarter Ended March 31, 2009 Reported Fleet Management Services segment profit $7 Increase in debt fees 11 Adjusted Fleet Managemen
Source: SEC EDGAR · DEFA14A filed Jun 3, 2009
More decks from PHH Corporation
 Merger or Acquisition (February 2018)12 slides · Feb 28, 2018
 Q1 2017 Earnings Presentation34 slides · May 10, 2017
 Investor Presentation (February 2013)26 slides · Feb 12, 2013
 KBW Investment Management & Specialty Finance Conference 201116 slides · Jun 7, 2011
 FBR Capital Markets Fall Investor Conference 201016 slides · Nov 29, 2010
 Q2 2010 Earnings Presentation13 slides · Aug 3, 2010