PHH — FBR Capital Markets Fall Investor Conference 2010
16 slides from PHH's conference presentation, Nov 29, 2010

Slide 1: FBR Capital Markets Fall Investor Conference
FBR Capital Markets Fall Investor Conference November 30, 2010 Exhibit 99.1
Slide 2: Important Disclosures
Important Disclosures Forward-Looking Statements Statements in this presentation that are not historical facts are forward-looking statements within the meaning of Section 27A of the Securities Act of 1933, as amended, and Section 21E of the Securities Exchange Act of 1934, as amended. Such forward-
Slide 3: PHH Overview
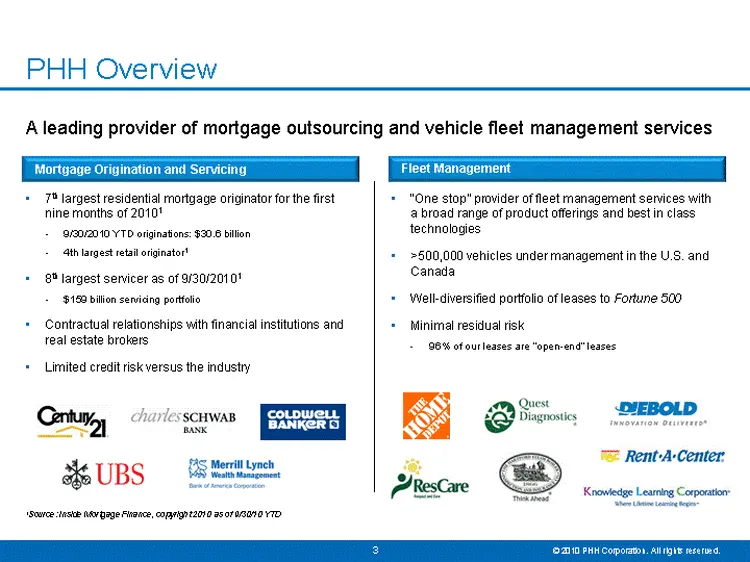
A leading provider of mortgage outsourcing and vehicle fleet management services PHH Overview 7th largest residential mortgage originator for the first nine months of 20101 9/30/2010 YTD originations: $30.6 billion 4th largest retail originator1 8th largest servicer as of 9/30/20101 $159 billion ser
Slide 4: PHH Mortgage - A Compelling Business Model
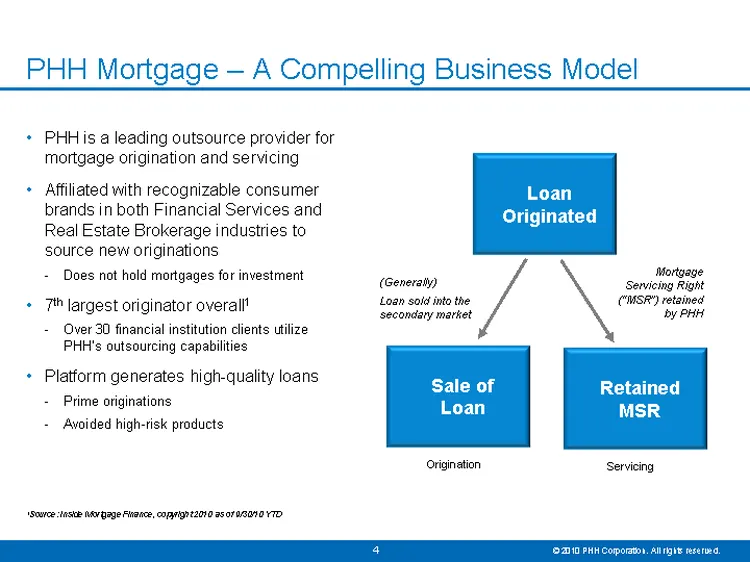
PHH is a leading outsource provider for mortgage origination and servicing Affiliated with recognizable consumer brands in both Financial Services and Real Estate Brokerage industries to source new originations Does not hold mortgages for investment 7th largest originator overall1 Over 30 financial
Slide 5: Mortgage Servicing Enhancing Long-Term Servicing Value
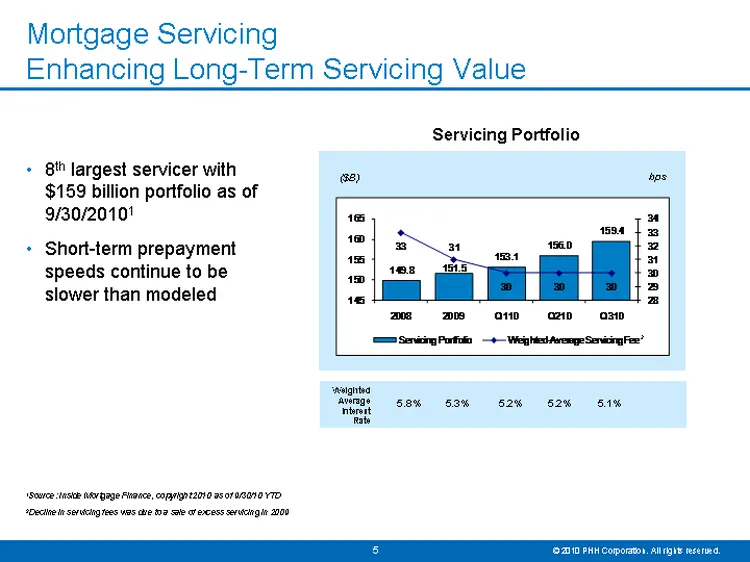
8th largest servicer with $159 billion portfolio as of 9/30/20101 Short-term prepayment speeds continue to be slower than modeled Mortgage Servicing Enhancing Long-Term Servicing Value Servicing Portfolio ($B) Weighted Average Interest Rate 5.8% 5.3% 5.2% 5.2% 5.1% 1Source: Inside Mortgage Finance,
Slide 6: Nationwide Presence Through Broad Market Footprint
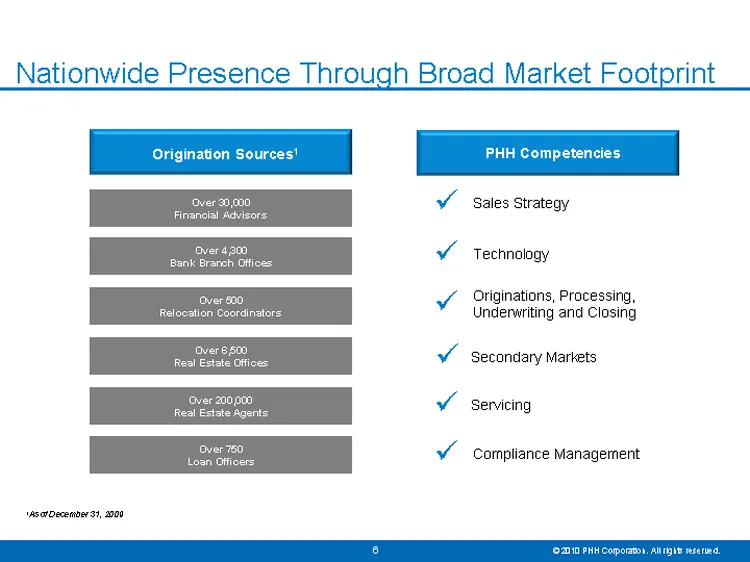
Nationwide Presence Through Broad Market Footprint Origination Sources1 PHH Competencies Over 30,000 Financial Advisors Over 4,300 Bank Branch Offices Over 500 Relocation Coordinators Over 6,500 Real Estate Offices Over 200,000 Real Estate Agents Over 750 Loan Officers Sales Strategy ? Technology ?
Slide 7: Strong Origination Franchise
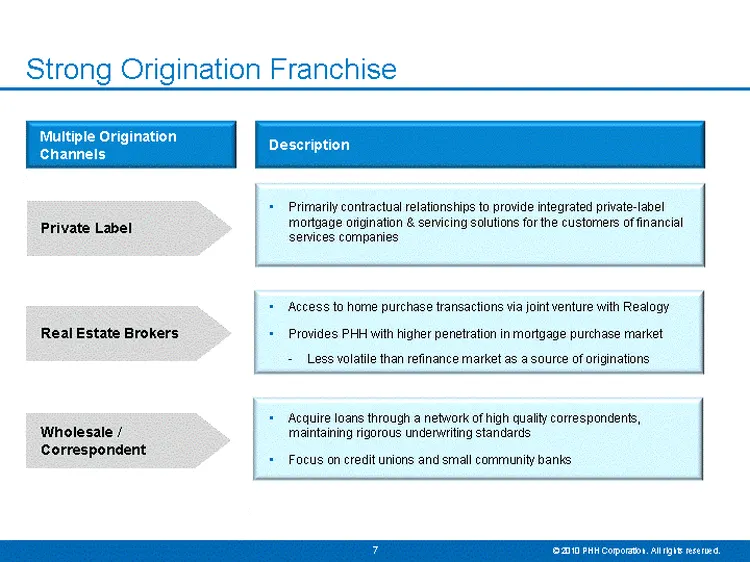
Strong Origination Franchise Private Label Multiple Origination Channels Description Real Estate Brokers Primarily contractual relationships to provide integrated private-label mortgage origination & servicing solutions for the customers of financial services companies Access to home purchase transa
Slide 8: 2010 Performance: GAAP Earnings vs. Core Earnings
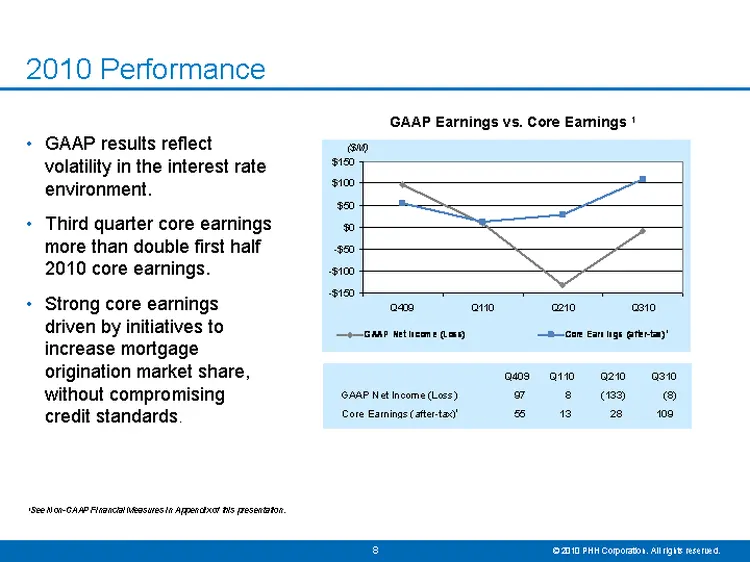
2010 Performance GAAP Earnings vs. Core Earnings 1 GAAP results reflect volatility in the interest rate environment. Third quarter core earnings more than double first half 2010 core earnings. Strong core earnings driven by initiatives to increase mortgage origination market share, without compromis
Slide 9: Illustrative Example of Mortgage Banking Profitability
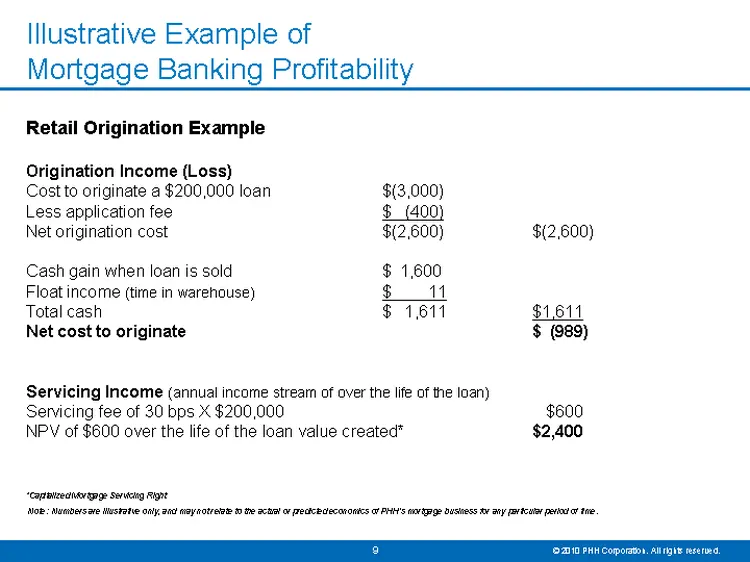
Illustrative Example of Mortgage Banking Profitability Origination Income (Loss) Cost to originate a $200,000 loan $(3,000) Less application fee $ (400) Net origination cost $(2,600) $(2,600) Cash gain when loan is sold $ 1,600 Float income (time in warehouse) $ 11 Total cash $ 1,611 $1,611 Net cost
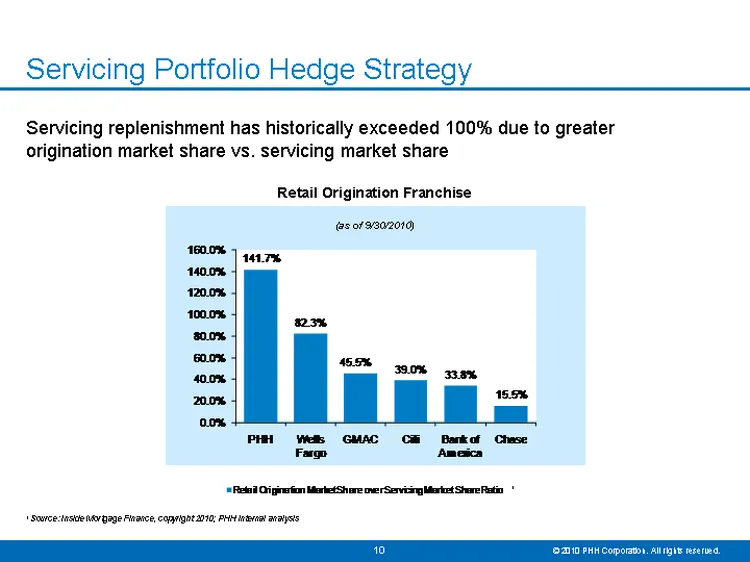
Slide 10: Servicing Portfolio Hedge Strategy
Servicing Portfolio Hedge Strategy Servicing replenishment has historically exceeded 100% due to greater origination market share vs. servicing market share Retail Origination Franchise (as of 9/30/2010) 1 Source: Inside Mortgage Finance, copyright 2010; PHH internal analysis 1
Slide 11: Fleet Management: One Stop Provider of Fleet Management Services
Fleet Management "One Stop" Provider of Fleet Management Services Industry leader Fully integrated service provider Innovation leader in technology for fleet industry Significant fee income and minimal residual risk Focus on quality corporate lessees Nearly one third of top 200 clients are Fortune 5
Slide 12: Transformation - 2010 Update
Transformation - Achieved estimated annualized run-rate expense benefits of approximately $83 million through 09/30/2010 Increased origination market share to 3% Increased wholesale/correspondent business Increased penetration in private label Improved core operating results Achieved liquidity plan
Slide 13: 2011 Outlook
Well-positioned to deliver after-tax Core ROE of 13% Business model with high barriers to entry Relatively low brick and mortar investment with large market footprint Significant additional market share available through greater penetration of existing channels Focus on building a low cost, flexible
Slide 14: Appendix
Appendix
Slide 15: Note Regarding Non-GAAP Financial Measures
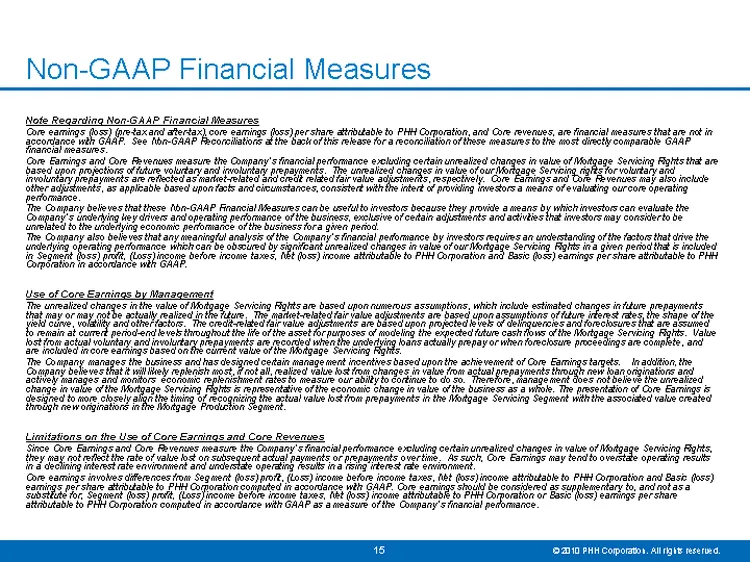
Note Regarding Non-GAAP Financial Measures Core earnings (loss) (pre-tax and after-tax), core earnings (loss) per share attributable to PHH Corporation, and Core revenues, are financial measures that are not in accordance with GAAP. See Non-GAAP Reconciliations at the back of this release for a reco
Slide 16: Reconciliation of GAAP Net Income (Loss) to Core Earnings (after-tax)
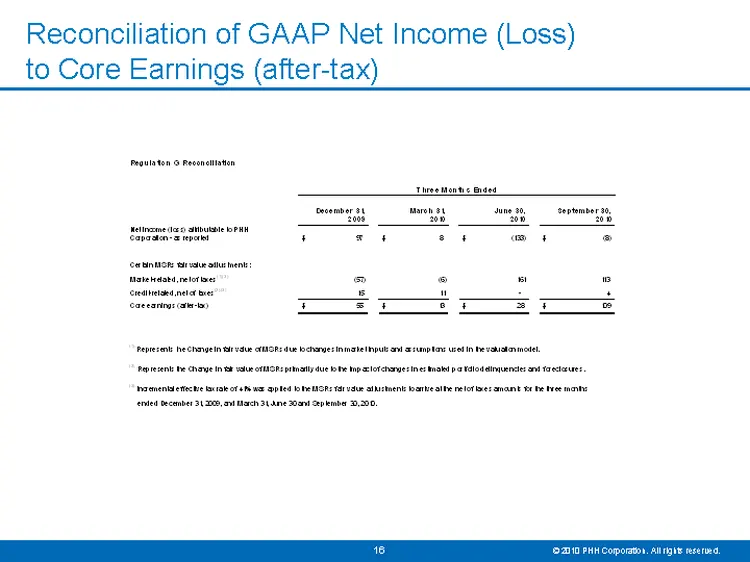
Reconciliation of GAAP Net Income (Loss) to Core Earnings (after-tax)
Source: SEC EDGAR · 8-K filed Nov 29, 2010
More decks from PHH Corporation
 Merger or Acquisition (February 2018)12 slides · Feb 28, 2018
 Q1 2017 Earnings Presentation34 slides · May 10, 2017
 Investor Presentation (February 2013)26 slides · Feb 12, 2013
 KBW Investment Management & Specialty Finance Conference 201116 slides · Jun 7, 2011
 Q2 2010 Earnings Presentation13 slides · Aug 3, 2010
 Q2 2010 Earnings Presentation22 slides · Aug 3, 2010