EarthLink — Investor Presentation (November 2015)
23 slides from EarthLink's investor presentation, Nov 9, 2015
Slide 1: EarthLink Investor Overview
EarthLink Investor Overview
Slide 2: Company History
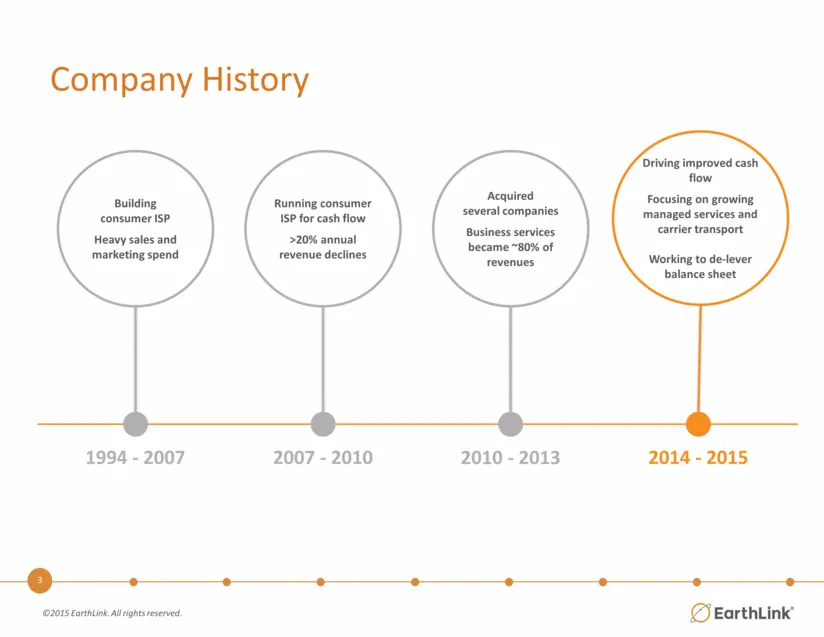
Company History Building consumer ISP Heavy sales and marketing spend Acquired several companies Business services became ~80% of revenues Running consumer ISP for cash flow >20% annual revenue declines Driving improved cash flow Focusing on growing managed services and carrier transport Working to
Slide 3: EarthLink Businesses
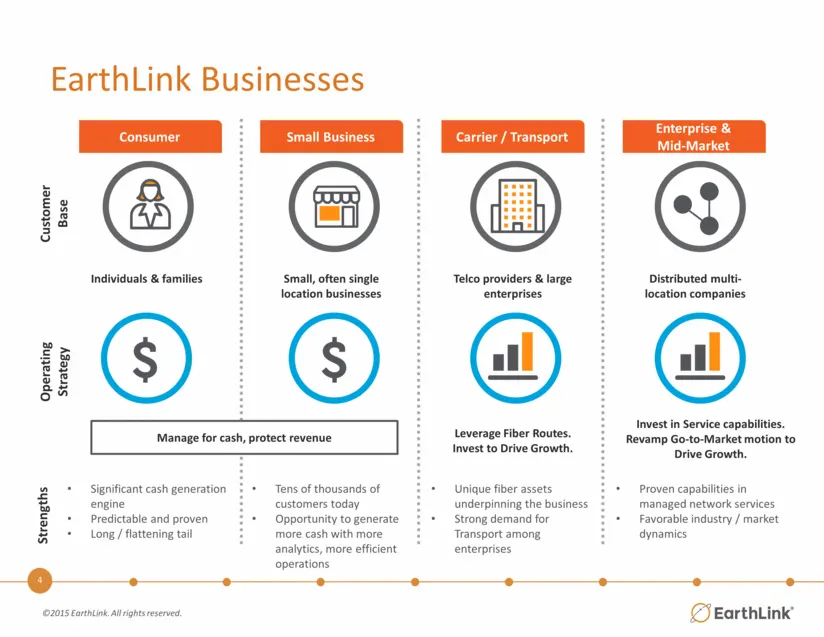
EarthLink Businesses Customer Base Operating Strategy Consumer Small Business Carrier / Transport Enterprise & Mid-Market Individuals & families Telco providers & large enterprises Small, often single location businesses Distributed multi-location companies Manage for cash, protect revenue Proven ca
Slide 4: 2015 Agenda
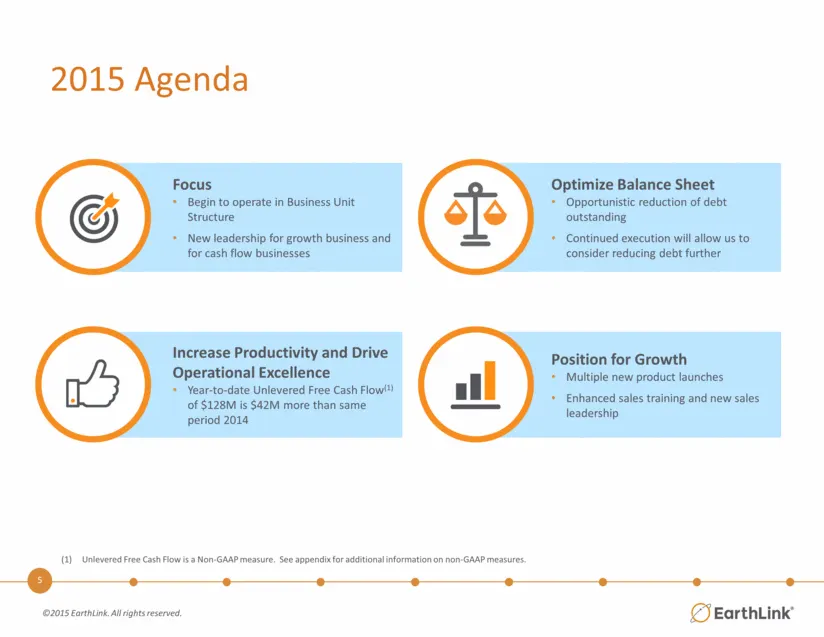
Optimize Balance Sheet Opportunistic reduction of debt outstanding Continued execution will allow us to consider reducing debt further Position for Growth Multiple new product launches Enhanced sales training and new sales leadership Increase Productivity and Drive Operational Excellence Year-to-dat
Slide 5: Revenue, Adj. EBITDA and Cash Flow Trends
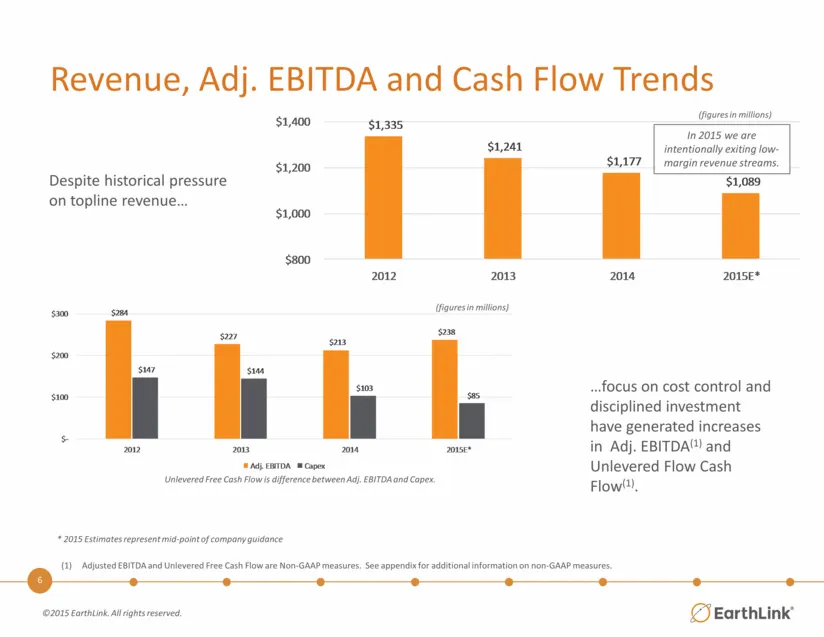
Revenue, Adj. EBITDA and Cash Flow Trends Despite historical pressure on topline revenue focus on cost control and disciplined investment have generated increases in Adj. EBITDA(1) and Unlevered Flow Cash Flow(1). (figures in millions) (figures in millions) * 2015 Estimates represent mid-point of co
Slide 6: Q3 2015 Financial Highlights
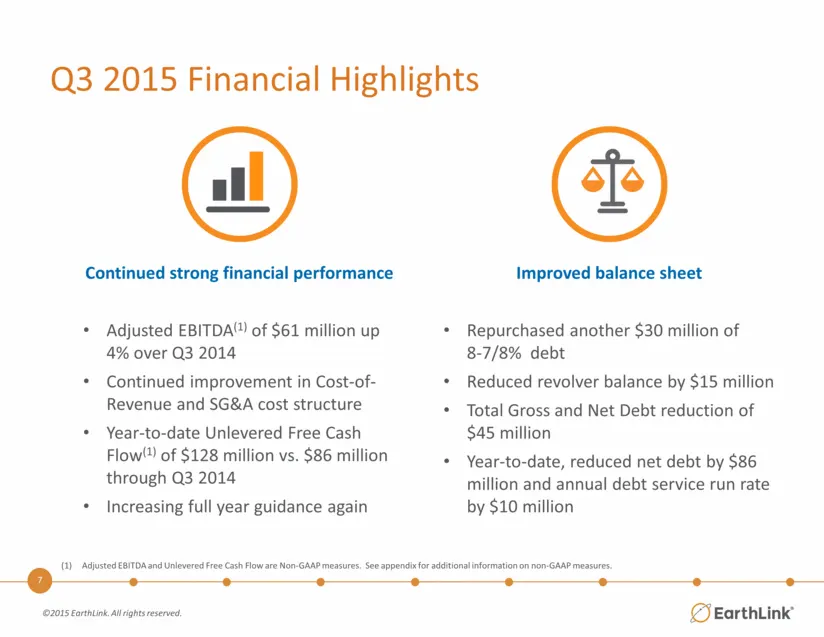
Continued strong financial performance Adjusted EBITDA(1) of $61 million up 4% over Q3 2014 Continued improvement in Cost-of-Revenue and SG&A cost structure Year-to-date Unlevered Free Cash Flow(1) of $128 million vs. $86 million through Q3 2014 Increasing full year guidance again Adjusted EBITDA an
Slide 7: Q3 2015 Business Unit Revenue & Gross Margin
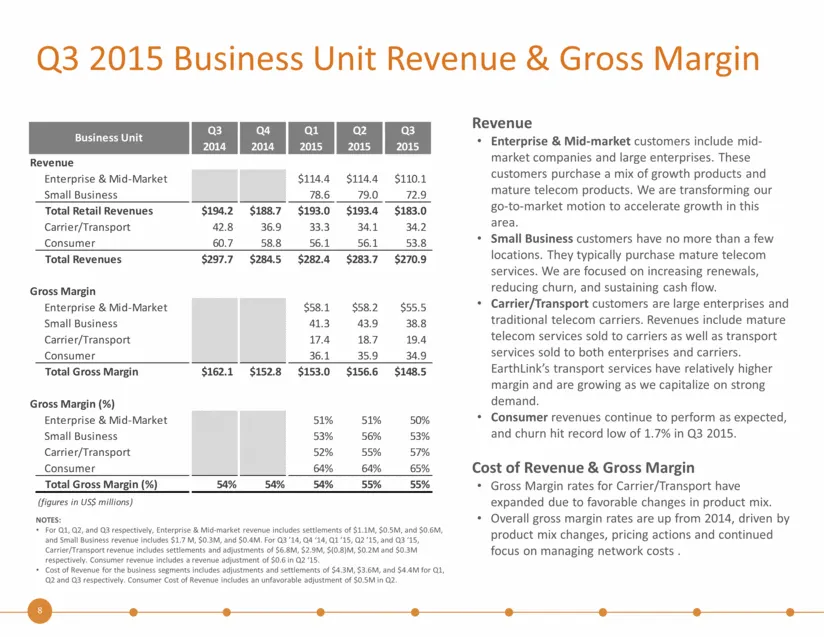
Q3 2015 Business Unit Revenue & Gross Margin Revenue Enterprise & Mid-market customers include mid-market companies and large enterprises. These customers purchase a mix of growth products and mature telecom products. We are transforming our go-to-market motion to accelerate growth in this area. Sma
Slide 8: Q3 2015 Operating & Financial Results
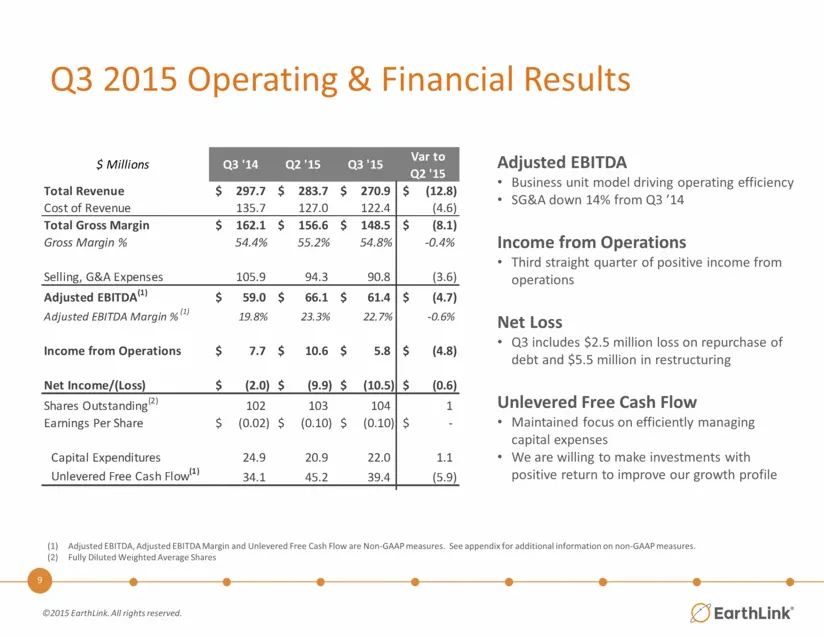
Q3 2015 Operating & Financial Results Adjusted EBITDA Business unit model driving operating efficiency SG&A down 14% from Q3 ’14 Income from Operations Third straight quarter of positive income from operations Net Loss Q3 includes $2.5 million loss on repurchase of debt and $5.5 million in restructu
Slide 9: Q3 2015 Balance Sheet and Cash Flow
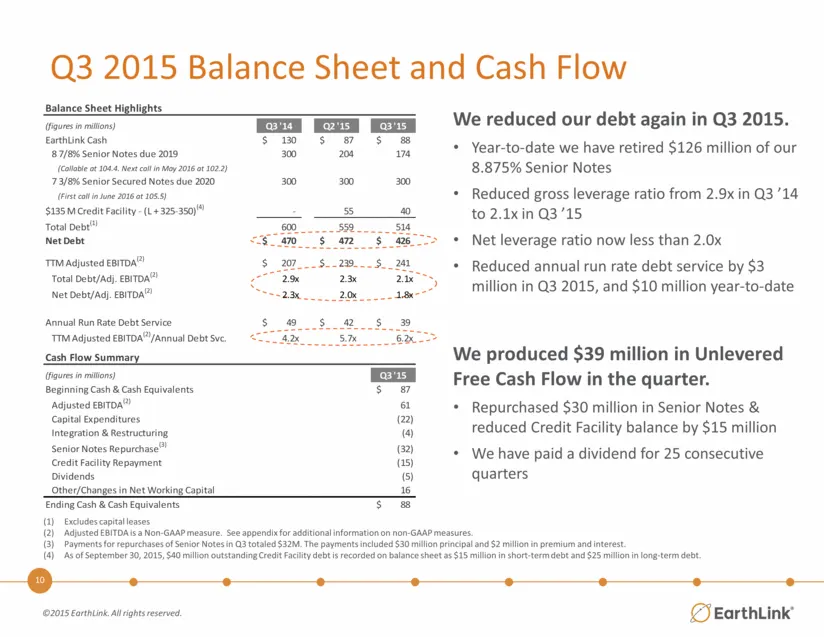
Q3 2015 Balance Sheet and Cash Flow We reduced our debt again in Q3 2015. Year-to-date we have retired $126 million of our 8.875% Senior Notes Reduced gross leverage ratio from 2.9x in Q3 ’14 to 2.1x in Q3 ’15 Net leverage ratio now less than 2.0x Reduced annual run rate debt service by $3 million i
Slide 10: 2015 Full Year Guidance
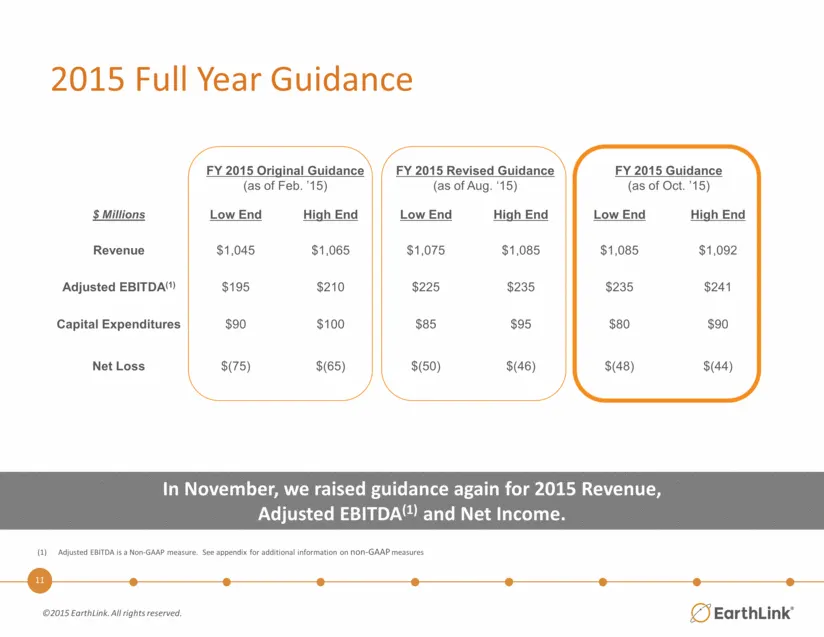
2015 Full Year Guidance FY 2015 Original Guidance (as of Feb. ’15) FY 2015 Revised Guidance (as of Aug. ‘15) FY 2015 Guidance (as of Oct. ’15) $ Millions Low End High End Low End High End Low End High End Revenue $1,045 $1,065 $1,075 $1,085 $1,085 $1,092 Adjusted EBITDA(1) $195 $210 $225 $235 $235 $
Slide 11: 2015 Full Year Guidance
2015 Full Year Guidance FY 2015 Original Guidance | / FY 2015 Revised Guidance FY 2015 Guidance (as of Feb. 15) (as of Aug. "15) {as of Oct. 15) SMillions Low End High End Low End High End Low End High End Revenue $1,045 $1,065 $1,075 $1,085 $1,085 $1,092 Adjusted EBITDA $195 $210 $225 $235 $235 $24
Slide 12: EarthLink Managed Services
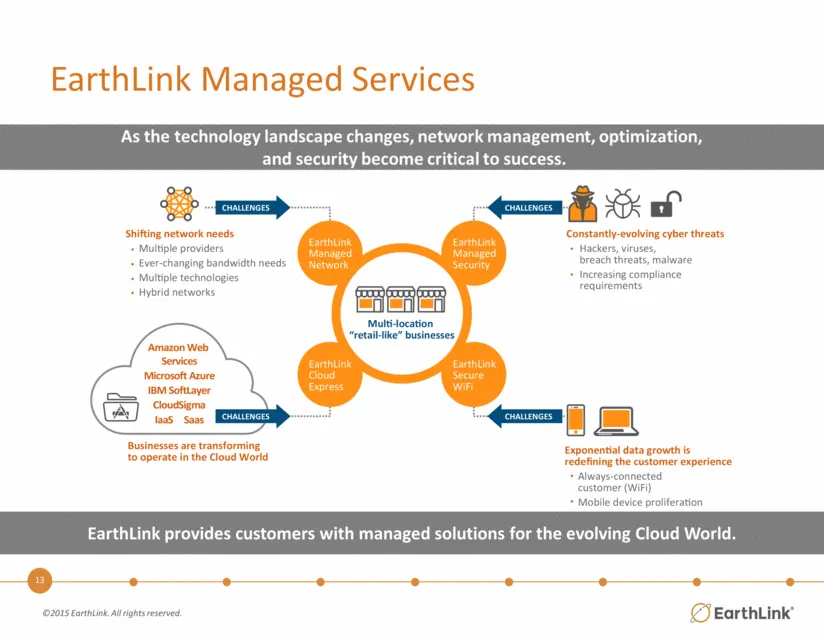
EarthLink Managed Services EarthLink provides customers with managed solutions for the evolving Cloud World.
Slide 13: Fiber & Infrastructure
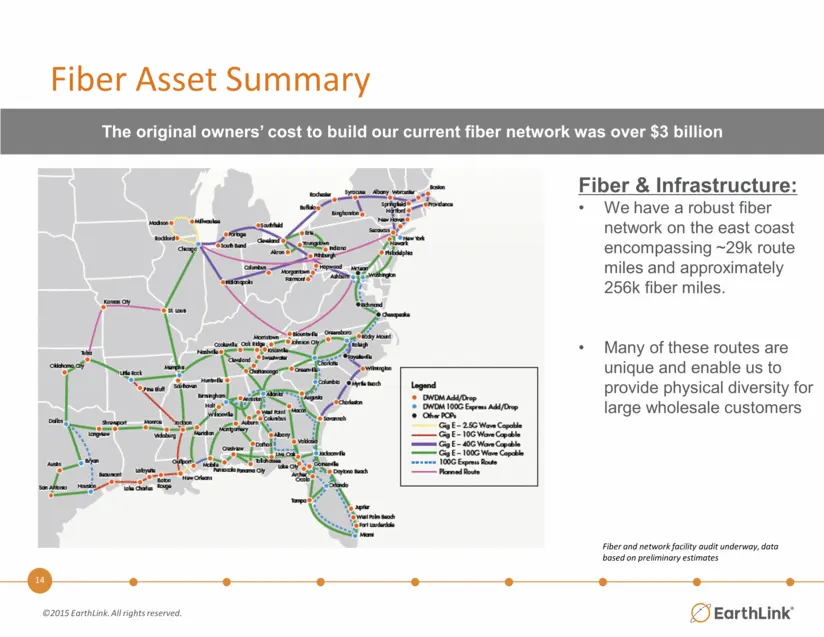
Fiber & Infrastructure: We have a robust fiber network on the east coast encompassing ~29k route miles and approximately 256k fiber miles. Many of these routes are unique and enable us to provide physical diversity for large wholesale customers Fiber and network facility audit underway, data based o
Slide 14: EarthLink Product & Brand
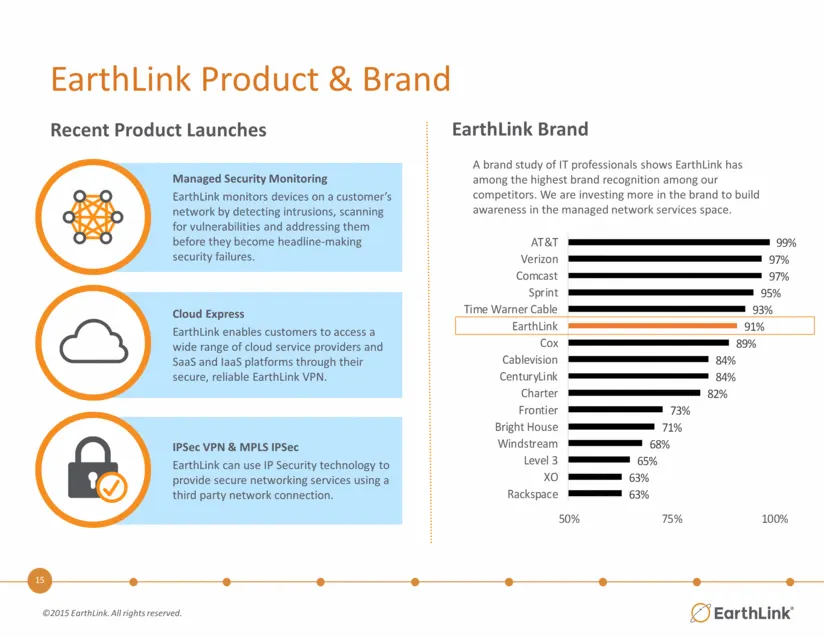
EarthLink Product & Brand Managed Security Monitoring EarthLink monitors devices on a customer’s network by detecting intrusions, scanning for vulnerabilities and addressing them before they become headline-making security failures. Cloud Express EarthLink enables customers to access a wide range of
Slide 15: EarthLink Customers
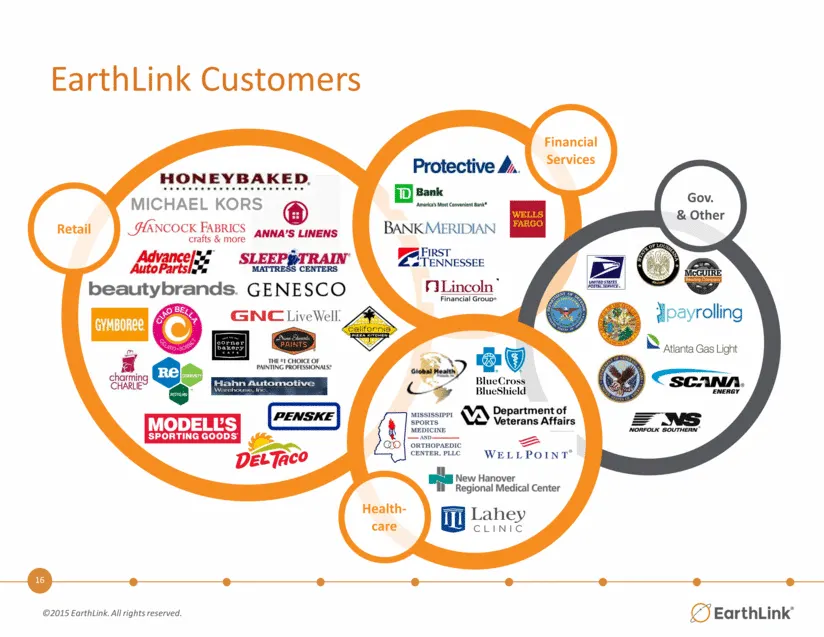
EarthLink Customers Financial Services Retail Health-care Gov. & Other
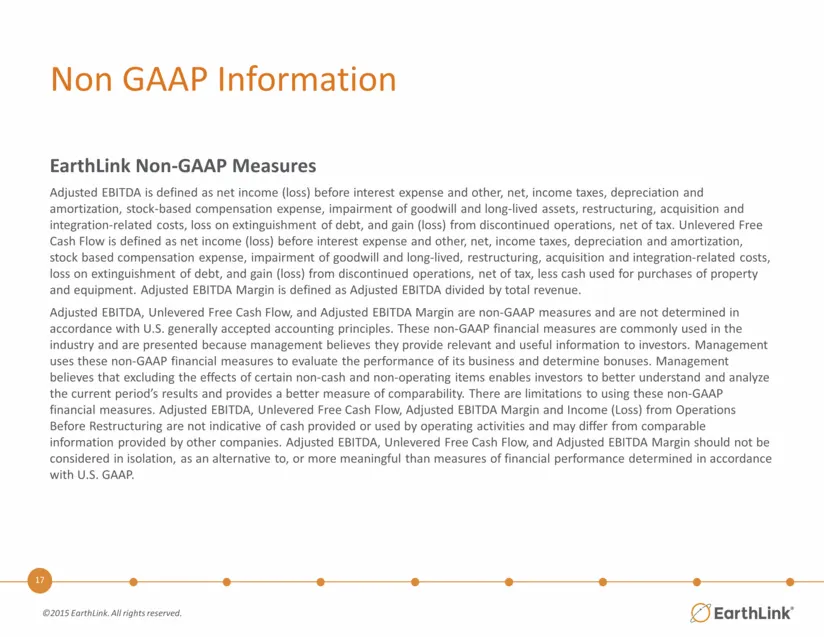
Slide 16: EarthLink Non-GAAP Measures
EarthLink Non-GAAP Measures Adjusted EBITDA is defined as net income (loss) before interest expense and other, net, income taxes, depreciation and amortization, stock-based compensation expense, impairment of goodwill and long-lived assets, restructuring, acquisition and integration-related costs, l
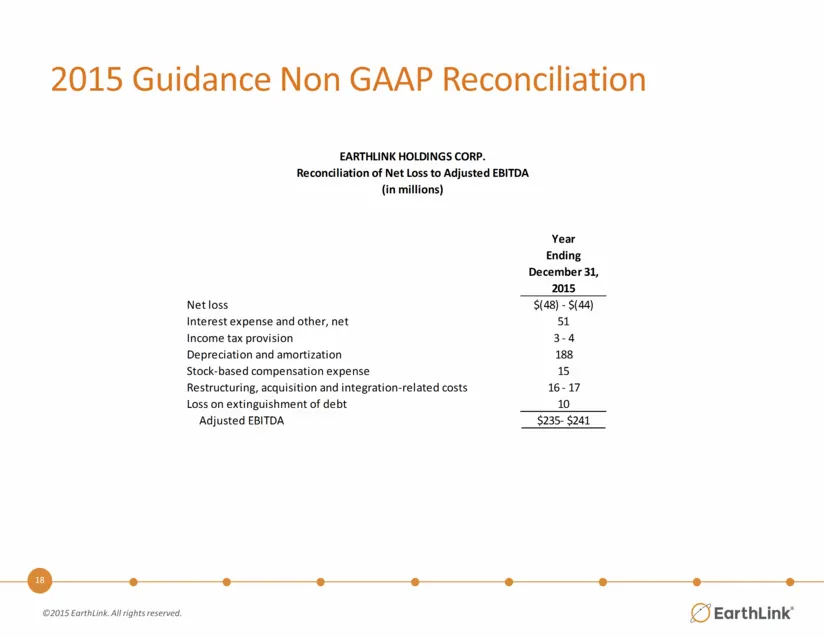
Slide 17: 2015 Guidance Non GAAP Reconciliation
2015 Guidance Non GAAP Reconciliation Year Ending December 31, 2015 Net loss $(48) - $(44) Interest expense and other, net 51 Income tax provision 3 - 4 Depreciation and amortization 188 Stock-based compensation expense 15 Restructuring, acquisition and integration-related costs 16 - 17 Loss on exti
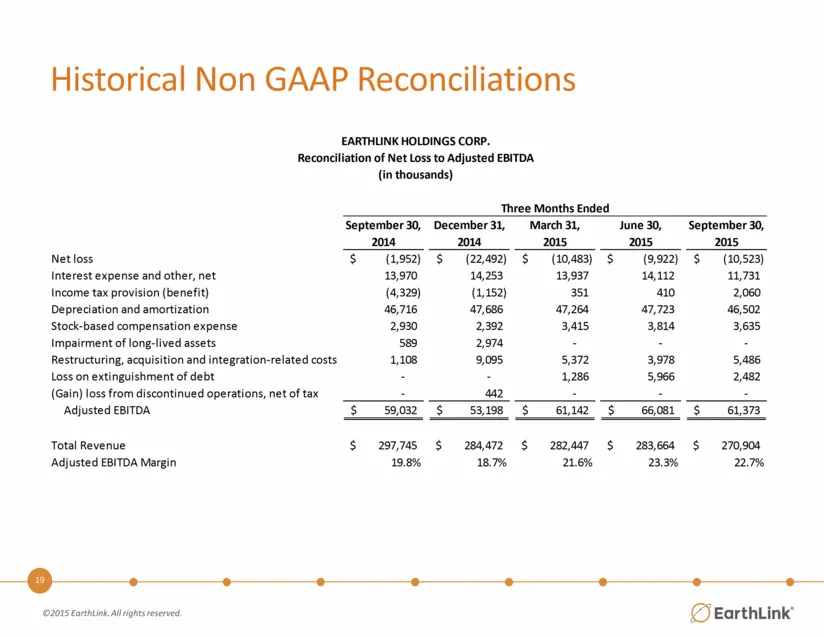
Slide 18: Historical Non GAAP Reconciliations
Historical Non GAAP Reconciliations September 30, December 31, March 31, June 30, September 30, 2014 2014 2015 2015 2015 Net loss (1,952) $ (22,492) $ (10,483) $ (9,922) $ (10,523) $ Interest expense and other, net 13,970 14,253 13,937 14,112 11,731 Income tax provision (benefit) (4,329) (1,152) 351
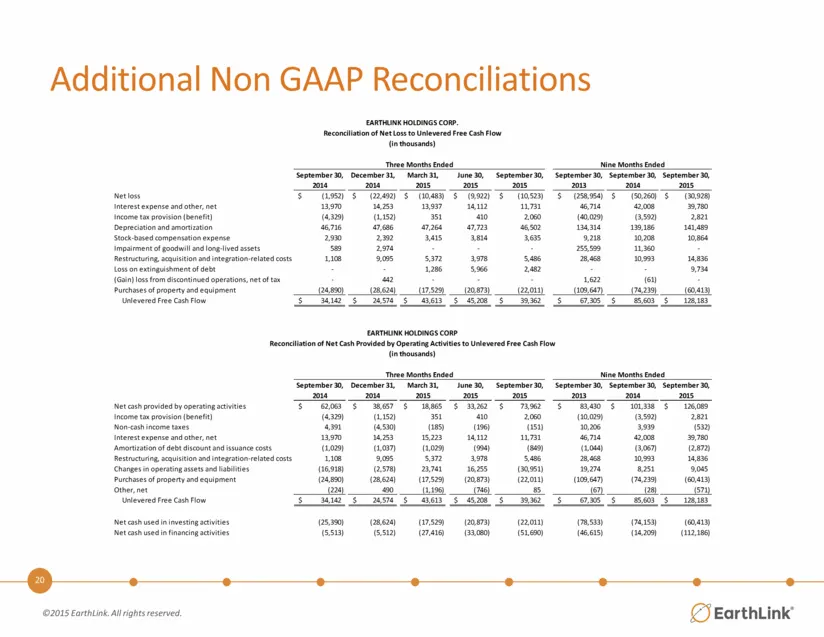
Slide 19: Additional Non GAAP Reconciliations
Additional Non GAAP Reconciliations September 30, December 31, March 31, June 30, September 30, September 30, September 30, September 30, 2014 2014 2015 2015 2015 2013 2014 2015 Net loss (1,952) $ (22,492) $ (10,483) $ (9,922) $ (10,523) $ (258,954) $ (50,260) $ (30,928) $ Interest expense and other
Slide 20: Additional Non GAAP Reconciliations
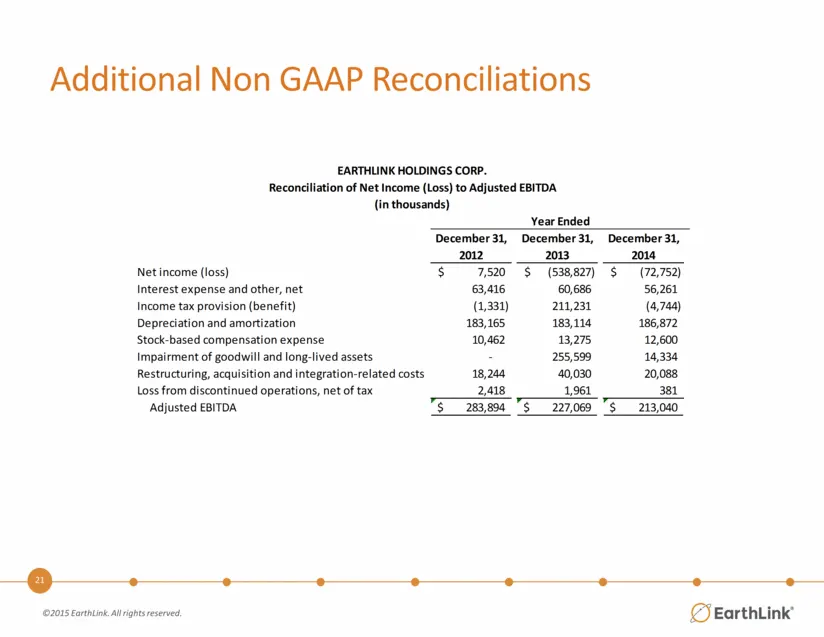
Additional Non GAAP Reconciliations December 31, December 31, December 31, 2012 2013 2014 Net income (loss) 7,520 $ (538,827) $ (72,752) $ Interest expense and other, net 63,416 60,686 56,261 Income tax provision (benefit) (1,331) 211,231 (4,744) Depreciation and amortization 183,165 183,114 186,872
Slide 21: Cautionary Information Regarding Forward Looking Statements
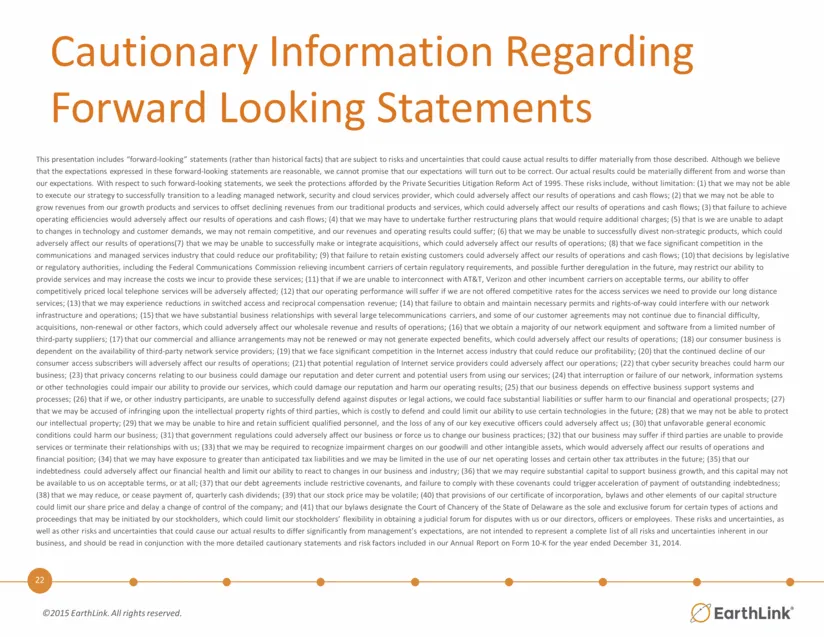
Cautionary Information Regarding Forward Looking Statements This presentation includes “forward-looking” statements (rather than historical facts) that are subject to risks and uncertainties that could cause actual results to differ materially from those described. Although we believe that the expec
Slide 22: Cautionary Information Regarding Forward Looking Statements
Cautionary Information Regarding Forward Looking Statements @eEarthtink’
Slide 23: ¢3 EarthLink’
¢3 EarthLink’
Source: SEC EDGAR · 8-K filed Nov 9, 2015
More decks from EarthLink Inc
 Investor Presentation (September 2016)20 slides · Sep 7, 2016
 Q2 2016 Earnings Presentation18 slides · Aug 9, 2016
 Investor Presentation (May 2016)20 slides · May 11, 2016
 Q1 2016 Earnings Presentation18 slides · May 3, 2016
 Investor Presentation (February 2016)23 slides · Feb 23, 2016
 Q4 2015 Earnings Presentation19 slides · Feb 18, 2016