EarthLink — Investor Presentation (February 2016)
23 slides from EarthLink's investor presentation, Feb 23, 2016
Slide 1: EarthLink Investor Overview
EarthLink Investor Overview
Slide 2: Company History
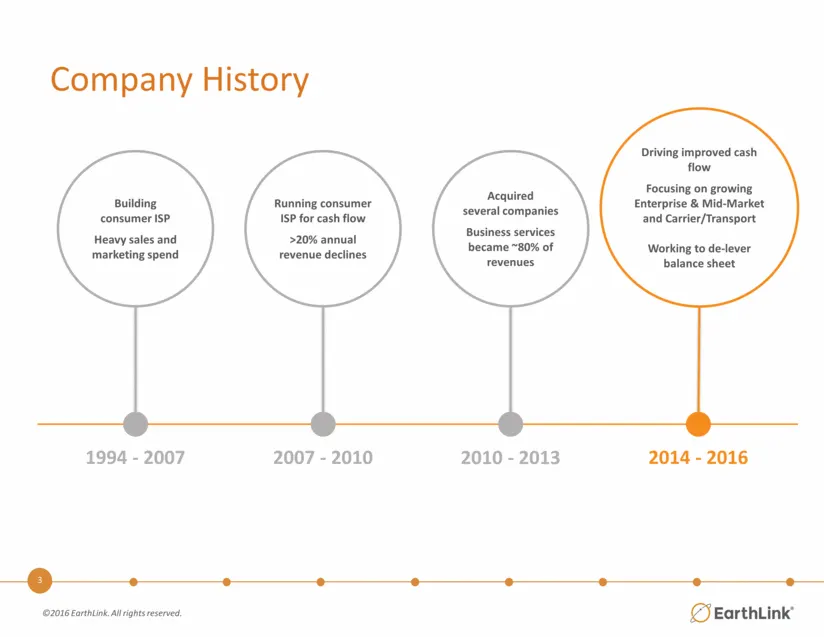
Driving improved cash flow Focusing on growing Enterprise & Mid-Market and Carrier/Transport Working to de-lever balance sheet Company History Building consumer ISP Heavy sales and marketing spend Acquired several companies Business services became ~80% of revenues Running consumer ISP for cash flow
Slide 3: EarthLink's Multi-year Journey to Leadership
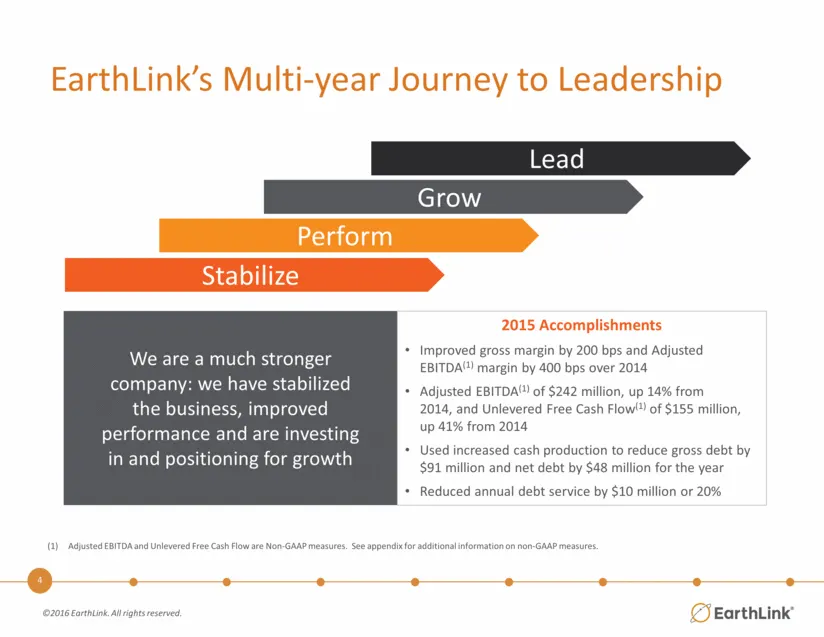
EarthLink’s Multi-year Journey to Leadership We are a much stronger company: we have stabilized the business, improved performance and are investing in and positioning for growth Lead Grow Perform Stabilize 2015 Accomplishments Improved gross margin by 200 bps and Adjusted EBITDA(1) margin by 400 bp
Slide 4: EarthLink Businesses
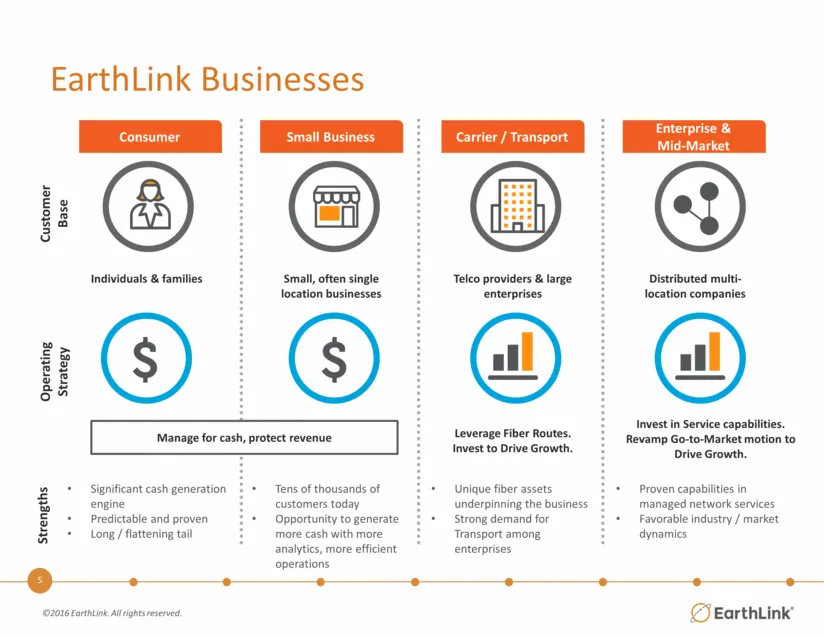
EarthLink Businesses Customer Base Operating Strategy Consumer Small Business Carrier / Transport Enterprise & Mid-Market Individuals & families Telco providers & large enterprises Small, often single location businesses Distributed multi-location companies Manage for cash, protect revenue Proven ca
Slide 5: EarthLink Customers
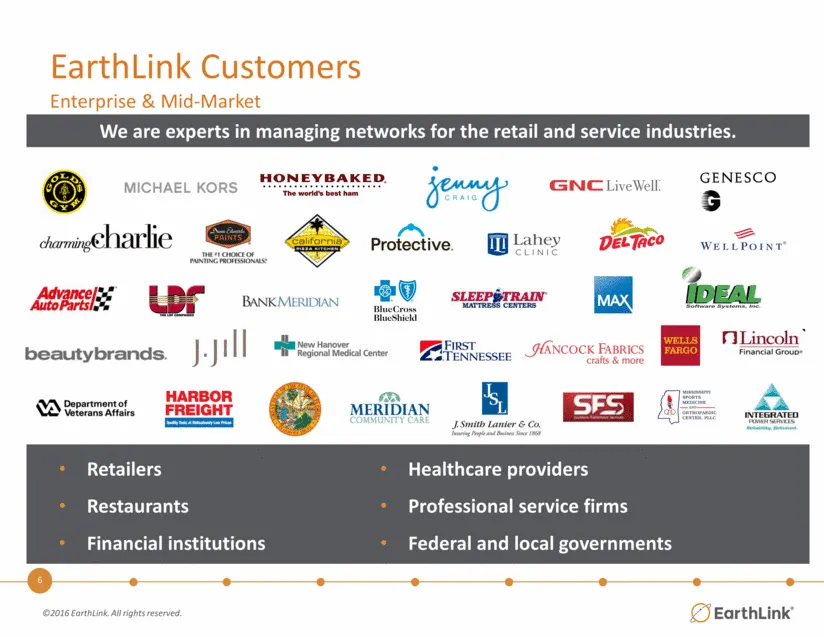
EarthLink Customers Enterprise & Mid-Market Retailers Restaurants Financial institutions Healthcare providers Professional service firms Federal and local governments We are experts in managing networks for the retail and service industries.
Slide 6: 2016 Agenda
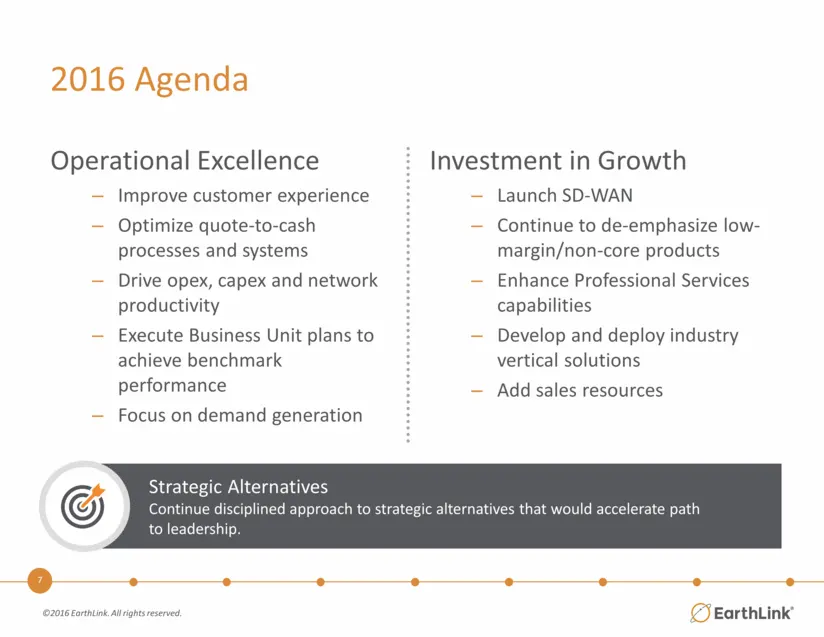
2016 Agenda Investment in Growth Launch SD-WAN Continue to de-emphasize low-margin/non-core products Enhance Professional Services capabilities Develop and deploy industry vertical solutions Add sales resources Operational Excellence Improve customer experience Optimize quote-to-cash processes and s
Slide 7: 2012 – 2016 Trends
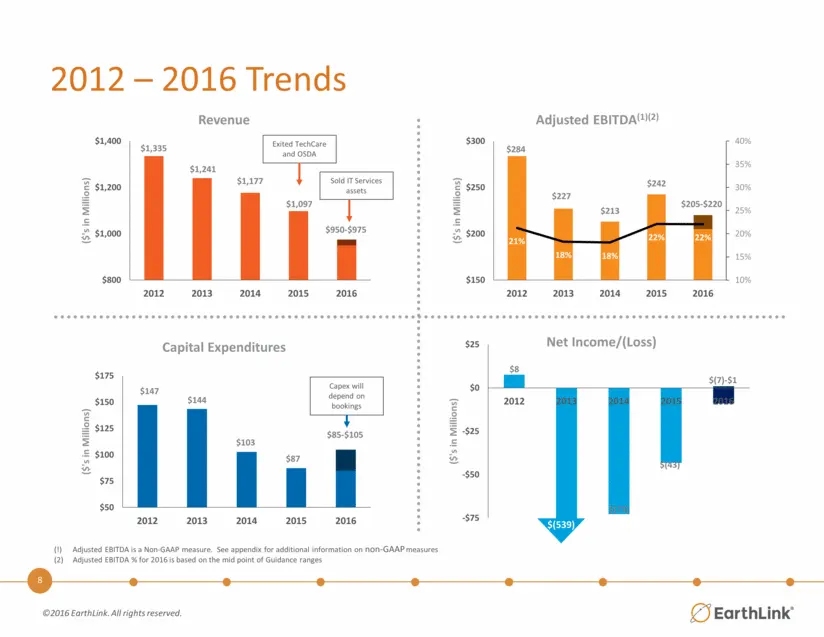
2012 – 2016 Trends (!) Adjusted EBITDA is a Non-GAAP measure. See appendix for additional information on non-GAAP measures Adjusted EBITDA % for 2016 is based on the mid point of Guidance ranges $(539) Exited TechCare and OSDA Sold IT Services assets Capex will depend on bookings $1,335 $1,241 $1,17
Slide 8: Balance Sheet
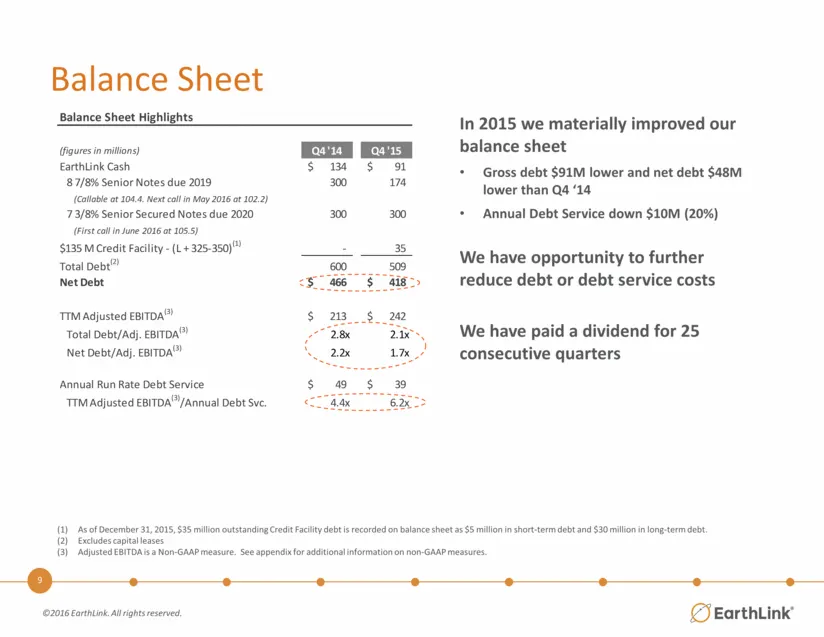
Balance Sheet In 2015 we materially improved our balance sheet Gross debt $91M lower and net debt $48M lower than Q4 ‘14 Annual Debt Service down $10M (20%) We have opportunity to further reduce debt or debt service costs We have paid a dividend for 25 consecutive quarters As of December 31, 2015, $
Slide 9: 2016 Full Year Guidance
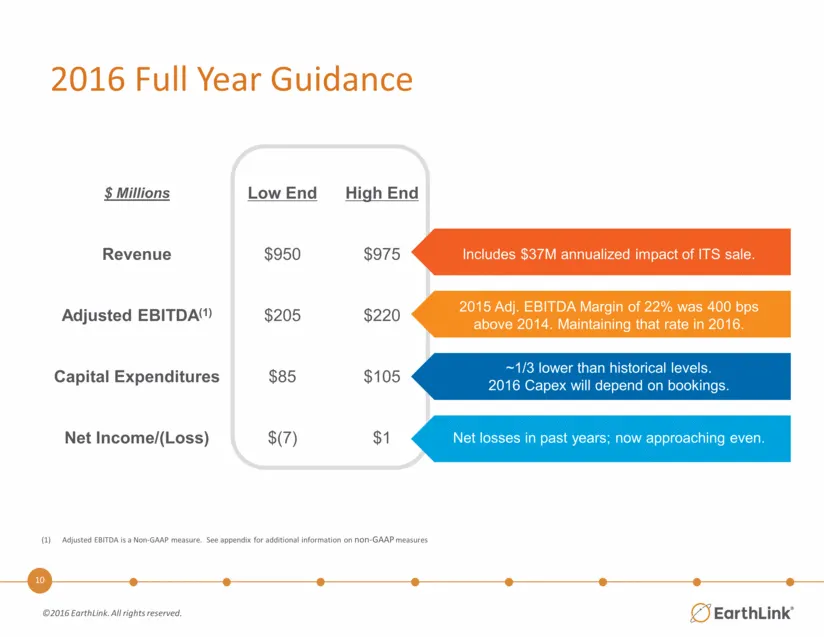
$ Millions Low End High End Revenue $950 $975 Includes $37M annualized impact of ITS sale. Adjusted EBITDA(1) $205 $220 2015 Adj. EBITDA Margin of 22% was 400 bps above 2014. Maintaining that rate in 2016. Capital Expenditures $85 $105 ~1/3 lower than historical levels. 2016 Capex will depend on boo
Slide 10: EarthLink – Investment Highlights
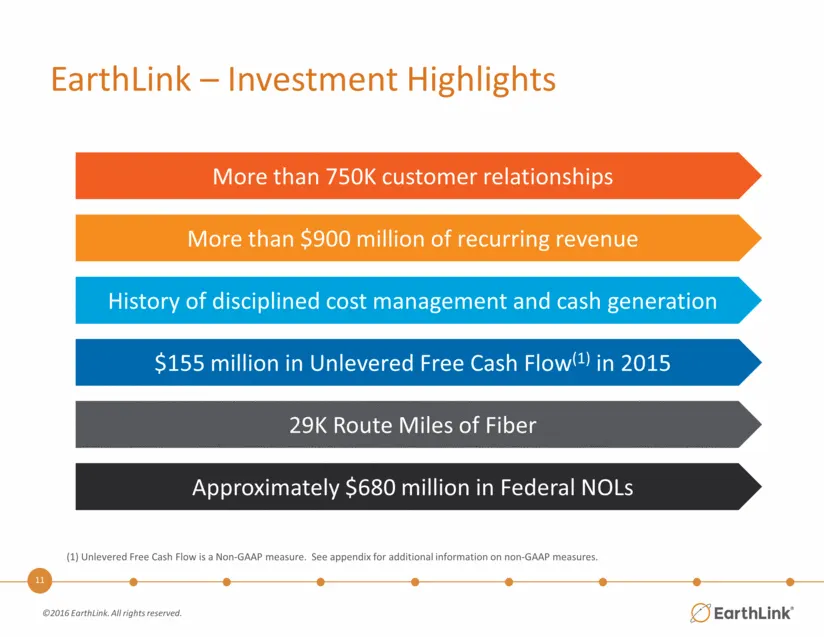
Approximately $680 million in Federal NOLs 29K Route Miles of Fiber $155 million in Unlevered Free Cash Flow(1) in 2015 More than $900 million of recurring revenue Unlevered Free Cash Flow is a Non-GAAP measure. See appendix for additional information on non-GAAP measures. More than 750K customer re
Slide 11: EarthLink — Investment Highlights
EarthLink — Investment Highlights More than 7: customer relationships More than $900 million of recurring revenue History of disciplined cost management and cash generation $155 million in Unlevered Free Cash Flow™ in 2015 K Route Miles of Fiber Approximately $680 m Federal NOLs © Earthink’
Slide 12: Q4 2015 Business Unit Revenue & Gross Margin
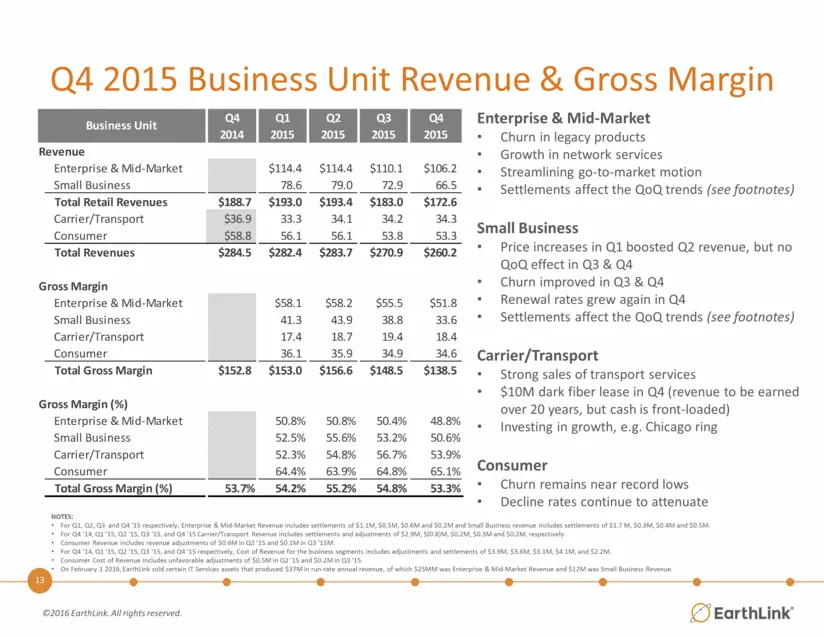
Q4 2015 Business Unit Revenue & Gross Margin Enterprise & Mid-Market Churn in legacy products Growth in network services Streamlining go-to-market motion Settlements affect the QoQ trends (see footnotes) Small Business Price increases in Q1 boosted Q2 revenue, but no QoQ effect in Q3 & Q4 Churn impr
Slide 13: Q4 2015 Operating & Financial Results
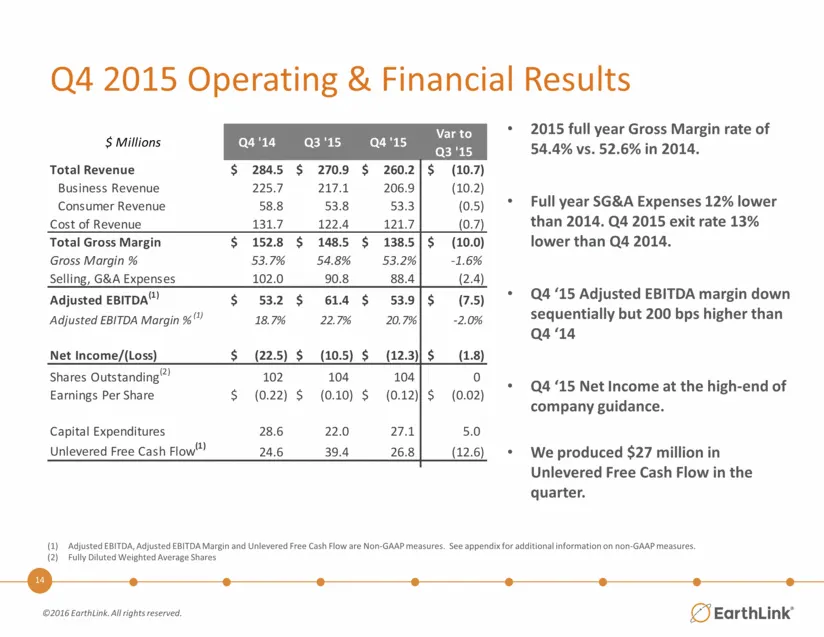
Q4 2015 Operating & Financial Results Adjusted EBITDA, Adjusted EBITDA Margin and Unlevered Free Cash Flow are Non-GAAP measures. See appendix for additional information on non-GAAP measures. Fully Diluted Weighted Average Shares 2015 full year Gross Margin rate of 54.4% vs. 52.6% in 2014. Full year
Slide 14: EarthLink Services
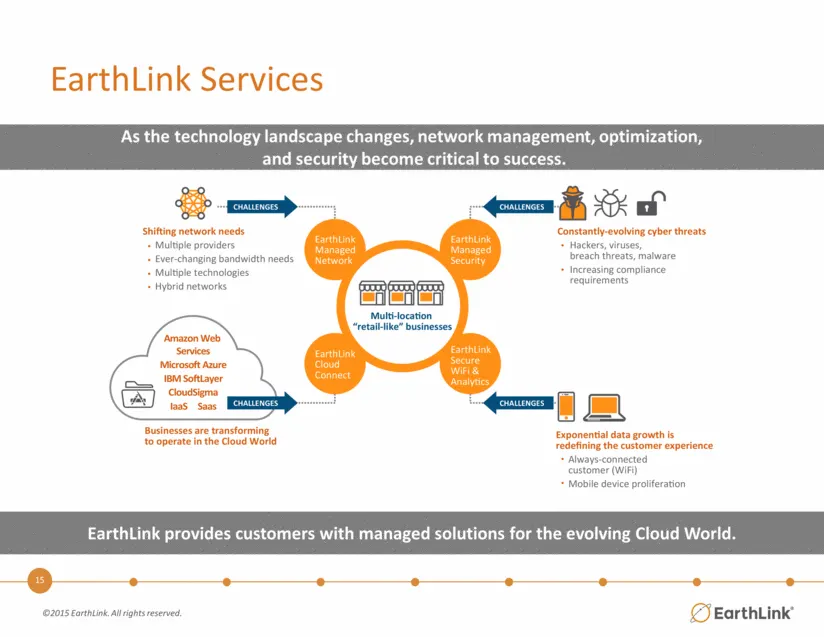
EarthLink Services EarthLink provides customers with managed solutions for the evolving Cloud World.
Slide 15: Fiber & Infrastructure
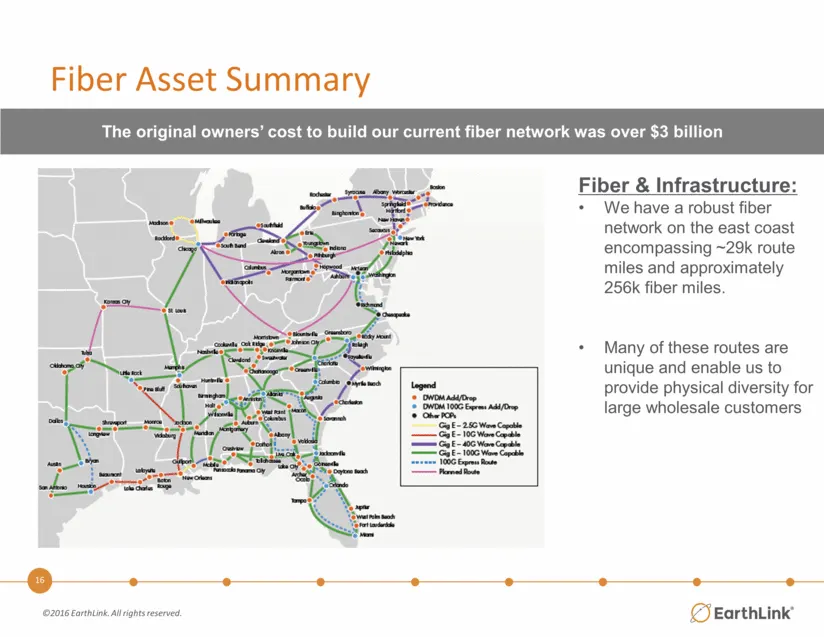
Fiber & Infrastructure: We have a robust fiber network on the east coast encompassing ~29k route miles and approximately 256k fiber miles. Many of these routes are unique and enable us to provide physical diversity for large wholesale customers Fiber Asset Summary The original owners’ cost to build
Slide 16: EarthLink Product & Brand
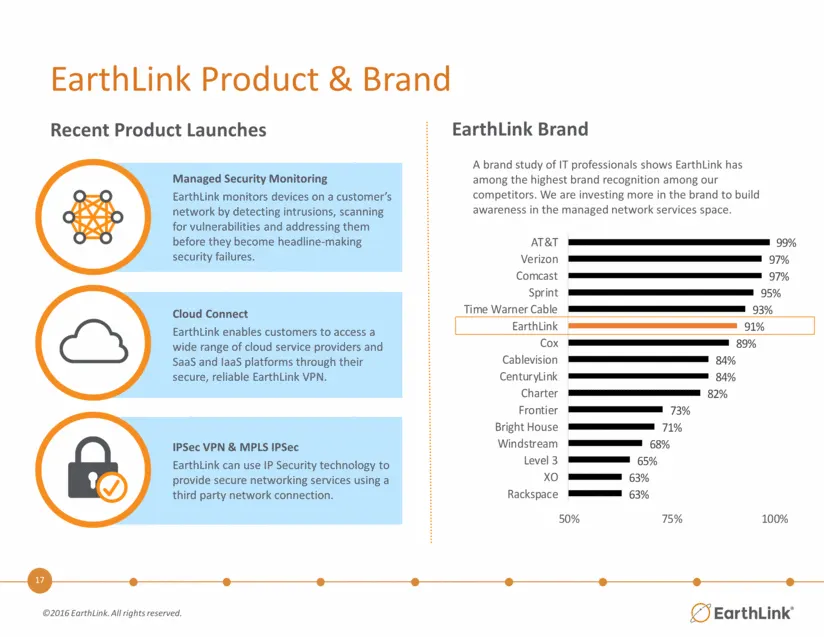
EarthLink Product & Brand Managed Security Monitoring EarthLink monitors devices on a customer’s network by detecting intrusions, scanning for vulnerabilities and addressing them before they become headline-making security failures. Cloud Connect EarthLink enables customers to access a wide range of
Slide 17: EarthLink Non-GAAP Measures
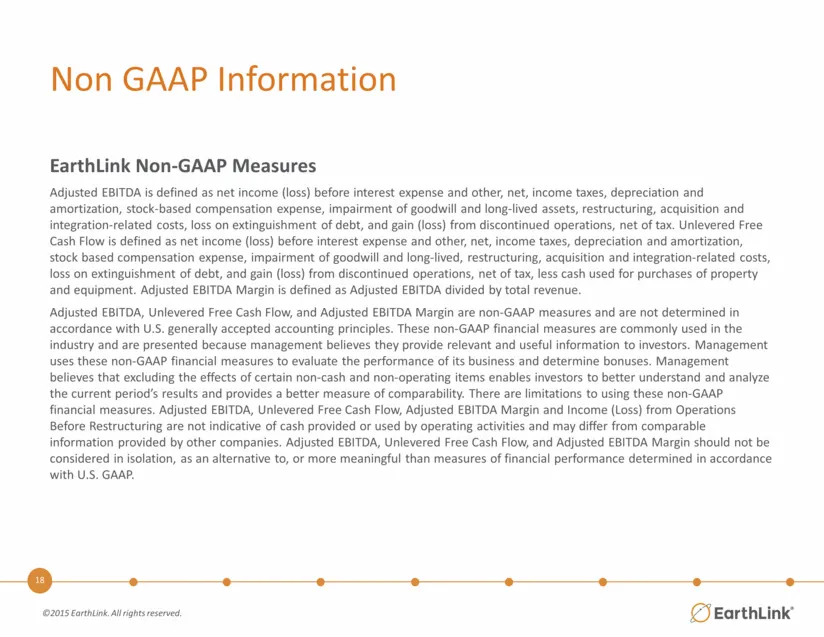
EarthLink Non-GAAP Measures Adjusted EBITDA is defined as net income (loss) before interest expense and other, net, income taxes, depreciation and amortization, stock-based compensation expense, impairment of goodwill and long-lived assets, restructuring, acquisition and integration-related costs, l
Slide 18: 2016 Guidance Non GAAP Reconciliation
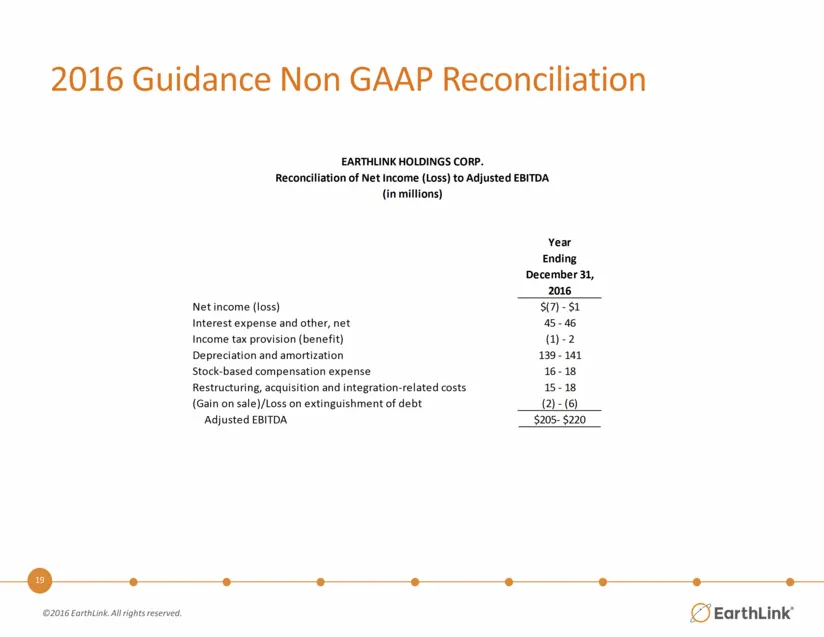
2016 Guidance Non GAAP Reconciliation Year Ending December 31, 2016 Net income (loss) $(7) - $1 Interest expense and other, net 45 - 46 Income tax provision (benefit) (1) - 2 Depreciation and amortization 139 - 141 Stock-based compensation expense 16 - 18 Restructuring, acquisition and integration-r
Slide 19: Historical Non GAAP Reconciliations
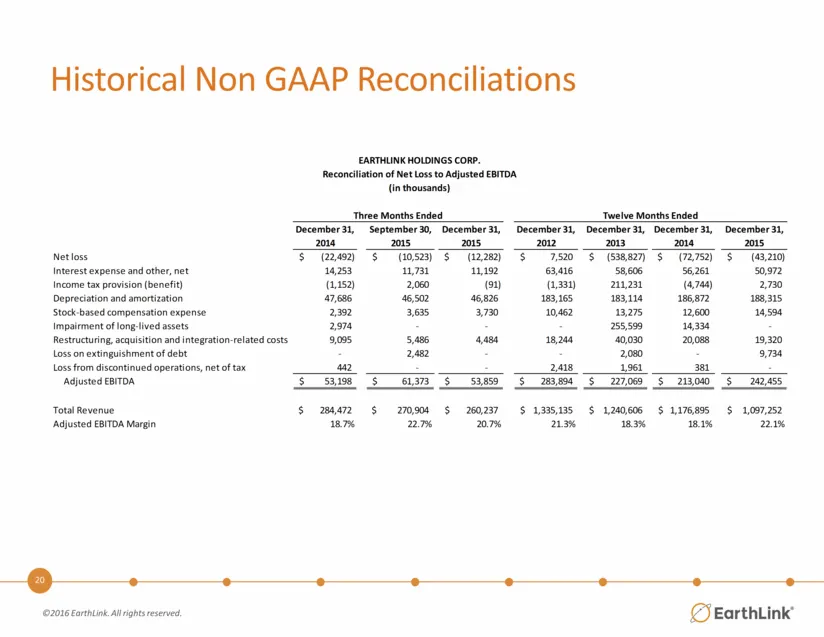
Historical Non GAAP Reconciliations December 31, September 30, December 31, December 31, December 31, December 31, December 31, 2014 2015 2015 2012 2013 2014 2015 Net loss (22,492) $ (10,523) $ (12,282) $ 7,520 $ (538,827) $ (72,752) $ (43,210) $ Interest expense and other, net 14,253 11,731 11,192
Slide 20: Additional Non GAAP Reconciliations
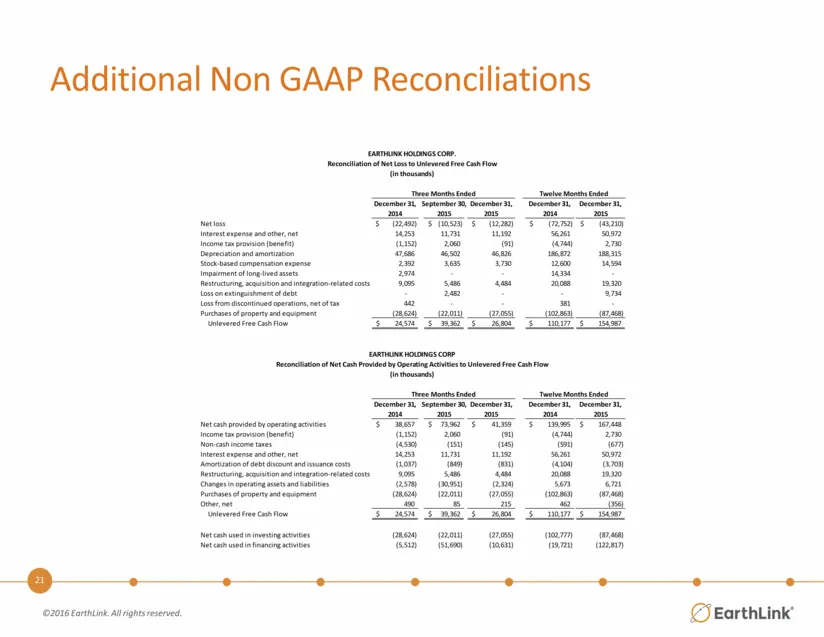
Additional Non GAAP Reconciliations December 31, September 30, December 31, December 31, December 31, 2014 2015 2015 2014 2015 Net loss (22,492) $ (10,523) $ (12,282) $ (72,752) $ (43,210) $ Interest expense and other, net 14,253 11,731 11,192 56,261 50,972 Income tax provision (benefit) (1,152) 2,0
Slide 21: Cautionary Information Regarding Forward Looking Statements
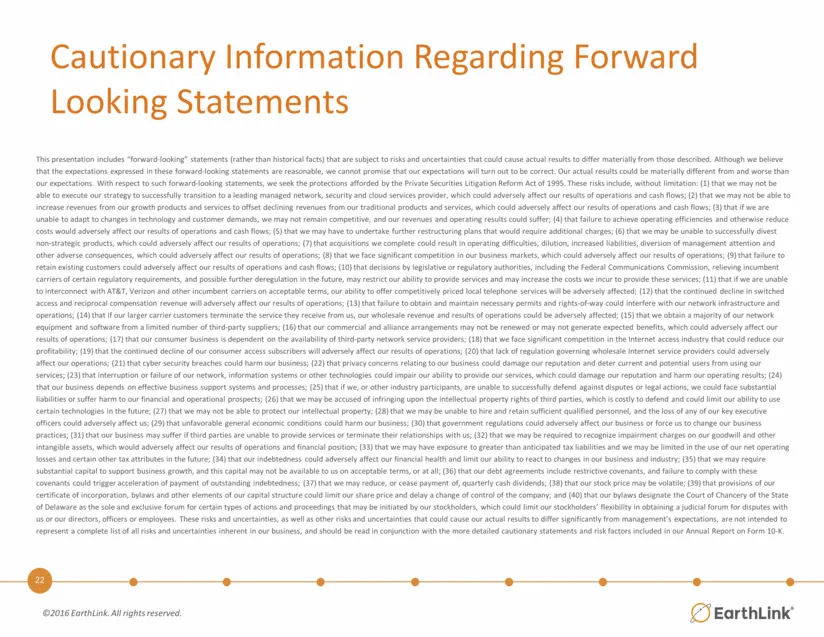
Cautionary Information Regarding Forward Looking Statements This presentation includes “forward-looking” statements (rather than historical facts) that are subject to risks and uncertainties that could cause actual results to differ materially from those described. Although we believe that the expec
Slide 22: Cautionary Information Regarding Forward Looking Statements
Cautionary Information Regarding Forward Looking Statements ‘i peenation cde “orang statements ater thn hist ac) ht rue tls nd uncritical ce act est ier mater om tae desc Athogh we live ‘tate epecatos empresied nee forwarSlsing stent ae esse, we cant rome ator expecta wilt ob caret Our aul ets co be
Slide 23: EarthLink
¢3 EarthLink’
Source: SEC EDGAR · 8-K filed Feb 23, 2016
More decks from EarthLink Inc
 Investor Presentation (September 2016)20 slides · Sep 7, 2016
 Q2 2016 Earnings Presentation18 slides · Aug 9, 2016
 Investor Presentation (May 2016)20 slides · May 11, 2016
 Q1 2016 Earnings Presentation18 slides · May 3, 2016
 Q4 2015 Earnings Presentation19 slides · Feb 18, 2016
 Investor Presentation (November 2015)23 slides · Nov 9, 2015