Dynegy — Dynegy Acquisition — JPMorgan Annual High Yield Conference 2007
27 slides from Dynegy's conference presentation, Jan 23, 2007
Slide 1: JPMorgan Annual High Yield Conference 2007
Exhibit 99.1 Filed by Dynegy Acquisition, Inc. Pursuant to Rule 425 of the Securities Act of 1933, as amended, and deemed filed pursuant to Rule 14a-12 of the Securities Exchange Act of 1934, as amended Subject Company: Dynegy Inc. Commission File No: 001-15659 JPMorgan Annual High Yield Conference
Slide 2: Forward-Looking Statements
FORWARD-LOOKING FORWARD-LOOKING STATEMENTS STATEMENTS This presentation contains statements reflecting assumptions, expectations, projections, intentions or beliefs about future events that are intended as “forward- looking statements.” You can identify these statements, including those relating to
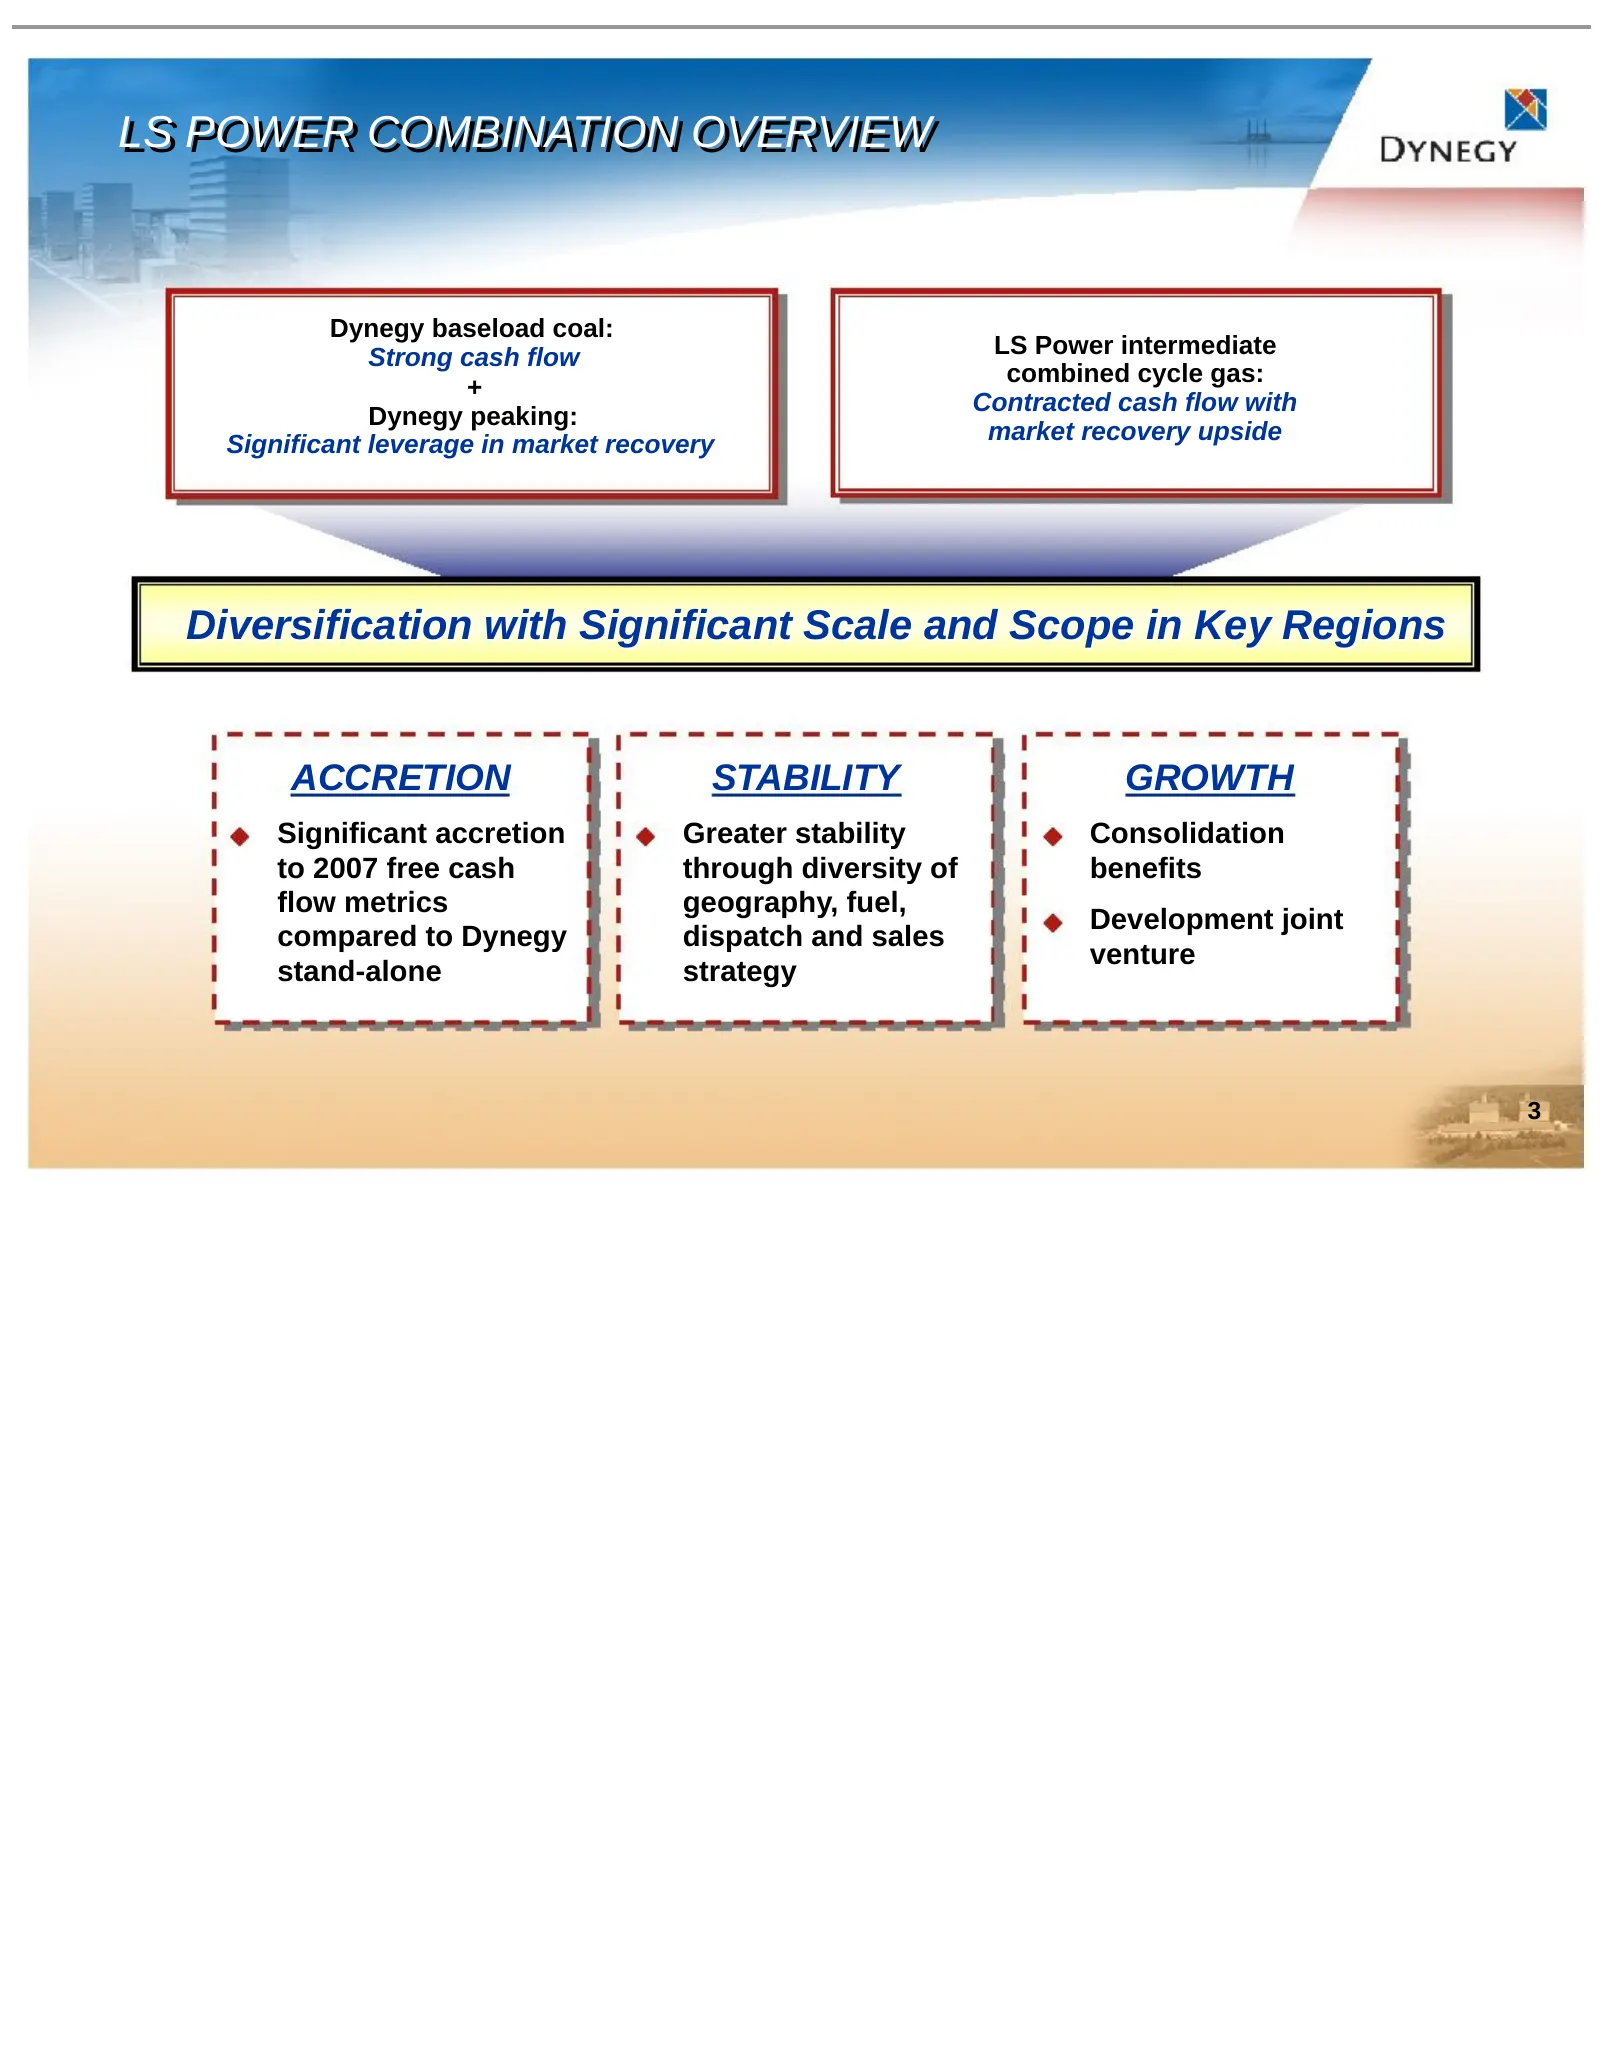
Slide 3: LS Power Combination Overview
LS LS POWER POWER COMBINATION COMBINATION OVERVIEW OVERVIEW Dynegy baseload coal: Strong cash flow LS Power intermediate combined cycle gas: + Contracted cash flow with Dynegy peaking: Significant leverage in market recovery market recovery upside Diversification with Significant Scale and Scope in
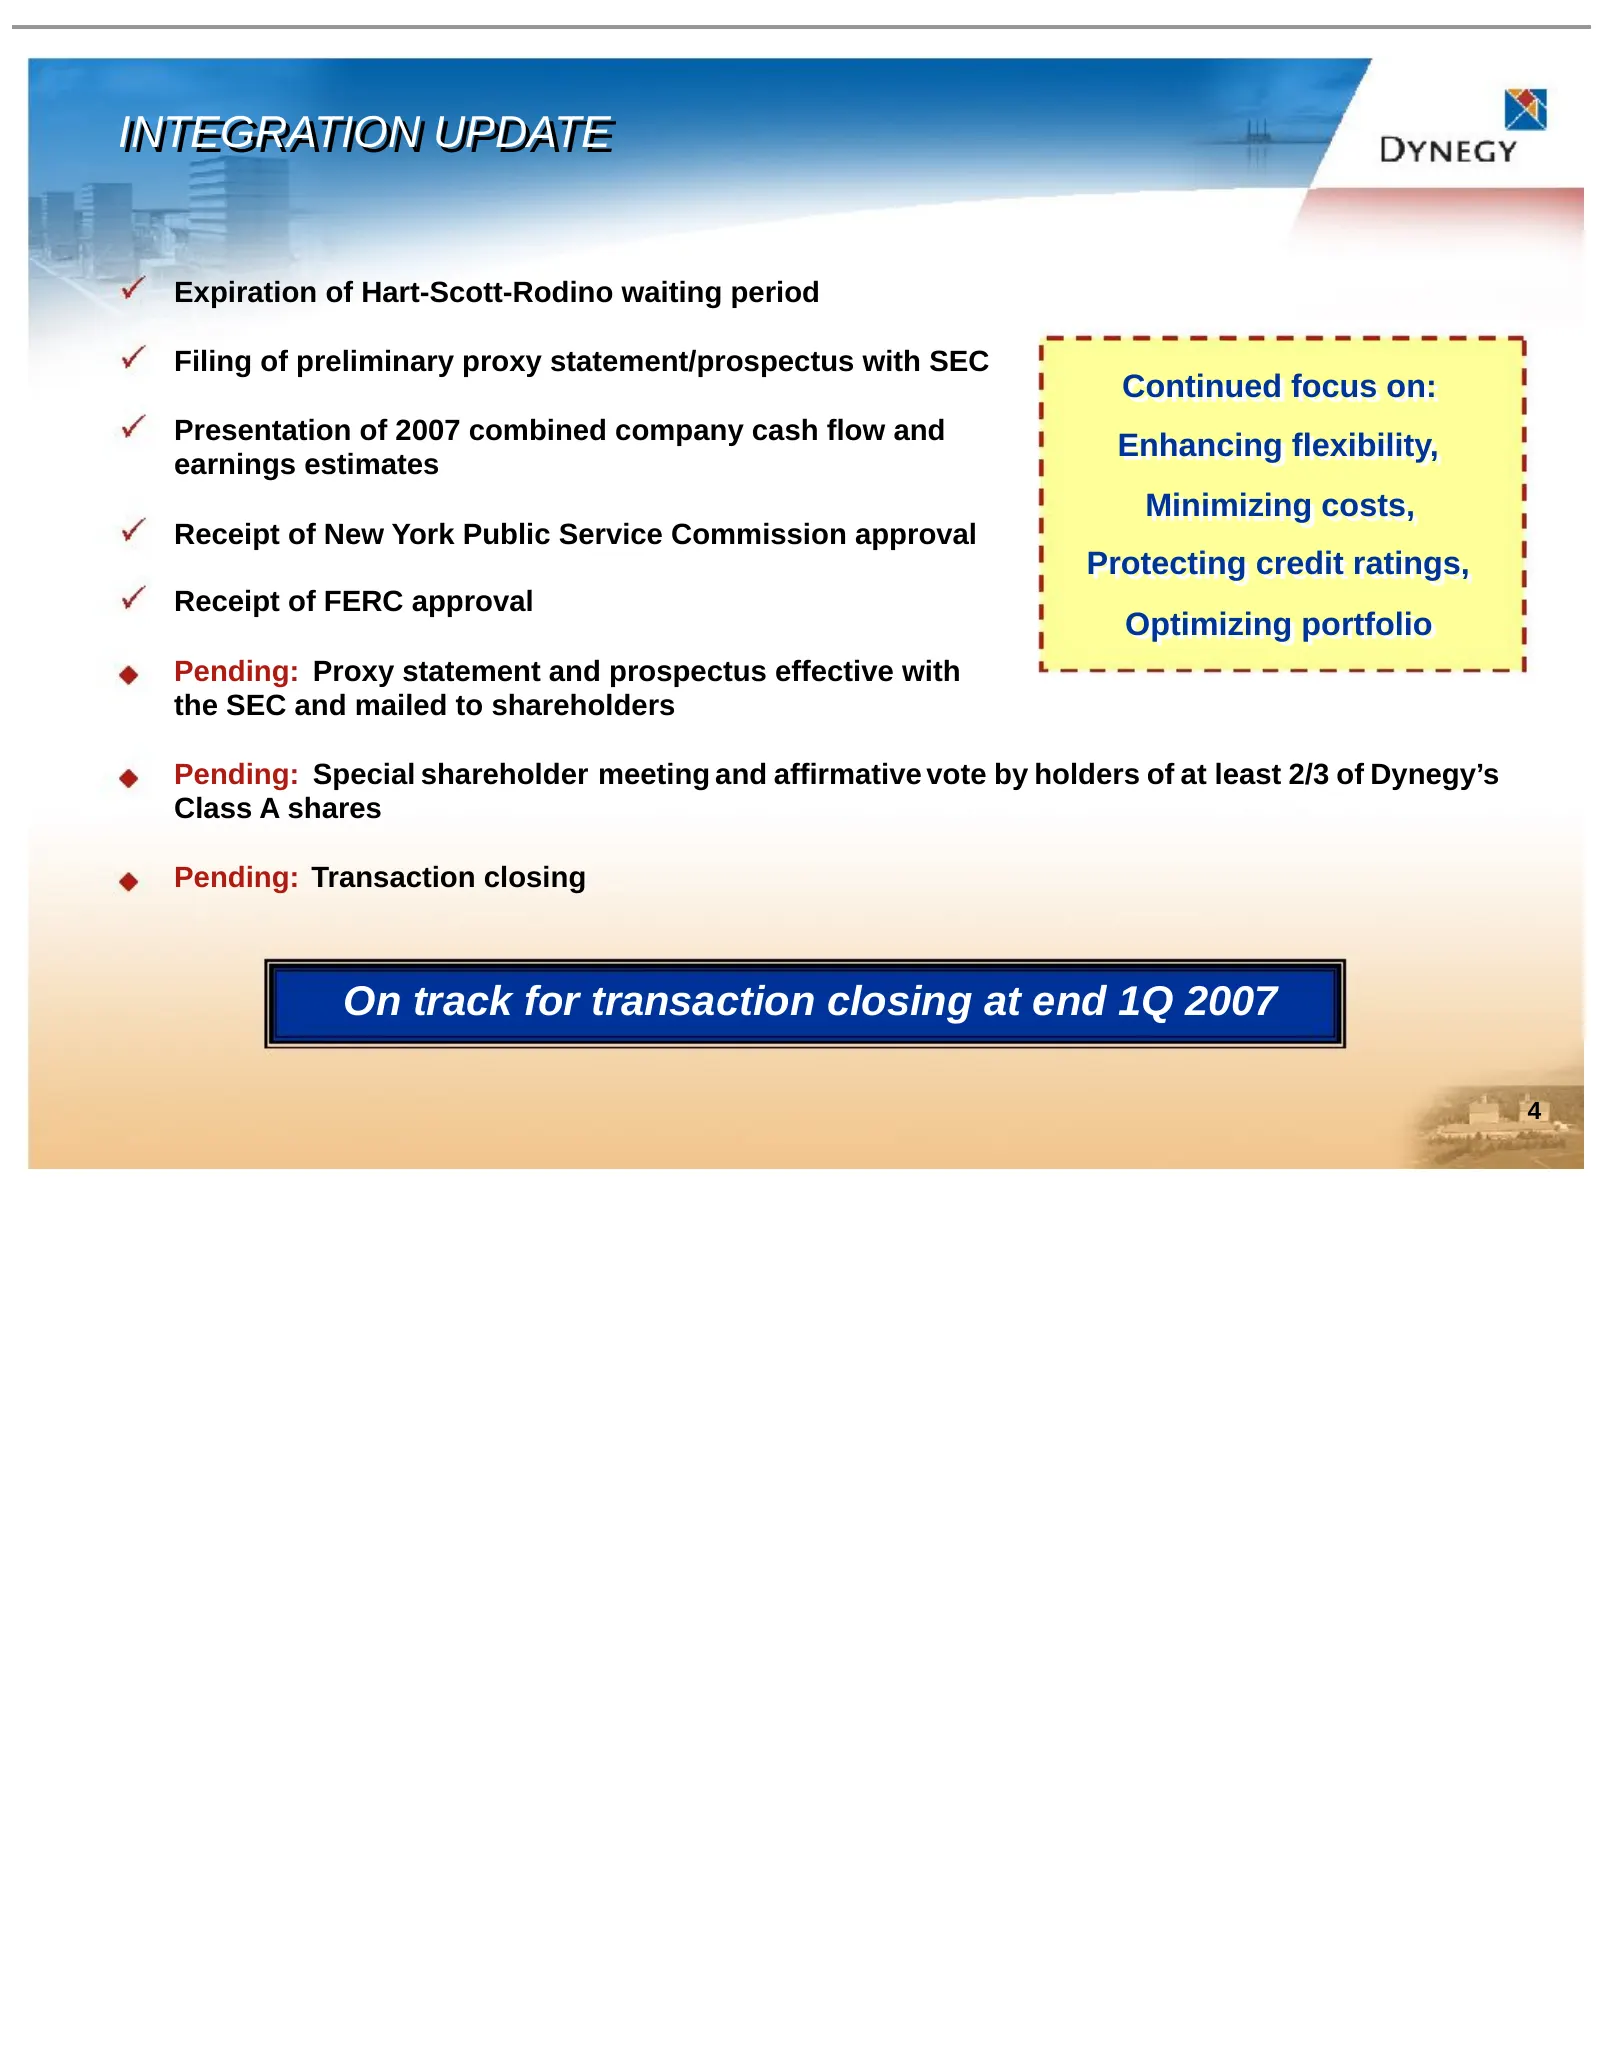
Slide 4: Integration Update
INTEGRATION INTEGRATION UPDATE UPDATE Expiration of Hart-Scott-Rodino waiting period Filing of preliminary proxy statement/prospectus with SEC Continued Continued focus focus on: on: Presentation of 2007 combined company cash flow and Enhancing Enhancing flexibility, flexibility, earnings estimates
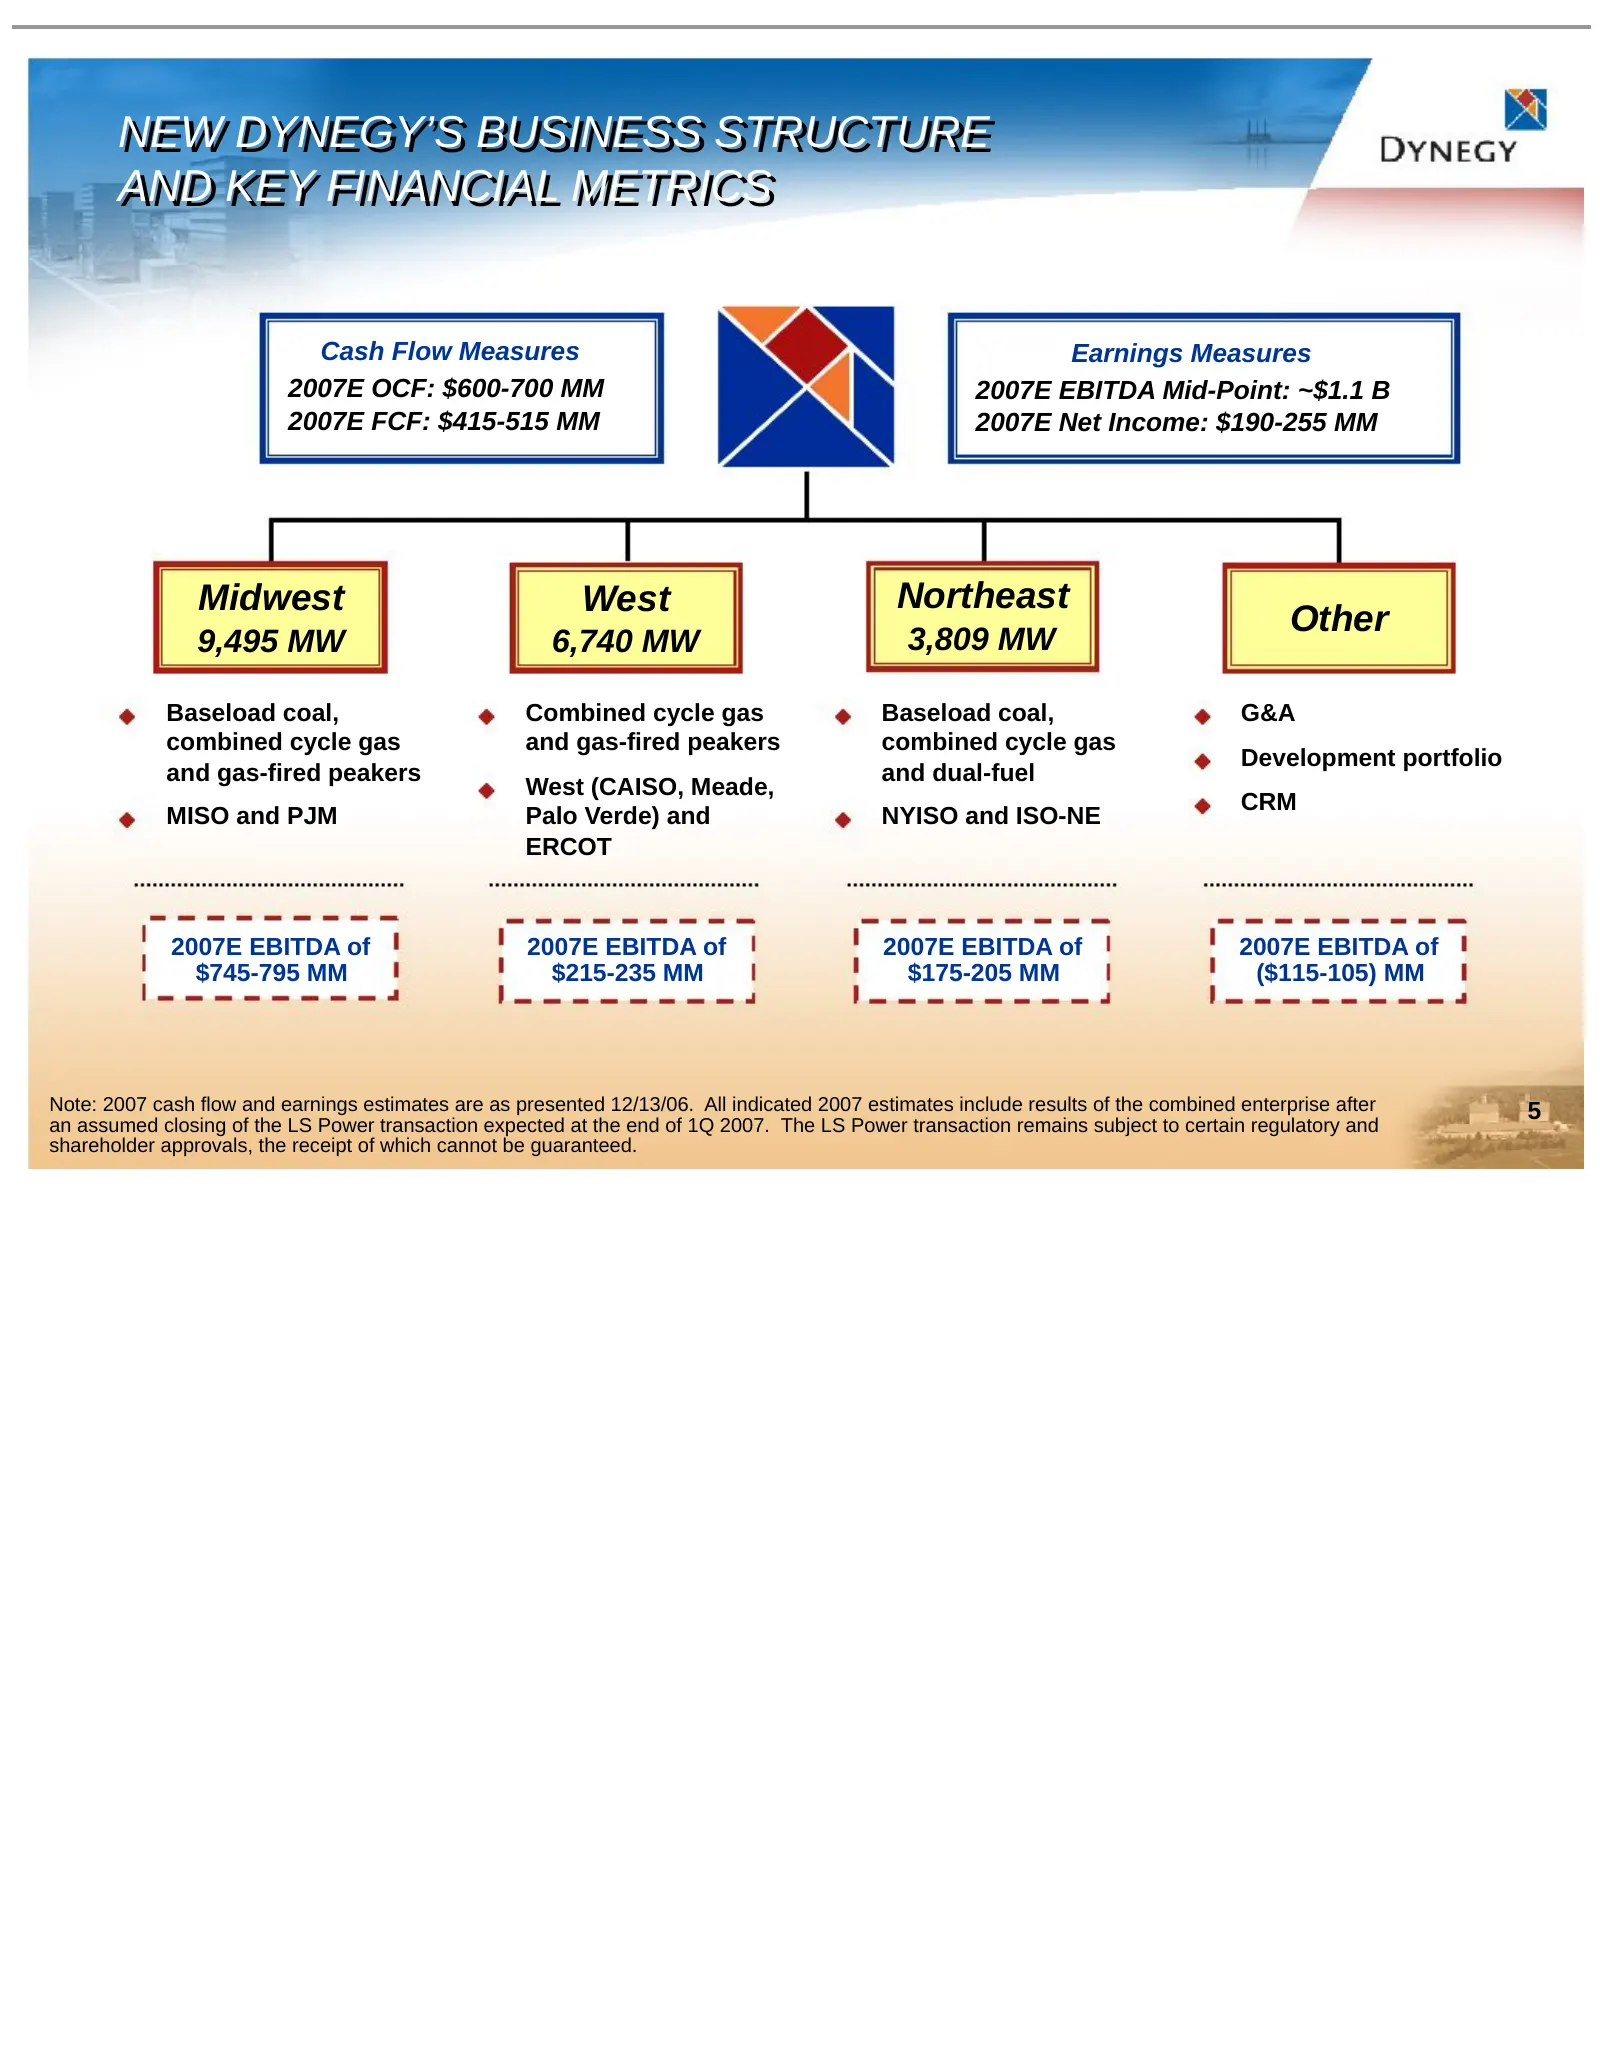
Slide 5: New Dynegy's Business Structure and Key Financial Metrics
NEW NEW DYNEGY’S DYNEGY’S BUSINESS BUSINESS STRUCTURE STRUCTURE AND AND KEY KEY FINANCIAL FINANCIAL METRICS METRICS Cash Flow Measures Earnings Measures 2007E OCF: $600-700 MM 2007E EBITDA Mid-Point: ~$1.1 B 2007E FCF: $415-515 MM 2007E Net Income: $190-255 MM Midwest West Northeast Other 9,495 MW 6
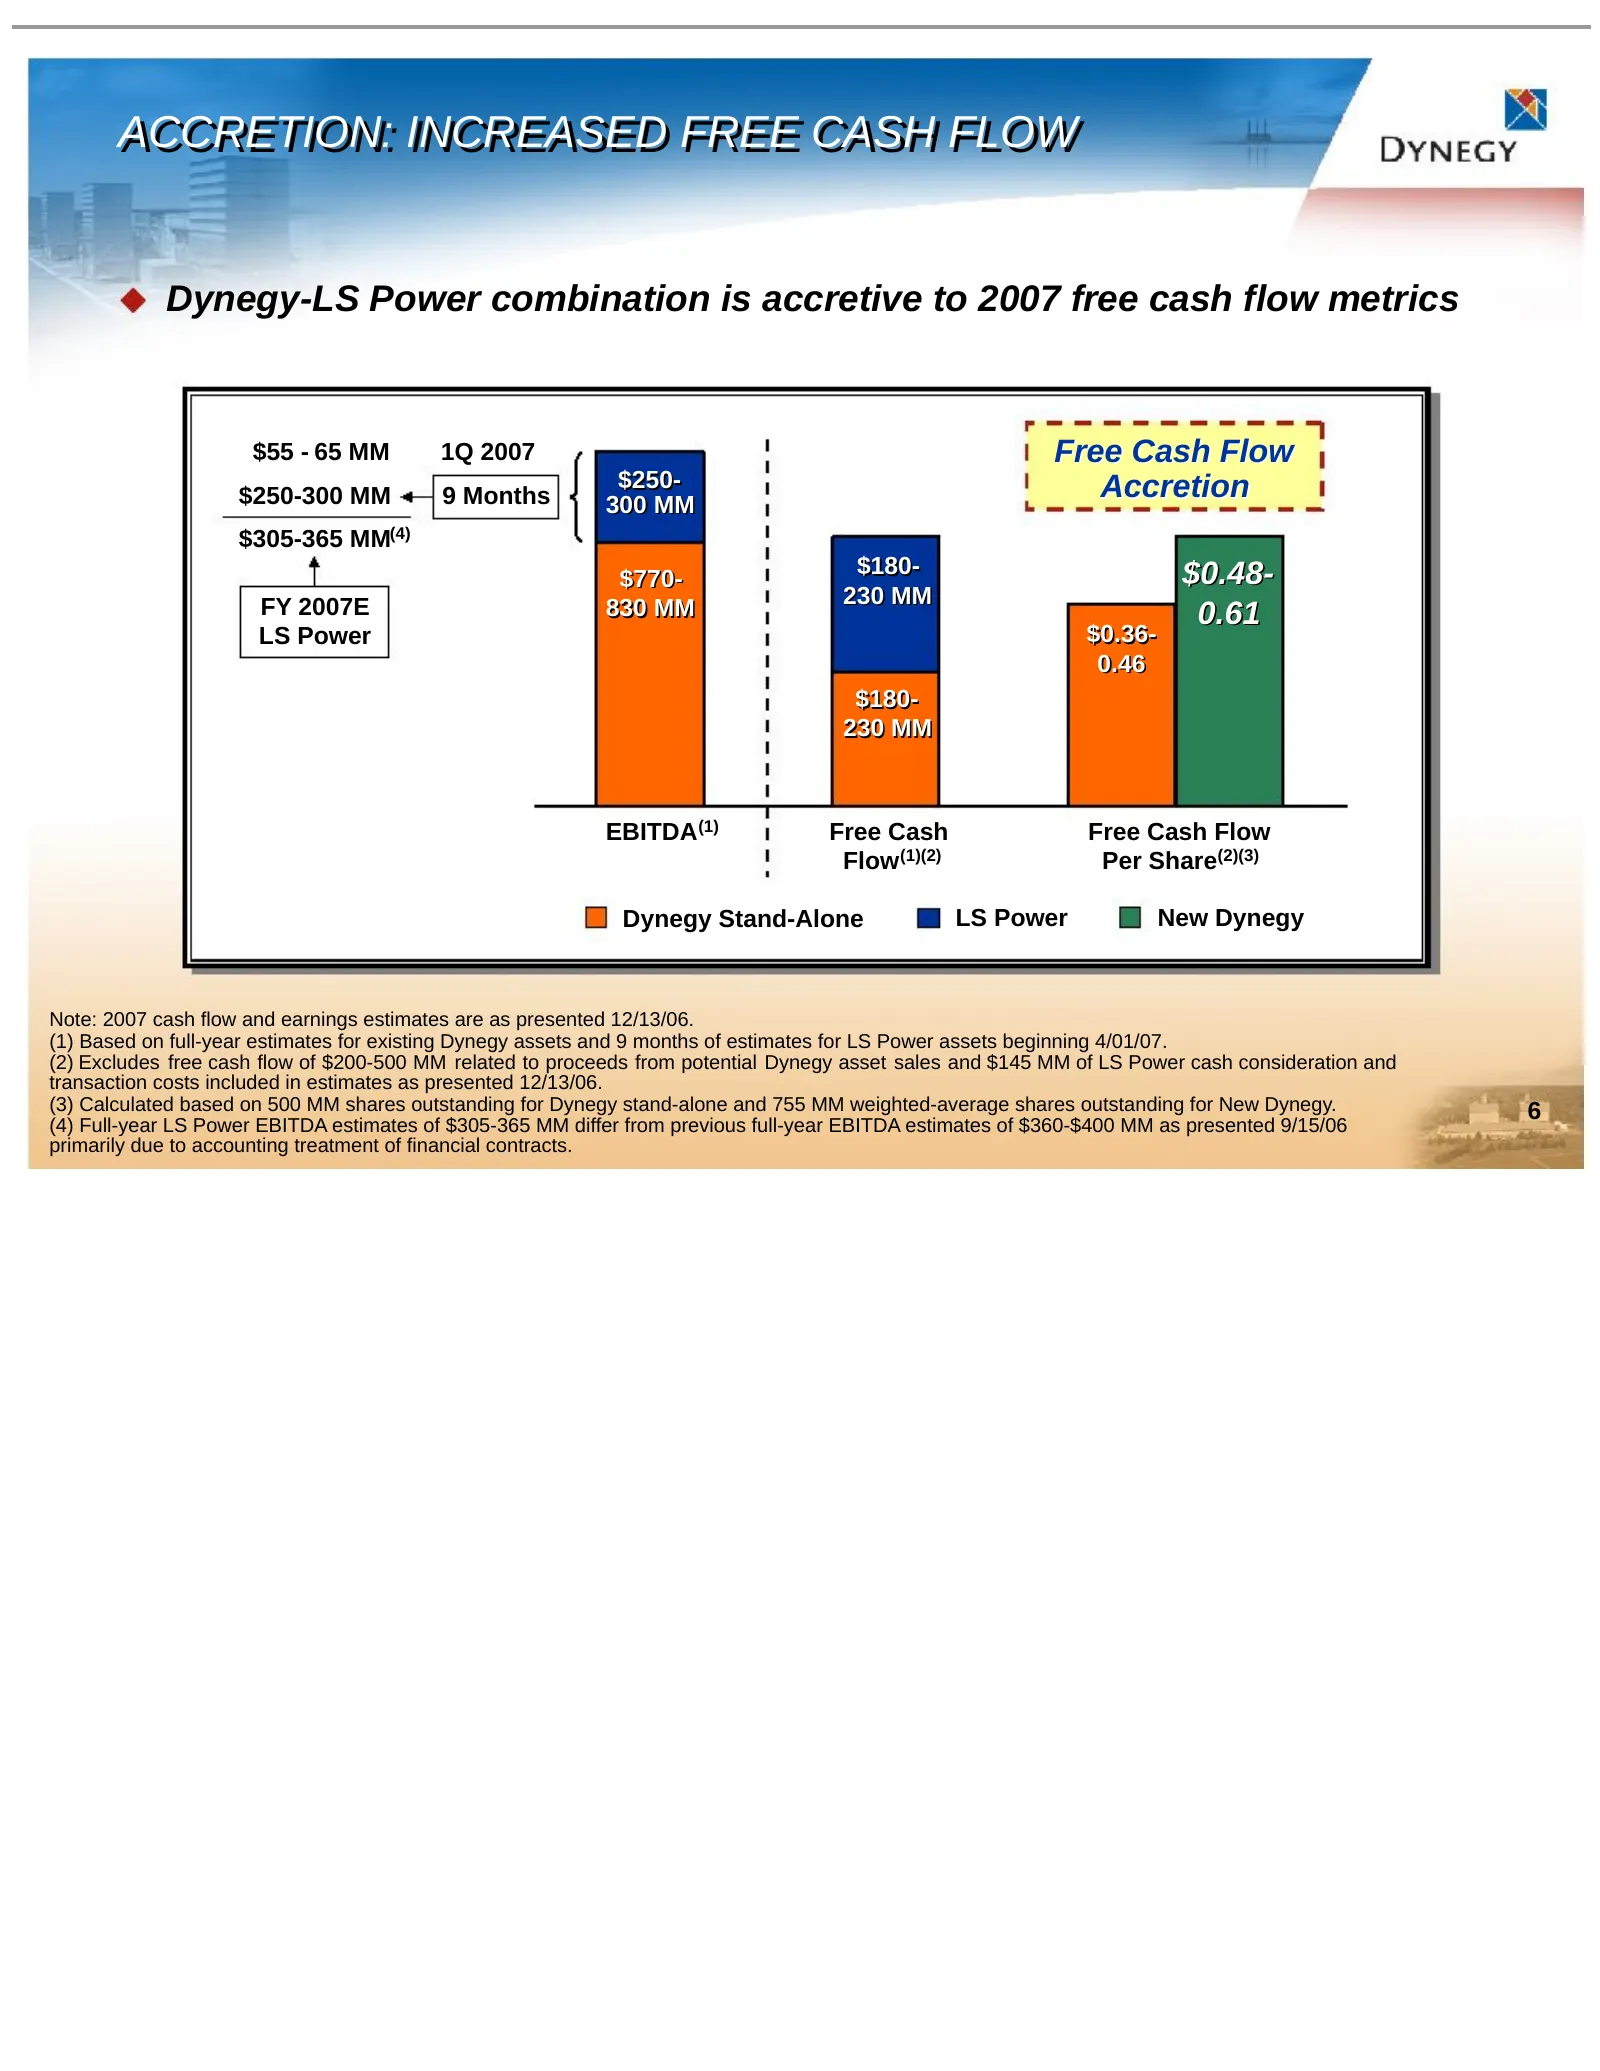
Slide 6: Accretion: Increased Free Cash Flow
ACCRETION: ACCRETION: INCREASED INCREASED FREE FREE CASH CASH FLOW FLOW Dynegy-LS Power combination is accretive to 2007 free cash flow metrics $55 - 65 MM 1Q 2007 Free Cash Flow $250- Accretion $250-300 MM 9 Months 300 MM $305-365 MM(4) $180- $0.48- $770- FY 2007E 230 MM 830 MM 0.61 LS Power $0.36-
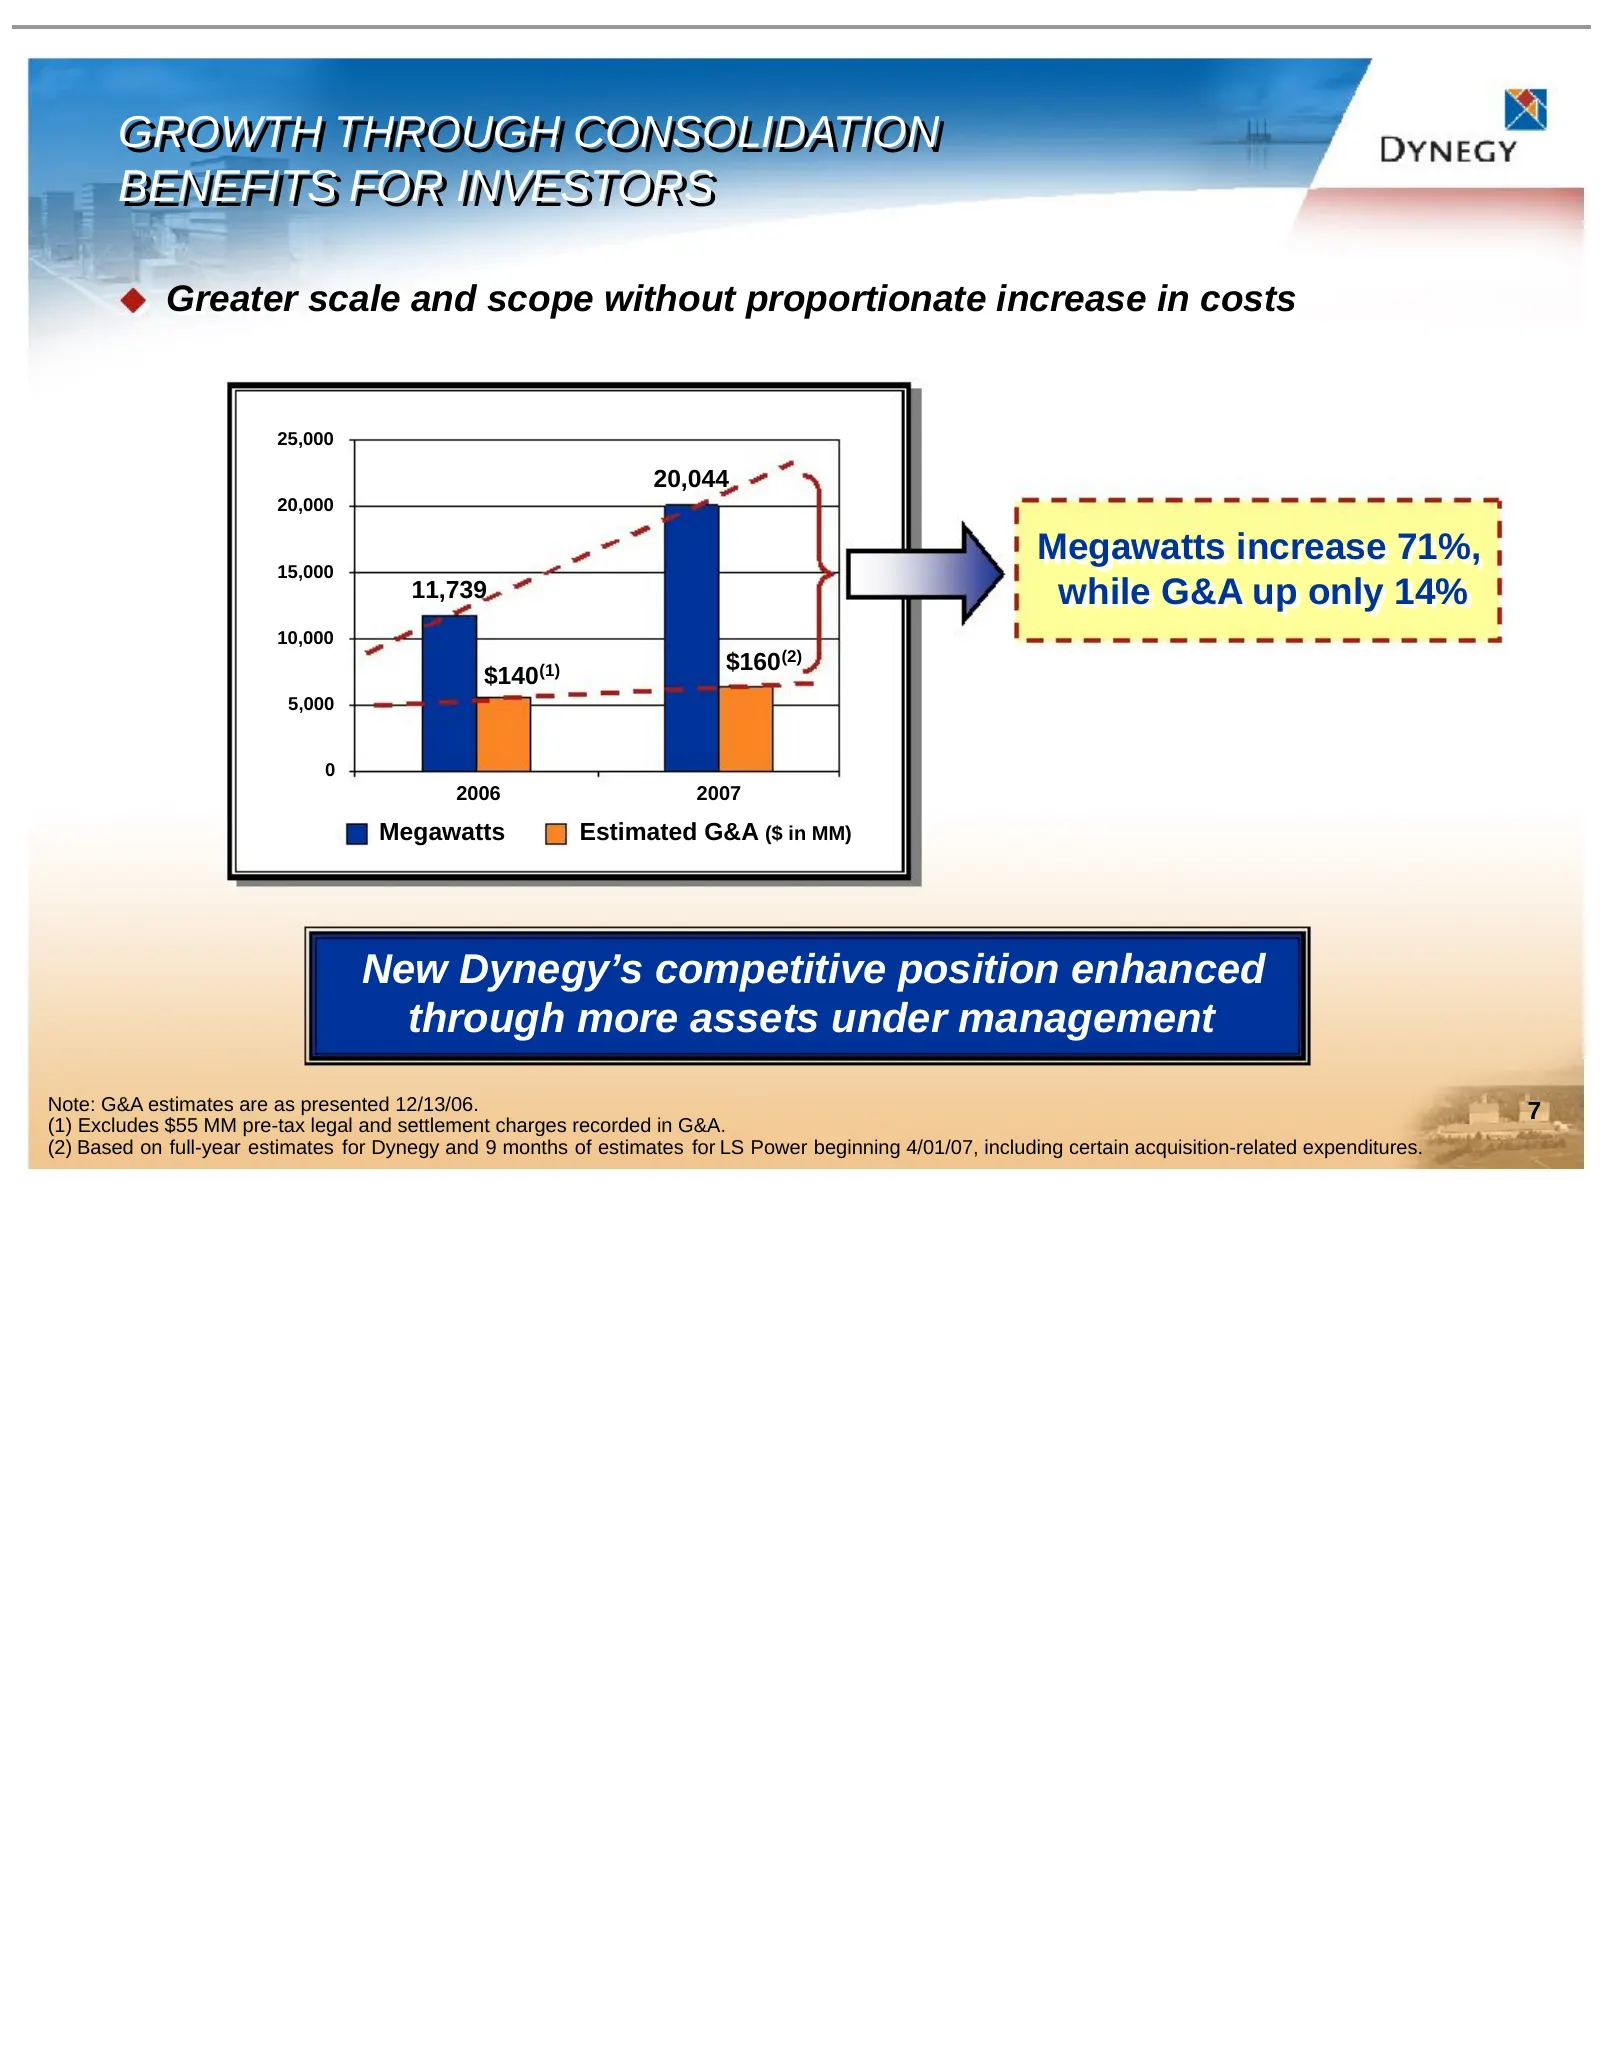
Slide 7: Growth Through Consolidation
GROWTH GROWTH THROUGH THROUGH CONSOLIDATION CONSOLIDATION BENEFITS BENEFITS FOR FOR INVESTORS INVESTORS Greater Greater scale scale and and scope scope without without proportionate proportionate increase increase in in costs costs 25,000 20,044 20,000 15,000 Megawatts Megawatts increase increase 71
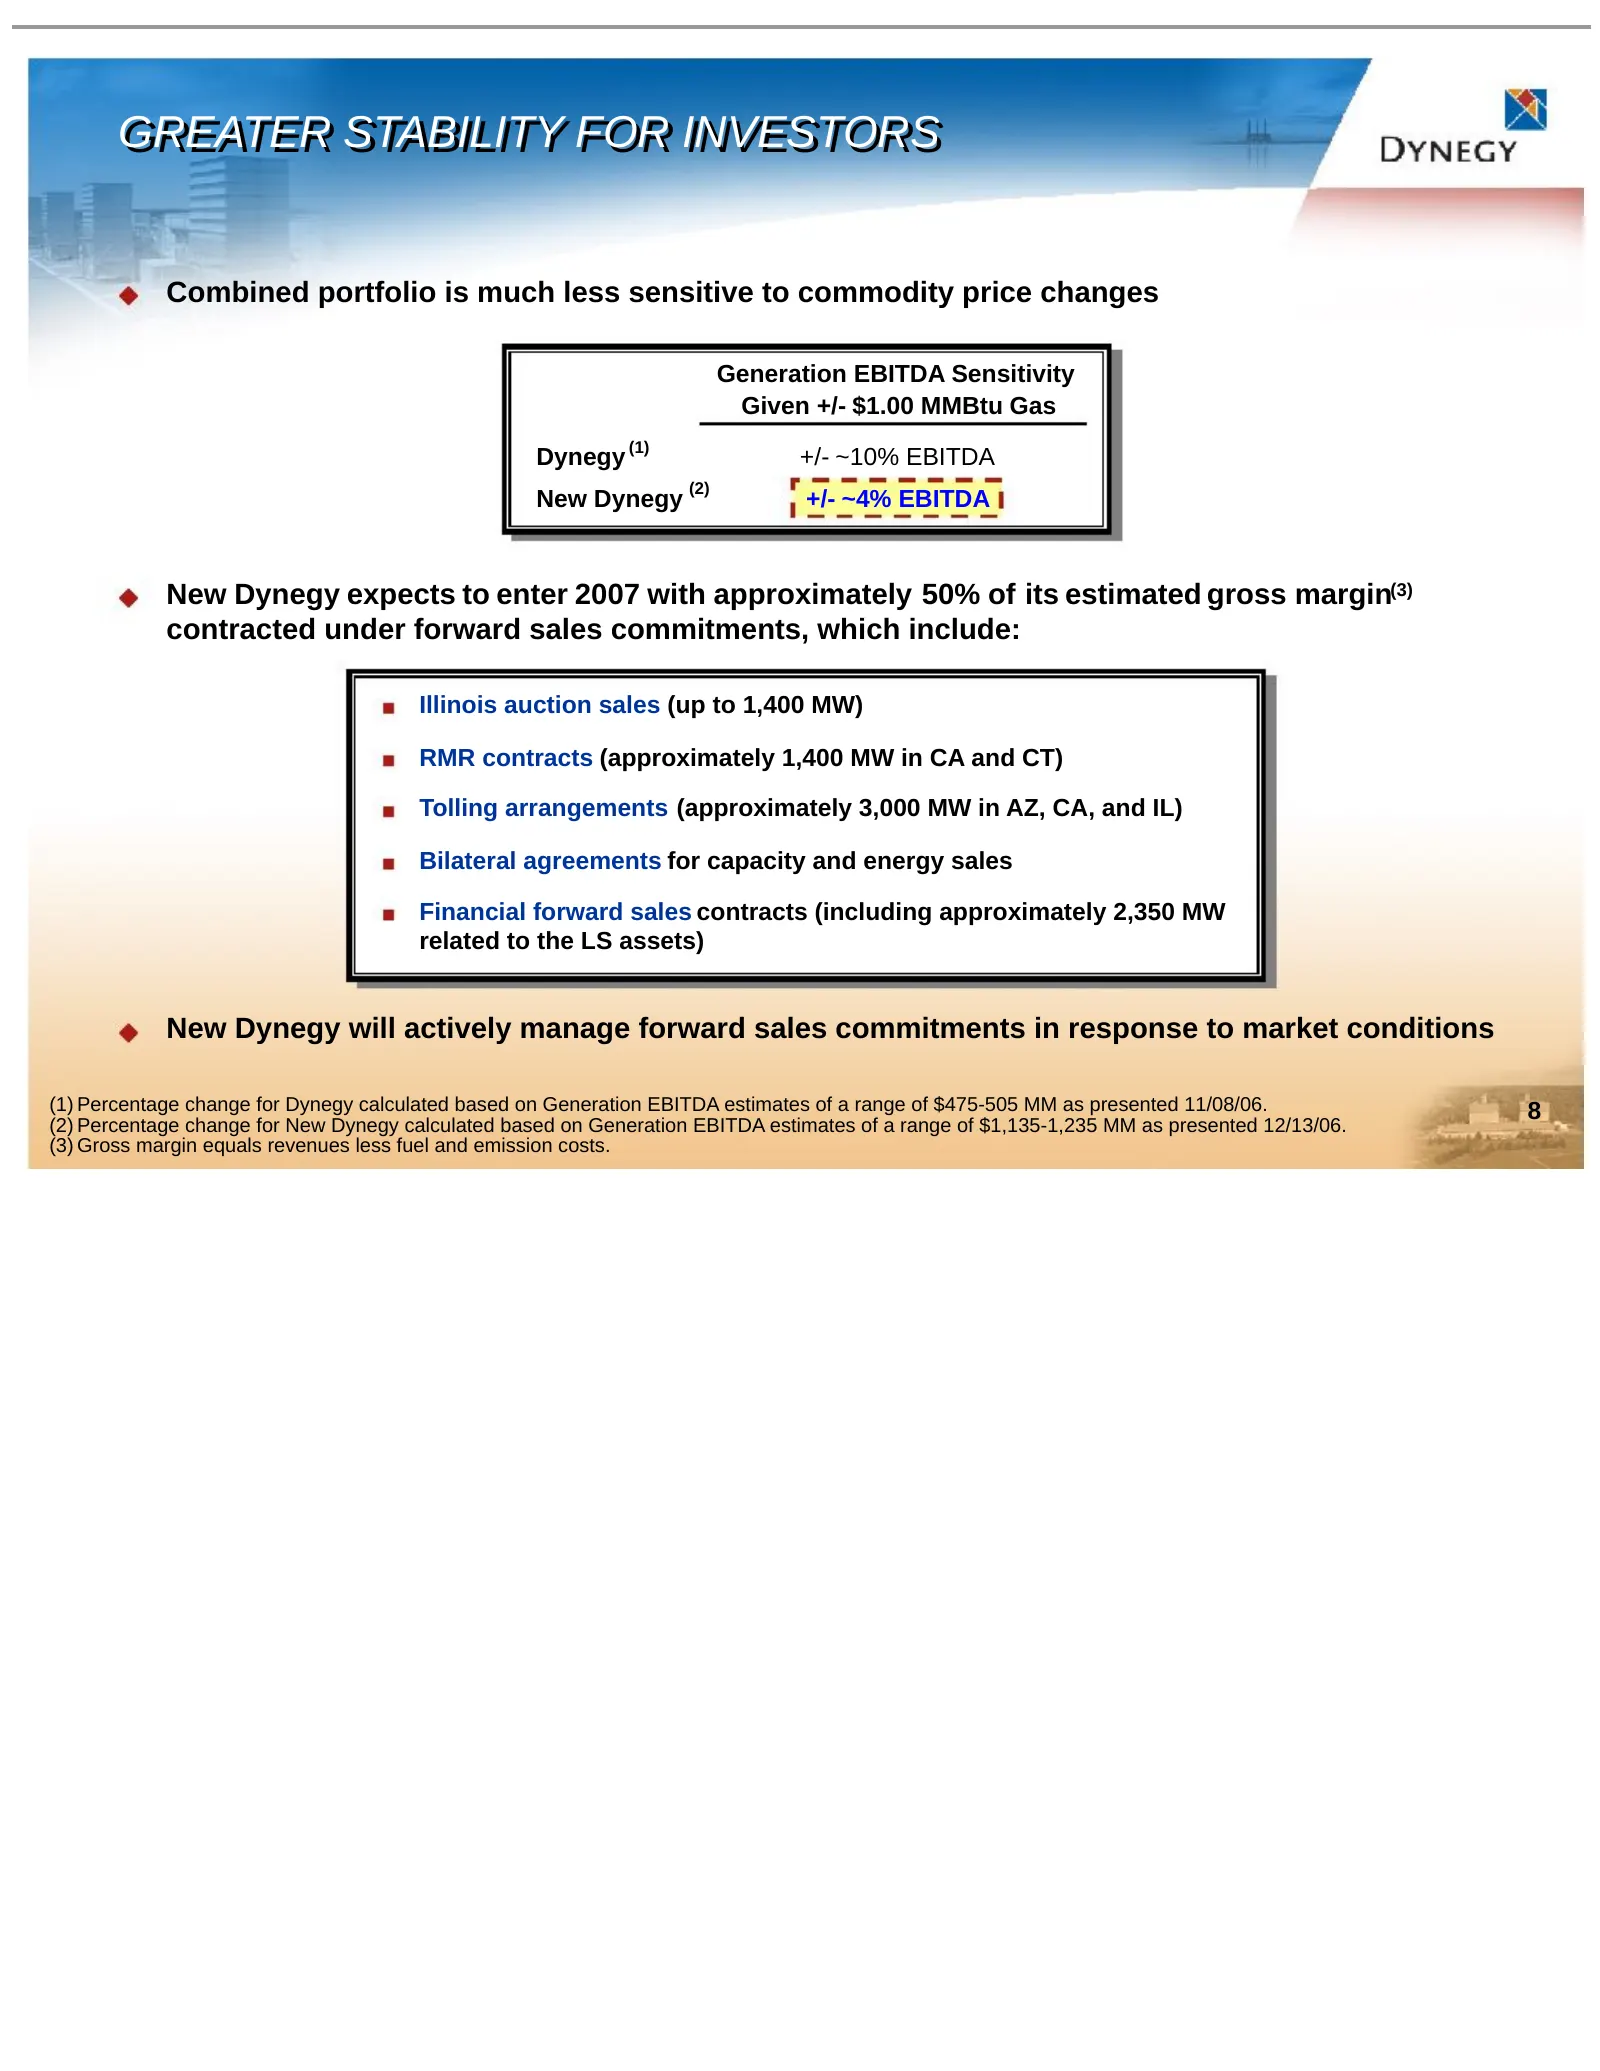
Slide 8: Greater Stability for Investors
GREATER GREATER STABILITY STABILITY FOR FOR INVESTORS INVESTORS Combined portfolio is much less sensitive to commodity price changes Generation EBITDA Sensitivity Given +/- $1.00 MMBtu Gas Dynegy (1) +/- ~10% EBITDA (2) New Dynegy +/- ~4% EBITDA New Dynegy expects to enter 2007 with approximately 50
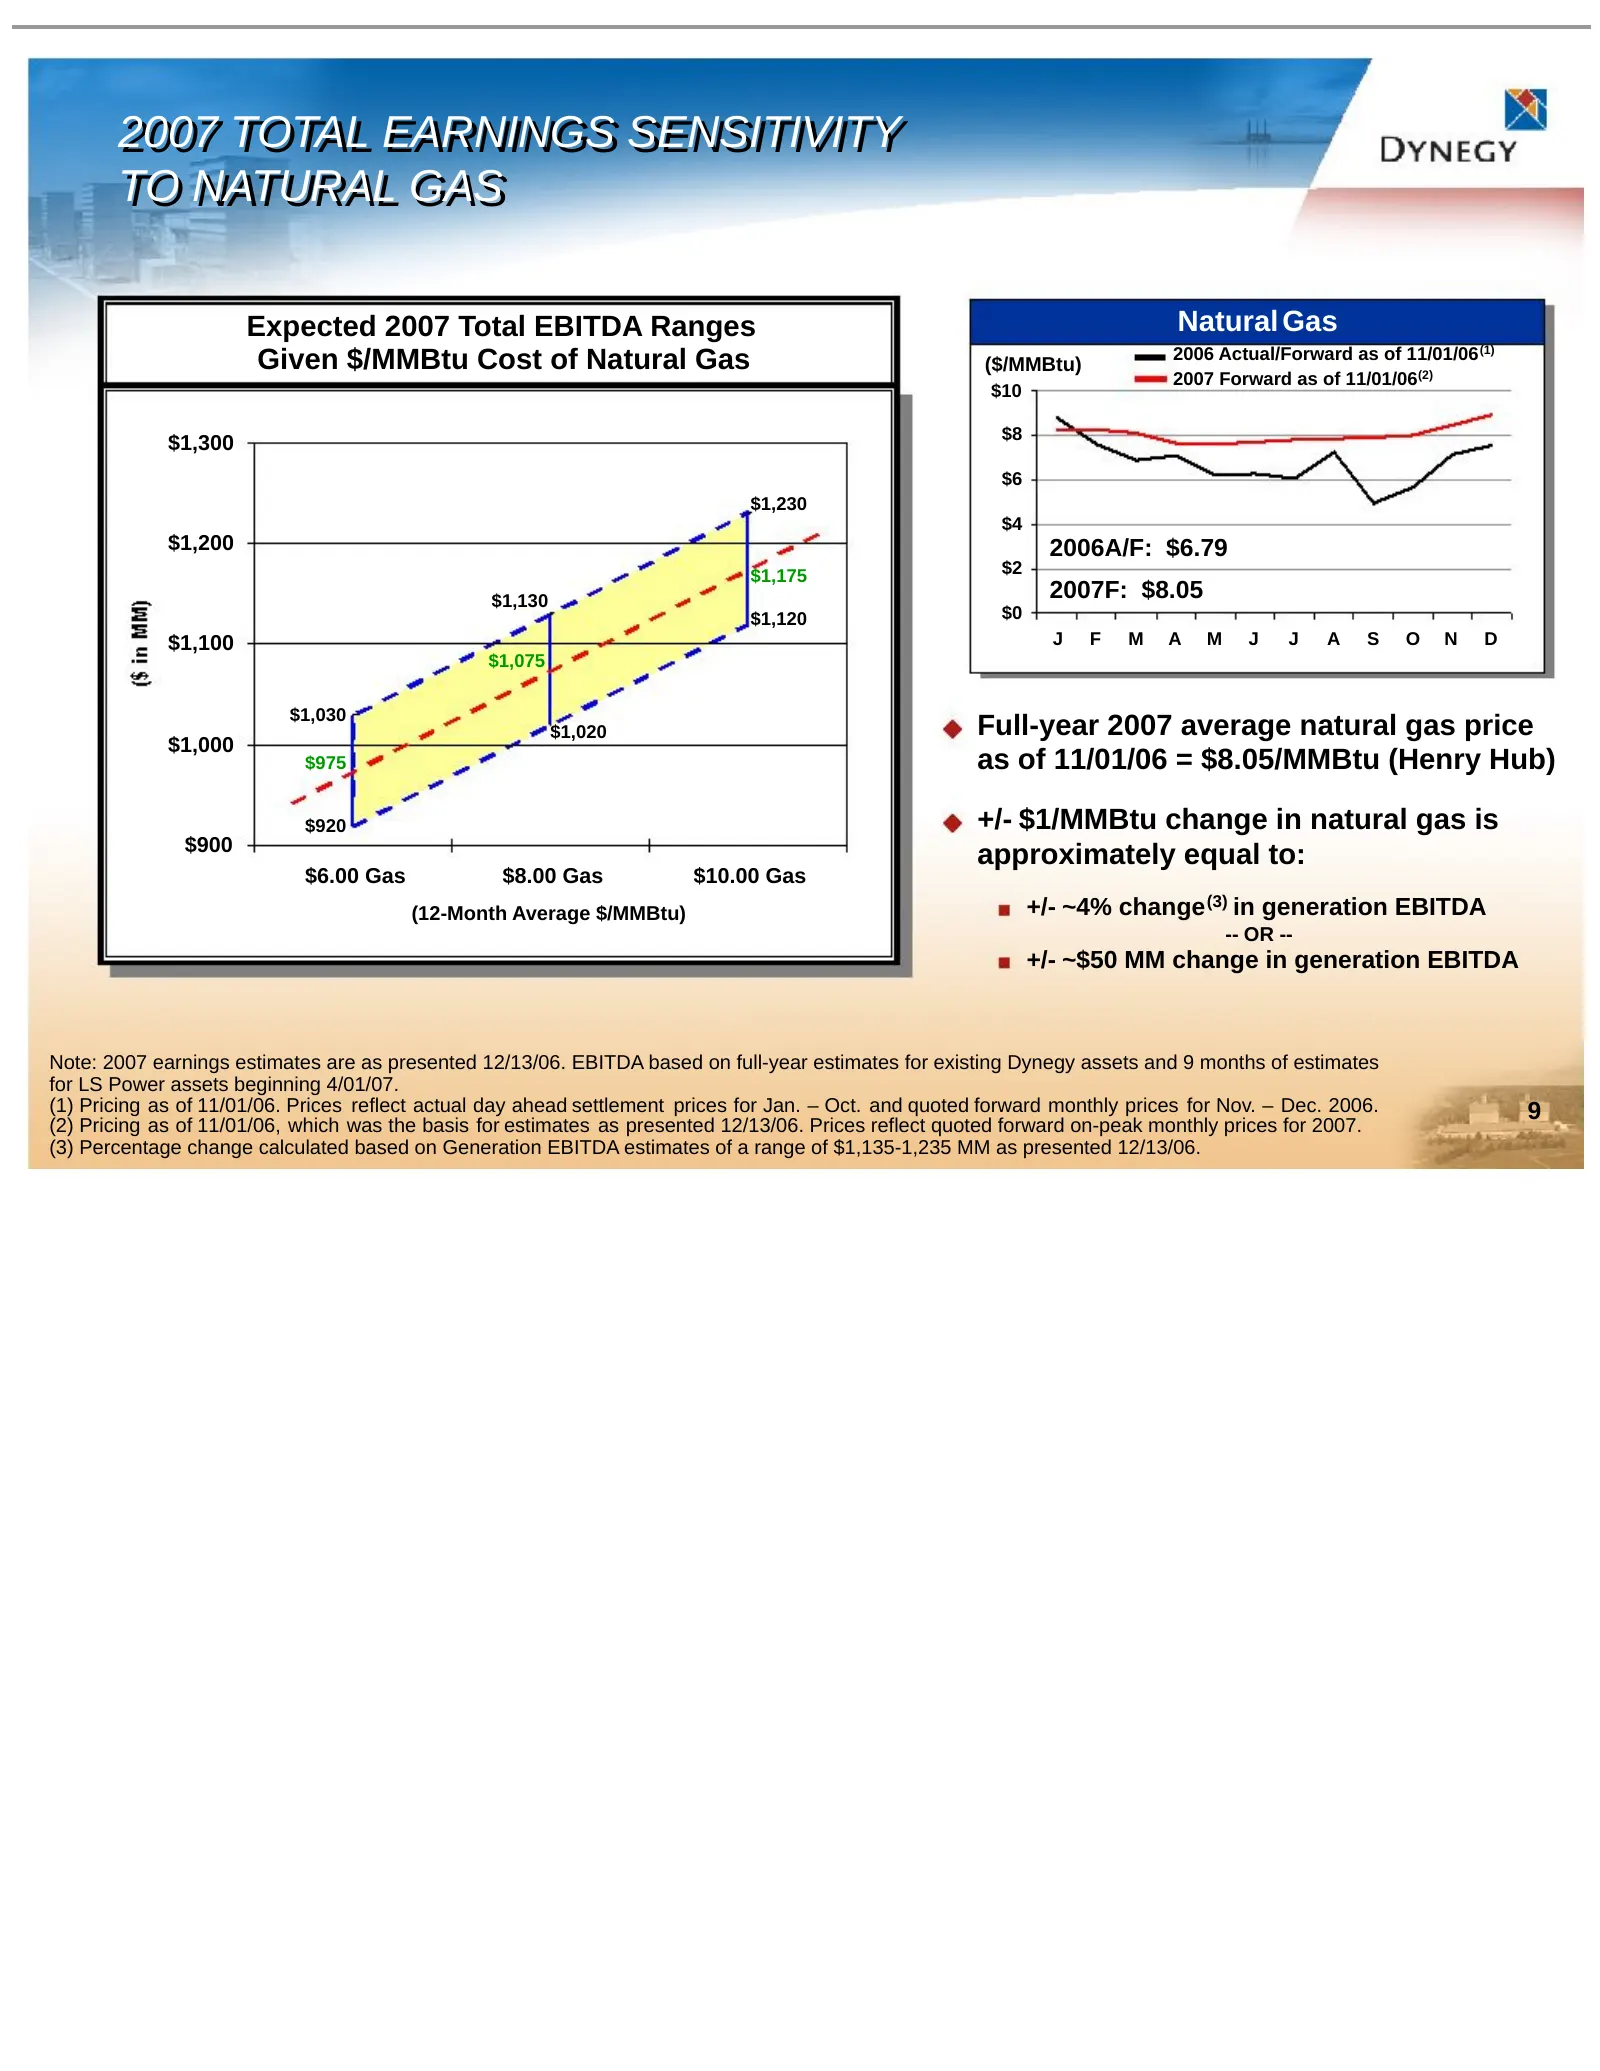
Slide 9: 2007 Total Earnings Sensitivity to Natural Gas
2007 2007 TOTAL TOTAL EARNINGS EARNINGS SENSITIVITY SENSITIVITY TO TO NATURAL NATURAL GAS GAS Expected 2007 Total EBITDA Ranges Natural Gas Given $/MMBtu Cost of Natural Gas 2006 Actual/Forward as of 11/01/06 (1) ($/MMBtu) 2007 Forward as of 11/01/06(2) $10 $1,300 $8 $6 $1,230 $4 $1,200 2006A/F: $6.
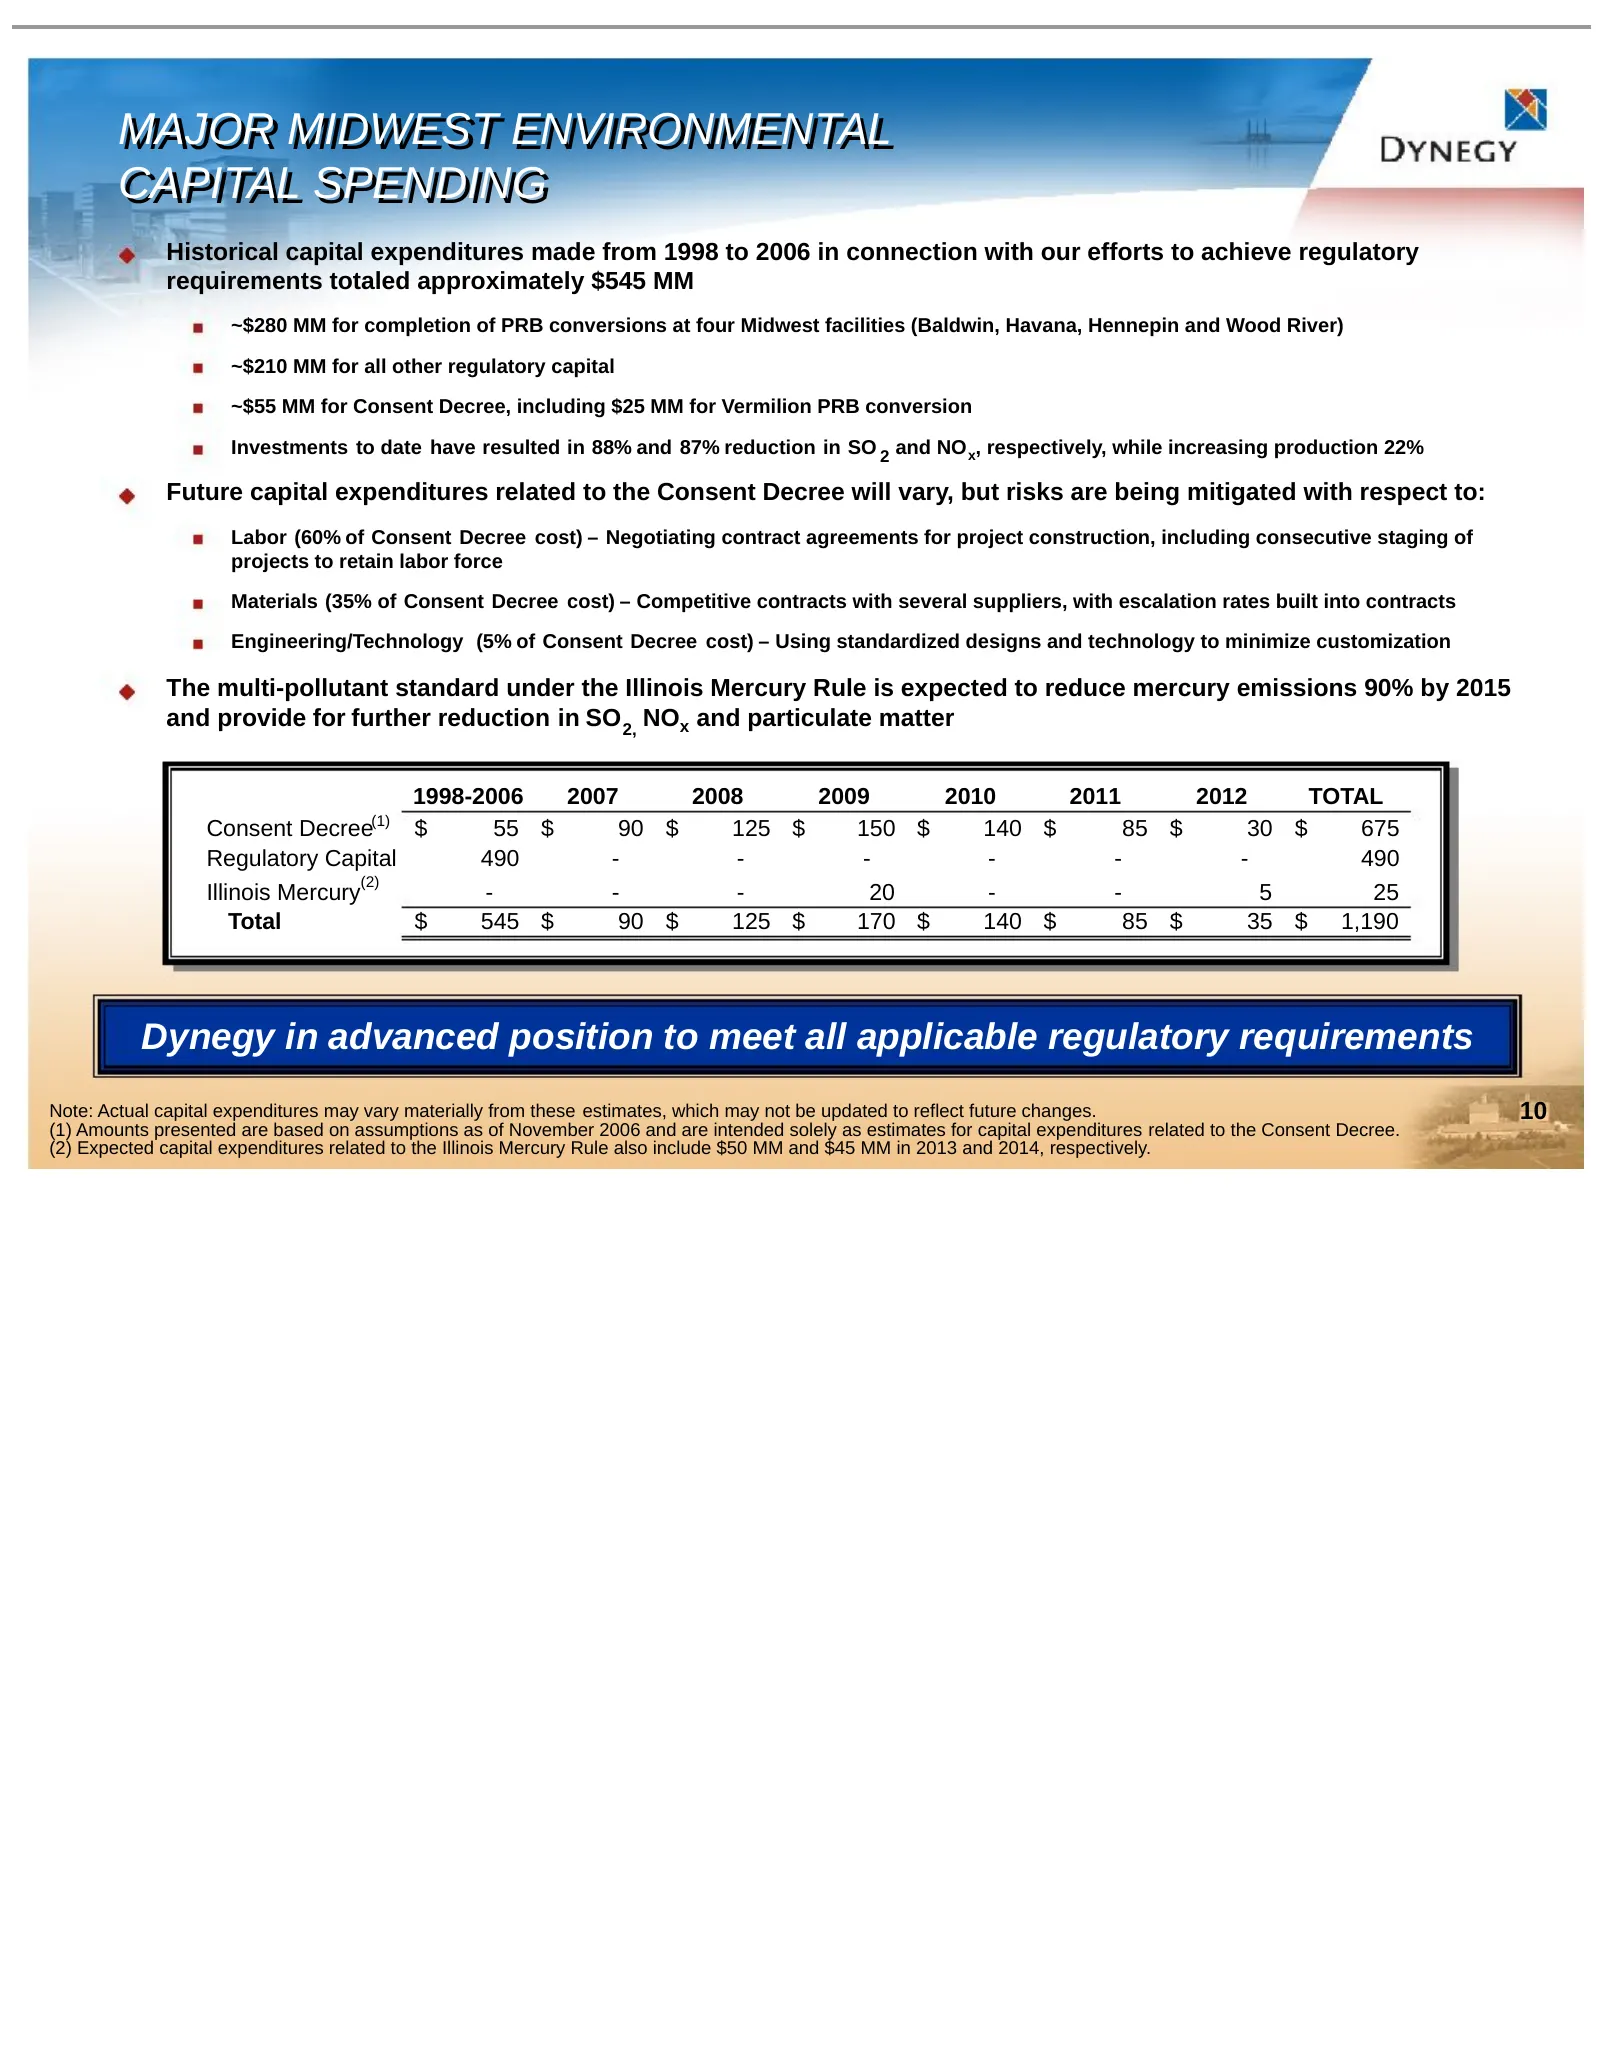
Slide 10: Major Midwest Environmental Capital Spending
MAJOR MAJOR MIDWEST MIDWEST ENVIRONMENTAL ENVIRONMENTAL CAPITAL CAPITAL SPENDING SPENDING Historical capital expenditures made from 1998 to 2006 in connection with our efforts to achieve regulatory requirements totaled approximately $545 MM ~$280 MM for completion of PRB conversions at four Midwest
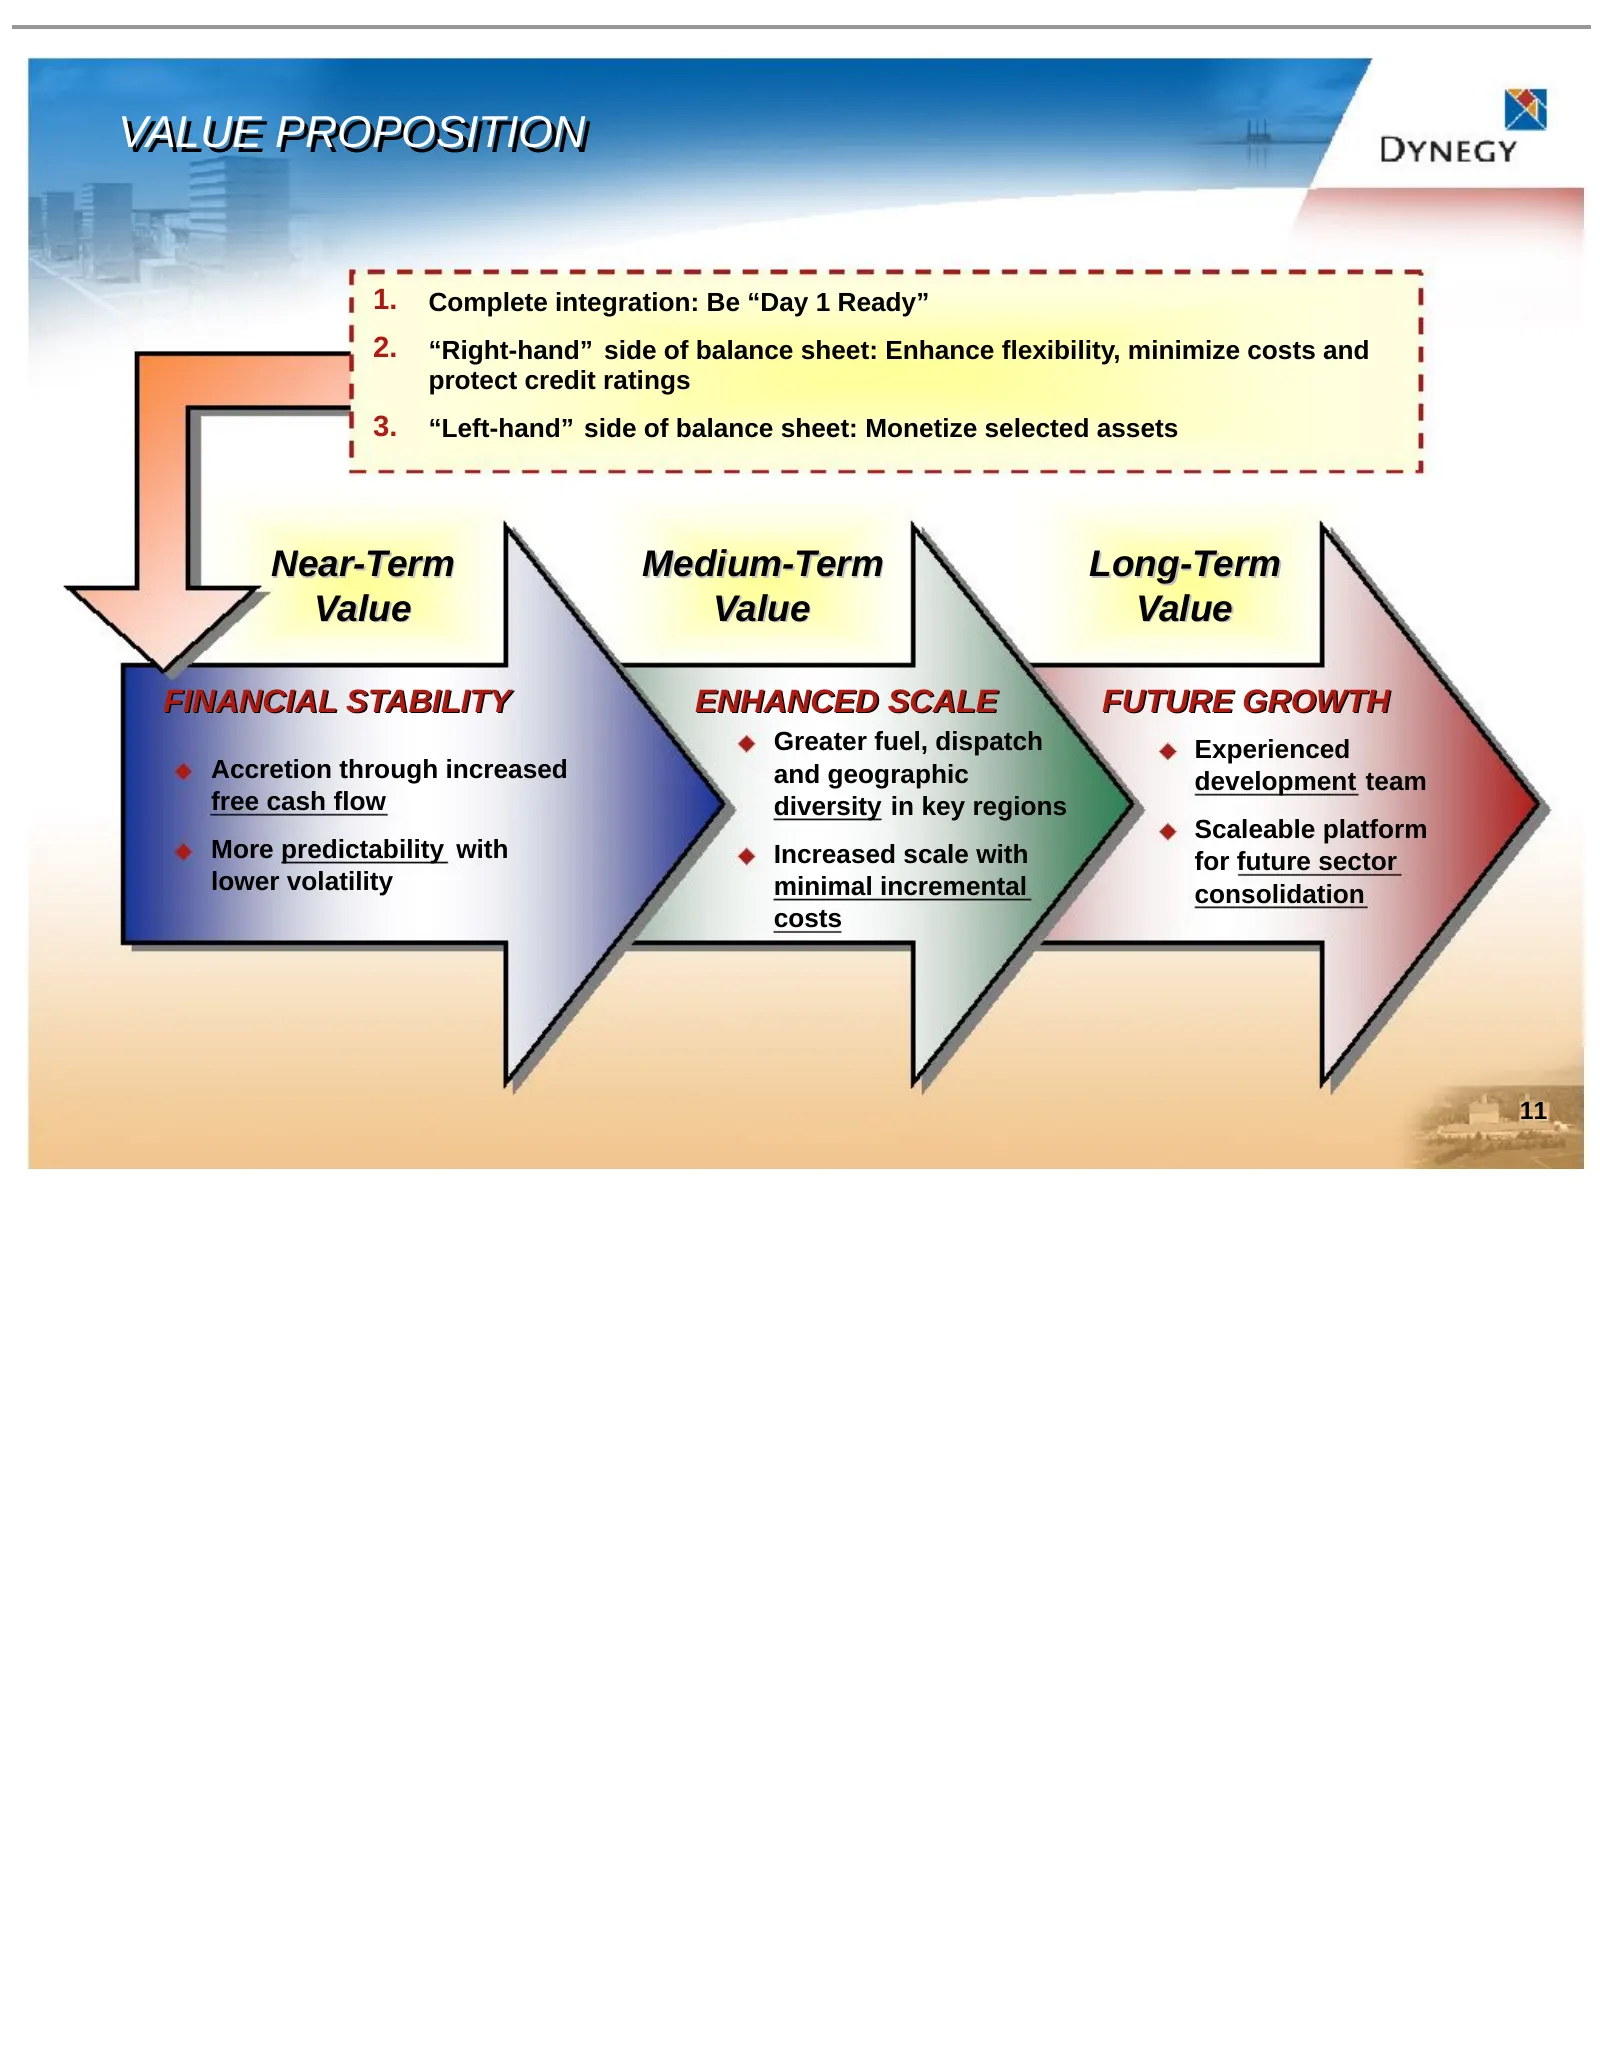
Slide 11: Value Proposition
VALUE VALUE PROPOSITION PROPOSITION 1. Complete integration: Be “Day 1 Ready” 2. “Right-hand” side of balance sheet: Enhance flexibility, minimize costs and protect credit ratings 3. “Left-hand” side of balance sheet: Monetize selected assets Near-Term Medium-Term Long-Term Value Value Value FINANCI
Slide 12: Appendix
Appendix
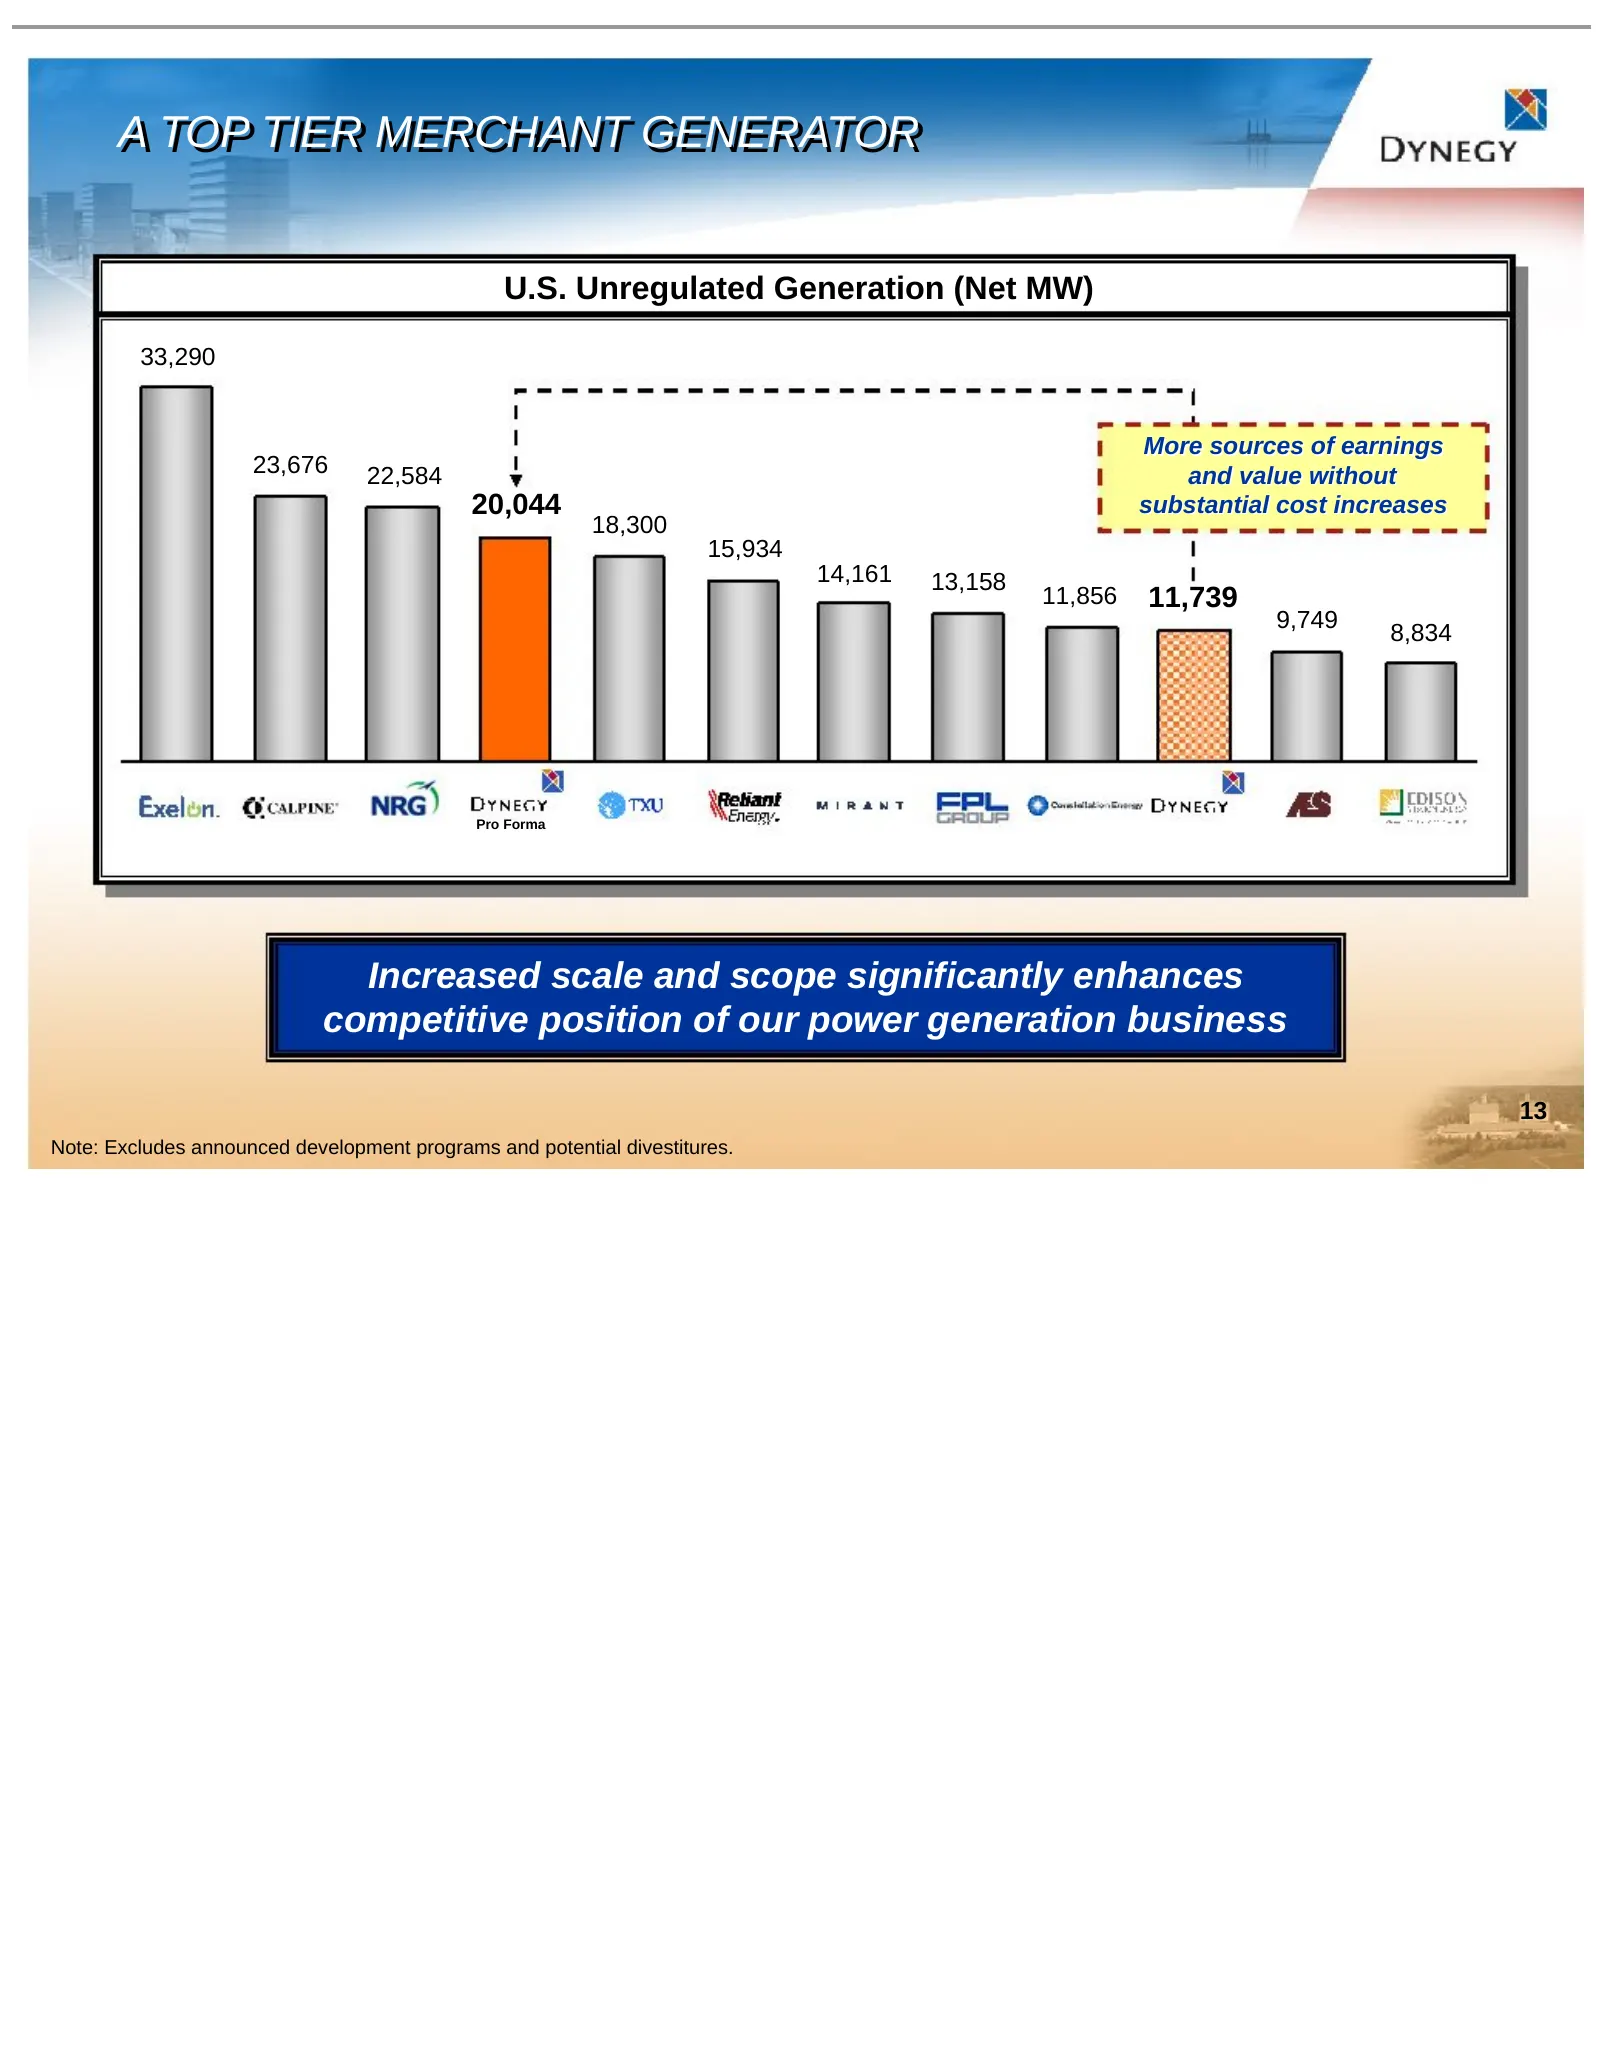
Slide 13: A Top Tier Merchant Generator
A A TOP TOP TIER TIER MERCHANT MERCHANT GENERATOR GENERATOR U.S. Unregulated Generation (Net MW) 33,290 More sources of earnings 23,676 22,584 and value without 20,044 substantial cost increases 18,300 15,934 14,161 13,158 11,856 11,739 9,749 8,834 Pro Forma Increased scale and scope significantly e
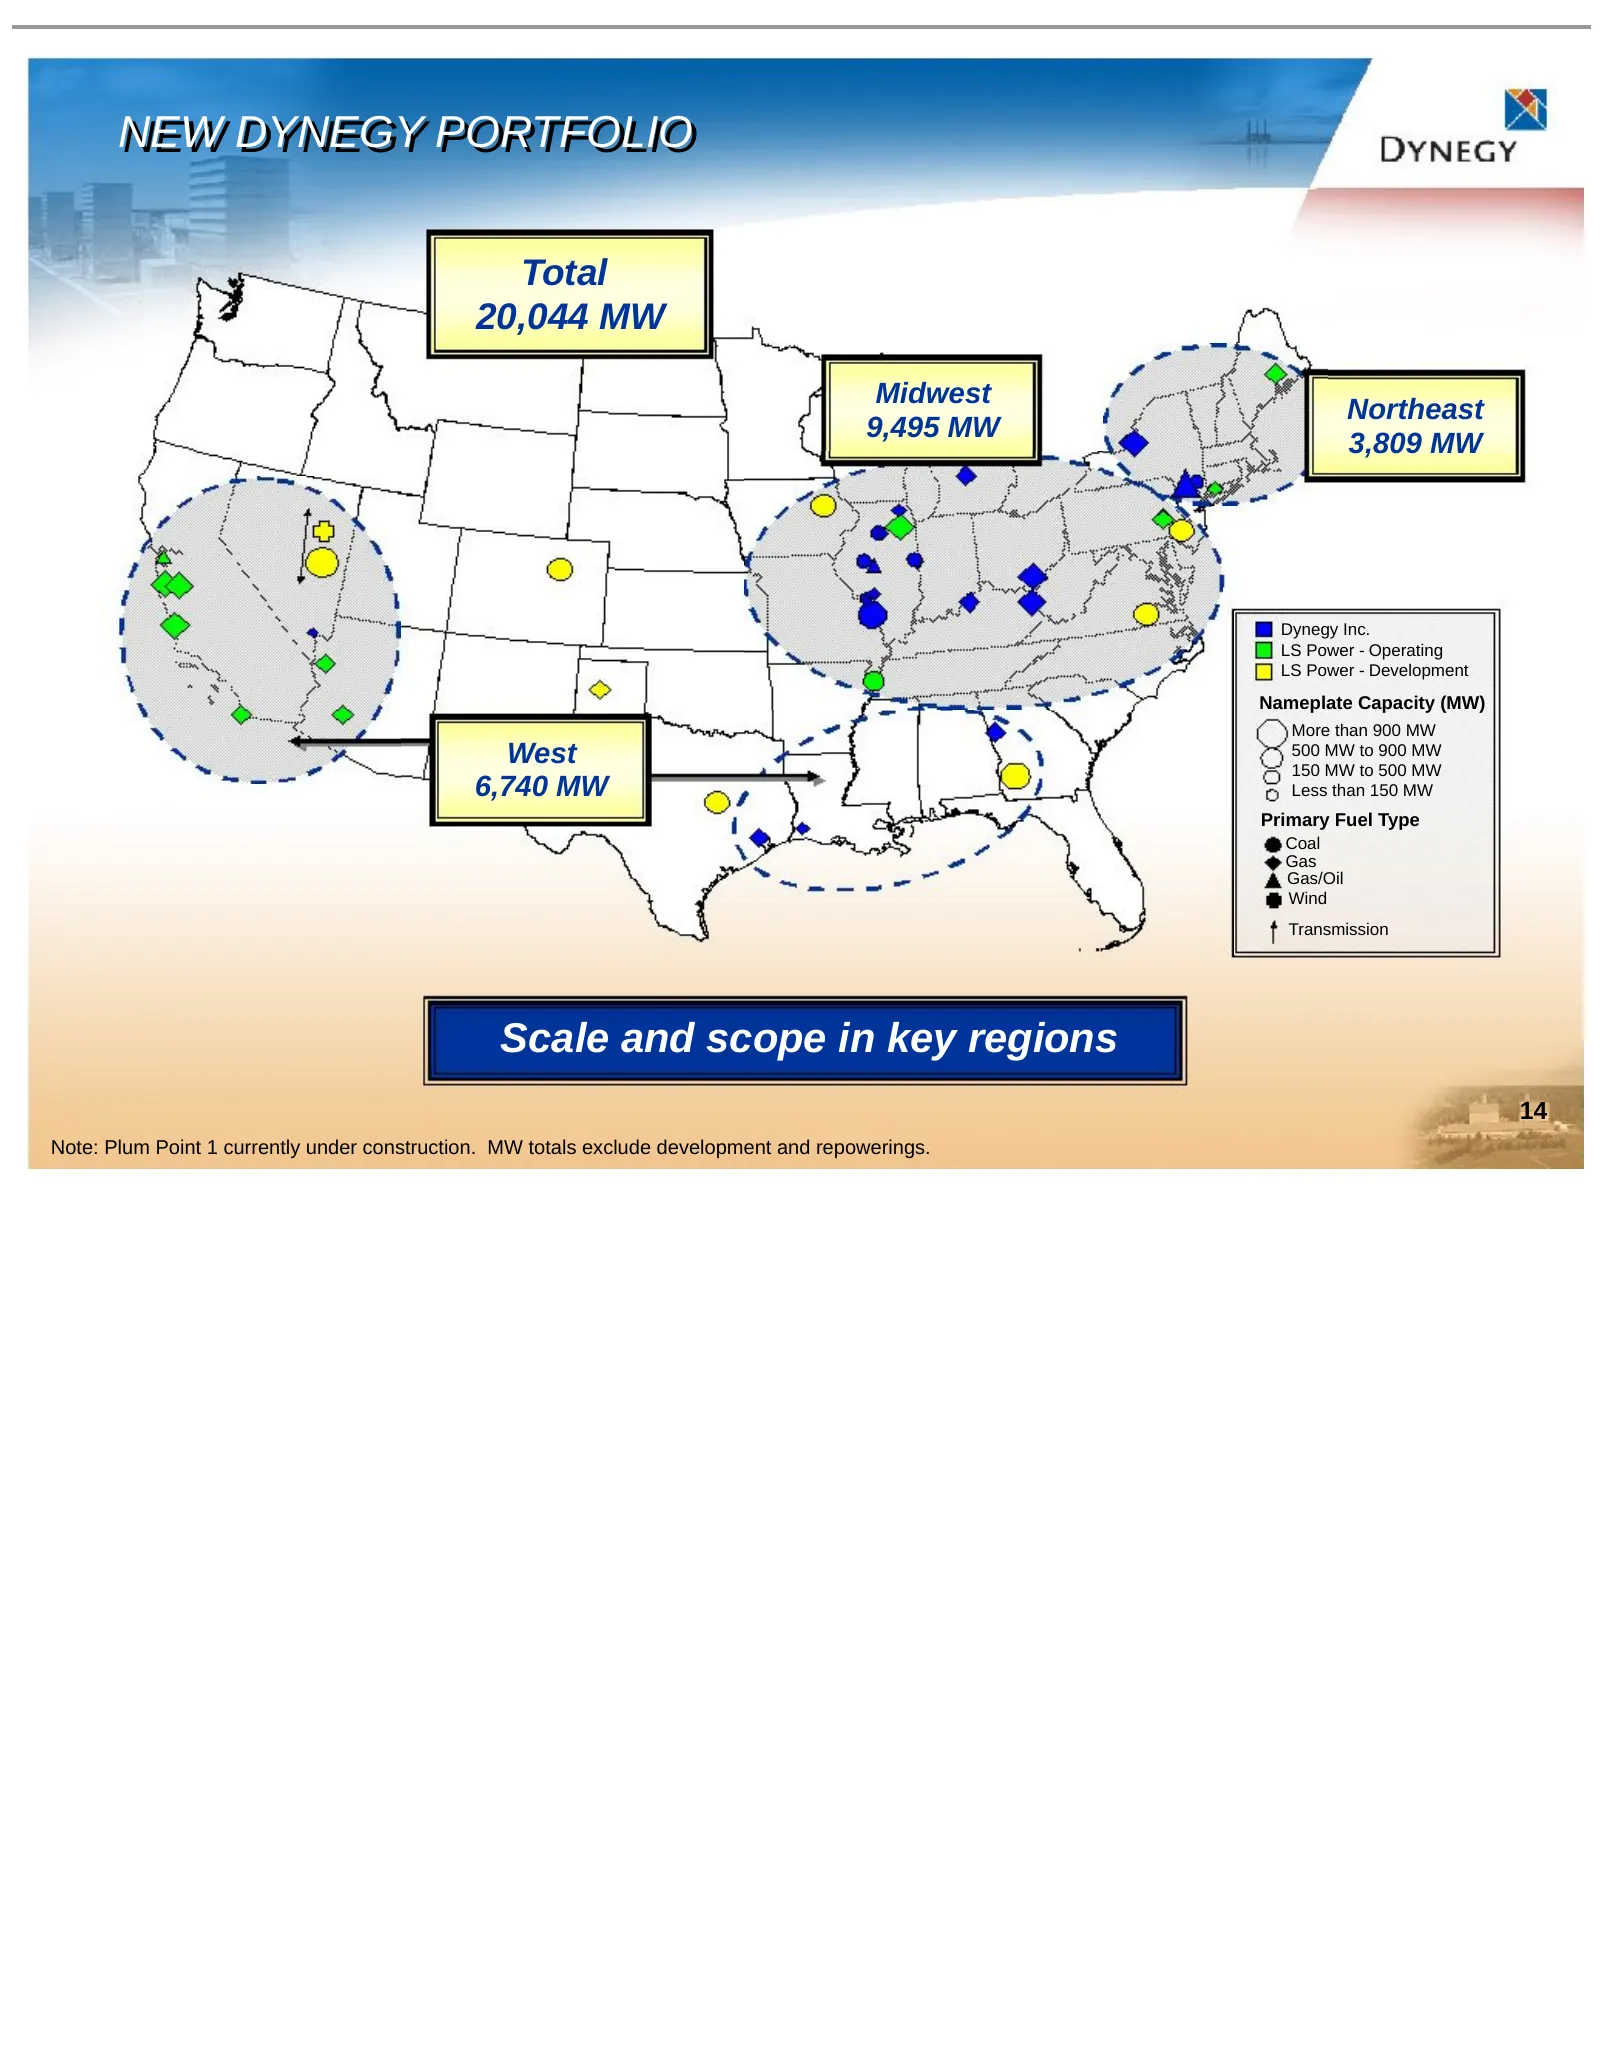
Slide 14: New Dynegy Portfolio
NEW NEW DYNEGY DYNEGY PORTFOLIO PORTFOLIO Total 20,044 MW Midwest Northeast 9,495 MW 3,809 MW Dynegy Inc. LS Power - Operating LS Power - Development Nameplate Capacity (MW) More than 900 MW West 500 MW to 900 MW 150 MW to 500 MW 6,740 MW Less than 150 MW Primary Fuel Type Coal Gas Gas/Oil Wind Tran
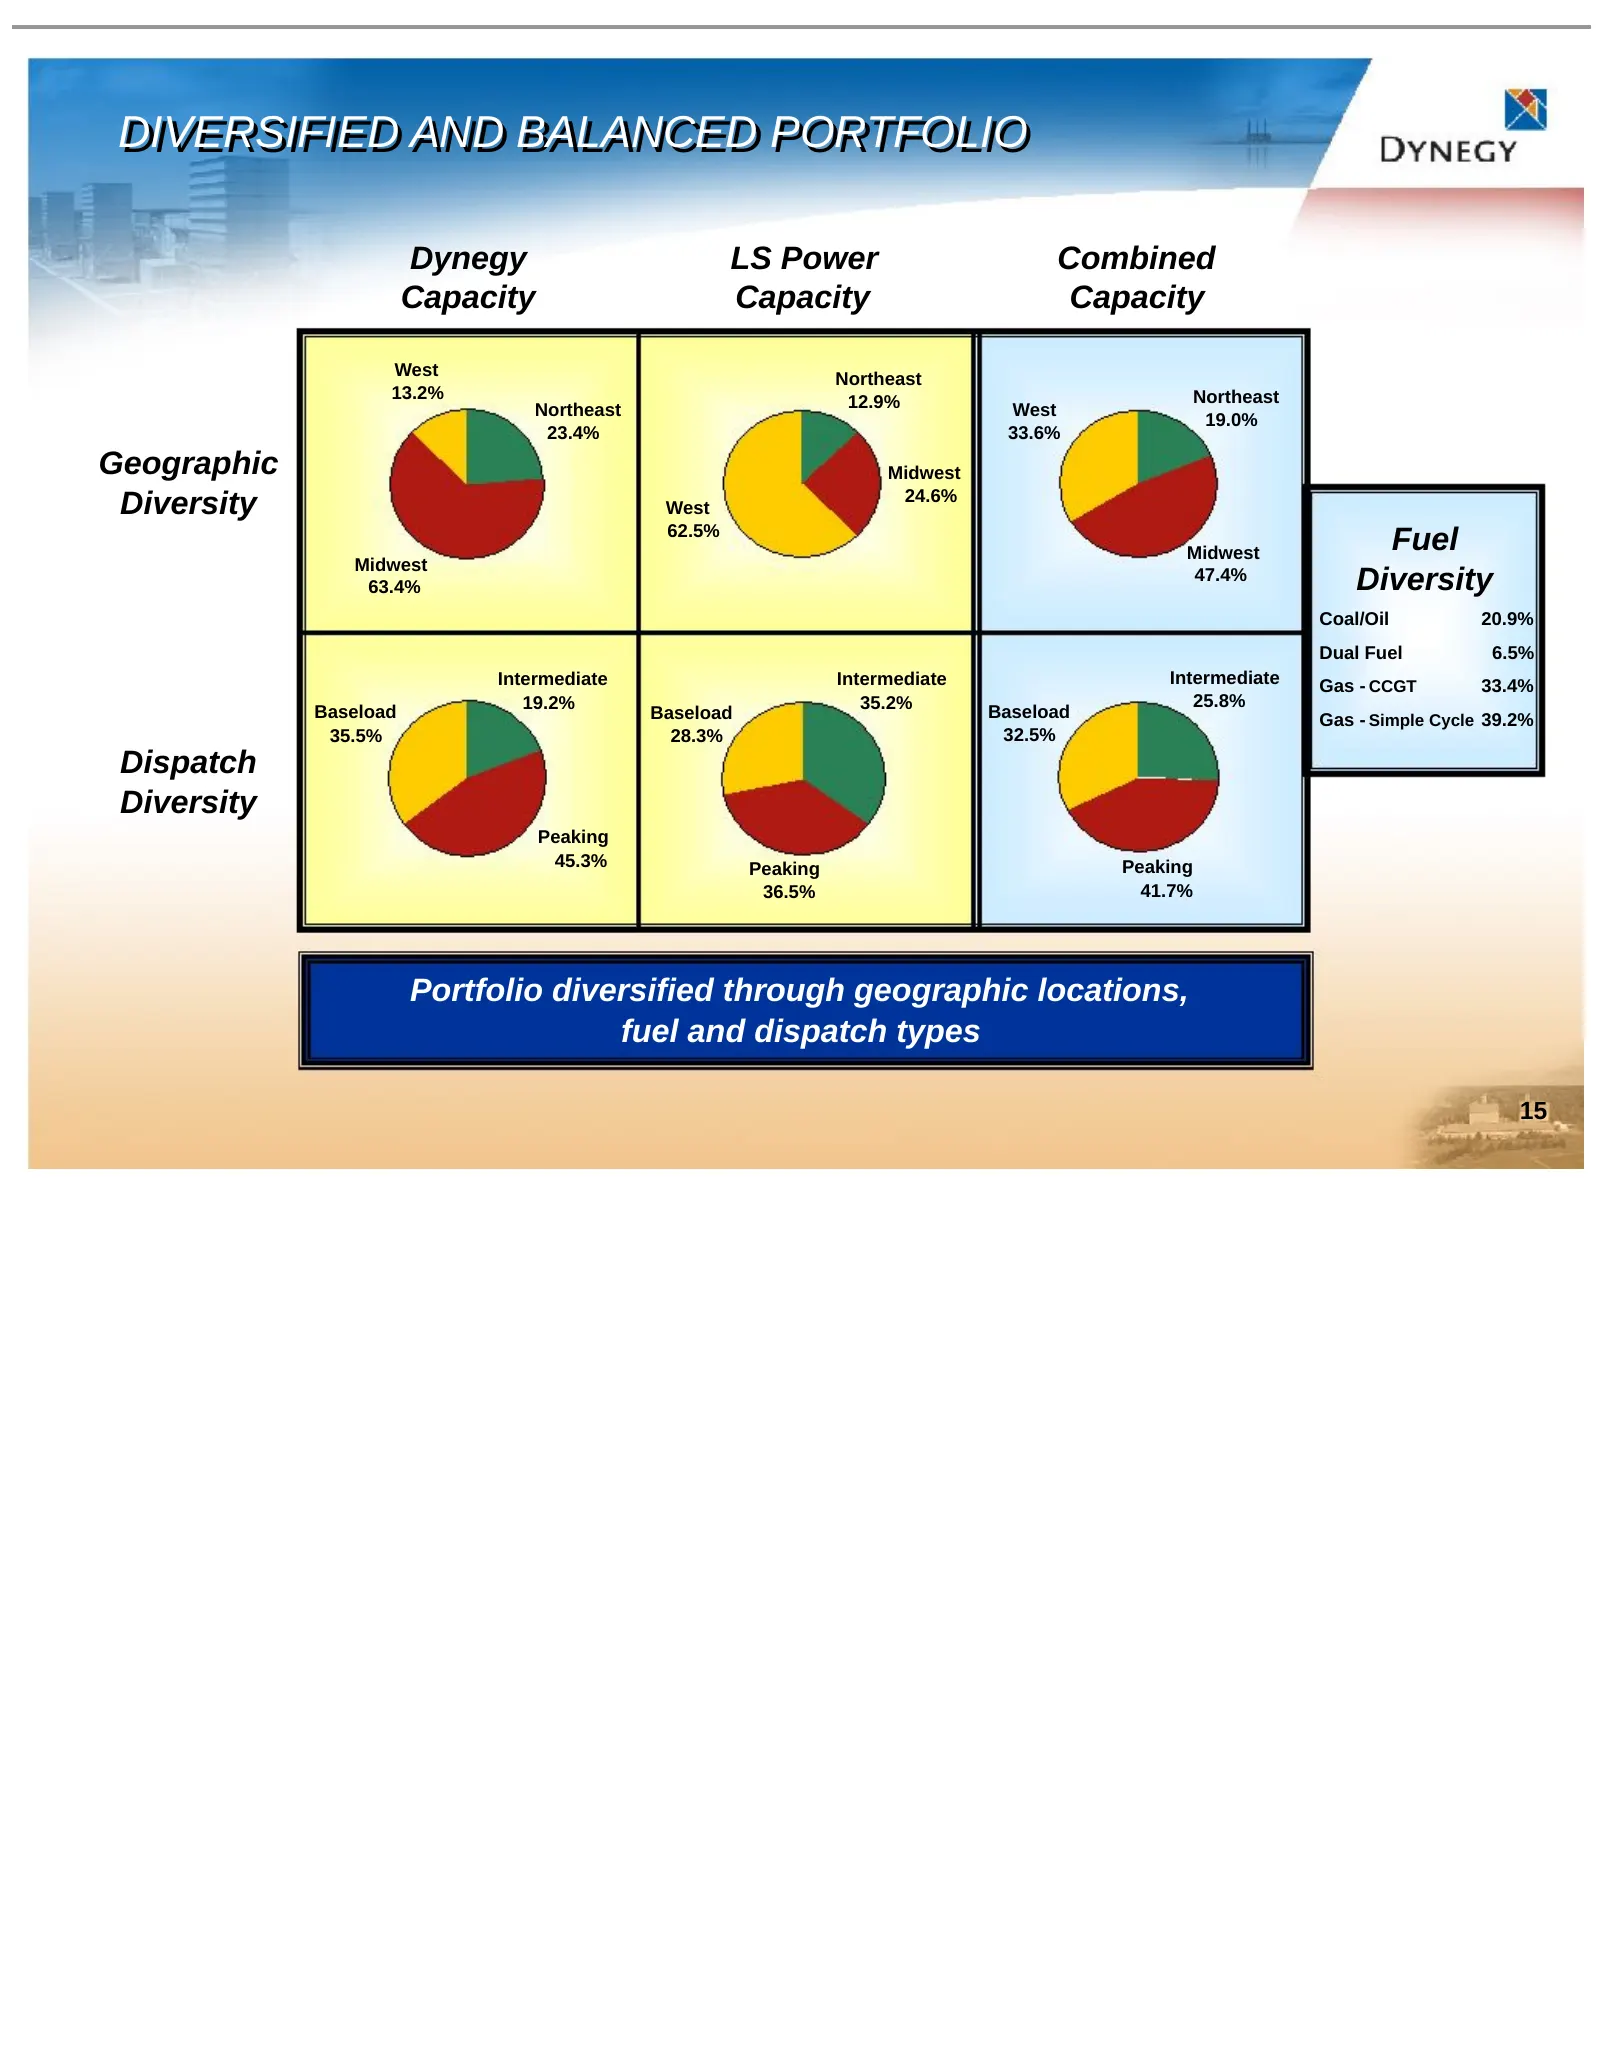
Slide 15: Diversified and Balanced Portfolio
DIVERSIFIED DIVERSIFIED AND AND BALANCED BALANCED PORTFOLIO PORTFOLIO Dynegy LS Power Combined Capacity Capacity Capacity West Northeast 13.2% Northeast Northeast 12.9% West 19.0% 23.4% 33.6% Geographic Midwest Diversity West 24.6% 62.5% Midwest Fuel Midwest 63.4% 47.4% Diversity Coal/Oil 20.9% Dual
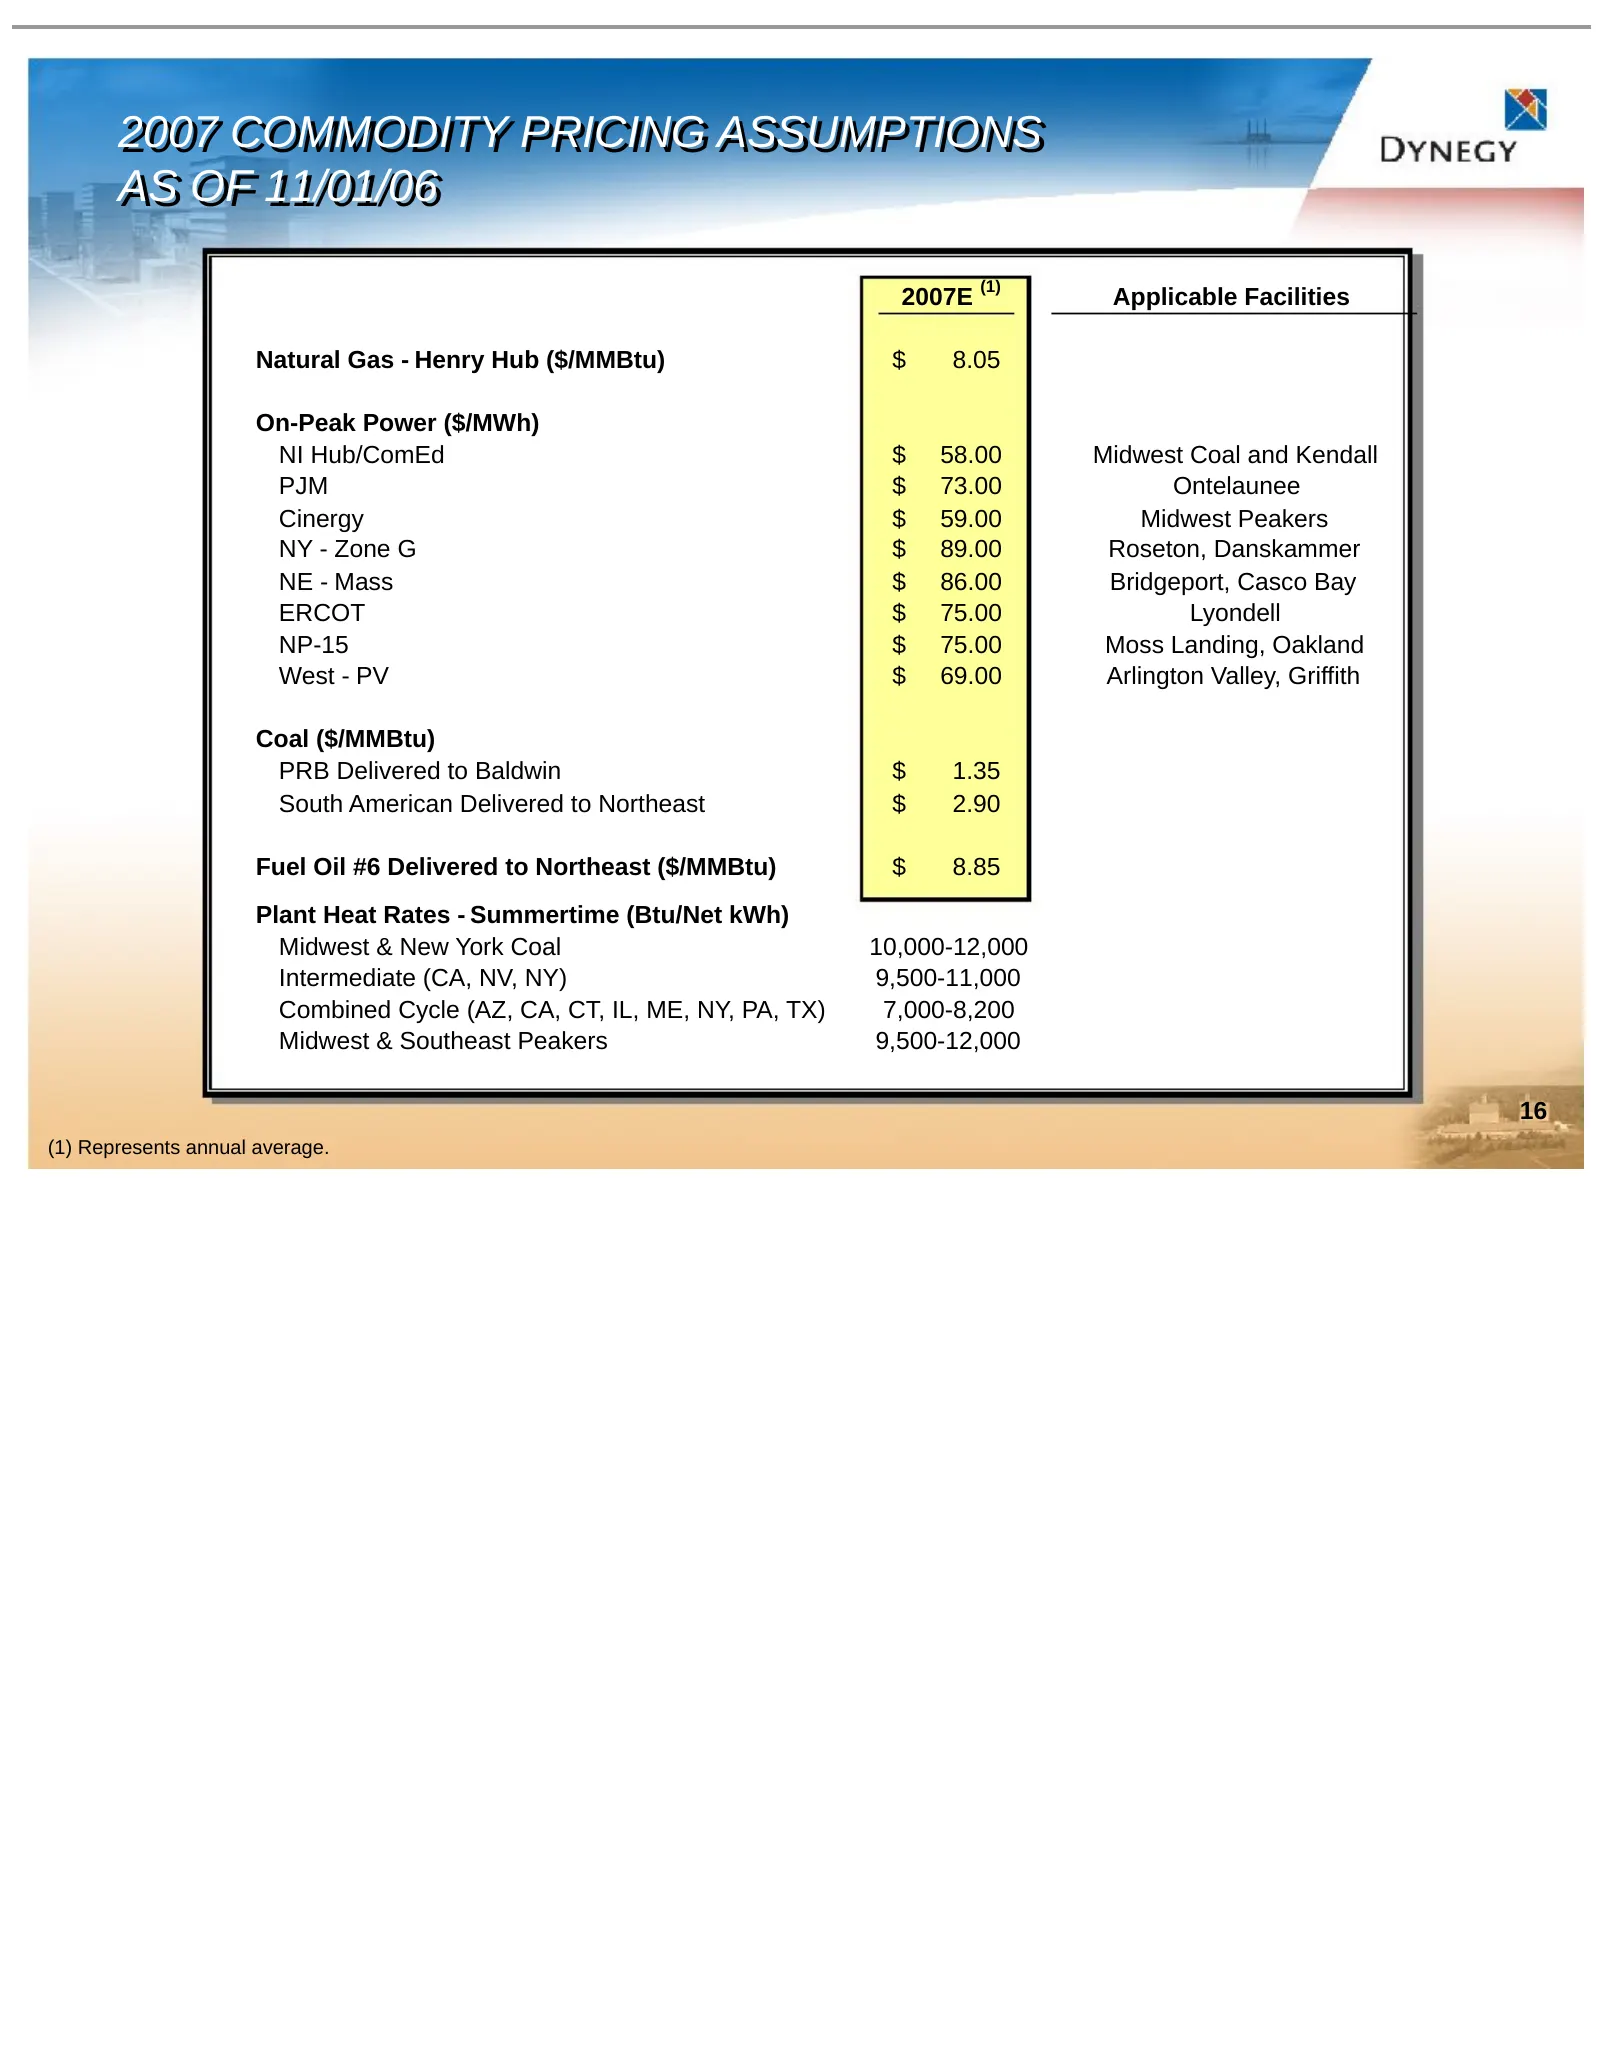
Slide 16: 2007 Commodity Pricing Assumptions
2007 2007 COMMODITY COMMODITY PRICING PRICING ASSUMPTIONS ASSUMPTIONS AS AS OF OF 11/01/06 11/01/06 (1) 2007E Applicable Facilities Natural Gas - Henry Hub ($/MMBtu) $ 8.05 On-Peak Power ($/MWh) NI Hub/ComEd $ 58.00 Midwest Coal and Kendall PJM $ 73.00 Ontelaunee Cinergy $ 59.00 Midwest Peakers NY -
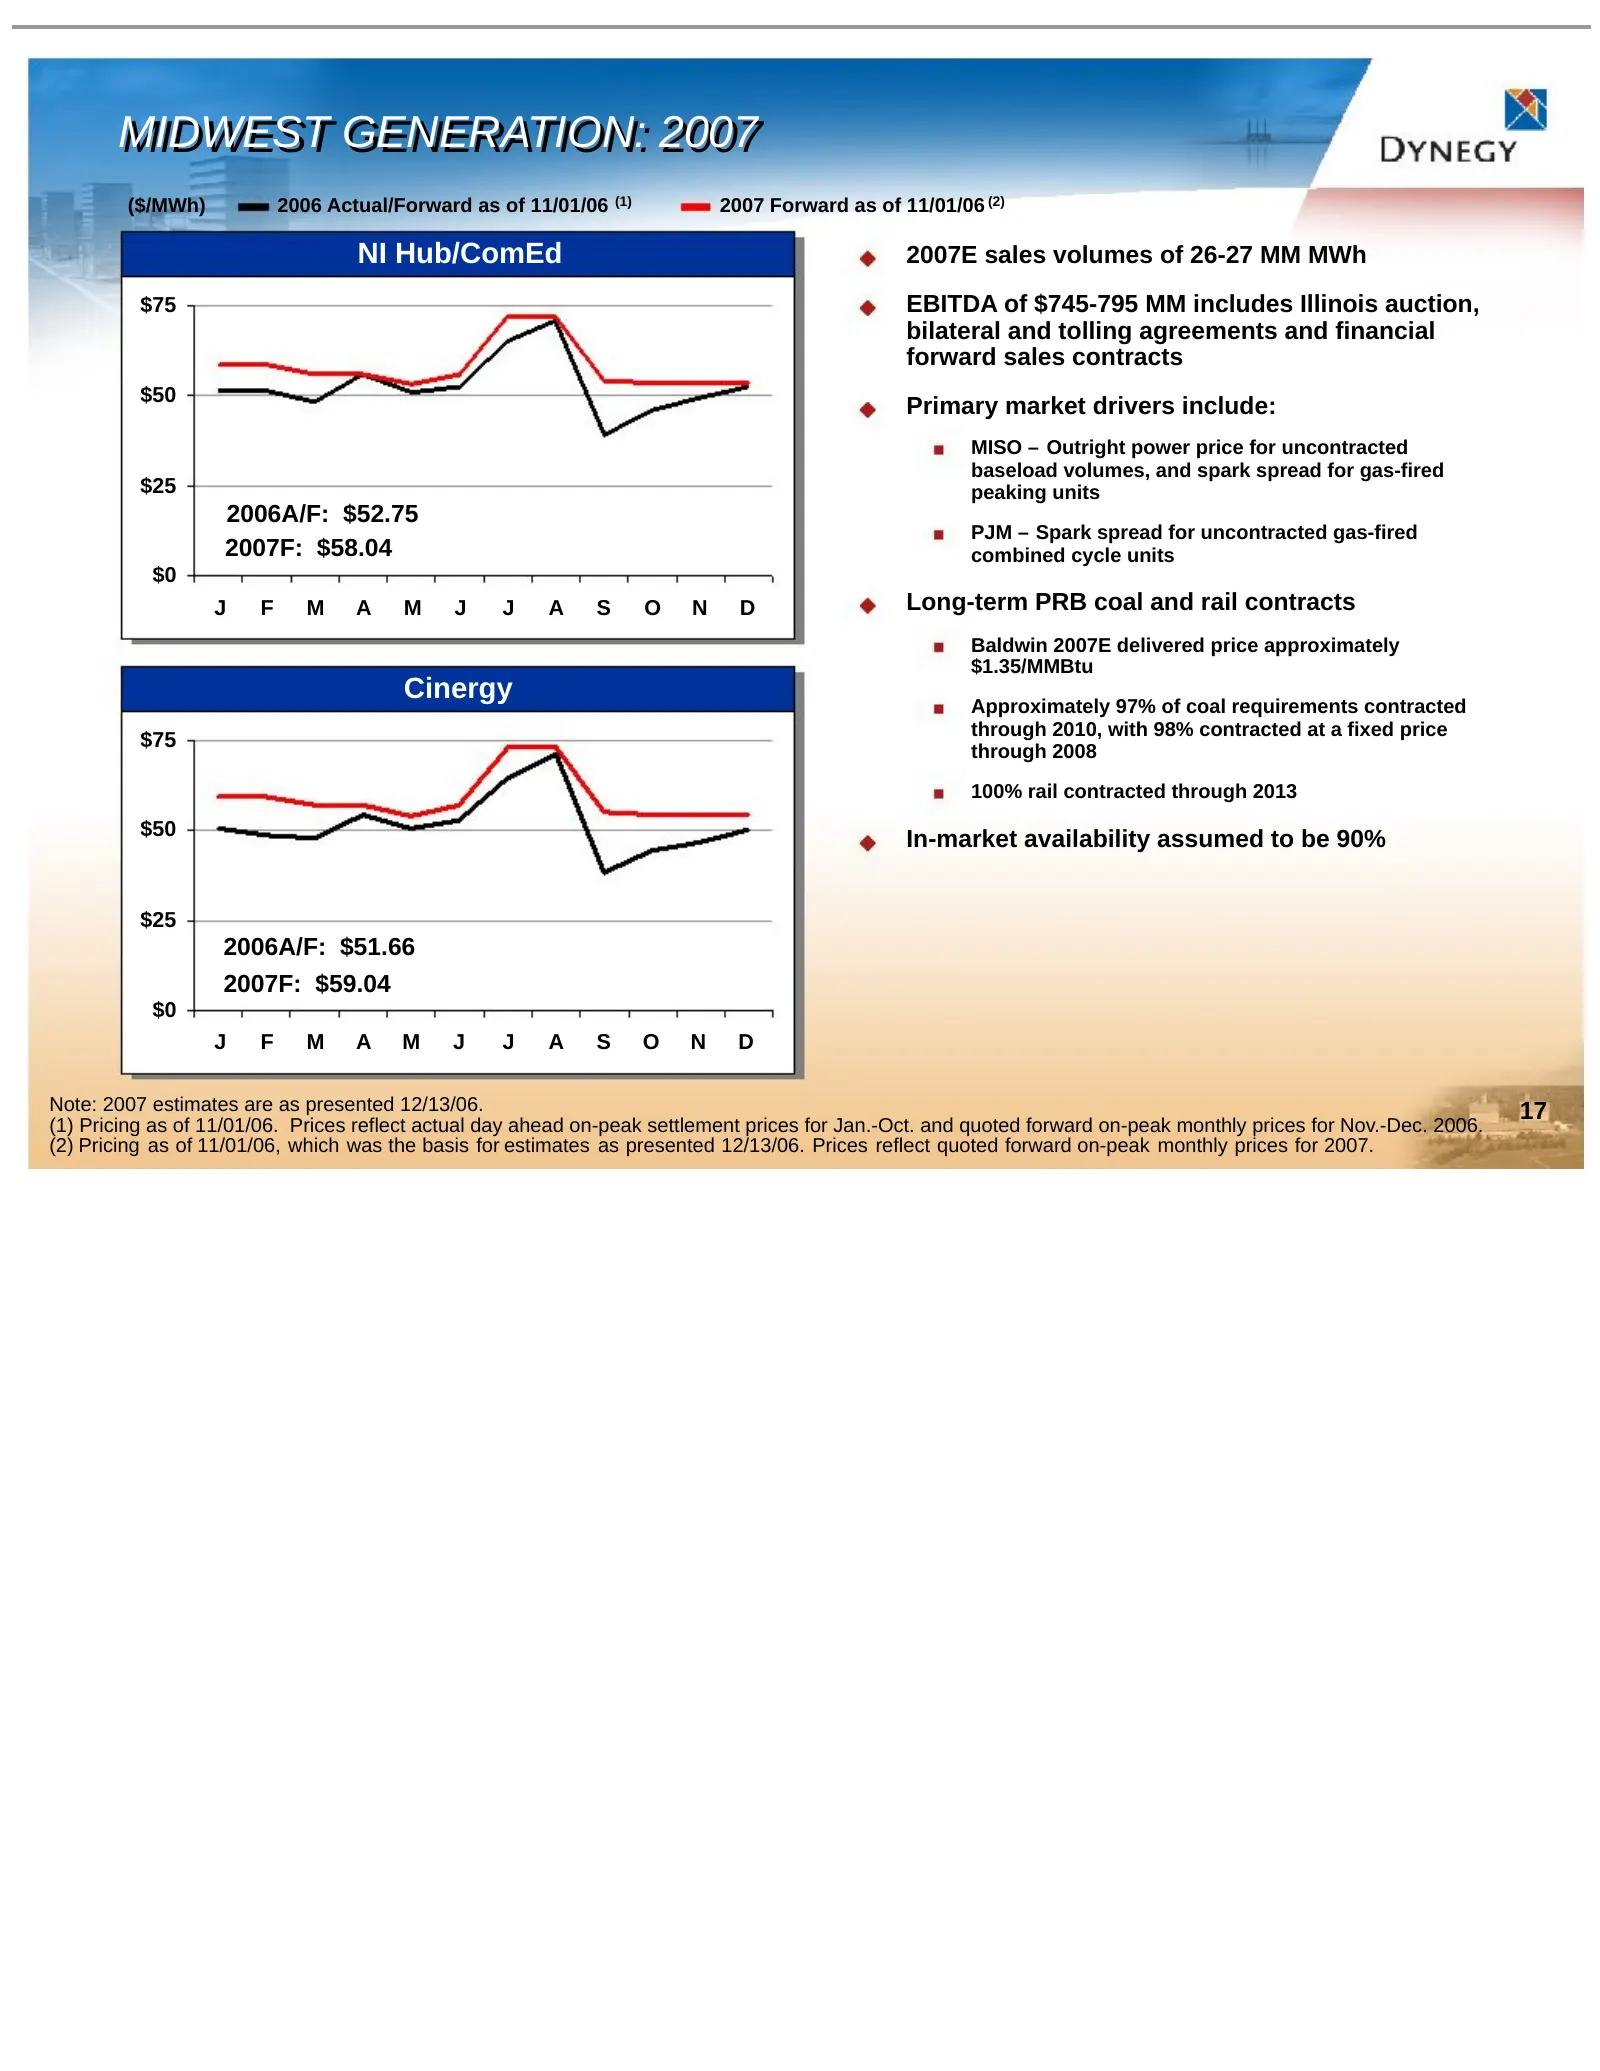
Slide 17: Midwest Generation: 2007
MIDWEST MIDWEST GENERATION: GENERATION: 2007 2007 ($/MWh) 2006 Actual/Forward as of 11/01/06 (1) 2007 Forward as of 11/01/06 (2) NI Hub/ComEd 2007E sales volumes of 26-27 MM MWh $75 EBITDA of $745-795 MM includes Illinois auction, bilateral and tolling agreements and financial forward sales contract
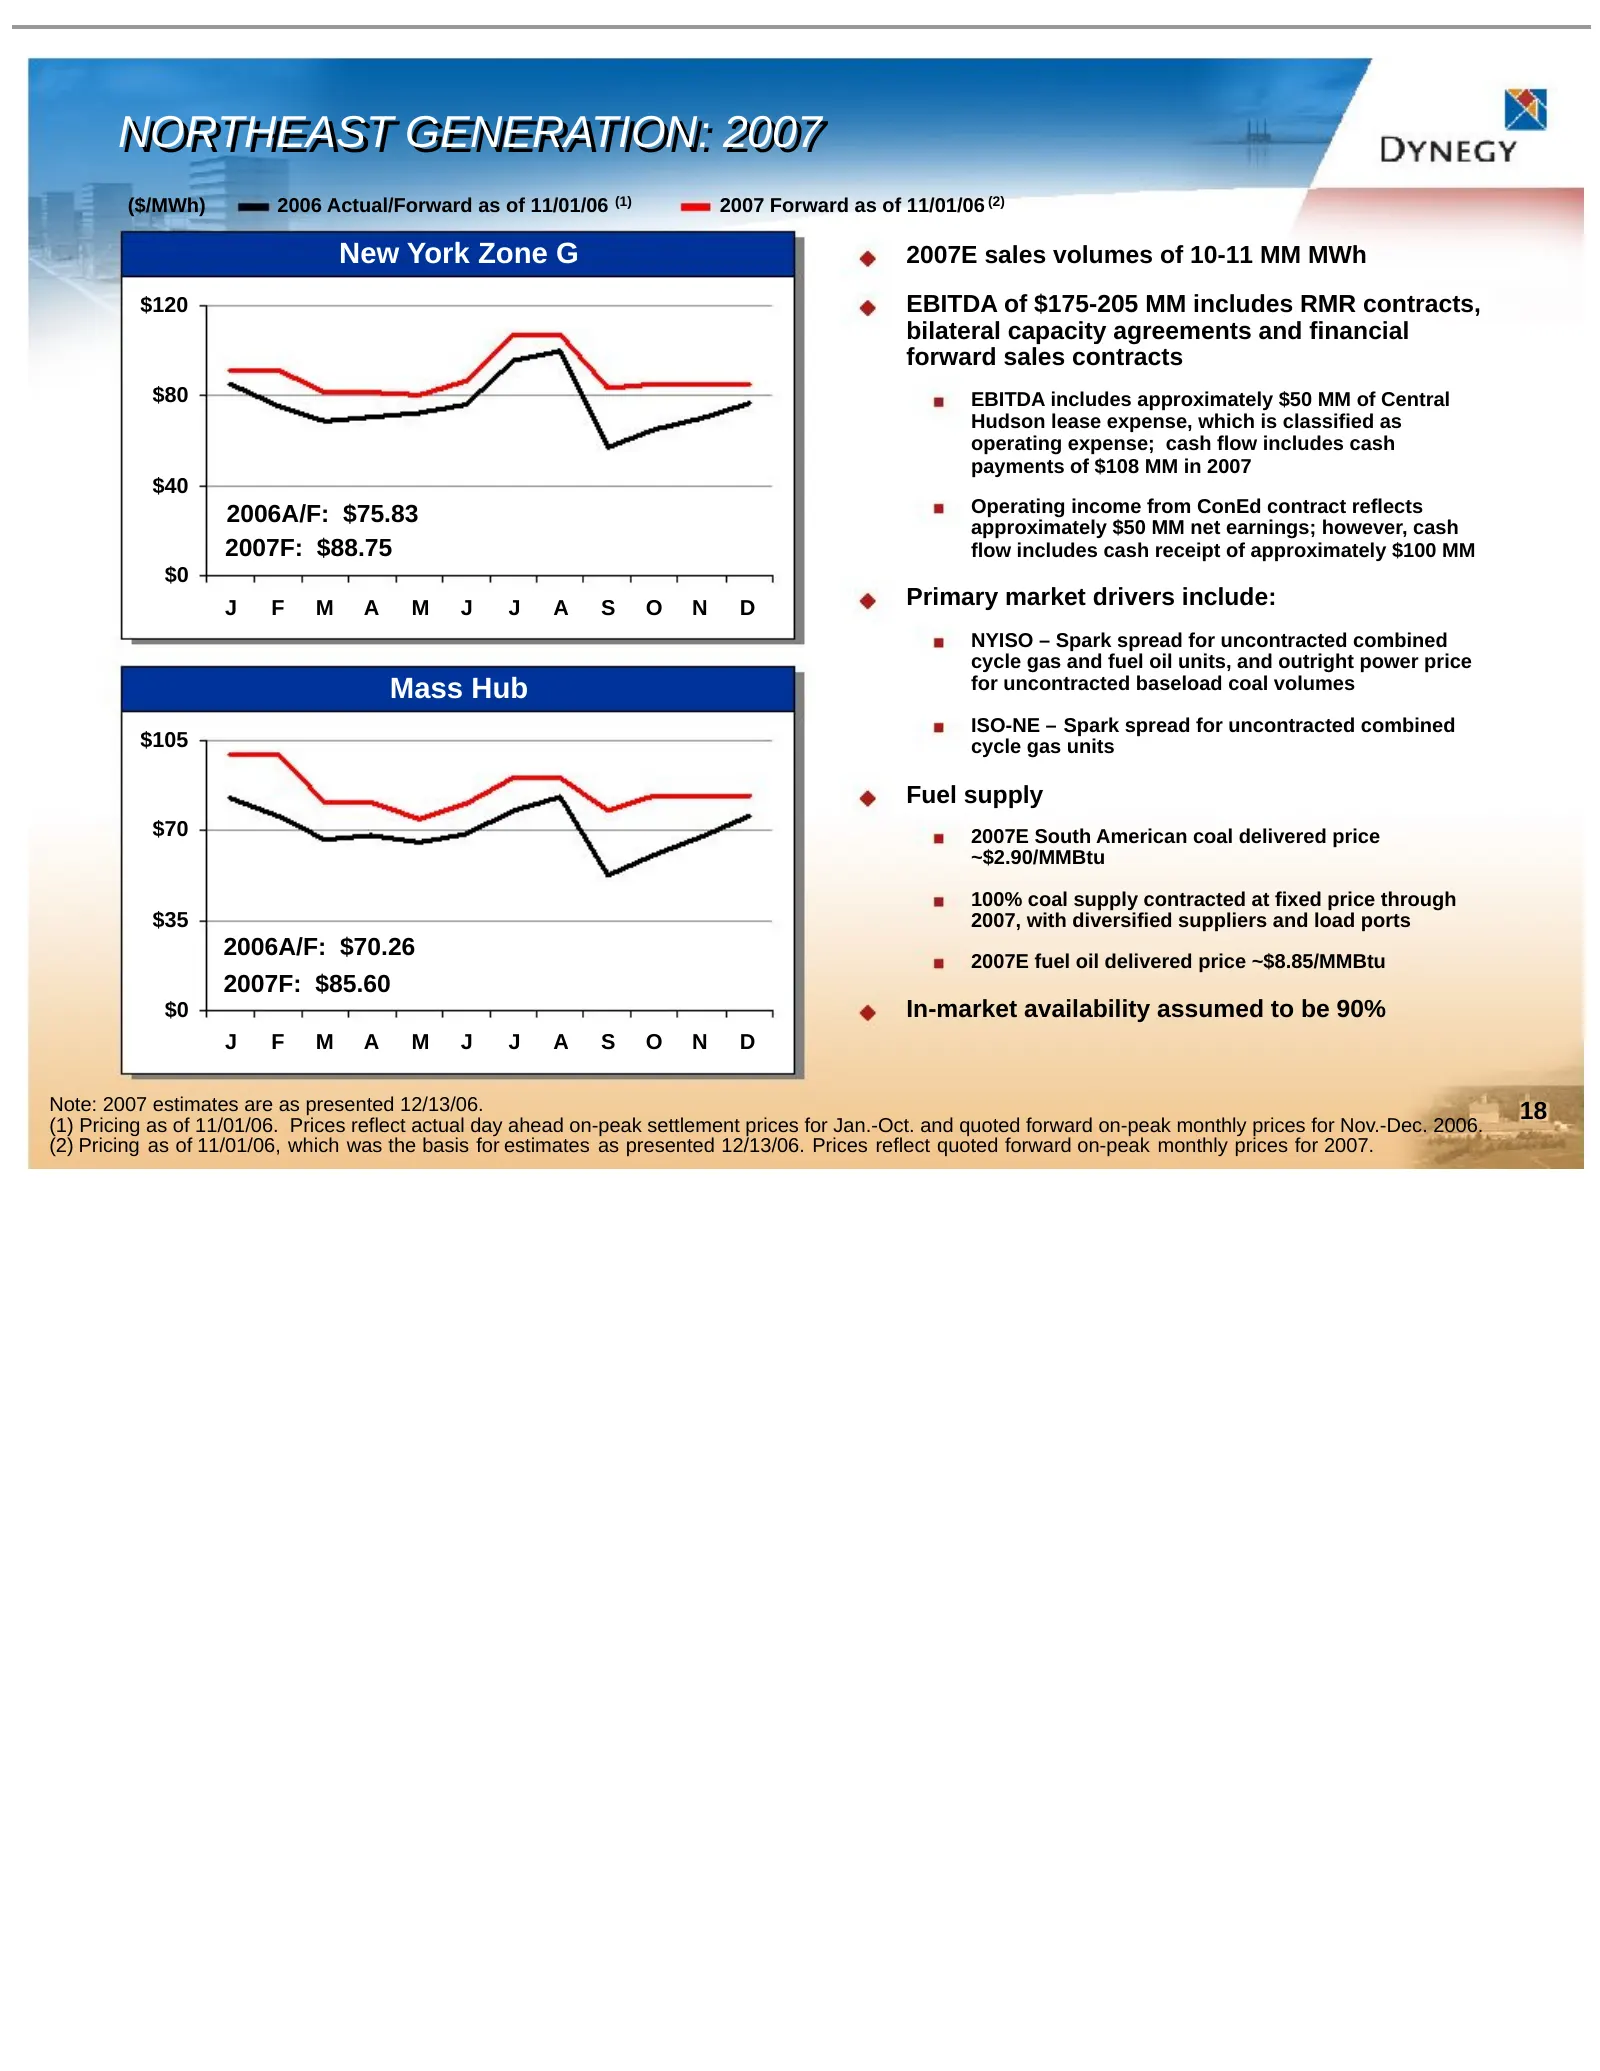
Slide 18: Northeast Generation: 2007
NORTHEAST NORTHEAST GENERATION: GENERATION: 2007 2007 ($/MWh) 2006 Actual/Forward as of 11/01/06 (1) 2007 Forward as of 11/01/06 (2) New York Zone G 2007E sales volumes of 10-11 MM MWh $120 EBITDA of $175-205 MM includes RMR contracts, bilateral capacity agreements and financial forward sales contra
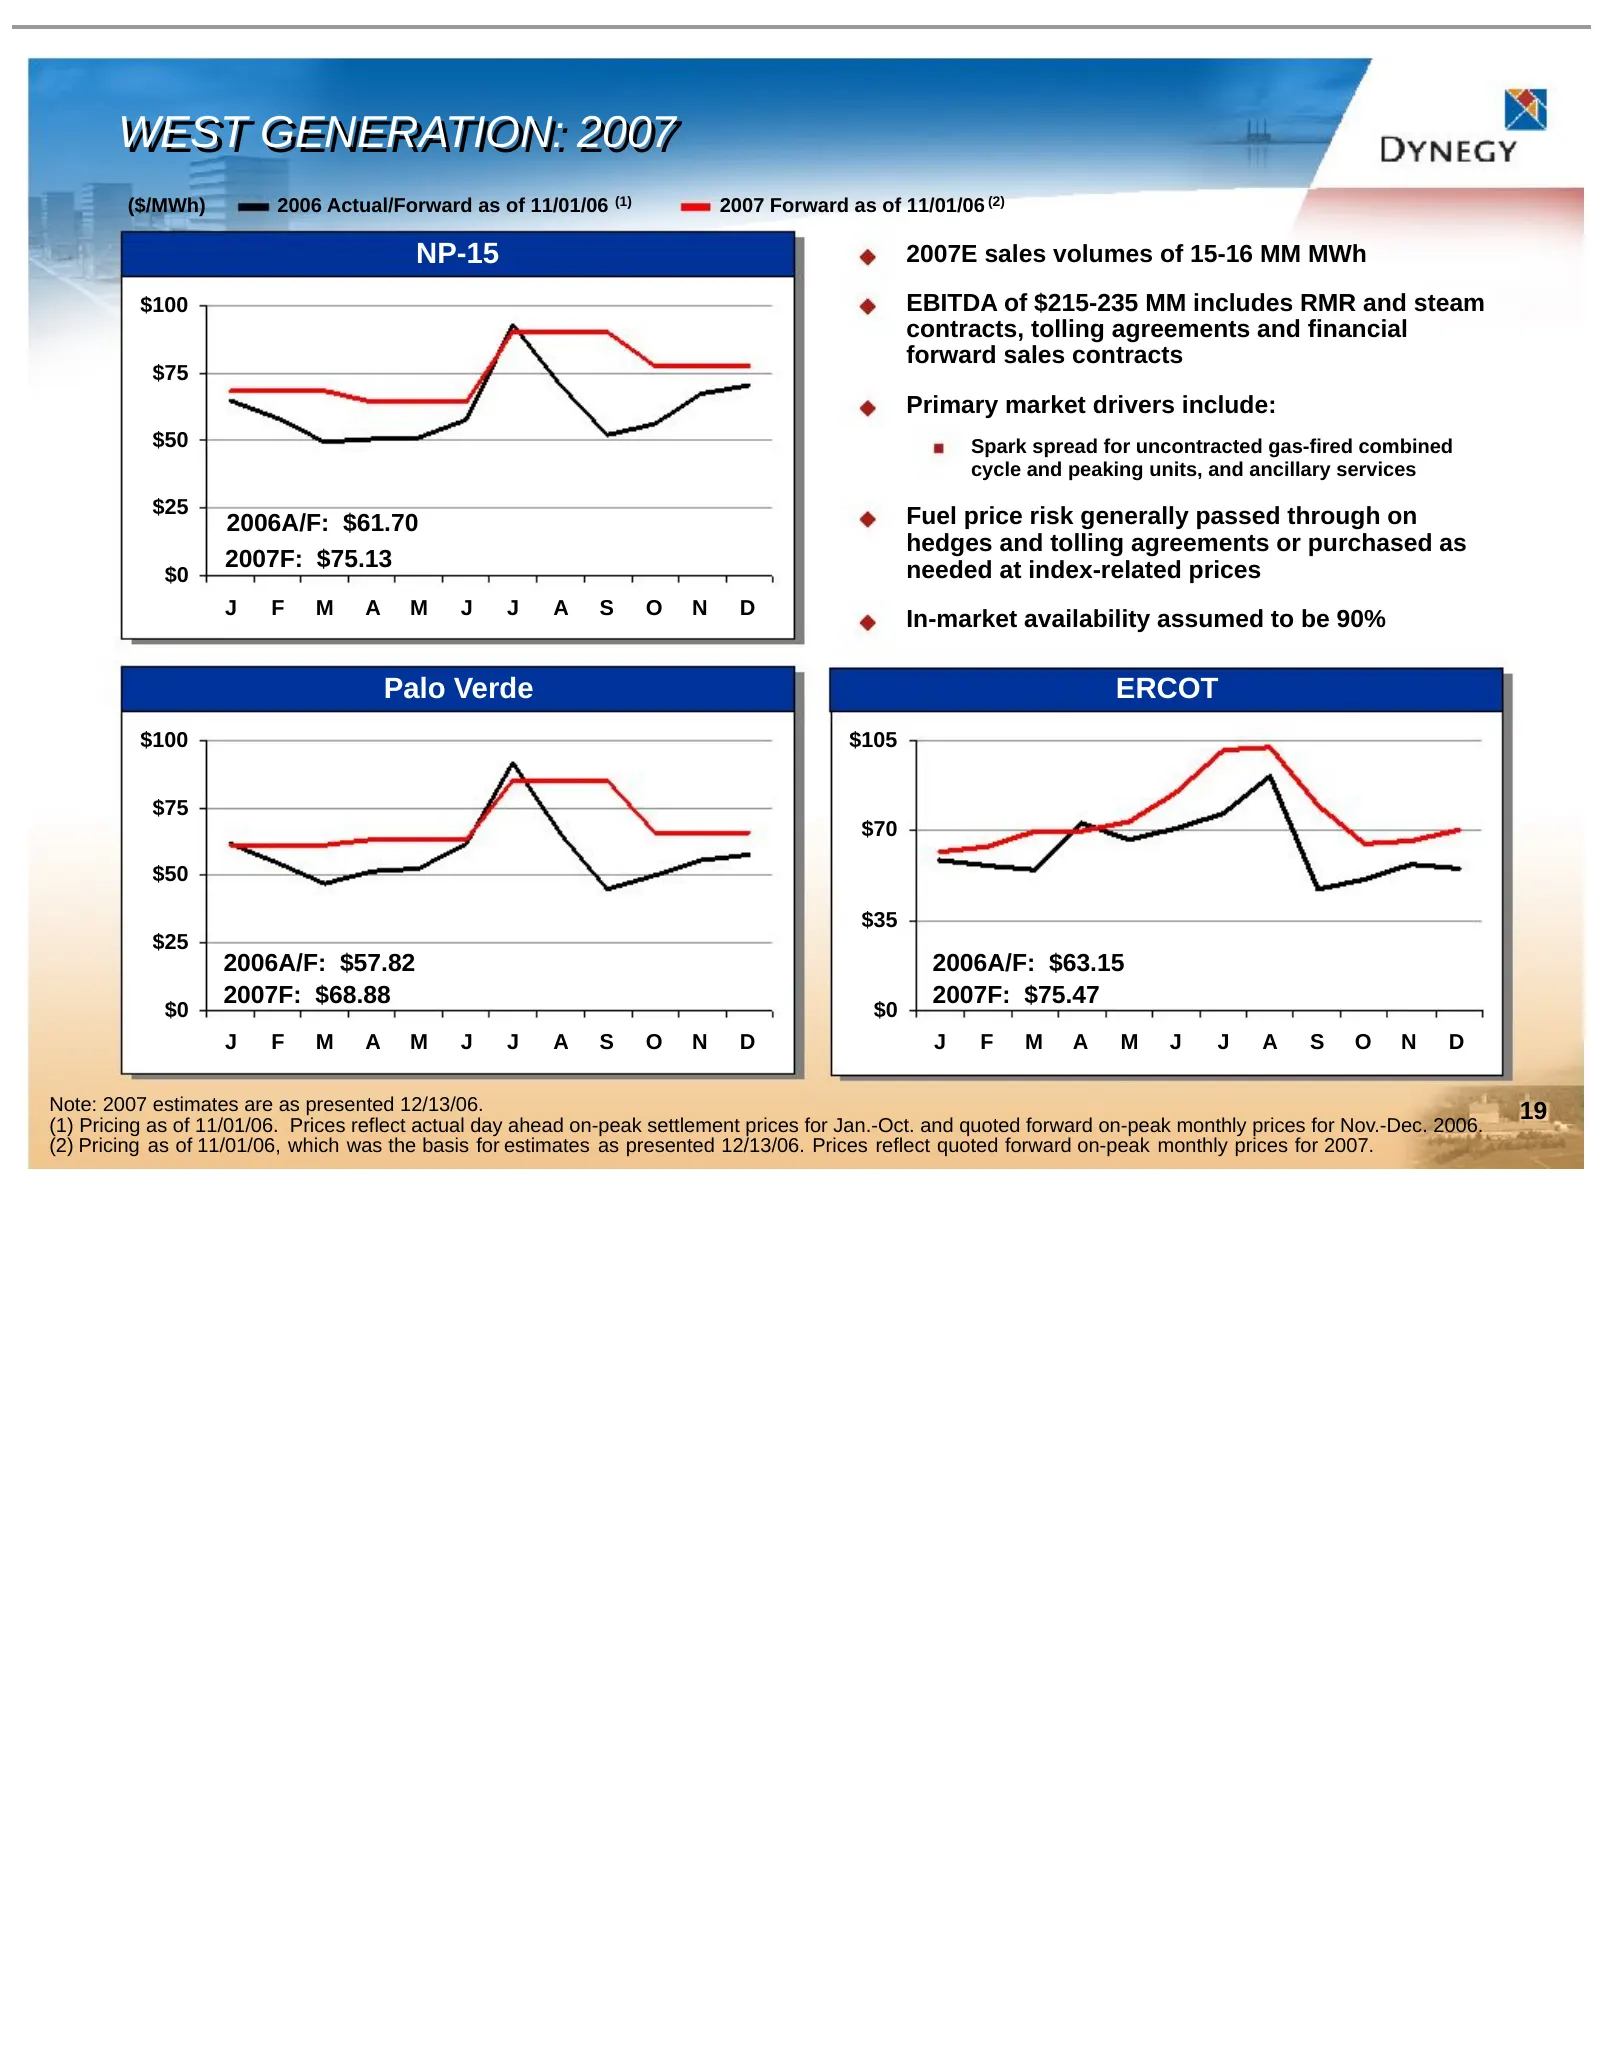
Slide 19: West Generation: 2007
WEST WEST GENERATION: GENERATION: 2007 2007 ($/MWh) 2006 Actual/Forward as of 11/01/06 (1) 2007 Forward as of 11/01/06 (2) NP-15 2007E sales volumes of 15-16 MM MWh $100 EBITDA of $215-235 MM includes RMR and steam contracts, tolling agreements and financial forward sales contracts $75 Primary marke
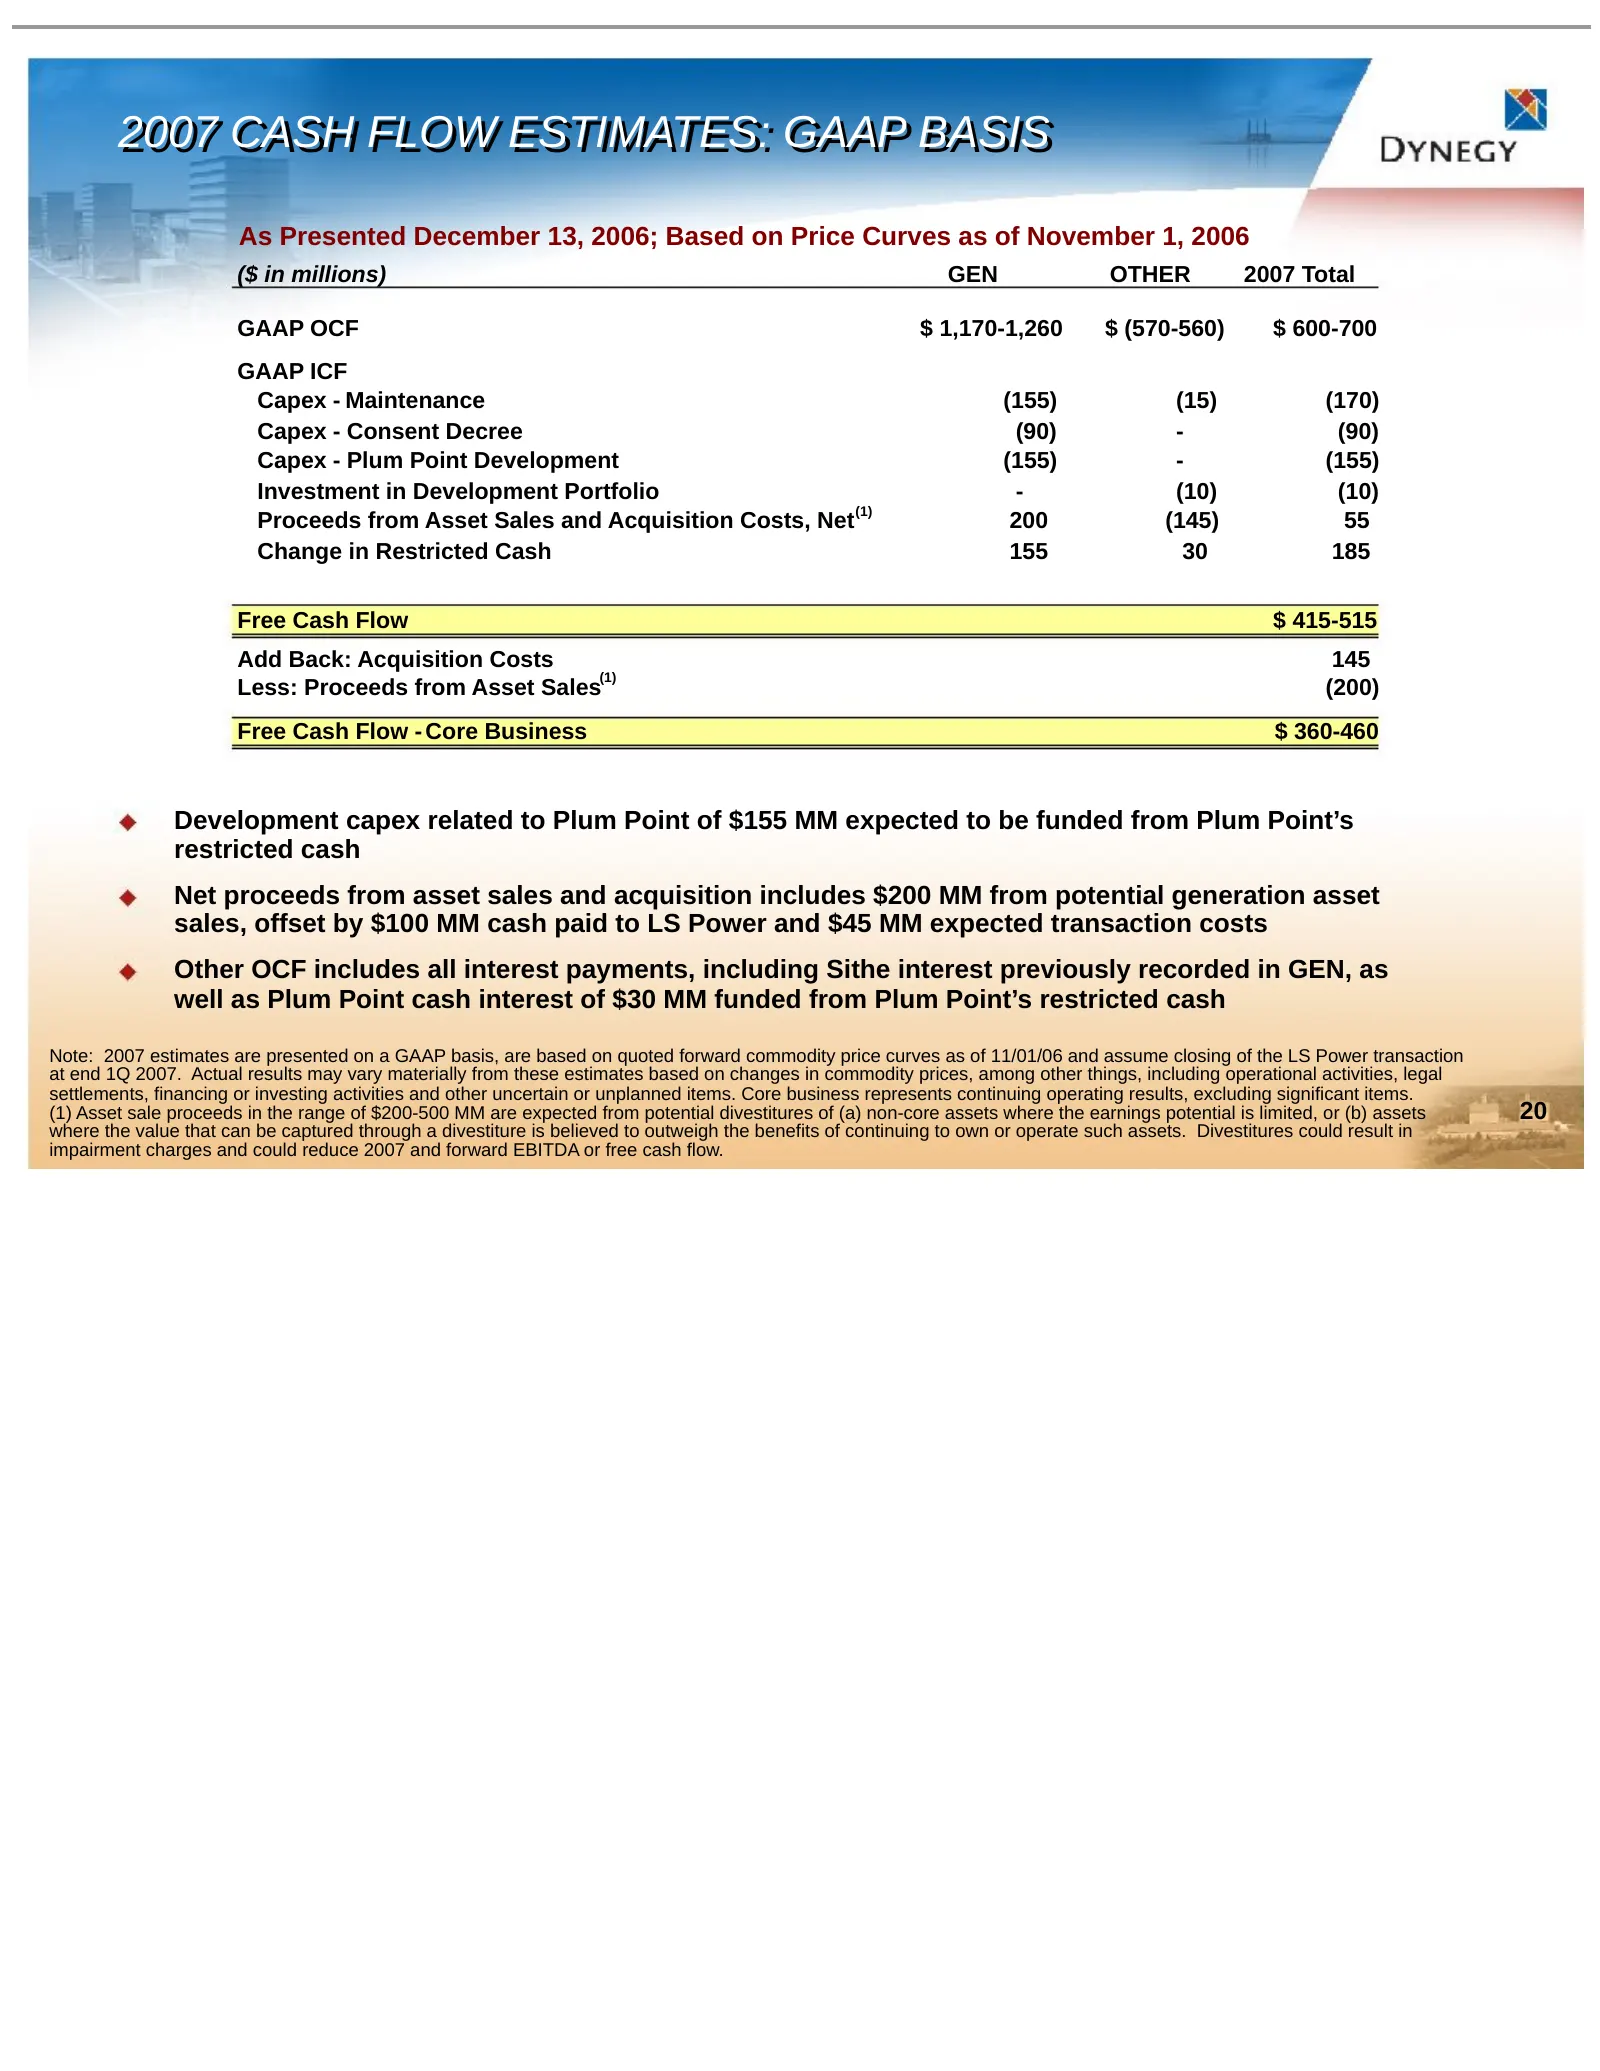
Slide 20: 2007 Cash Flow Estimates: GAAP Basis
2007 2007 CASH CASH FLOW FLOW ESTIMATES: ESTIMATES: GAAP GAAP BASIS BASIS As Presented December 13, 2006; Based on Price Curves as of November 1, 2006 ($ in millions) GEN OTHER 2007 Total GAAP OCF $ 1,170-1,260 $ (570-560) $ 600-700 GAAP ICF Capex - Maintenance (155) (15) (170) Capex - Consent Decre
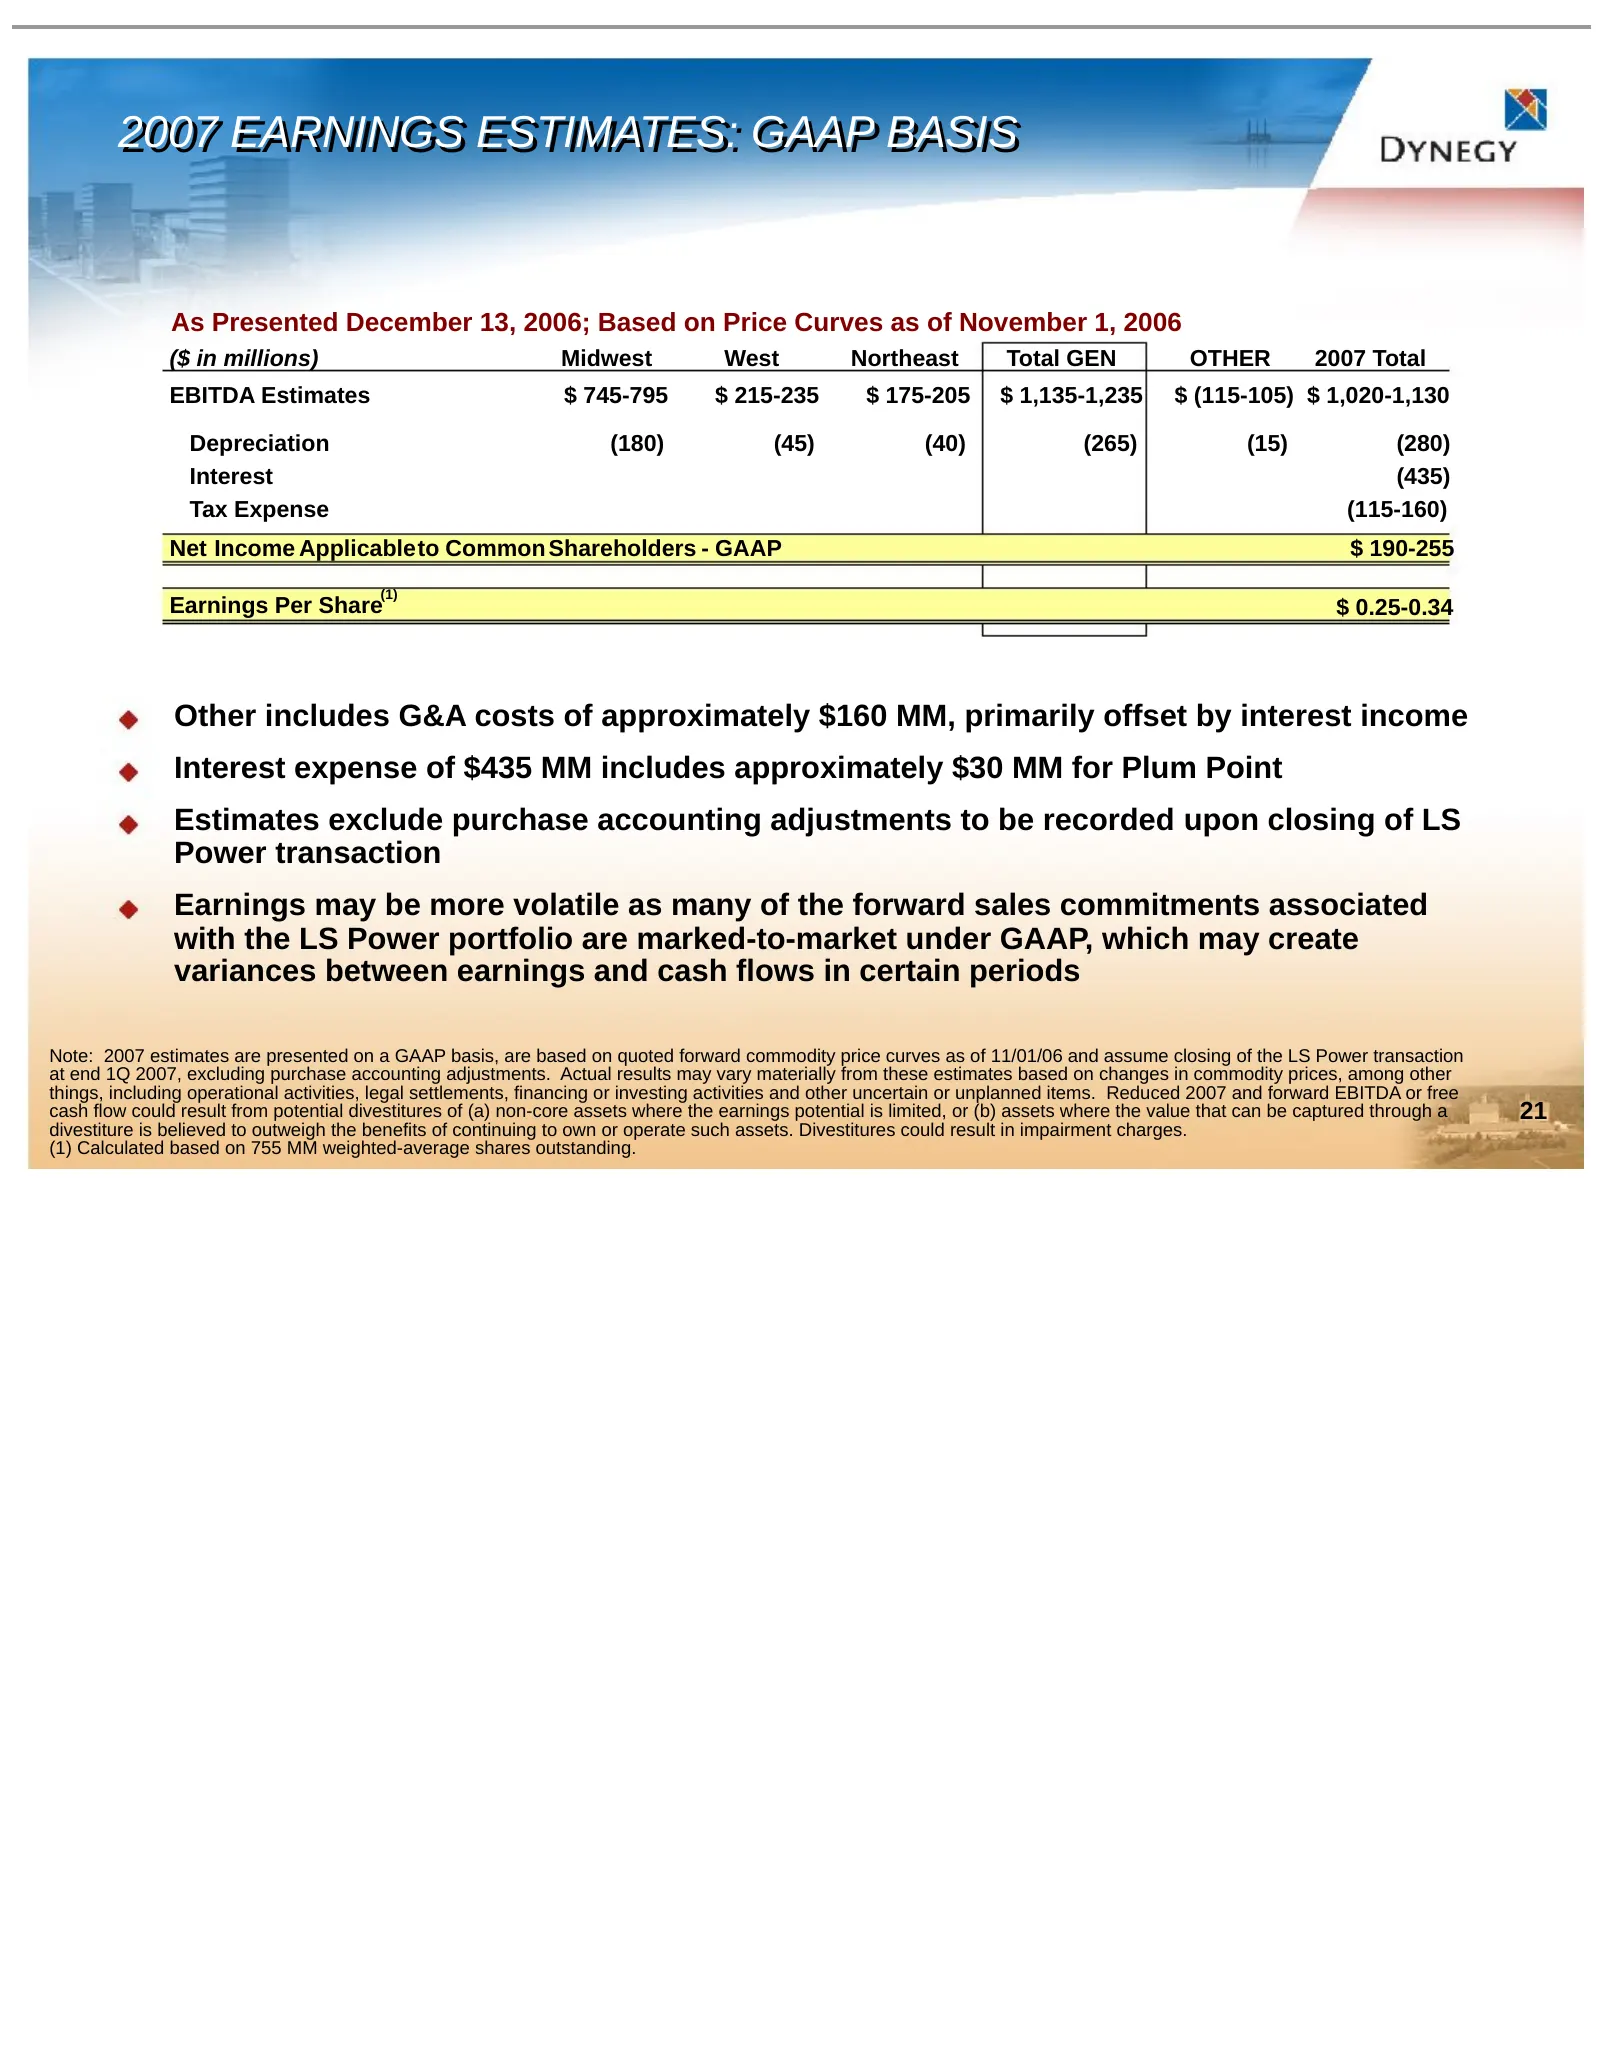
Slide 21: 2007 Earnings Estimates: GAAP Basis
2007 2007 EARNINGS EARNINGS ESTIMATES: ESTIMATES: GAAP GAAP BASIS BASIS As Presented December 13, 2006; Based on Price Curves as of November 1, 2006 ($ in millions) Midwest West Northeast Total GEN OTHER 2007 Total EBITDA Estimates $ 745-795 $ 215-235 $ 175-205 $ 1,135-1,235 $ (115-105) $ 1,020-1,13
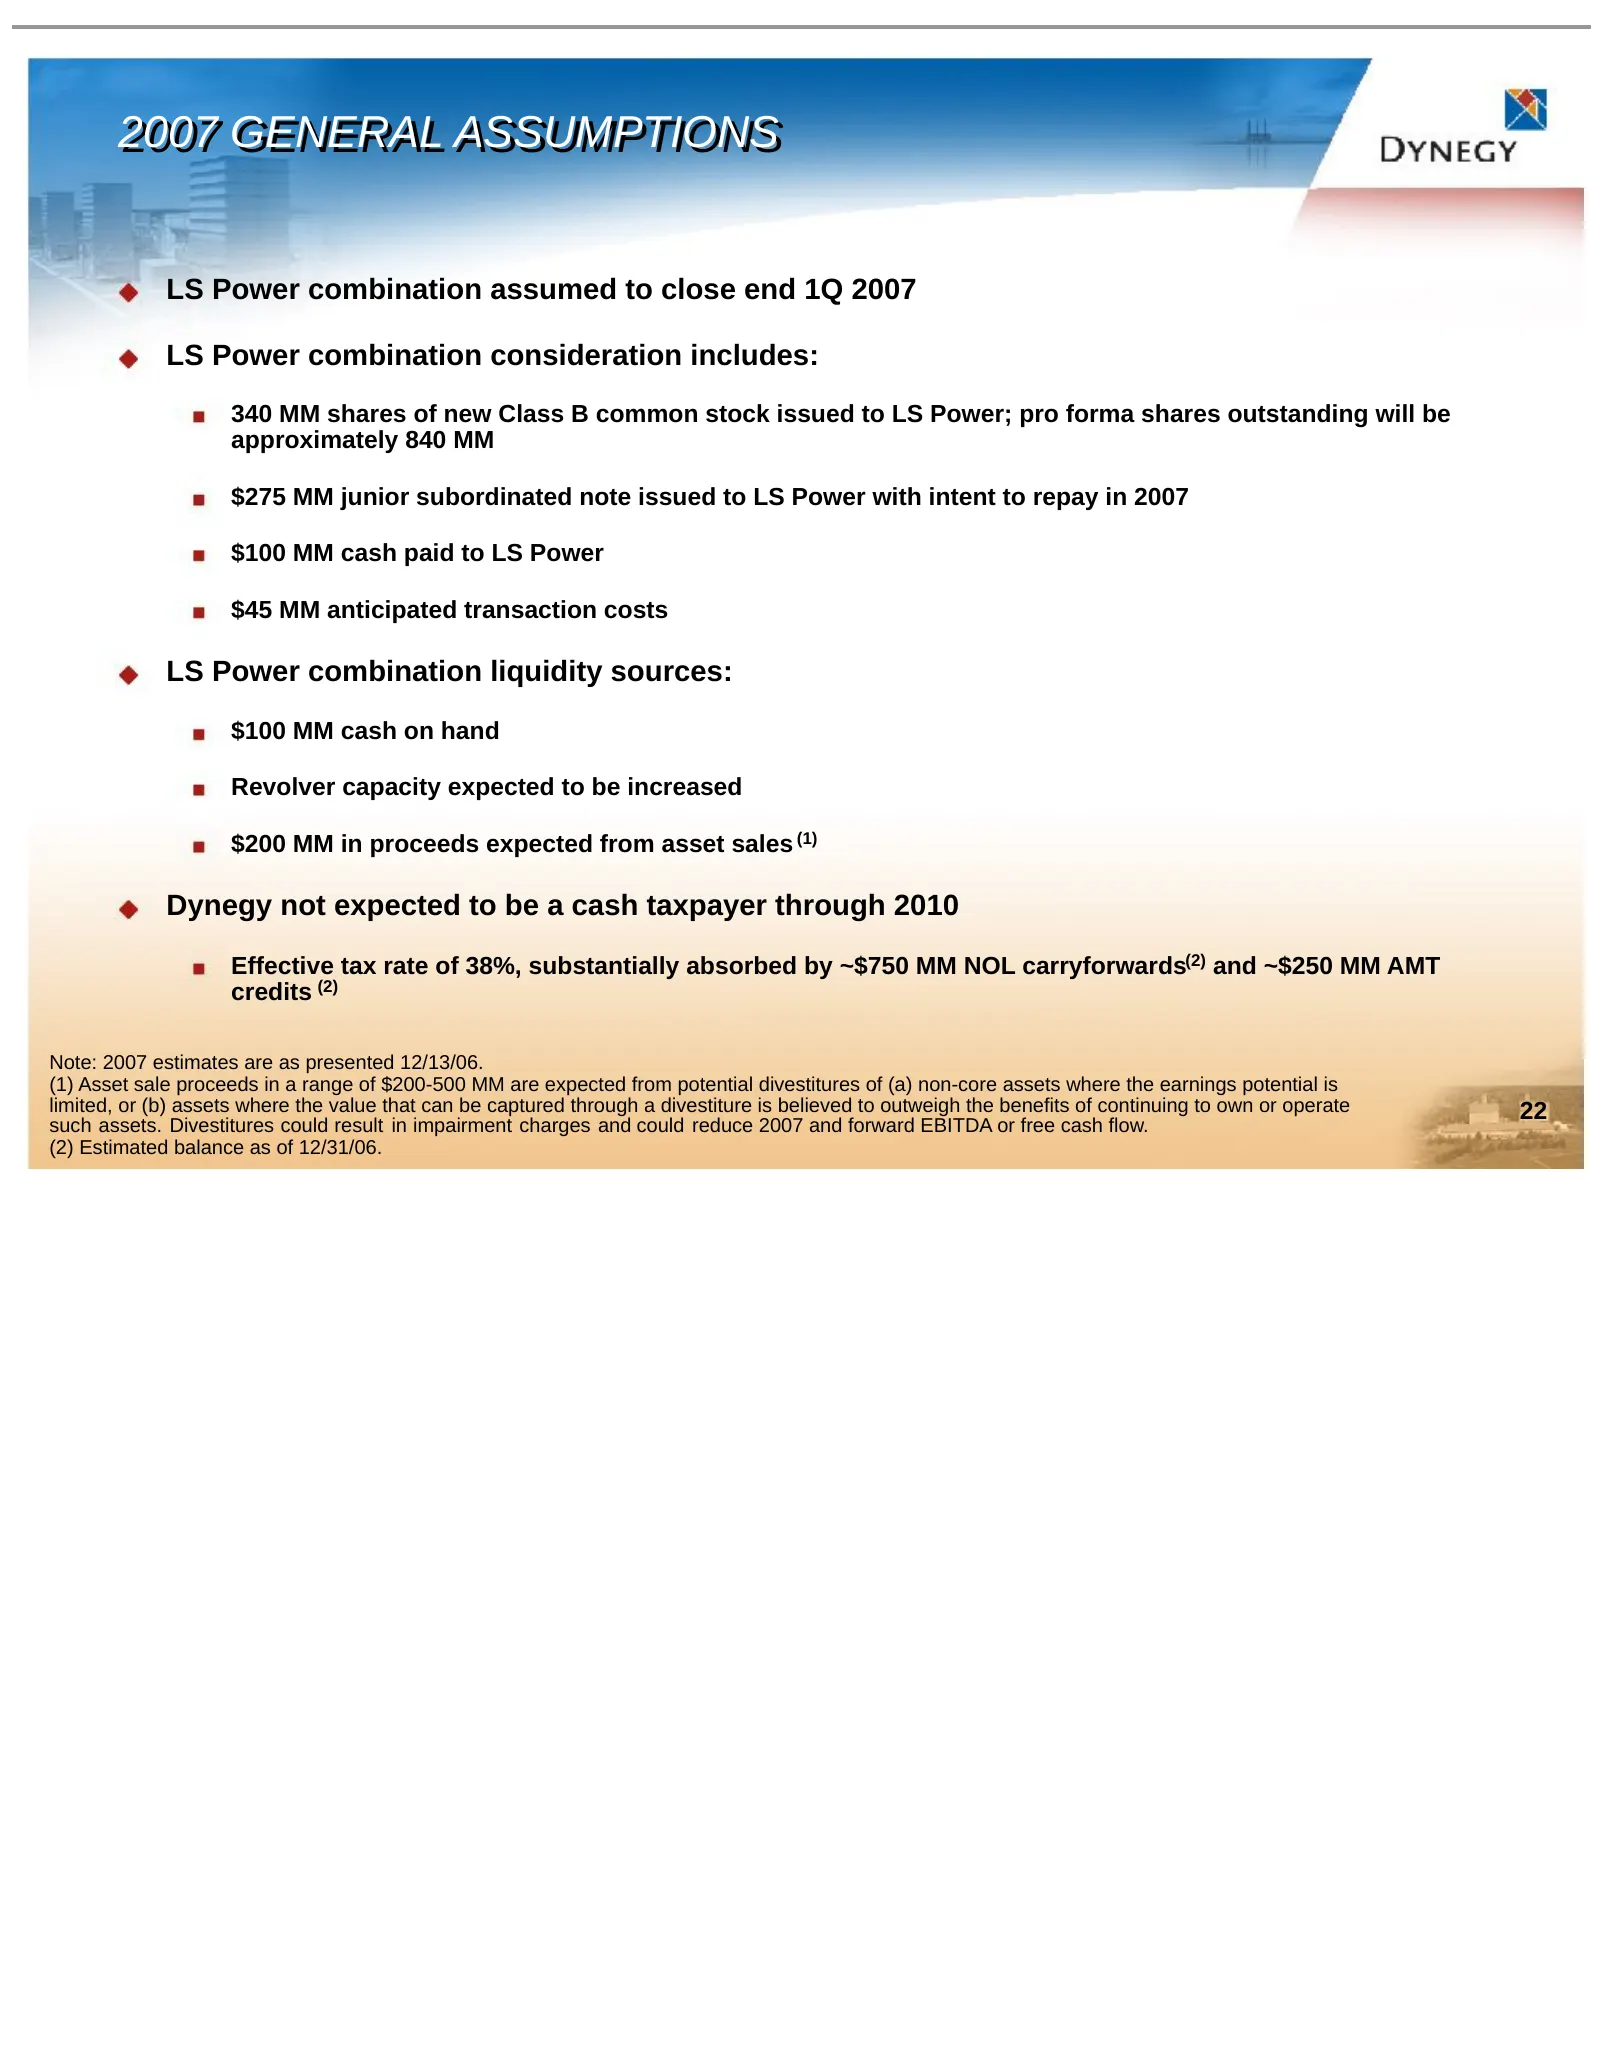
Slide 22: 2007 General Assumptions
2007 2007 GENERAL GENERAL ASSUMPTIONS ASSUMPTIONS LS Power combination assumed to close end 1Q 2007 LS Power combination consideration includes: 340 MM shares of new Class B common stock issued to LS Power; pro forma shares outstanding will be approximately 840 MM $275 MM junior subordinated note is
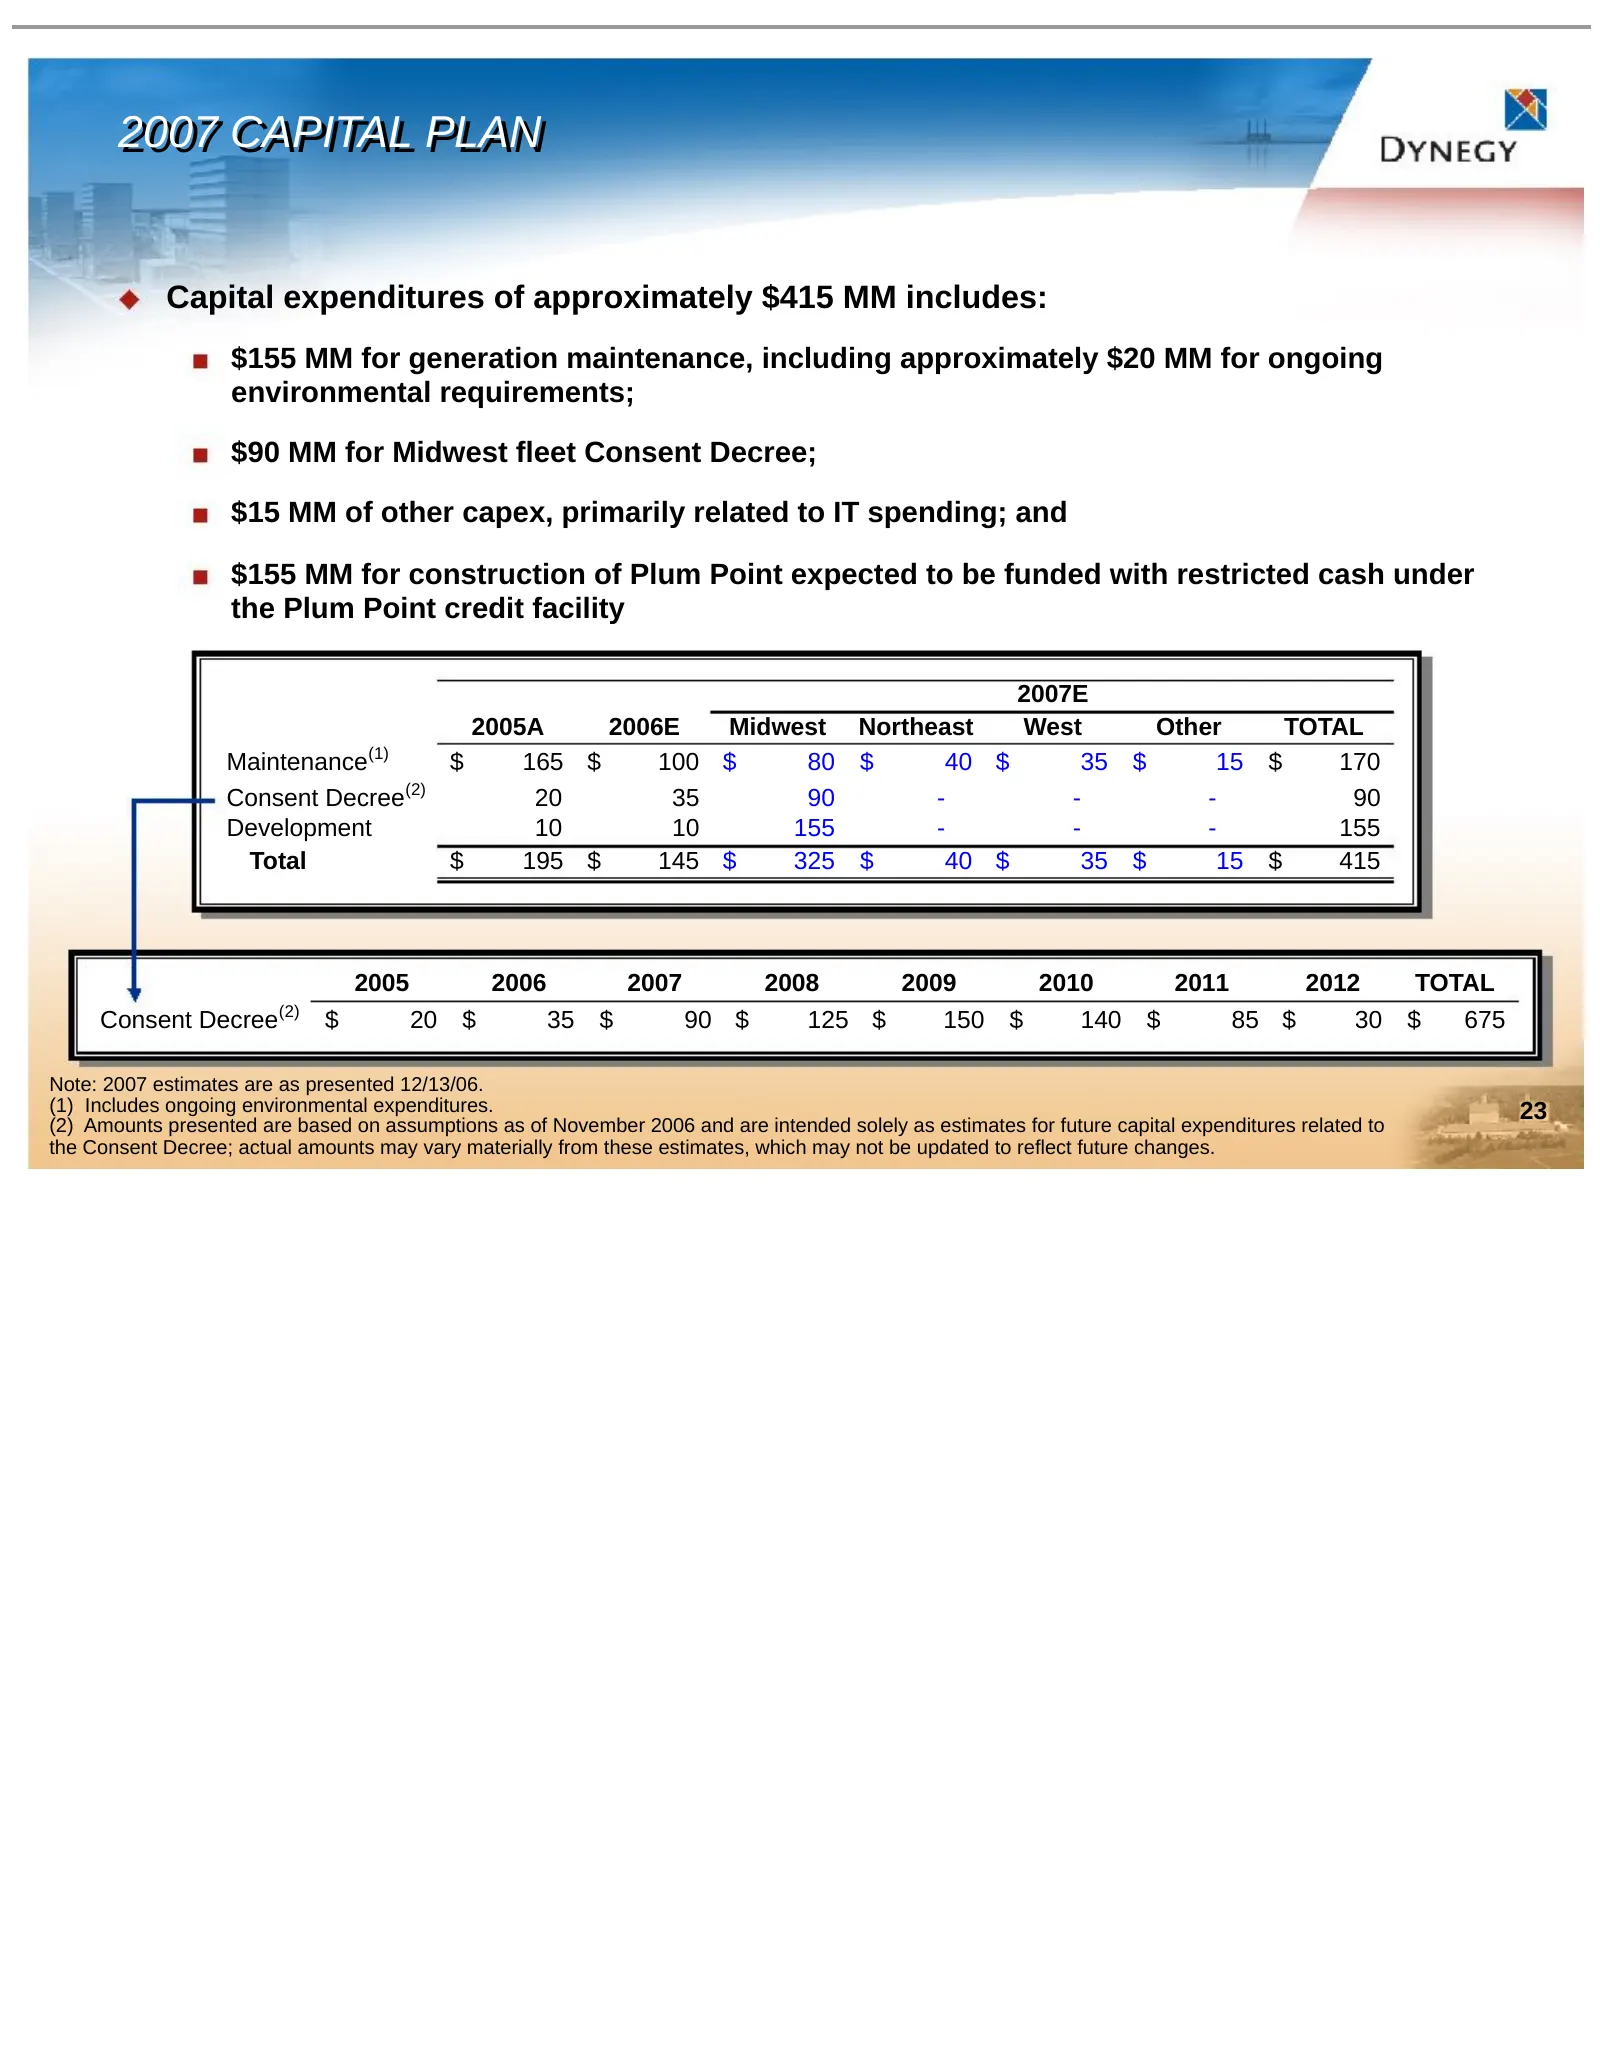
Slide 23: 2007 Capital Plan
2007 2007 CAPITAL CAPITAL PLAN PLAN Capital expenditures of approximately $415 MM includes: $155 MM for generation maintenance, including approximately $20 MM for ongoing environmental requirements; $90 MM for Midwest fleet Consent Decree; $15 MM of other capex, primarily related to IT spending; and
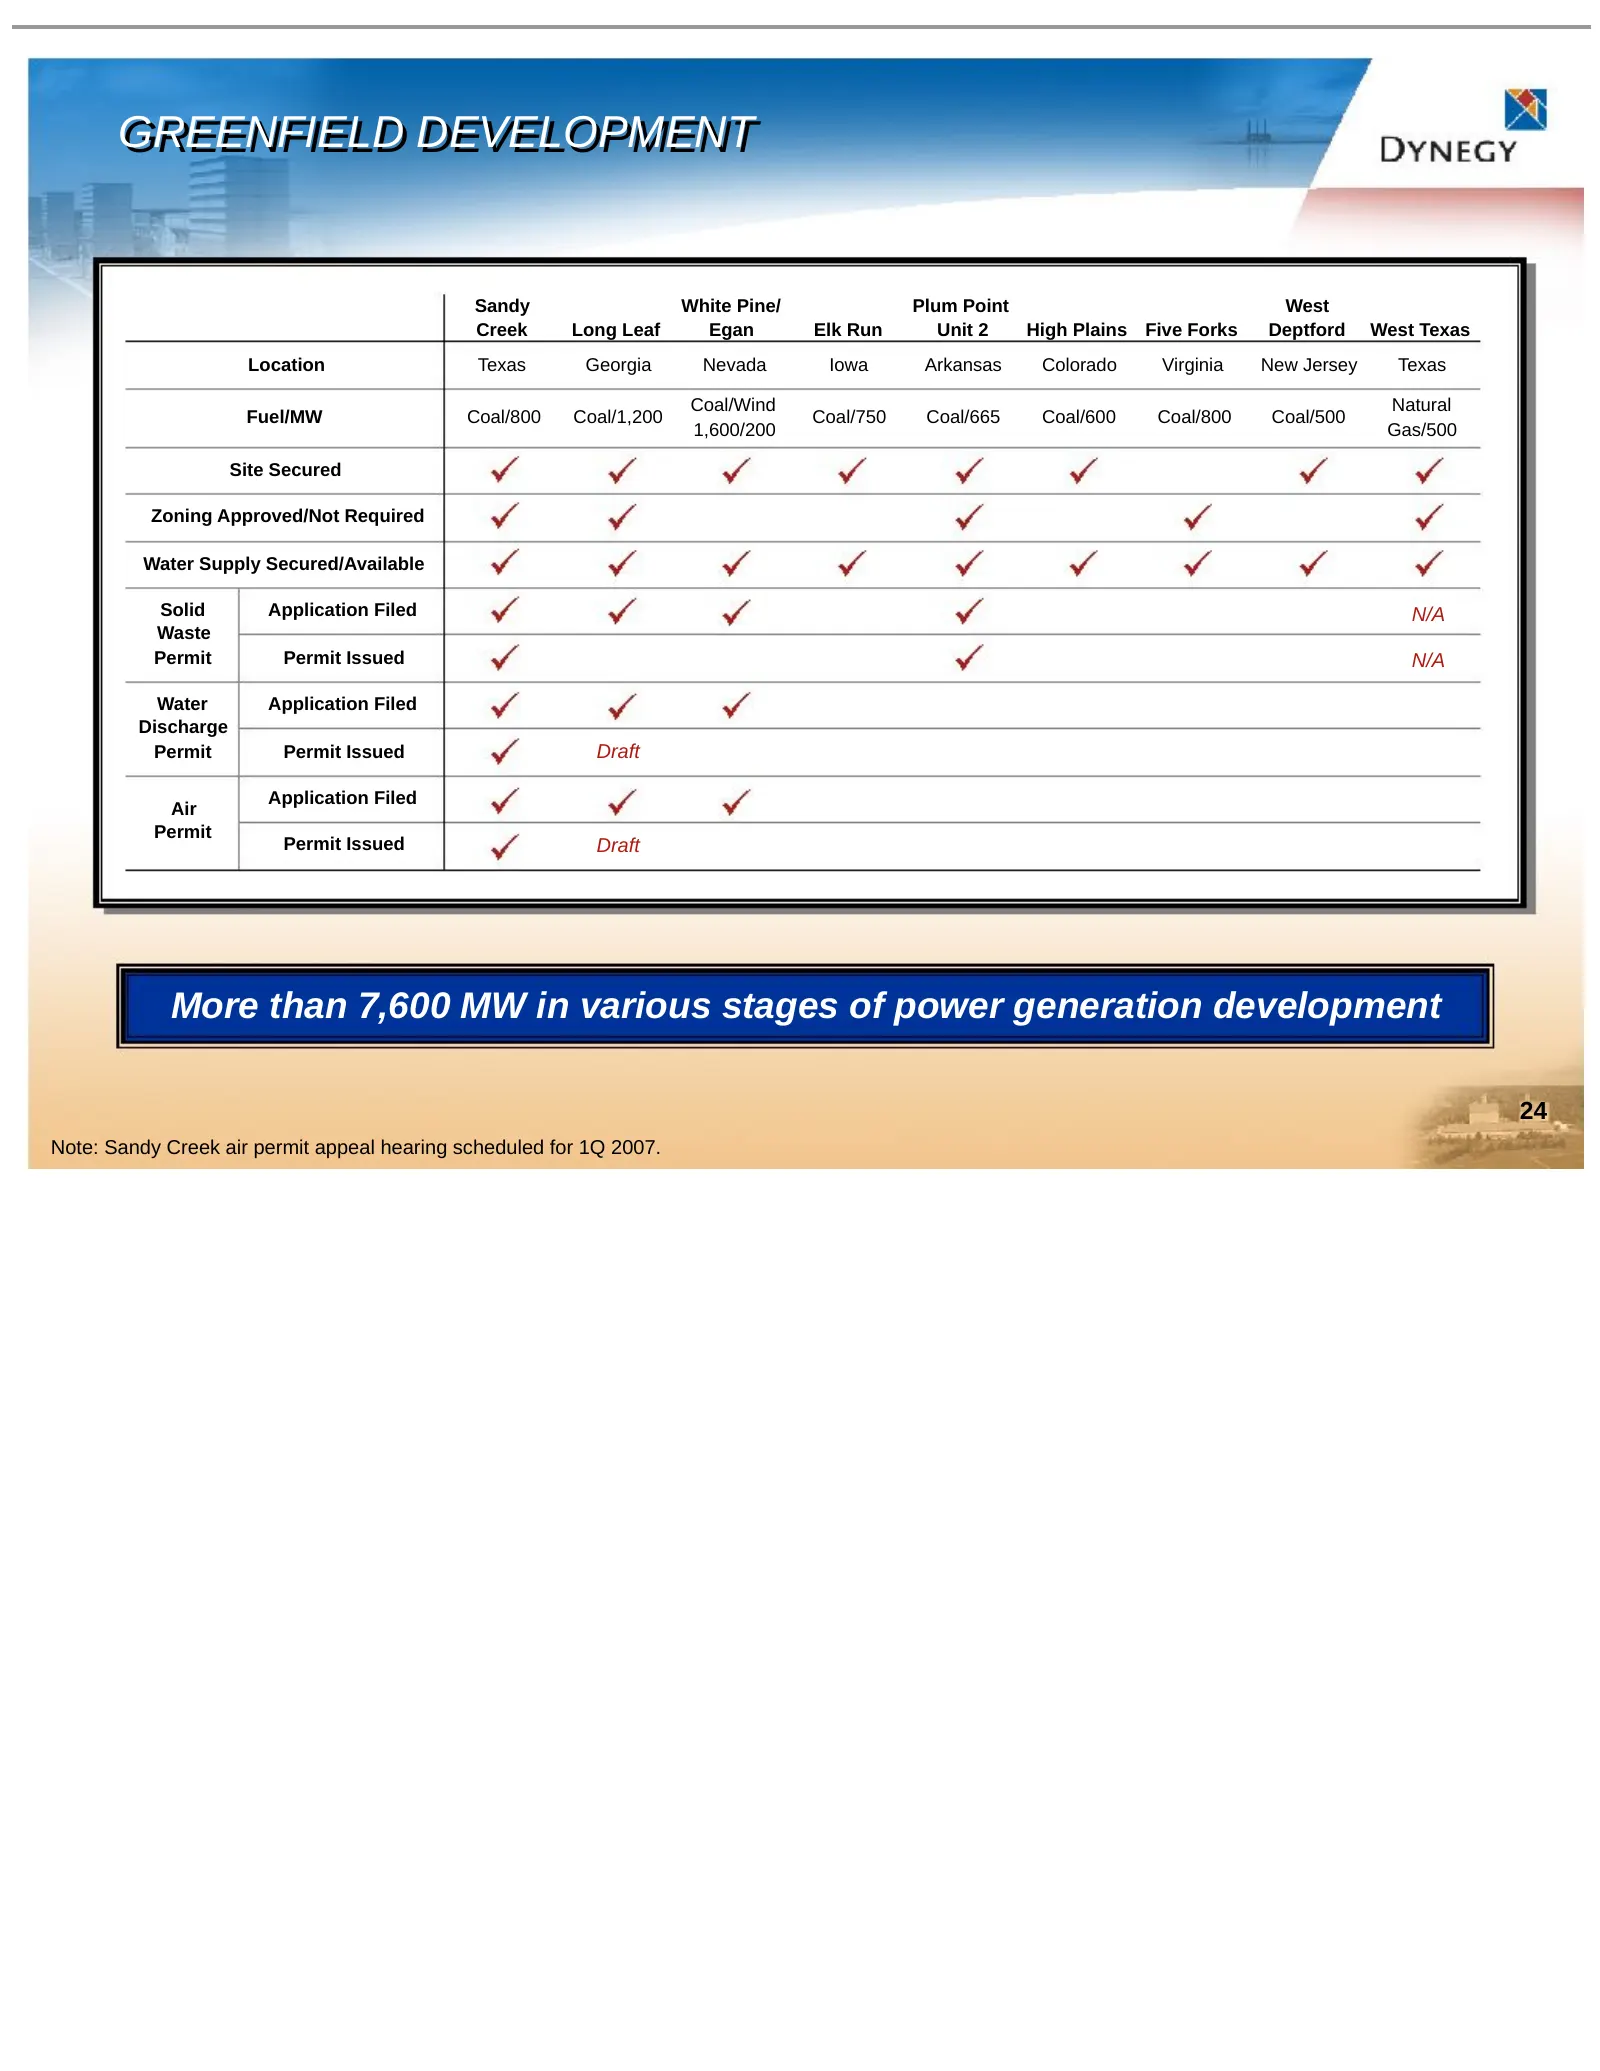
Slide 24: Greenfield Development
GREENFIELD GREENFIELD DEVELOPMENT DEVELOPMENT Sandy White Pine/ Plum Point West Creek Long Leaf Egan Elk Run Unit 2 High Plains Five Forks Deptford West Texas Location Texas Georgia Nevada Iowa Arkansas Colorado Virginia New Jersey Texas Coal/Wind Natural Fuel/MW Coal/800 Coal/1,200 Coal/750 Coal/66
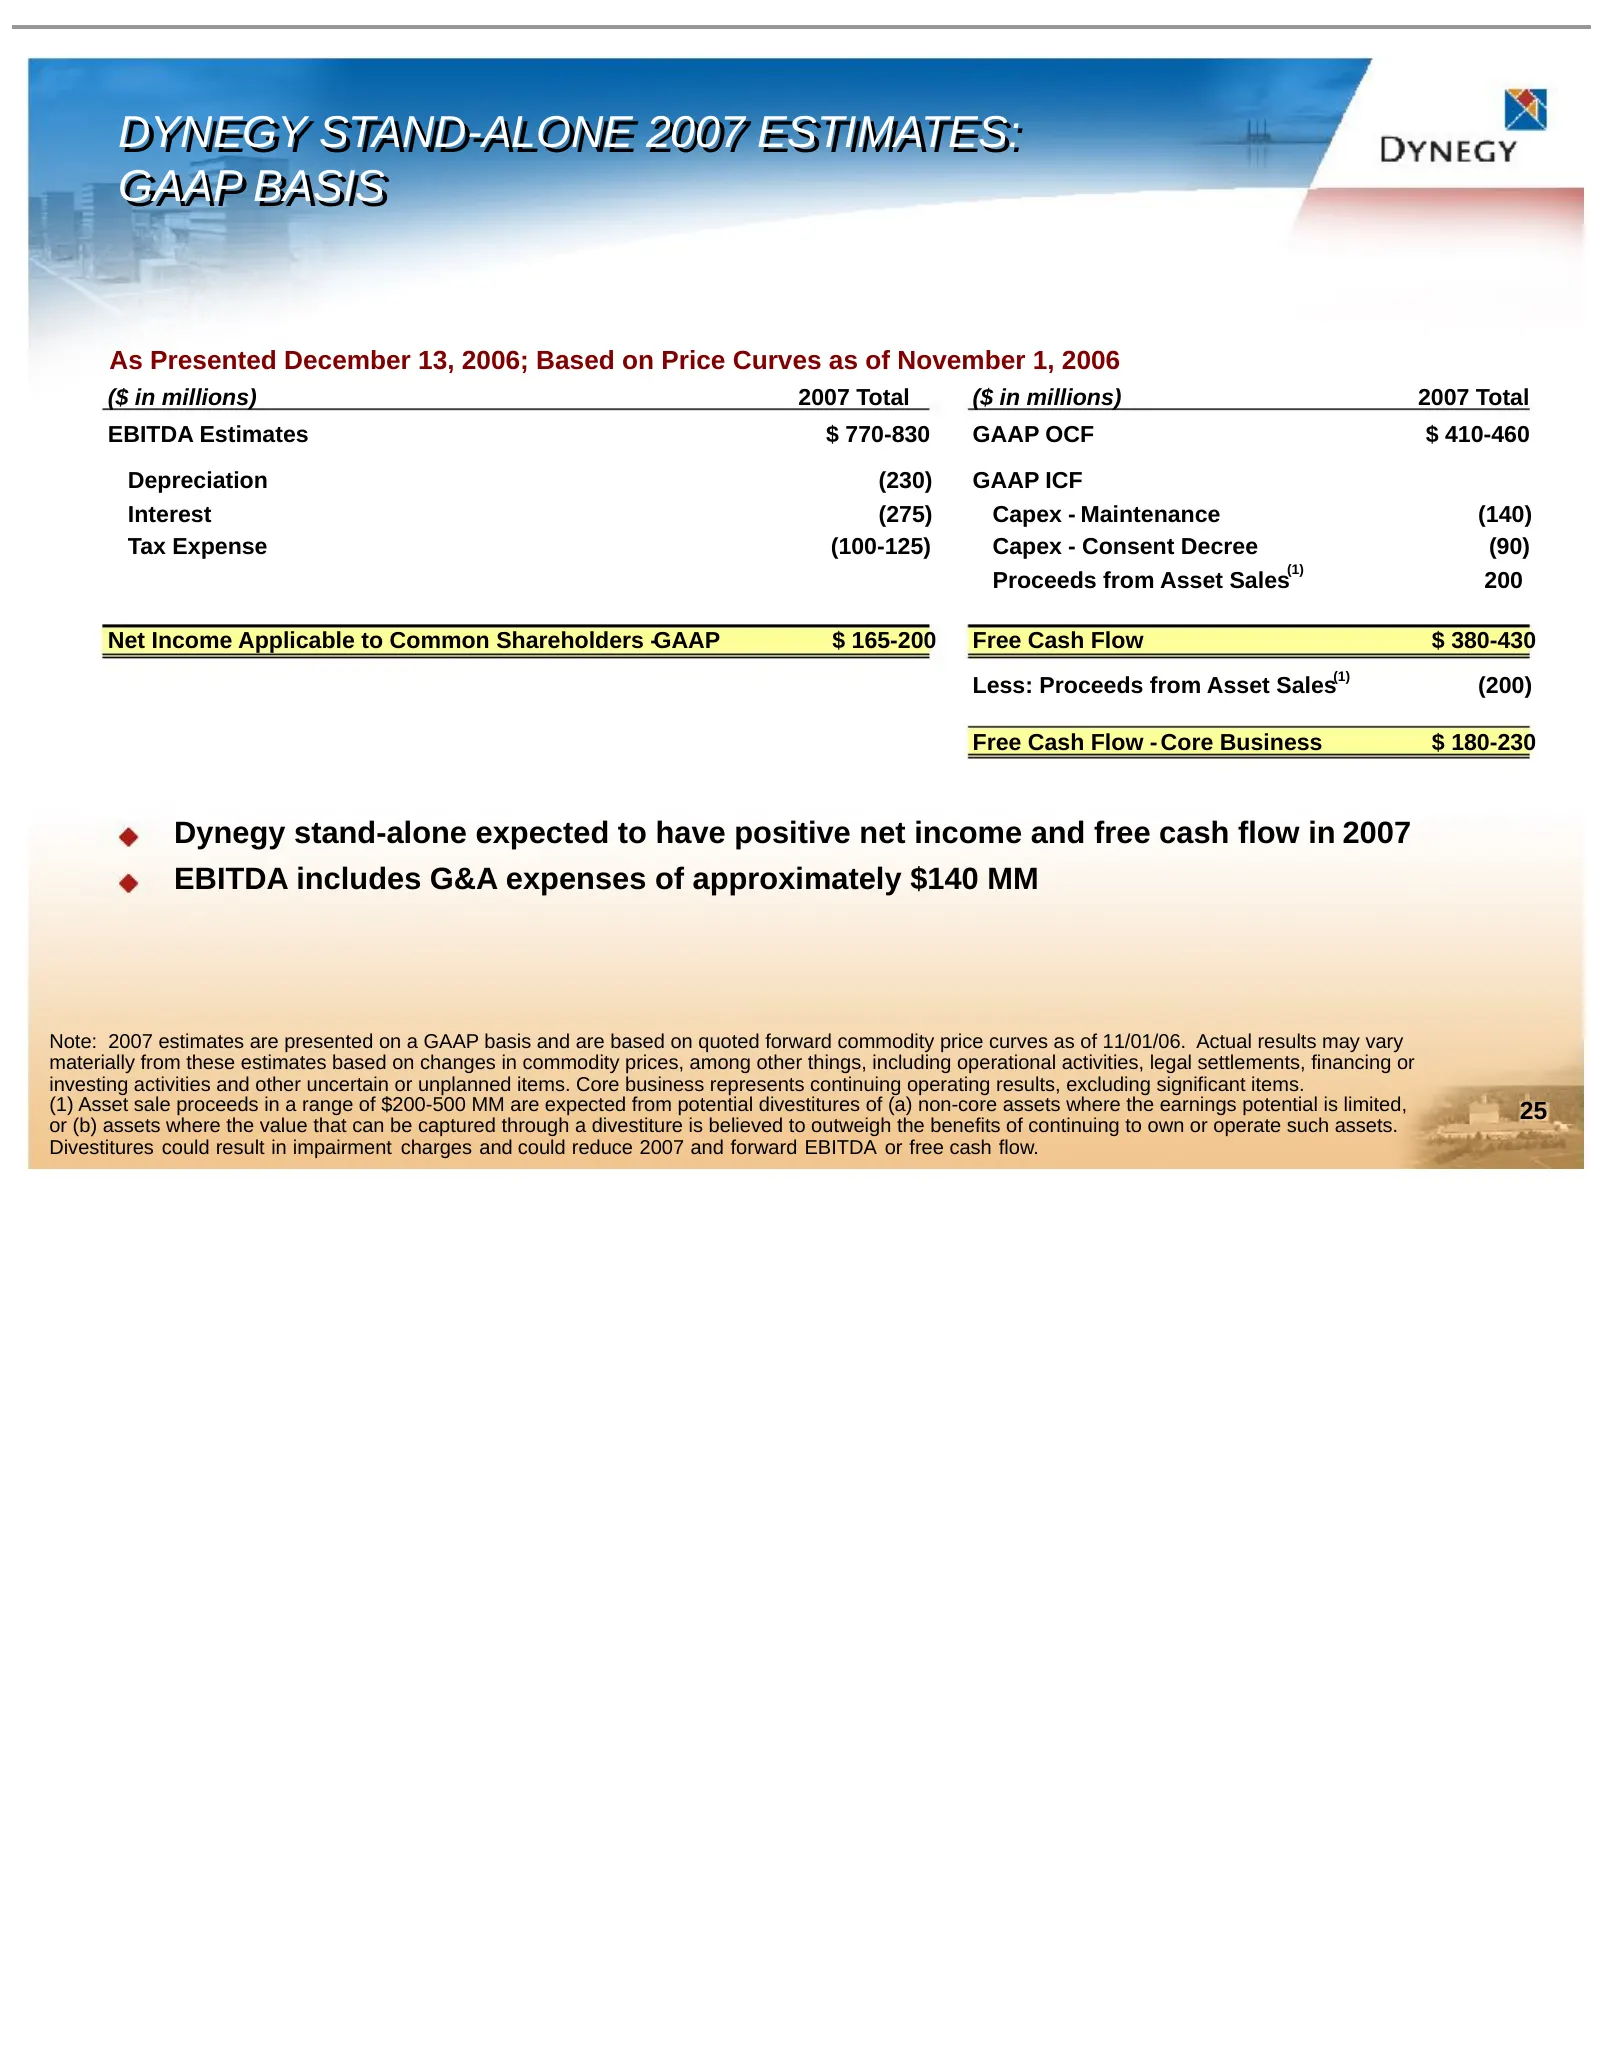
Slide 25: Dynegy Stand-Alone 2007 Estimates: GAAP Basis
DYNEGY DYNEGY STAND-ALONE STAND-ALONE 2007 2007 ESTIMATES: ESTIMATES: GAAP GAAP BASIS BASIS As Presented December 13, 2006; Based on Price Curves as of November 1, 2006 ($ in millions) 2007 Total ($ in millions) 2007 Total EBITDA Estimates $ 770-830 GAAP OCF $ 410-460 Depreciation (230) GAAP ICF Int
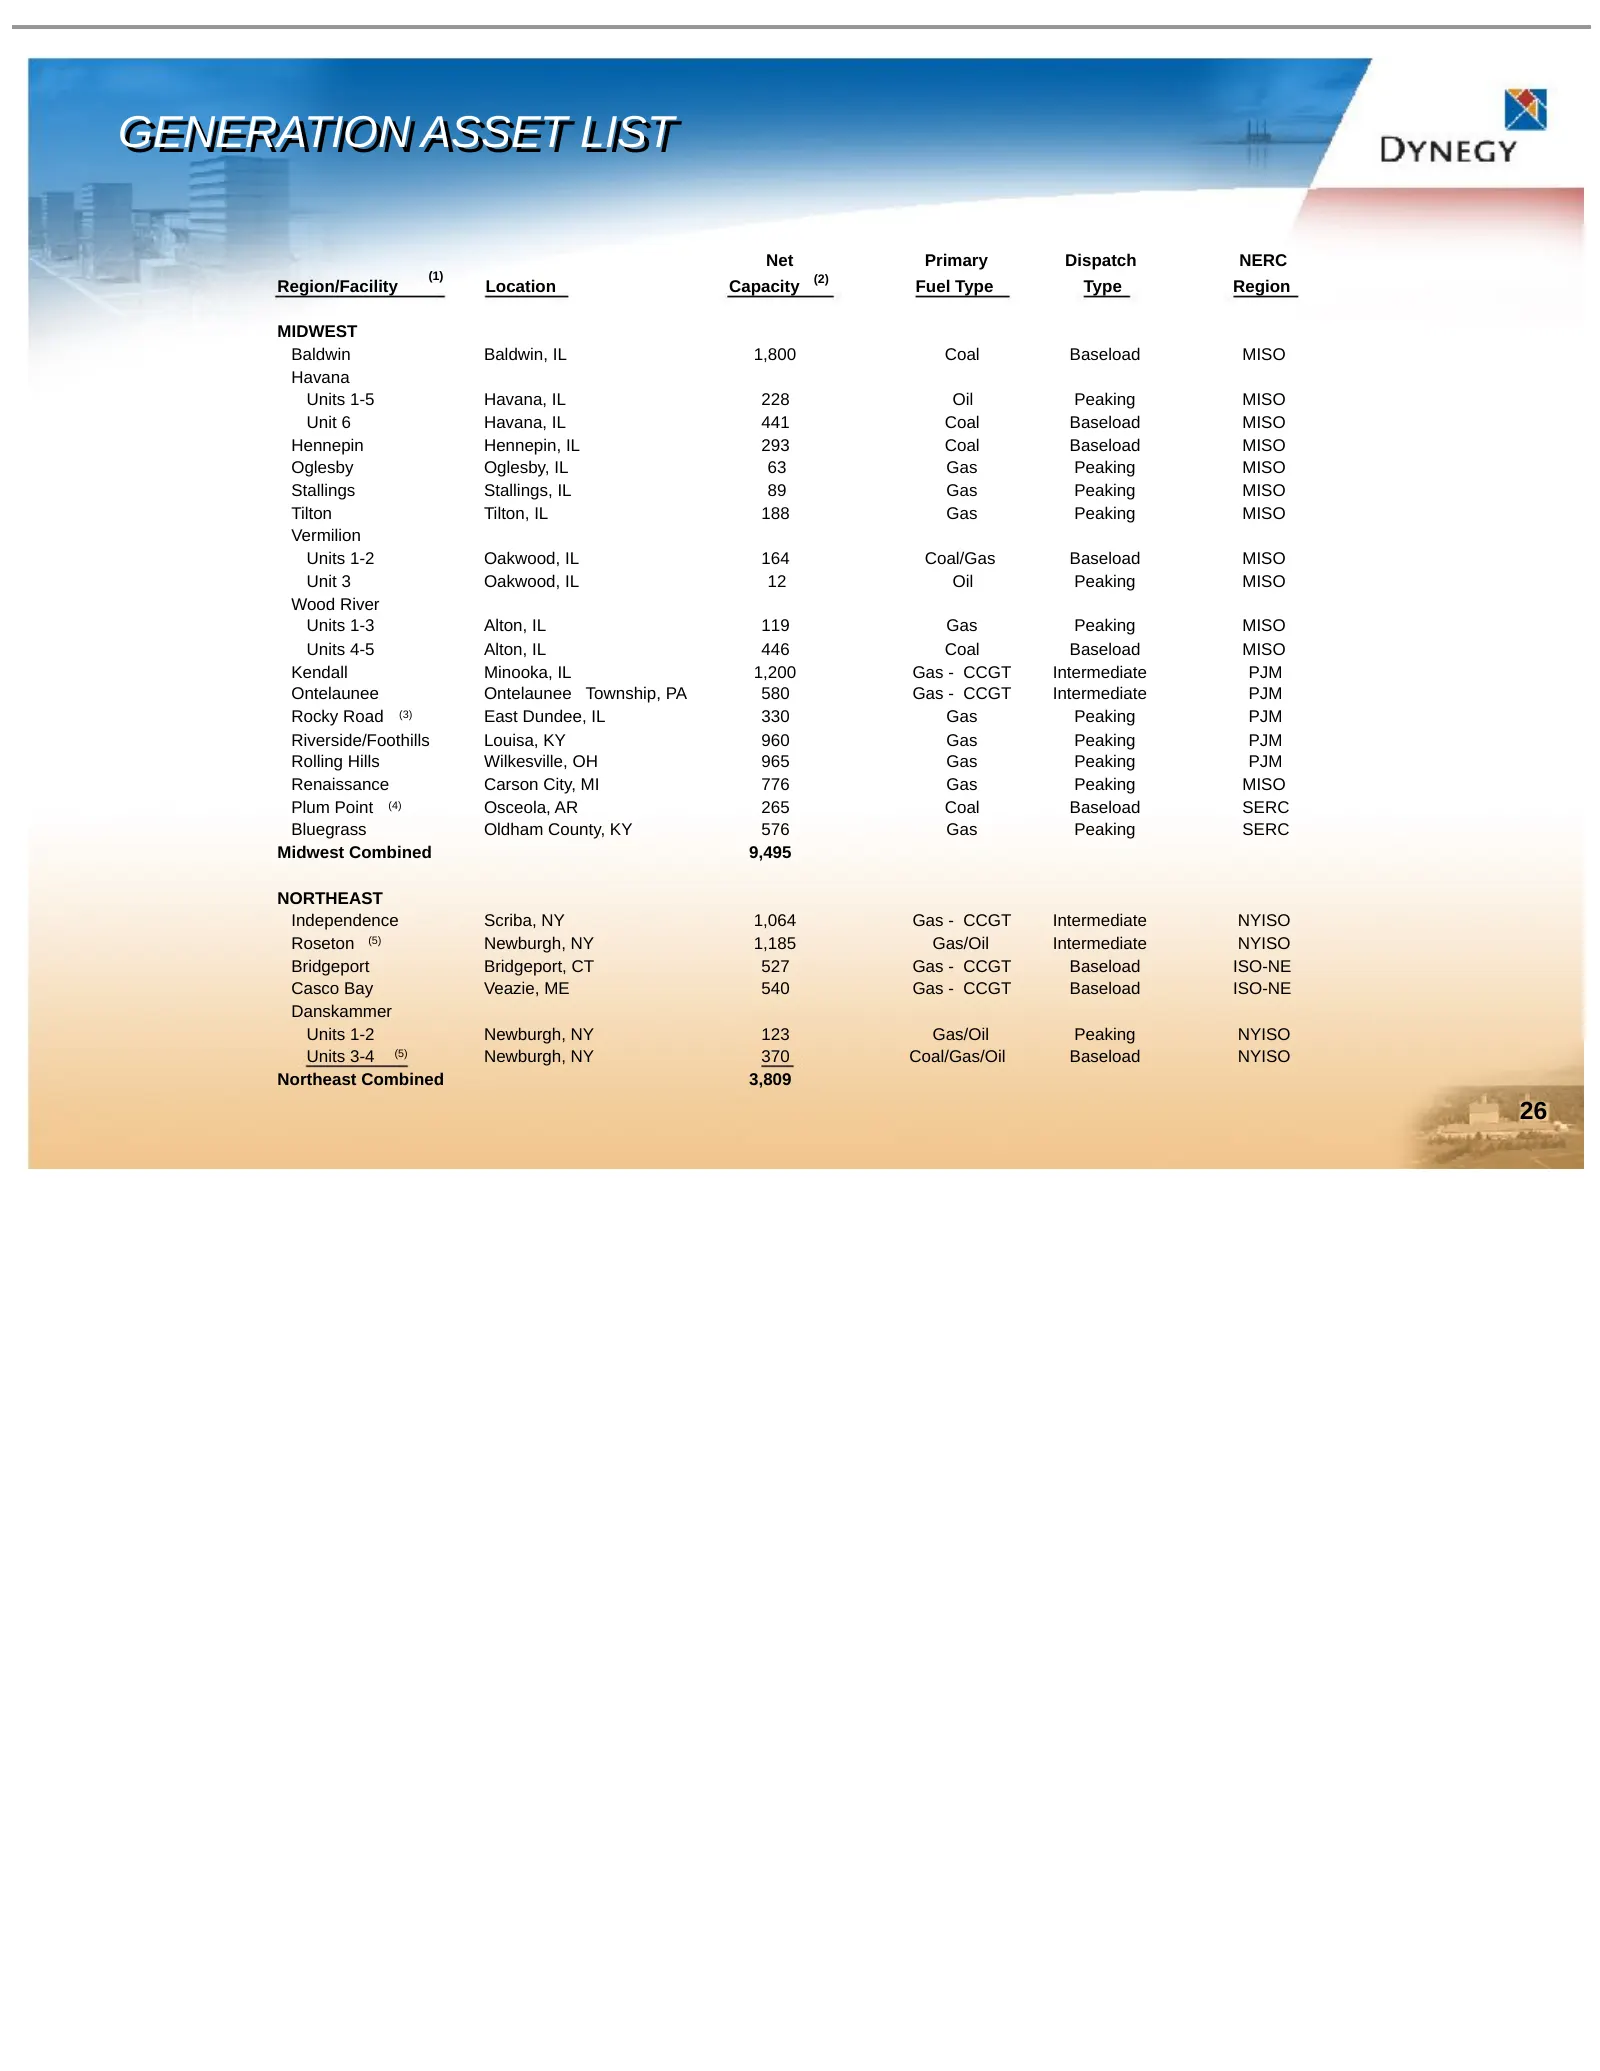
Slide 26: Generation Asset List
GENERATION GENERATION ASSET ASSET LIST LIST Net Primary Dispatch NERC (1) (2) Region/Facility Location Capacity Fuel Type Type Region MIDWEST Baldwin Baldwin, IL 1,800 Coal Baseload MISO Havana Units 1-5 Havana, IL 228 Oil Peaking MISO Unit 6 Havana, IL 441 Coal Baseload MISO Hennepin Hennepin, IL 2
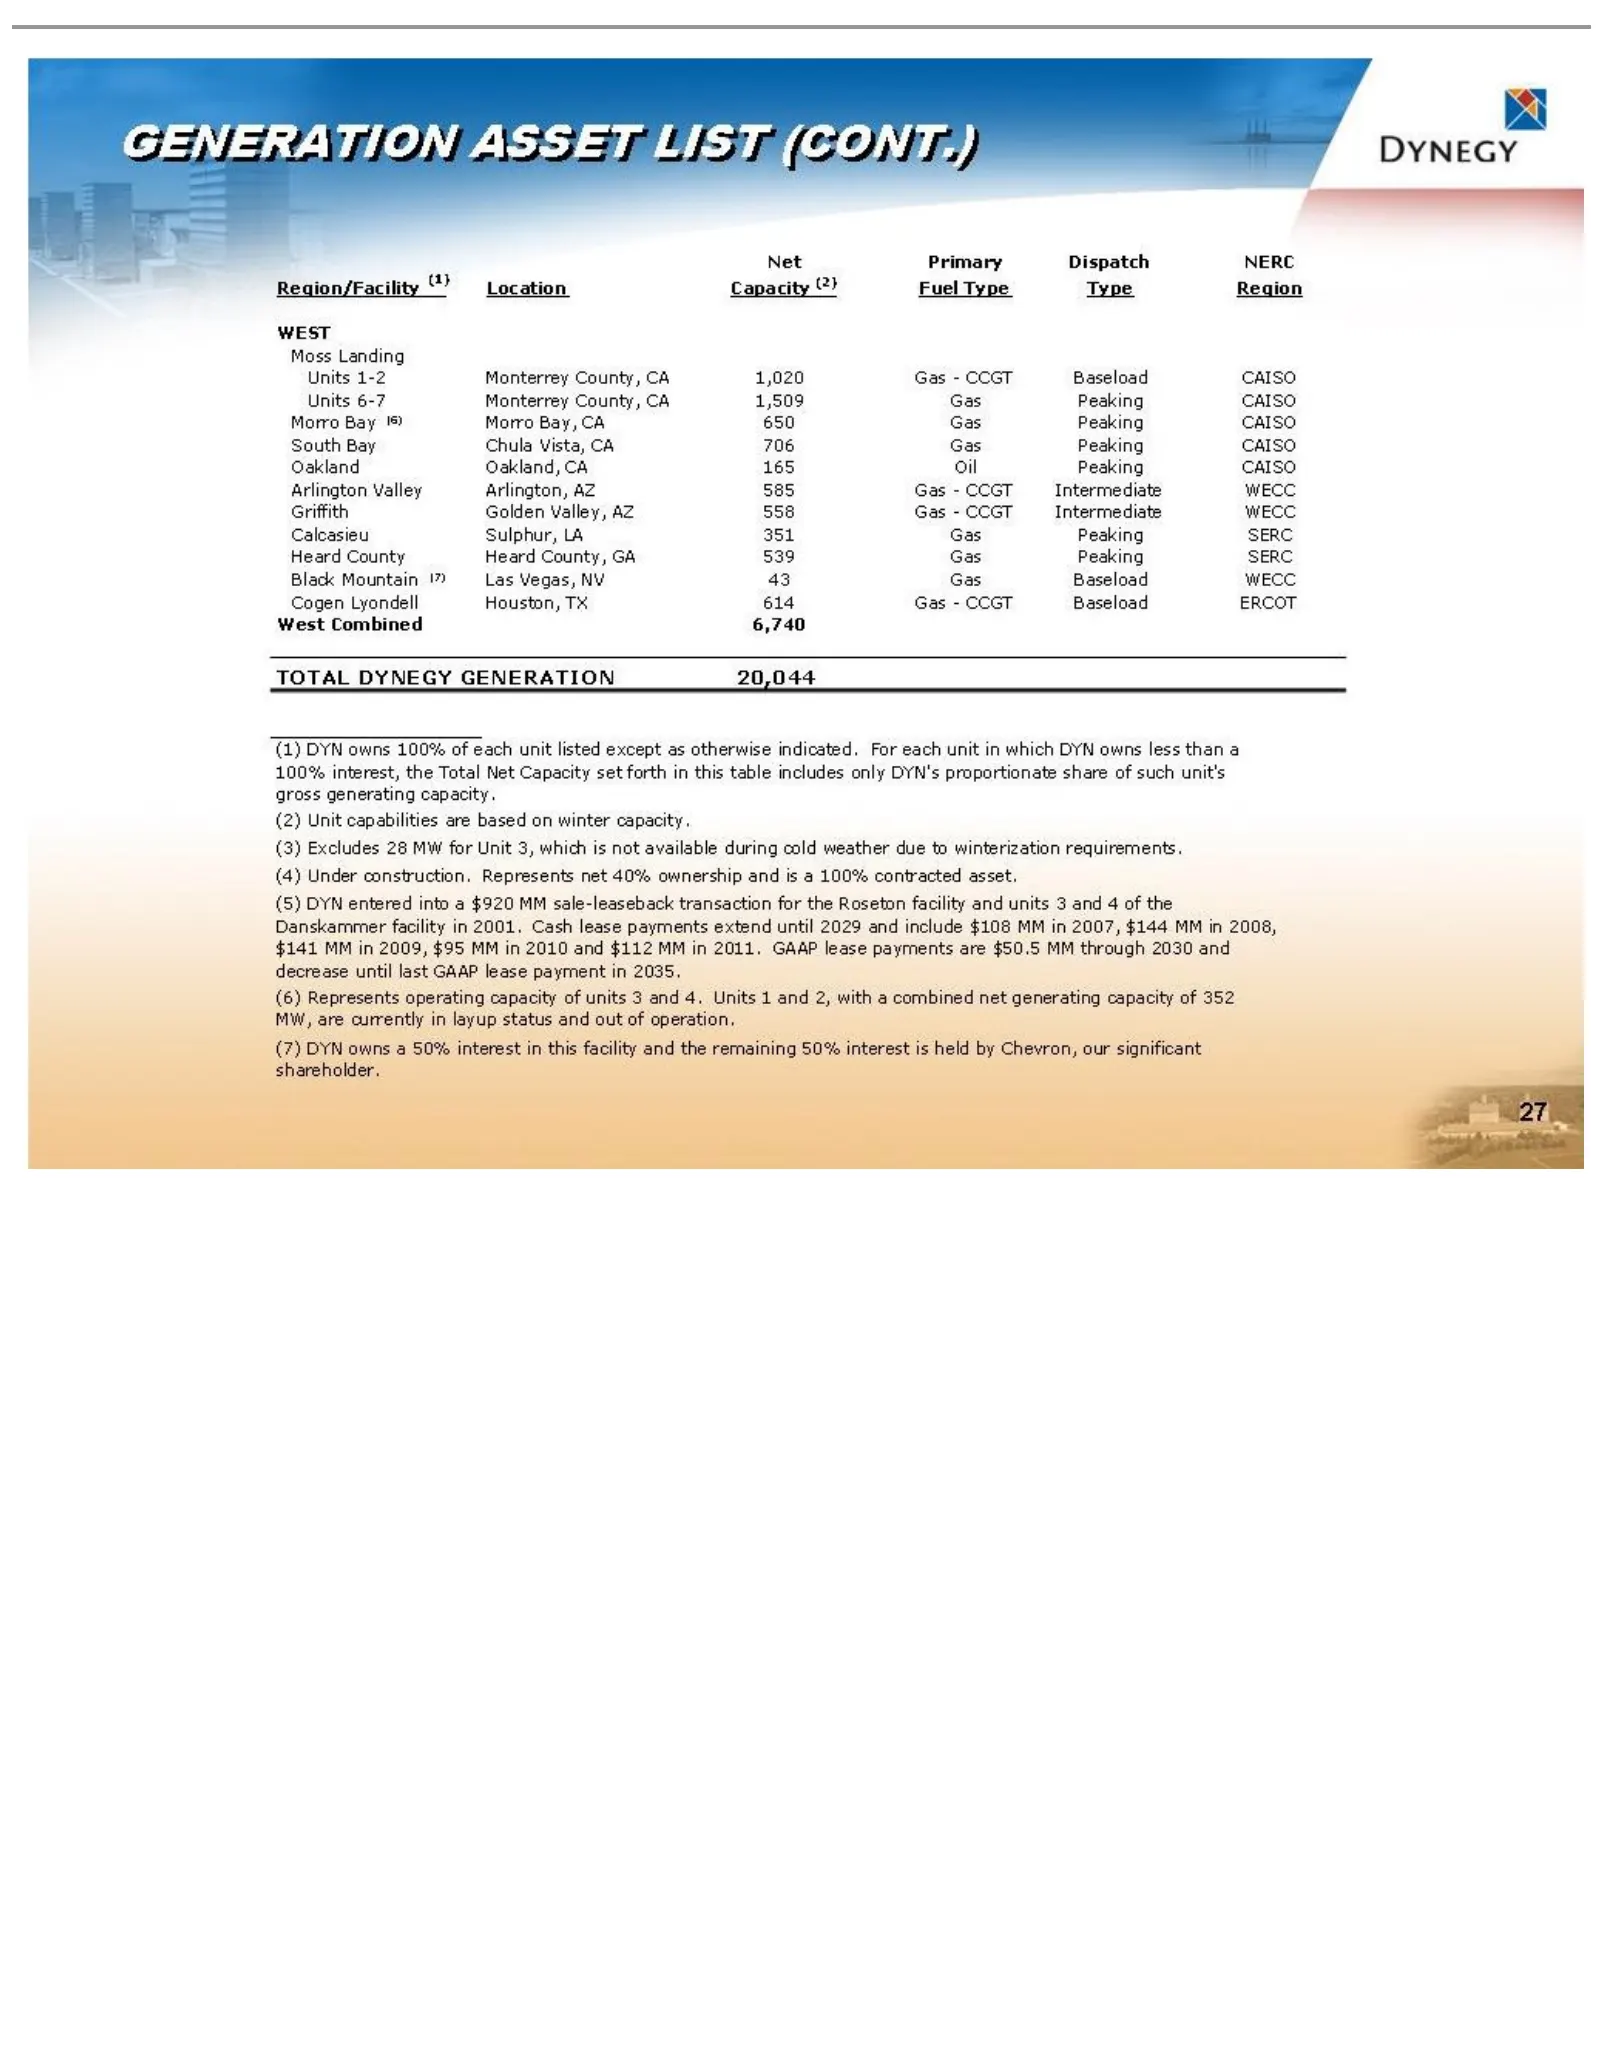
Slide 27: Generation Asset List (Cont.)
GENERATION ASSET LIST (CONT,) pyacee Region/Facility “Location Capacity @} Fuel Type. Type Region WEST Moss Landing Units 1-2 Monterrey County, C4 1,020 Gas - CCGT Baseload CAISO Units 6-7 Monterrey County, CA 1,509 Gas Peaking CAISO Morro Bay Morro Bay, CA 650 Gas Peaking CAISO South Bay Chula Vist
Source: SEC EDGAR · 8-K filed Jan 23, 2007
More decks from Dynegy Inc
 FY2017 Earnings Presentation30 slides · Feb 26, 2018
 Debt Investor Presentation (December 2017)10 slides · Dec 11, 2017
 Merger or Acquisition (October 2017)28 slides · Oct 31, 2017
 Debt Investor Presentation (October 2016)44 slides · Oct 3, 2016
 IPO Roadshow (June 2016)17 slides · Jun 15, 2016
 Investor Day (April 2014)94 slides · Apr 11, 2014