Dynegy — Investor Day (April 2014)
94 slides from Dynegy's investor day presentation, Apr 11, 2014
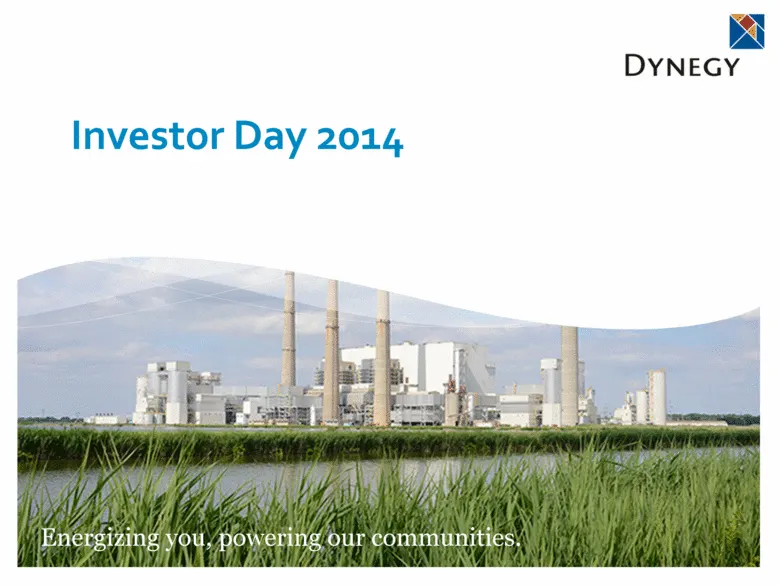
Slide 1: Investor Day 2014
Investor Day 2014
Slide 2: Forward Looking Statements
2 Forward Looking Statements Cautionary Statement Regarding Forward-Looking Statements This presentation contains statements reflecting assumptions, expectations, projections, intentions or beliefs about future events that are intended as “forward looking statements.” You can identify these statemen
Slide 3: Investor Day Agenda
3 1. Investing in Dynegy – Bob Flexon 2. Customer Focus Commercial – Hank Jones Retail – Sheree Petrone Regulatory – Dean Ellis Q&A Break 3. Continuous Improvement Operations – Dan Thompson PRIDE Reloaded – Jeff Coyle Finance – Clint Freeland Q&A 4. Closing Remarks – Bob Flexon Panel Q&A Investor Da
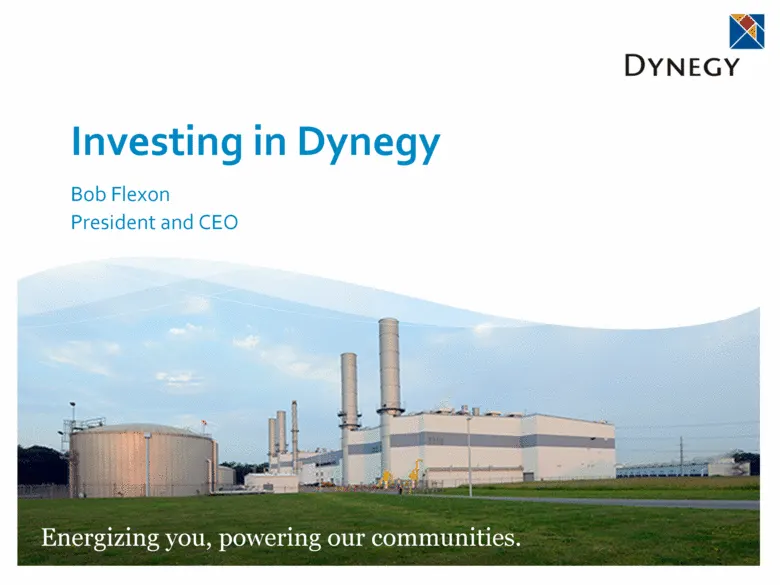
Slide 4: Investing in Dynegy
Investing in Dynegy Bob Flexon President and CEO
Slide 5: 2013 Accomplishments
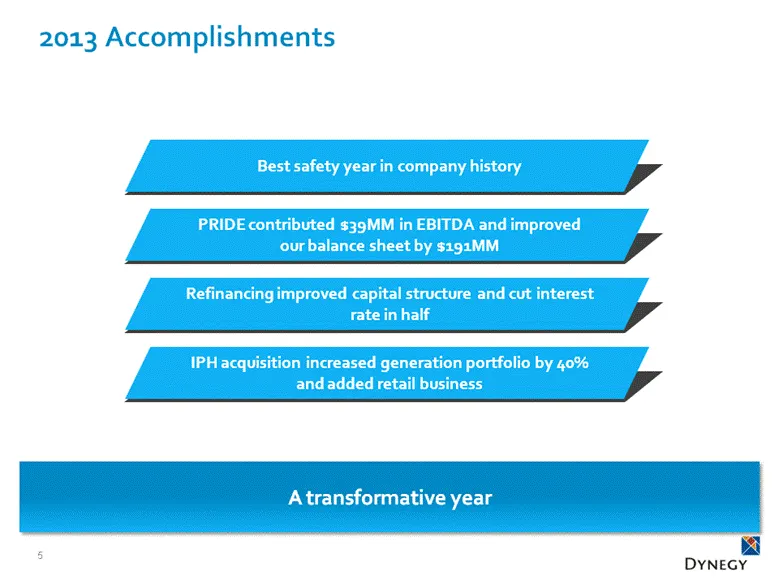
2013 Accomplishments 5 Best safety year in company history PRIDE contributed $39MM in EBITDA and improved our balance sheet by $191MM Refinancing improved capital structure and cut interest rate in half IPH acquisition increased generation portfolio by 40% and added retail business A transformative
Slide 6: Geographic and Fuel Diversification
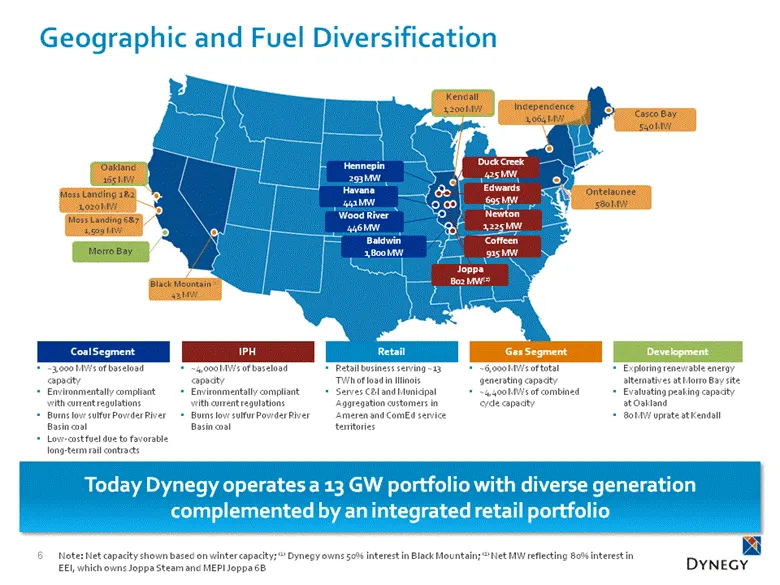
6 Geographic and Fuel Diversification Note: Net capacity shown based on winter capacity; (1) Dynegy owns 50% interest in Black Mountain; (2) Net MW reflecting 80% interest in EEI, which owns Joppa Steam and MEPI Joppa 6B Oakland 165 MW Moss Landing 1&2 1,020 MW Moss Landing 6&7 1,509 MW Baldwin 1,80
Slide 7: Market Trends
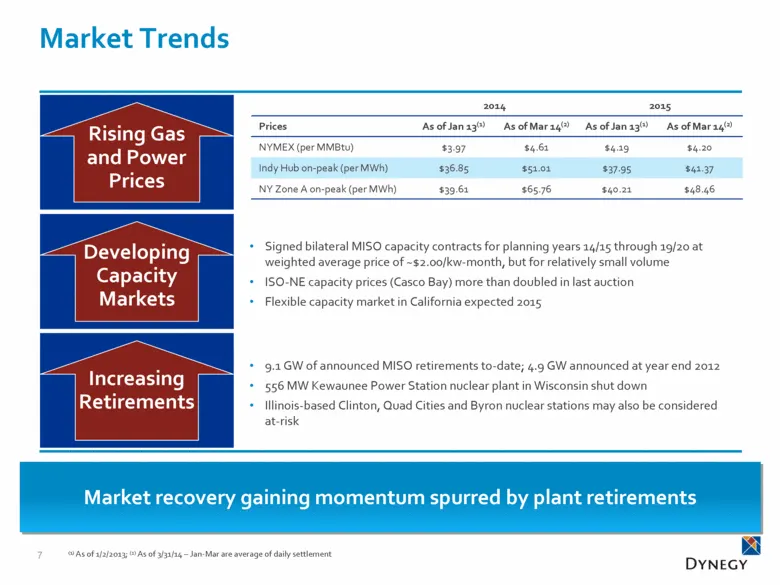
Market Trends 7 Market recovery gaining momentum spurred by plant retirements Rising Gas and Power Prices Signed bilateral MISO capacity contracts for planning years 14/15 through 19/20 at weighted average price of ~$2.00/kw-month, but for relatively small volume ISO-NE capacity prices (Casco Bay) m
Slide 8: 2014 Adjusted EBITDA Potential
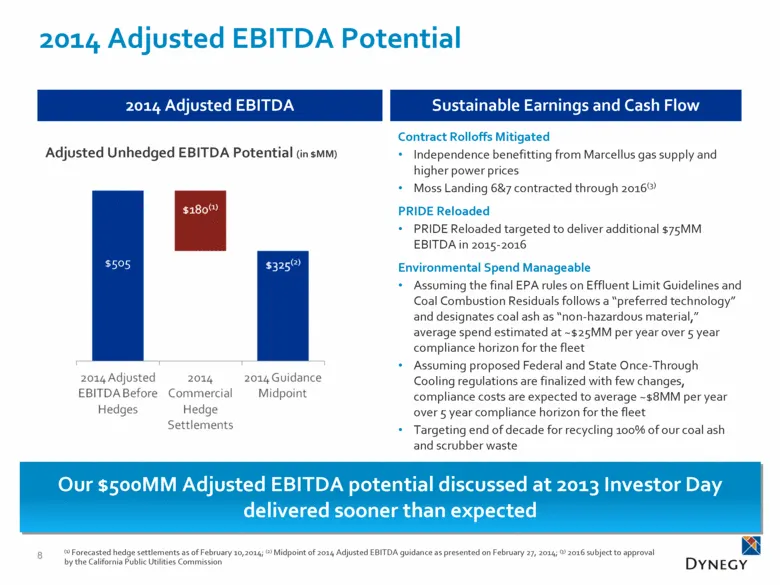
2014 Adjusted EBITDA Potential 8 $505 Adjusted Unhedged EBITDA Potential (in $MM) Our $500MM Adjusted EBITDA potential discussed at 2013 Investor Day delivered sooner than expected Sustainable Earnings and Cash Flow 2014 Adjusted EBITDA Contract Rolloffs Mitigated Independence benefitting from Marce
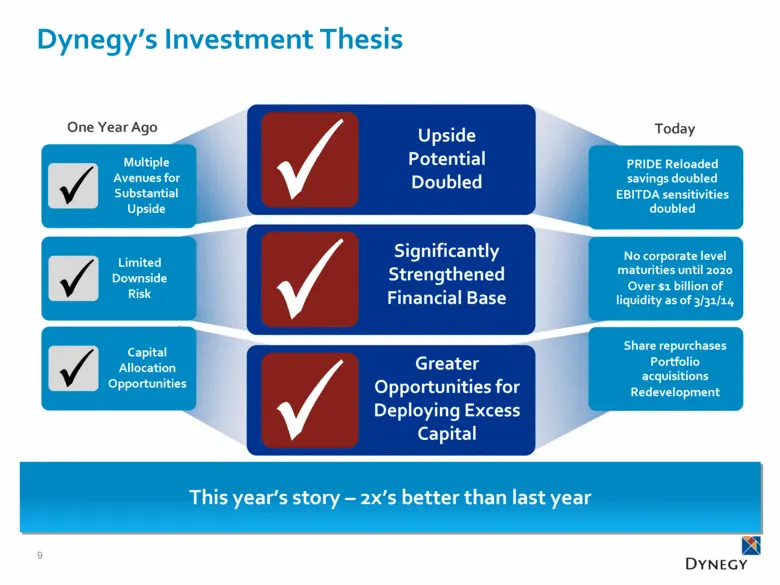
Slide 9: Dynegy's Investment Thesis
Dynegy’s Investment Thesis 9 Upside Potential Doubled This year’s story – 2x’s better than last year Greater Opportunities for Deploying Excess Capital Significantly Strengthened Financial Base One Year Ago Today Limited Downside Risk Multiple Avenues for Substantial Upside Capital Allocation Opport
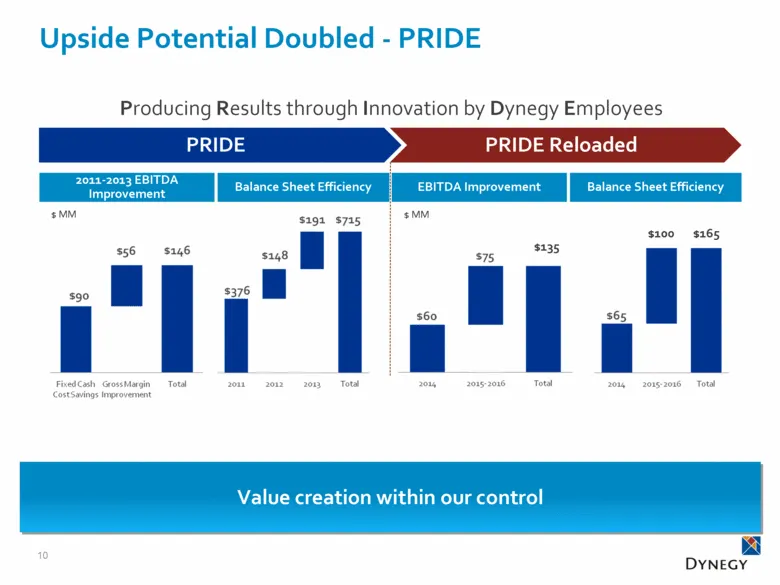
Slide 10: Upside Potential Doubled - PRIDE
Upside Potential Doubled - PRIDE 10 PRIDE PRIDE Reloaded $165 $135 Value creation within our control Producing Results through Innovation by Dynegy Employees 2011-2013 EBITDA Improvement Balance Sheet Efficiency EBITDA Improvement Balance Sheet Efficiency $ MM $ MM $100
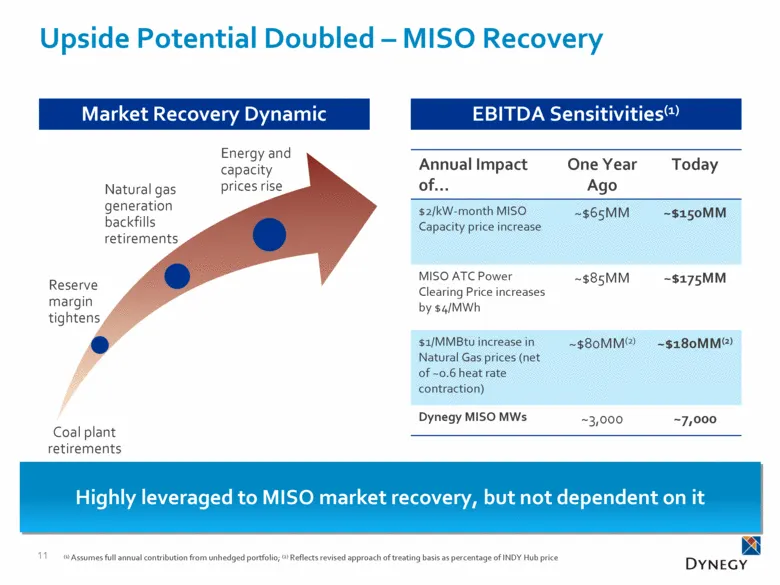
Slide 11: Upside Potential Doubled – MISO Recovery
Upside Potential Doubled – MISO Recovery 11 Coal plant retirements Highly leveraged to MISO market recovery, but not dependent on it EBITDA Sensitivities(1) Market Recovery Dynamic Annual Impact of One Year Ago Today $2/kW-month MISO Capacity price increase ~$65MM ~$150MM MISO ATC Power Clearing Pri
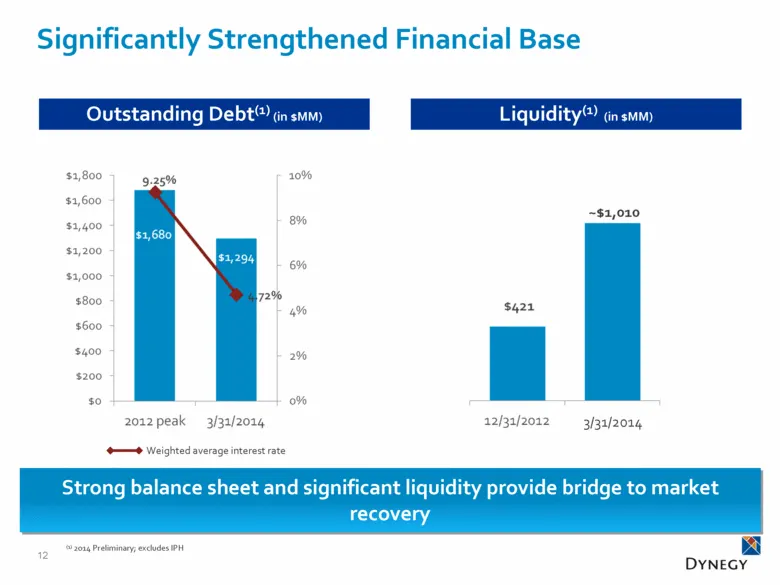
Slide 12: Significantly Strengthened Financial Base
Significantly Strengthened Financial Base 12 Strong balance sheet and significant liquidity provide bridge to market recovery (1) 2014 Preliminary; excludes IPH Liquidity(1) (in $MM) Outstanding Debt(1) (in $MM) 3/31/2014 ~$1,010 Weighted average interest rate
Slide 13: Greater Opportunities for Capital Allocation
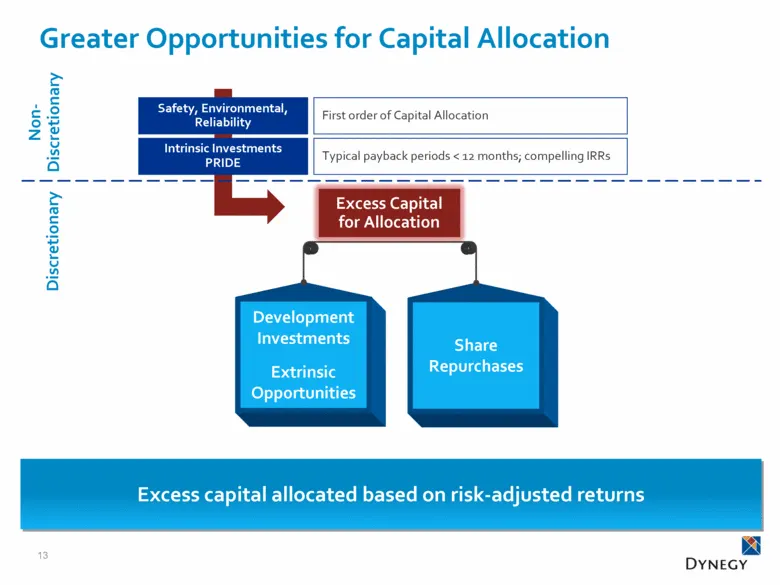
Greater Opportunities for Capital Allocation 13 Development Investments Extrinsic Opportunities Share Repurchases Excess capital allocated based on risk-adjusted returns Safety, Environmental, Reliability Intrinsic Investments PRIDE Excess Capital for Allocation First order of Capital Allocation Typ
Slide 14: Value Drivers
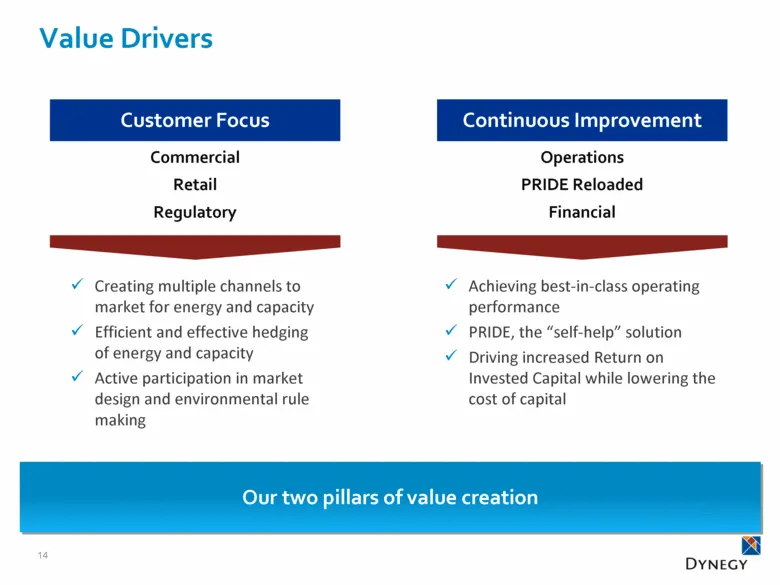
Value Drivers 14 Our two pillars of value creation Commercial Retail Regulatory Operations PRIDE Reloaded Financial Customer Focus Continuous Improvement Creating multiple channels to market for energy and capacity Efficient and effective hedging of energy and capacity Active participation in market
Slide 15: Customer Focus
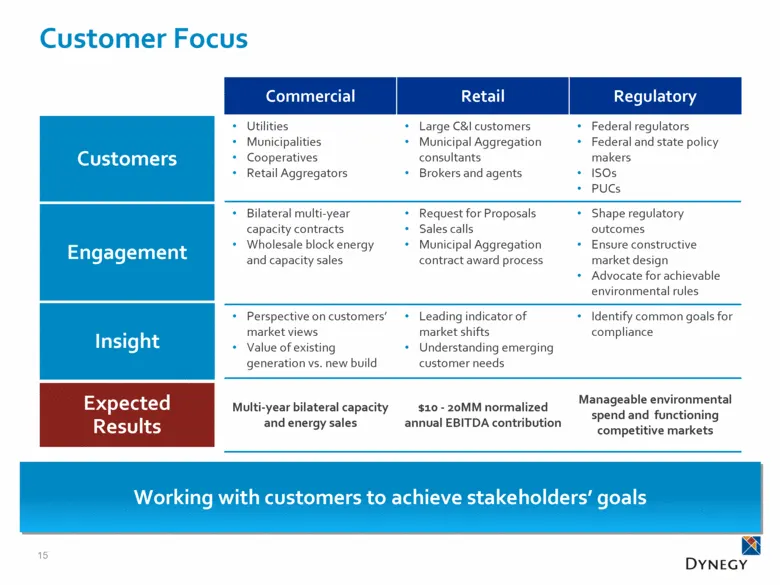
Customers Customer Focus 15 Working with customers to achieve stakeholders’ goals Commercial Retail Regulatory Utilities Municipalities Cooperatives Retail Aggregators Large C&I customers Municipal Aggregation consultants Brokers and agents Federal regulators Federal and state policy makers ISOs PUC
Slide 16: Continuous Improvement
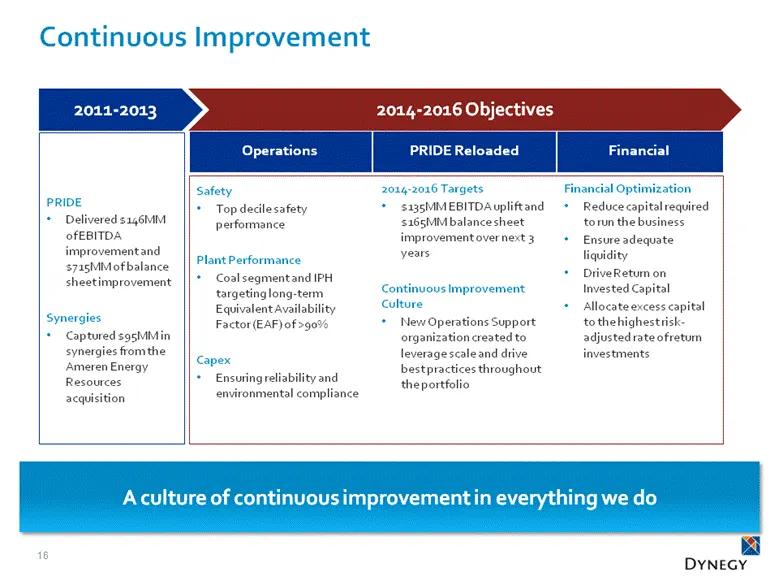
Continuous Improvement PRIDE Delivered $146MM of EBITDA improvement and $715MM of balance sheet improvement Synergies Captured $95MM in synergies from the Ameren Energy Resources acquisition 16 A culture of continuous improvement in everything we do 2011-2013 2014-2016 Objectives Operations PRIDE Re
Slide 17: Valuation
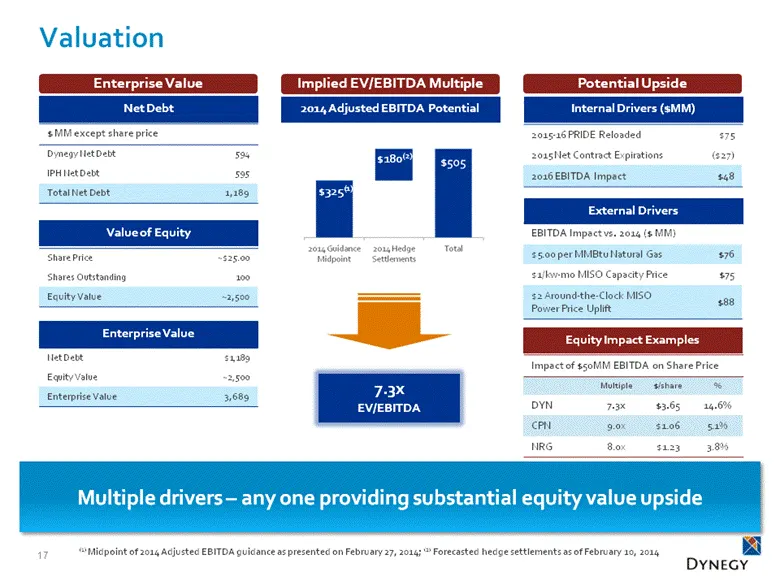
Valuation 17 Net Debt 2014 Adjusted EBITDA Potential 7.3x EV/EBITDA $ millions except share price Share Price ~$25.00 Shares Outstanding 100 Equity Value ~2,500 Value of Equity Enterprise Value Implied EV/EBITDA Multiple External Drivers Potential Upside EBITDA Impact vs. 2014 ($ MM) $5.00 per MMBtu
Slide 18: Commercial
Commercial Hank Jones Chief Commercial Officer
Slide 19: Commercial Markets Overview
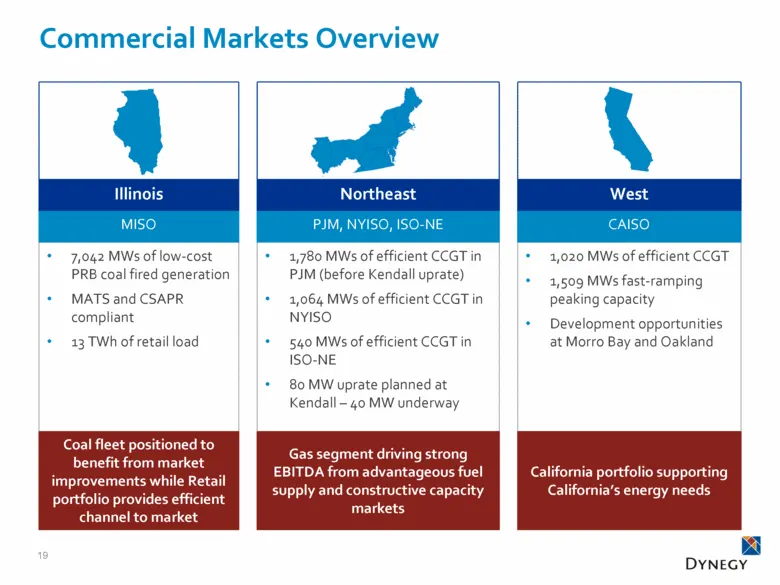
Commercial Markets Overview 19 Illinois Northeast West MISO PJM, NYISO, ISO-NE CAISO 7,042 MWs of low-cost PRB coal fired generation MATS and CSAPR compliant 13 TWh of retail load 1,780 MWs of efficient CCGT in PJM (before Kendall uprate) 1,064 MWs of efficient CCGT in NYISO 540 MWs of efficient CCG
Slide 20: MISO Overview
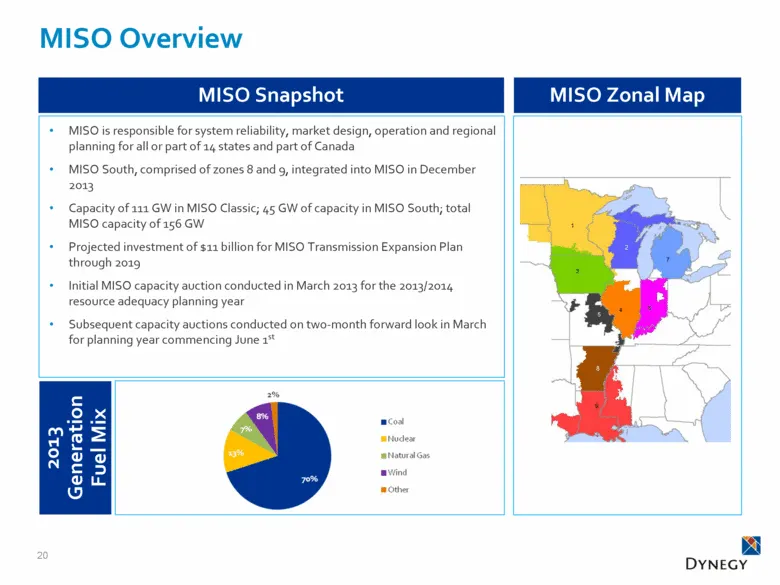
MISO Overview 20 MISO Snapshot MISO Zonal Map MISO is responsible for system reliability, market design, operation and regional planning for all or part of 14 states and part of Canada MISO South, comprised of zones 8 and 9, integrated into MISO in December 2013 Capacity of 111 GW in MISO Classic; 4
Slide 21: MISO Reserve Margins
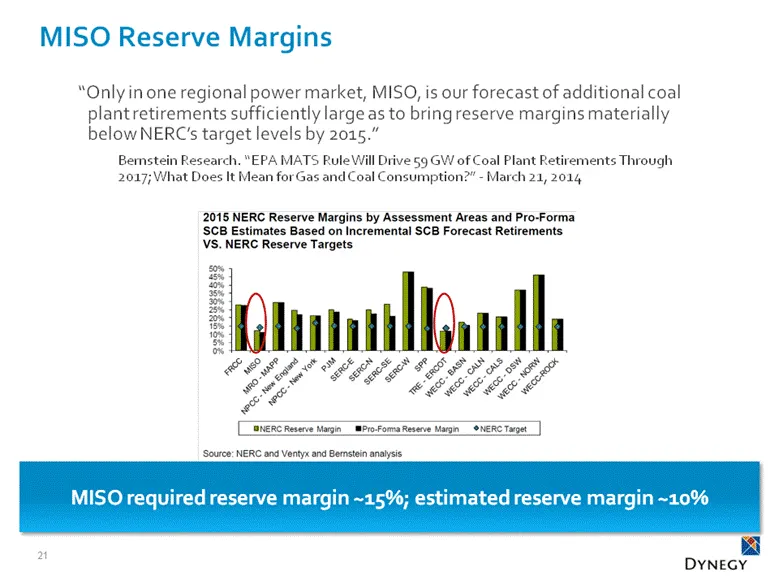
MISO Reserve Margins 21 “Only in one regional power market, MISO, is our forecast of additional coal plant retirements sufficiently large as to bring reserve margins materially below NERC’s target levels by 2015.” Bernstein Research. “EPA MATS Rule Will Drive 59 GW of Coal Plant Retirements Through
Slide 22: MISO Classic Capacity – Current Forecast
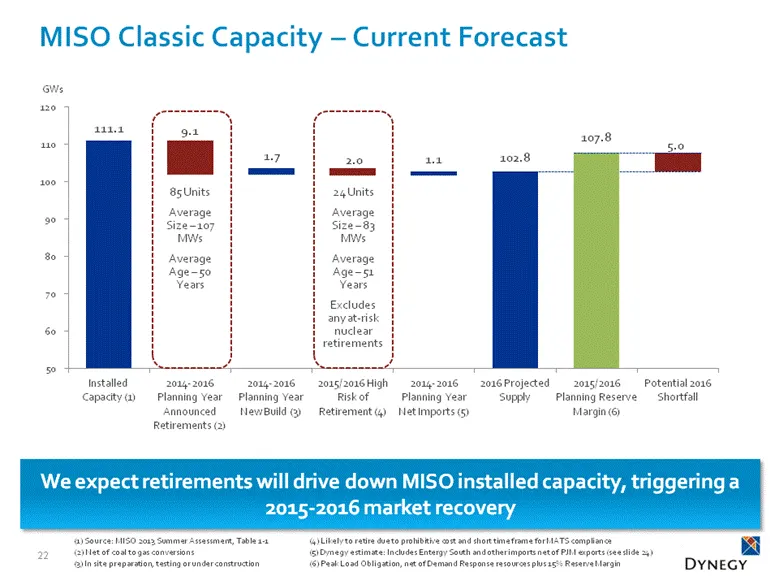
MISO Classic Capacity – Current Forecast 22 GWs We expect retirements will drive down MISO installed capacity, triggering a 2015-2016 market recovery 85 Units Average Size – 107 MWs Average Age – 50 Years 24 Units Average Size – 83 MWs Average Age – 51 Years Excludes any at-risk nuclear retirements
Slide 23: Economics of MISO Environmental Compliance
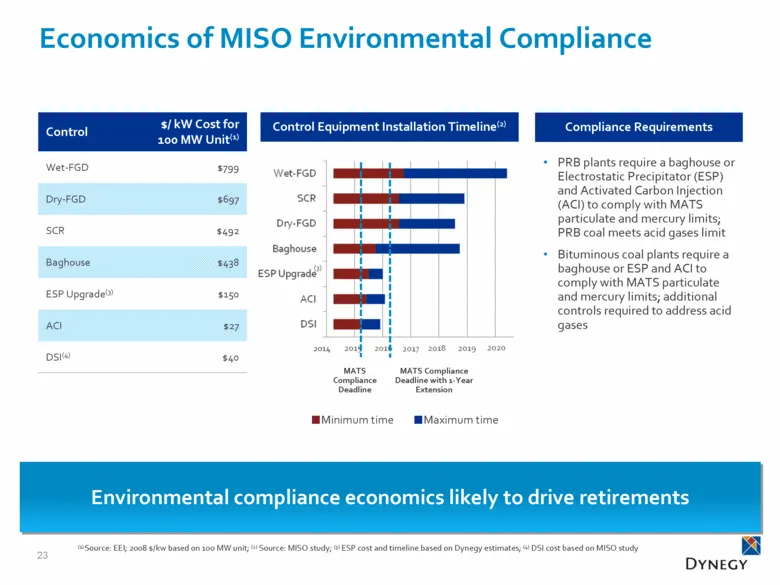
Economics of MISO Environmental Compliance 23 MATS Compliance Deadline with 1-Year Extension MATS Compliance Deadline (1) Source: EEI; 2008 $/kw based on 100 MW unit; (2) Source: MISO study; (3) ESP cost and timeline based on Dynegy estimates; (4) DSI cost based on MISO study PRB plants require a ba
Slide 24: Change in Import/Export
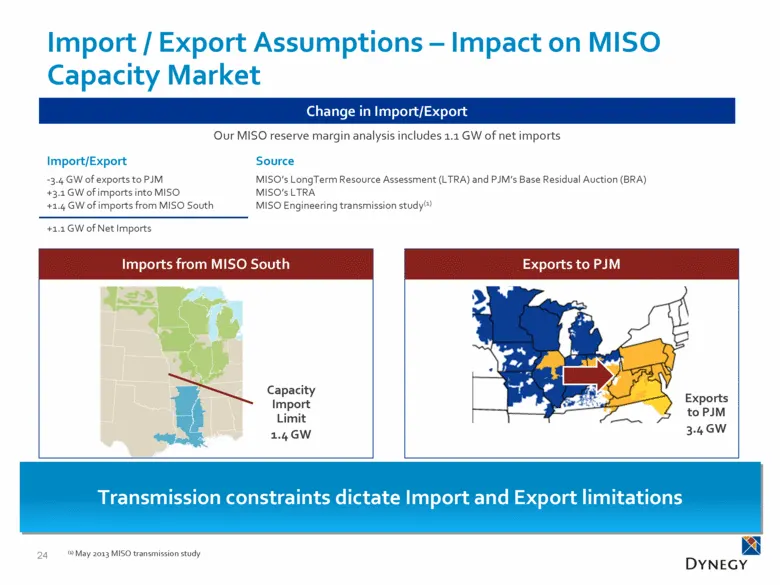
Change in Import/Export Our MISO reserve margin analysis includes 1.1 GW of net imports Import/Export Source -3.4 GW of exports to PJM +3.1 GW of imports into MISO +1.4 GW of imports from MISO South MISO’s LongTerm Resource Assessment (LTRA) and PJM’s Base Residual Auction (BRA) MISO’s LTRA MISO Eng
Slide 25: Additional Potential Impact on MISO Supply/Demand
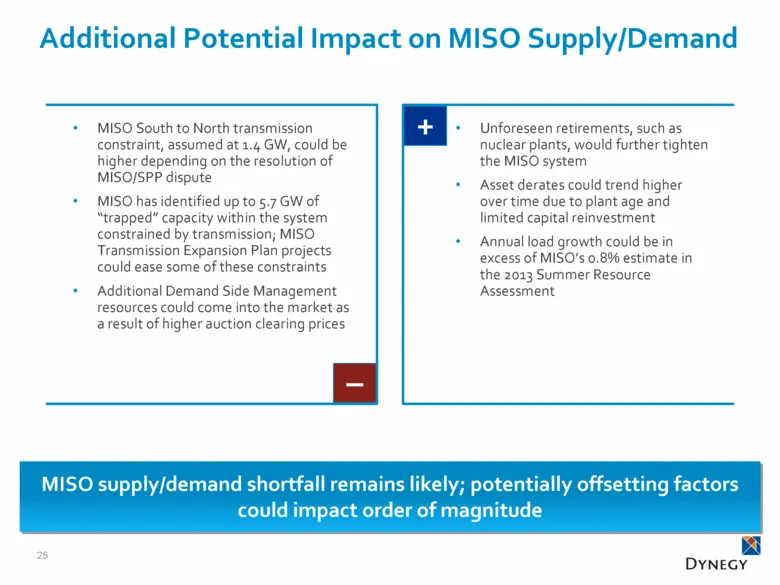
Additional Potential Impact on MISO Supply/Demand 25 – MISO supply/demand shortfall remains likely; potentially offsetting factors could impact order of magnitude + MISO South to North transmission constraint, assumed at 1.4 GW, could be higher depending on the resolution of MISO/SPP dispute MISO ha
Slide 26: MISO Capacity Market Design
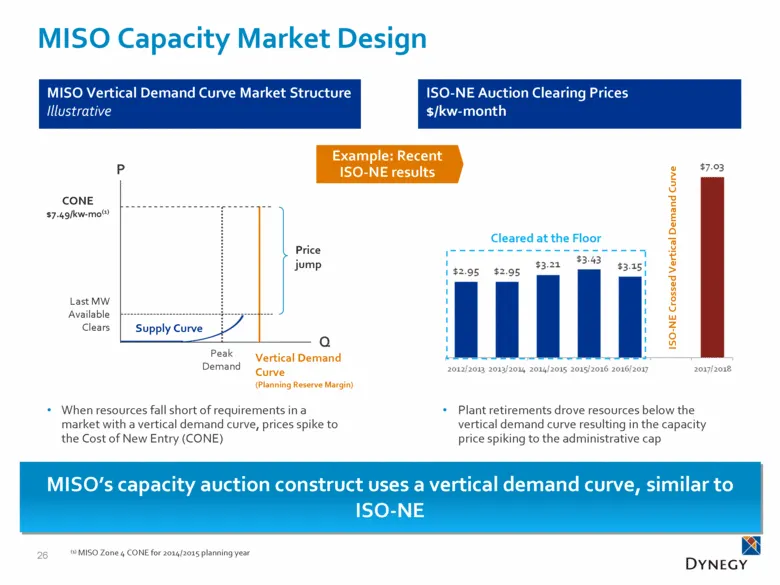
26 MISO Capacity Market Design When resources fall short of requirements in a market with a vertical demand curve, prices spike to the Cost of New Entry (CONE) Plant retirements drove resources below the vertical demand curve resulting in the capacity price spiking to the administrative cap MISO’s c
Slide 27: MISO Resource Adequacy Construct
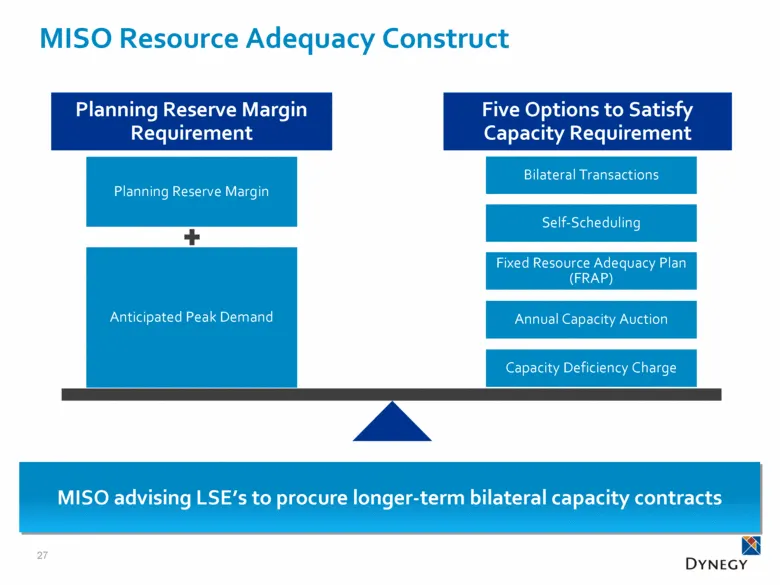
MISO Resource Adequacy Construct 27 Planning Reserve Margin Requirement Anticipated Peak Demand Bilateral Transactions Five Options to Satisfy Capacity Requirement Planning Reserve Margin Self-Scheduling Fixed Resource Adequacy Plan (FRAP) Annual Capacity Auction Capacity Deficiency Charge MISO advi
Slide 28: Multiple Channels to Sell MISO Capacity
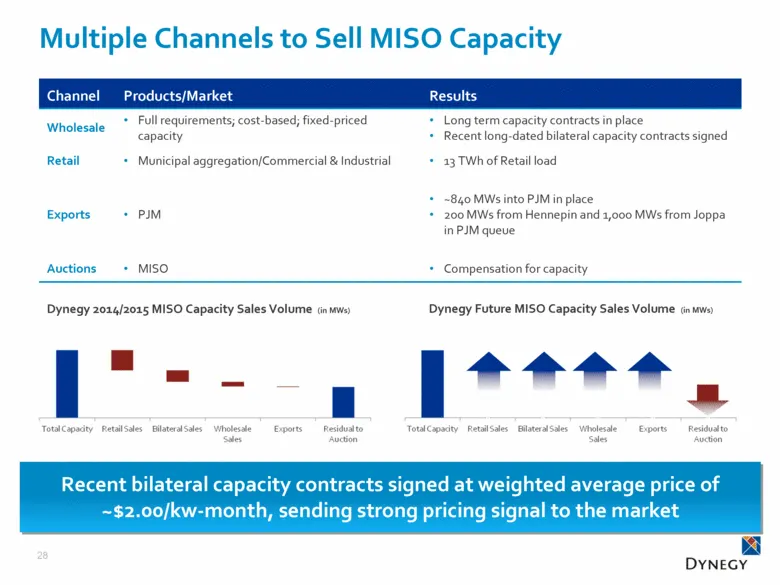
28 Multiple Channels to Sell MISO Capacity Channel Products/Market Results Wholesale Full requirements; cost-based; fixed-priced capacity Long term capacity contracts in place Recent long-dated bilateral capacity contracts signed Retail Municipal aggregation/Commercial & Industrial 13 TWh of Retail
Slide 29: MISO Dispatch Stack with Retirements
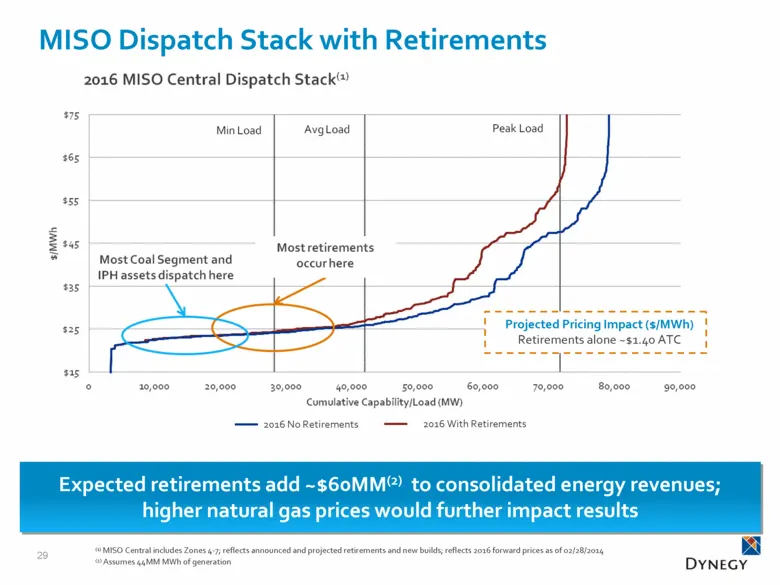
MISO Dispatch Stack with Retirements 29 (1) MISO Central includes Zones 4-7; reflects announced and projected retirements and new builds; reflects 2016 forward prices as of 02/28/2014 (2) Assumes 44MM MWh of generation 2016 No Retirements Expected retirements add ~$60MM(2) to consolidated energy rev
Slide 30: MISO South Impact on Energy Prices
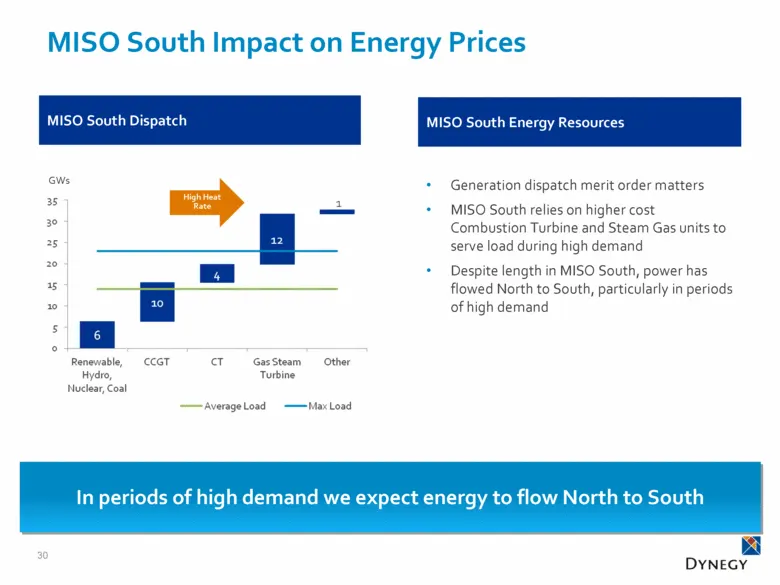
30 MISO South Impact on Energy Prices High Heat Rate MISO South Energy Resources MISO South Dispatch Generation dispatch merit order matters MISO South relies on higher cost Combustion Turbine and Steam Gas units to serve load during high demand Despite length in MISO South, power has flowed North t
Slide 31: Maximizing Locational Marginal Prices
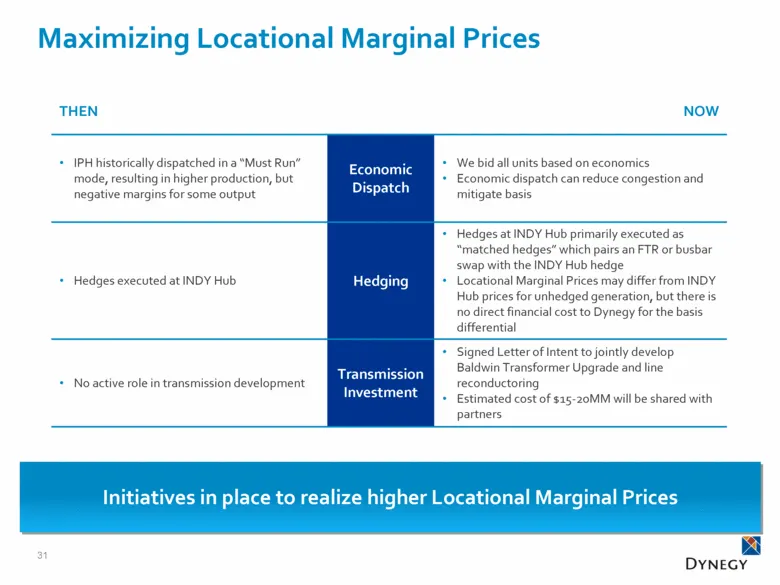
31 Maximizing Locational Marginal Prices THEN NOW IPH historically dispatched in a “Must Run” mode, resulting in higher production, but negative margins for some output Economic Dispatch We bid all units based on economics Economic dispatch can reduce congestion and mitigate basis Hedges executed at
Slide 32: Gas Segment Markets Overview
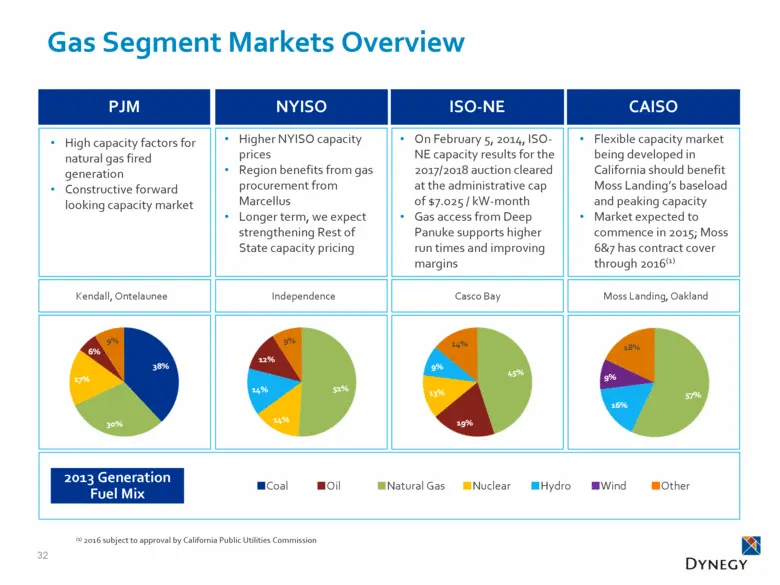
32 Gas Segment Markets Overview CAISO ISO-NE NYISO PJM High capacity factors for natural gas fired generation Constructive forward looking capacity market 2013 Generation Fuel Mix Flexible capacity market being developed in California should benefit Moss Landing’s baseload and peaking capacity Marke
Slide 33: Gas by Wire
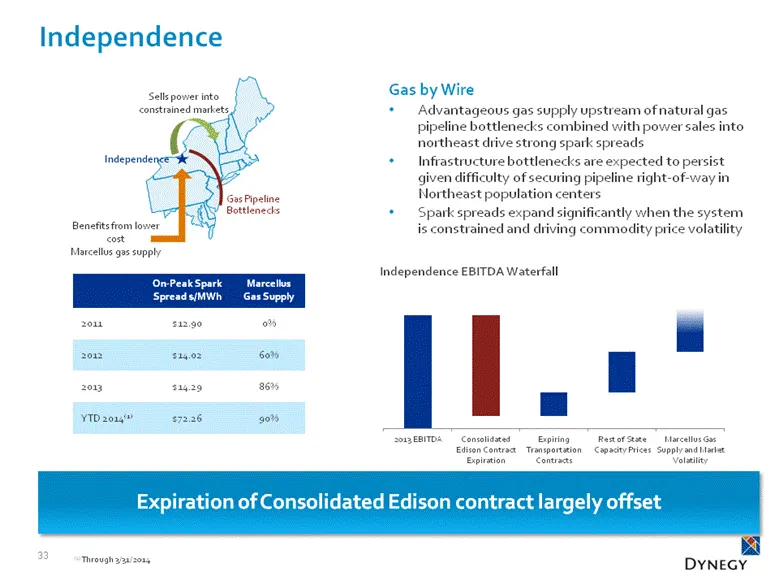
Gas by Wire Advantageous gas supply upstream of natural gas pipeline bottlenecks combined with power sales into northeast drive strong spark spreads Infrastructure bottlenecks are expected to persist given difficulty of securing pipeline right-of-way in Northeast population centers Spark spreads exp
Slide 34: Ontelaunee, Casco Bay and Kendall
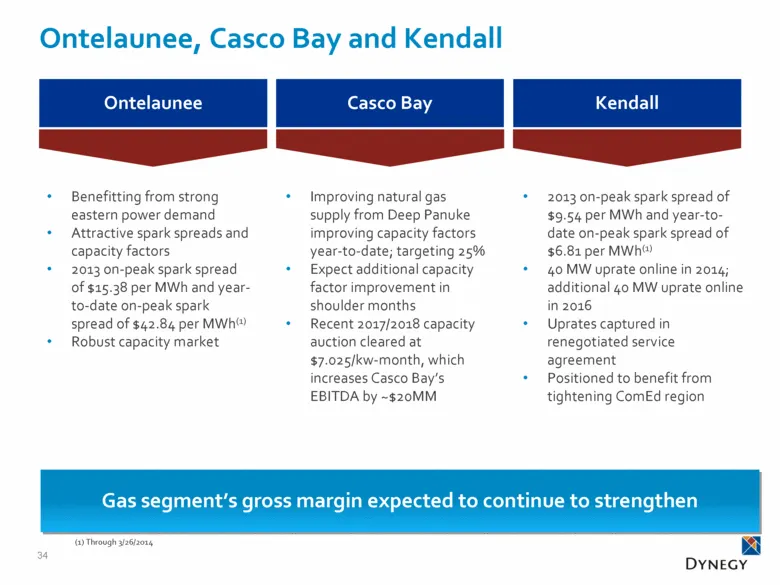
Ontelaunee, Casco Bay and Kendall 34 Benefitting from strong eastern power demand Attractive spark spreads and capacity factors 2013 on-peak spark spread of $15.38 per MWh and year-to-date on-peak spark spread of $42.84 per MWh(1) Robust capacity market Improving natural gas supply from Deep Panuke
Slide 35: California Portfolio Strategy
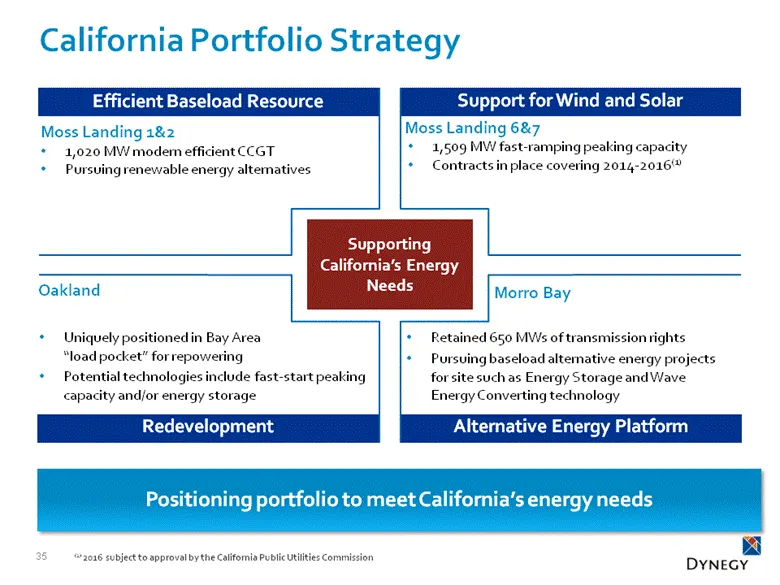
Support for Wind and Solar California Portfolio Strategy 35 Moss Landing 1&2 1,020 MW modern efficient CCGT Pursuing renewable energy alternatives 1,509 MW fast-ramping peaking capacity Contracts in place covering 2014-2016(1) Oakland Morro Bay Supporting California’s Energy Needs Uniquely positione
Slide 36: Commercial Summary
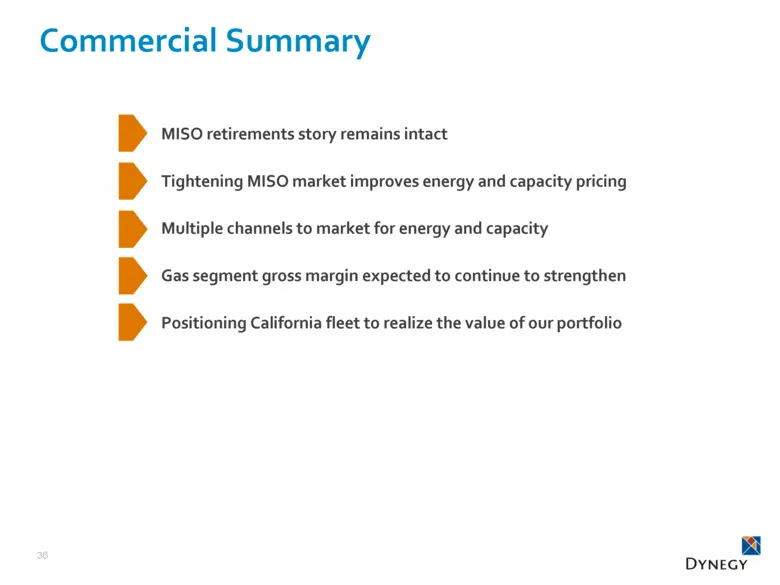
Commercial Summary 36 MISO retirements story remains intact Tightening MISO market improves energy and capacity pricing Multiple channels to market for energy and capacity Gas segment gross margin expected to continue to strengthen Positioning California fleet to realize the value of our portfolio
Slide 37: Retail
Retail Sheree Petrone Vice President of Retail
Slide 38: 2014E Sales by Customer (MWh)
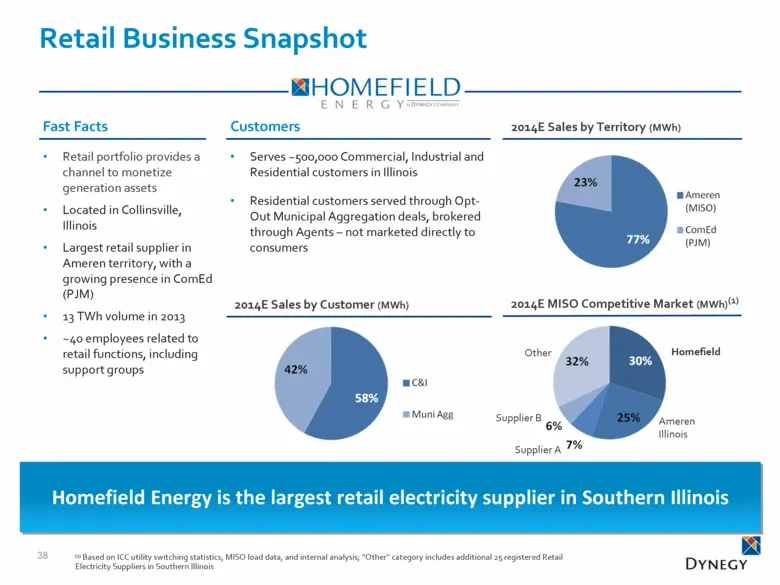
2014E Sales by Customer (MWh) 38 Retail portfolio provides a channel to monetize generation assets Located in Collinsville, Illinois Largest retail supplier in Ameren territory, with a growing presence in ComEd (PJM) 13 TWh volume in 2013 ~40 employees related to retail functions, including support
Slide 39: Retail Strategy
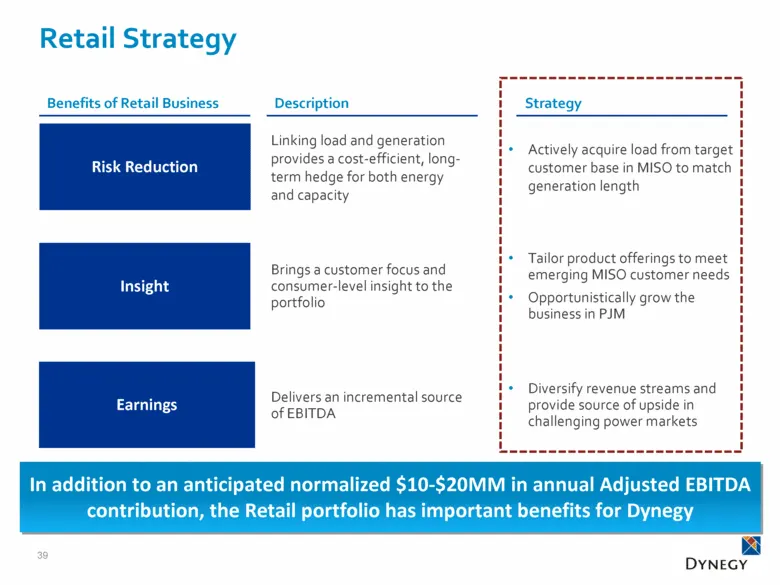
39 Linking load and generation provides a cost-efficient, long-term hedge for both energy and capacity Insight Earnings Risk Reduction Delivers an incremental source of EBITDA Brings a customer focus and consumer-level insight to the portfolio Strategy Description Retail Strategy In addition to an a
Slide 40: Retail Customers
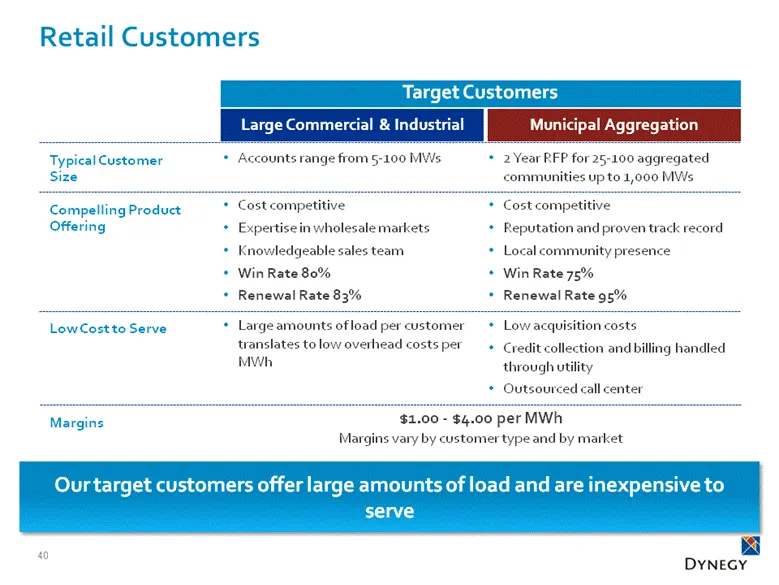
Retail Customers 40 Large Commercial & Industrial Municipal Aggregation Cost competitive Expertise in wholesale markets Knowledgeable sales team Win Rate 80% Renewal Rate 83% Cost competitive Reputation and proven track record Local community presence Win Rate 75% Renewal Rate 95% Our target custome
Slide 41: Pricing and Risk Management
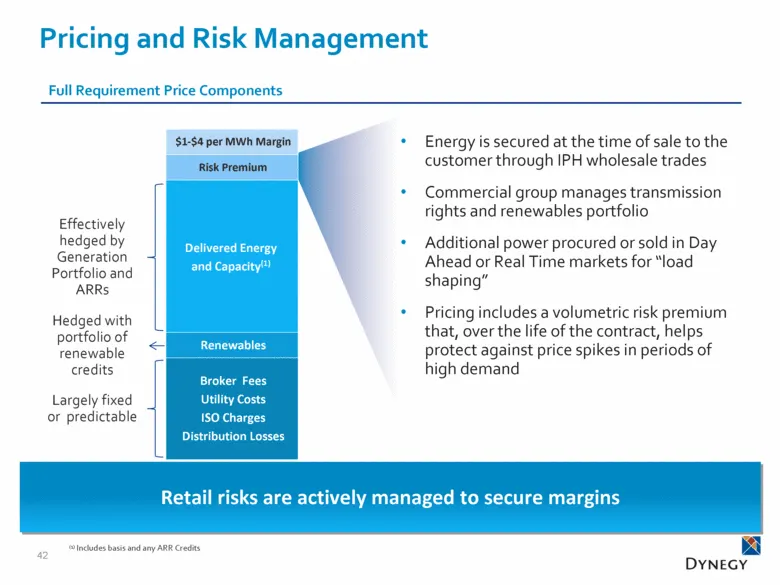
Pricing and Risk Management 42 $1-$4 per MWh Margin Renewables Delivered Energy and Capacity(1) Broker Fees Utility Costs ISO Charges Distribution Losses Retail risks are actively managed to secure margins Energy is secured at the time of sale to the customer through IPH wholesale trades Commercial
Slide 42: Room for Growth
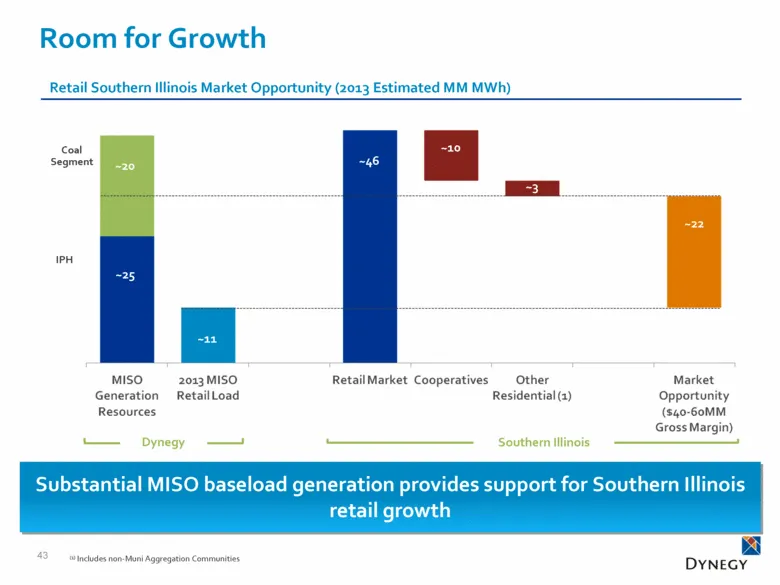
Room for Growth 43 Substantial MISO baseload generation provides support for Southern Illinois retail growth Retail Southern Illinois Market Opportunity (2013 Estimated MM MWh) (1) Includes non-Muni Aggregation Communities ~10 ~3 ~22 ~11 ~25 ~46 ~20 Coal Segment IPH Dynegy Southern Illinois
Slide 43: Demand Side Management
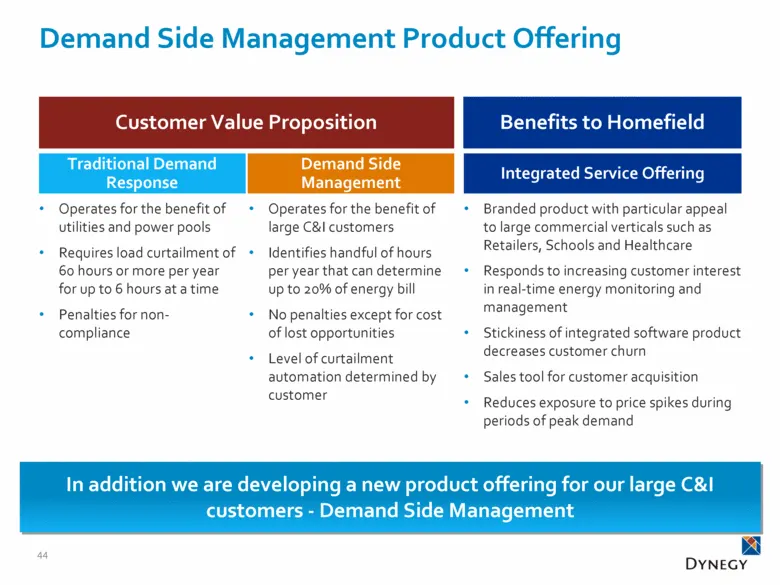
Demand Side Management Product Offering 44 Operates for the benefit of utilities and power pools Requires load curtailment of 60 hours or more per year for up to 6 hours at a time Penalties for non-compliance Operates for the benefit of large C&I customers Identifies handful of hours per year that c
Slide 44: PJM Opportunities
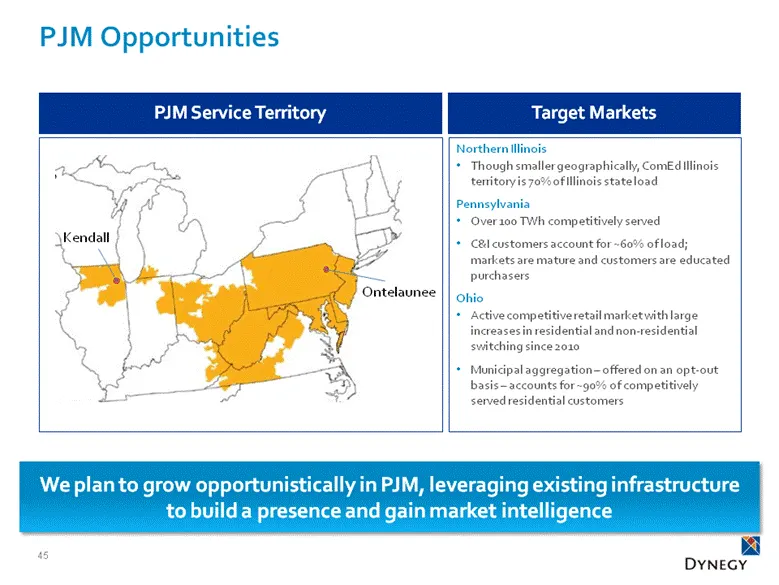
45 PJM Opportunities Ontelaunee Kendall PJM Service Territory Target Markets Northern Illinois Though smaller geographically, ComEd Illinois territory is 70% of Illinois state load Pennsylvania Over 100 TWh competitively served C&I customers account for ~60% of load; markets are mature and customers
Slide 45: Regulatory Policy
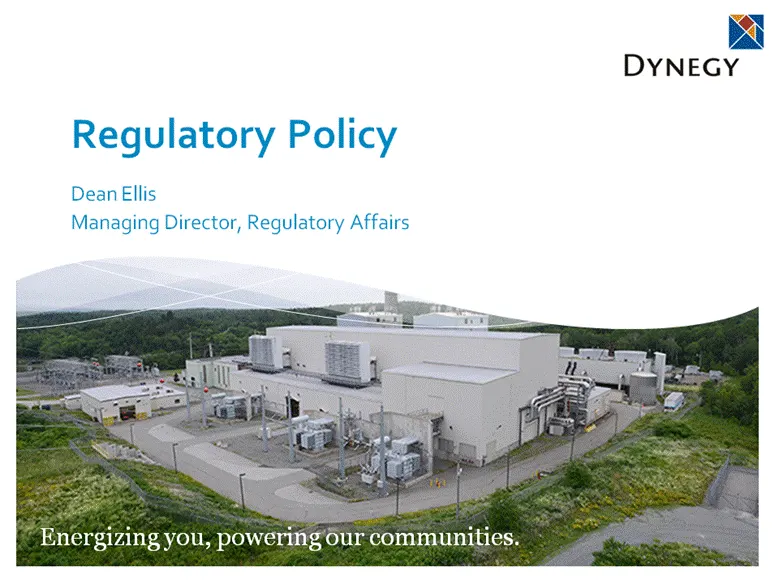
Regulatory Policy Dean Ellis Managing Director, Regulatory Affairs
Slide 46: Regulatory Approach
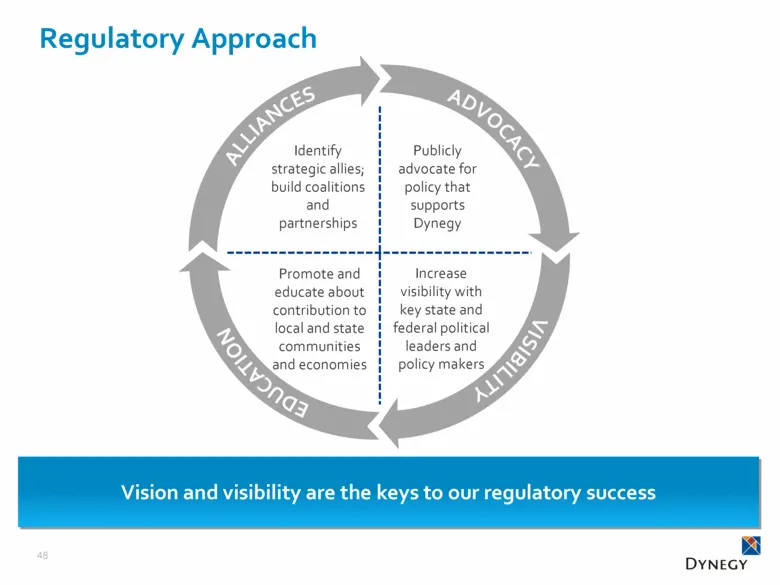
Regulatory Approach 48 Identify strategic allies; build coalitions and partnerships Publicly advocate for policy that supports Dynegy Promote and educate about contribution to local and state communities and economies Increase visibility with key state and federal political leaders and policy makers
Slide 47: Regulatory Resources
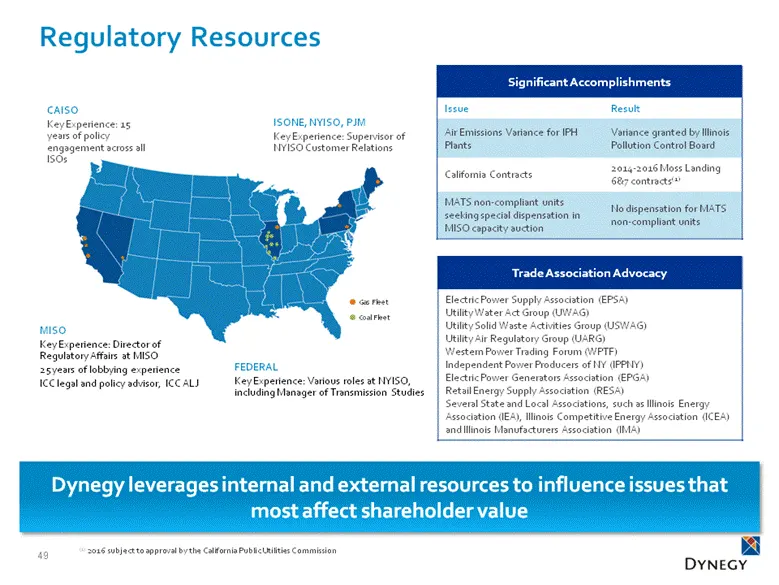
Gas Fleet Coal Fleet Regulatory Resources 49 ISONE, NYISO, PJM Key Experience: Supervisor of NYISO Customer Relations CAISO Key Experience: 15 years of policy engagement across all ISOs FEDERAL Key Experience: Various roles at NYISO, including Manager of Transmission Studies Trade Association Advoca
Slide 48: Goals and Strategy for Highest Priority Issues
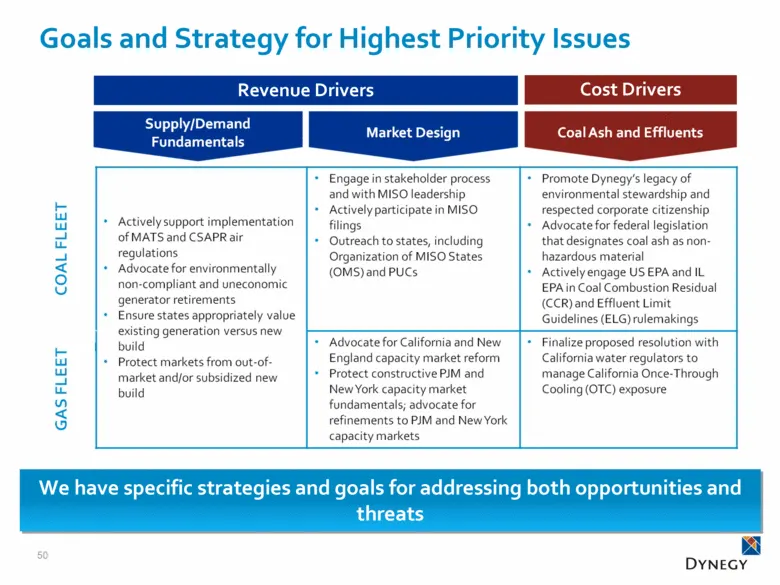
Goals and Strategy for Highest Priority Issues 50 Revenue Drivers Cost Drivers We have specific strategies and goals for addressing both opportunities and threats
Slide 49: Meeting New Build Challenge in MISO
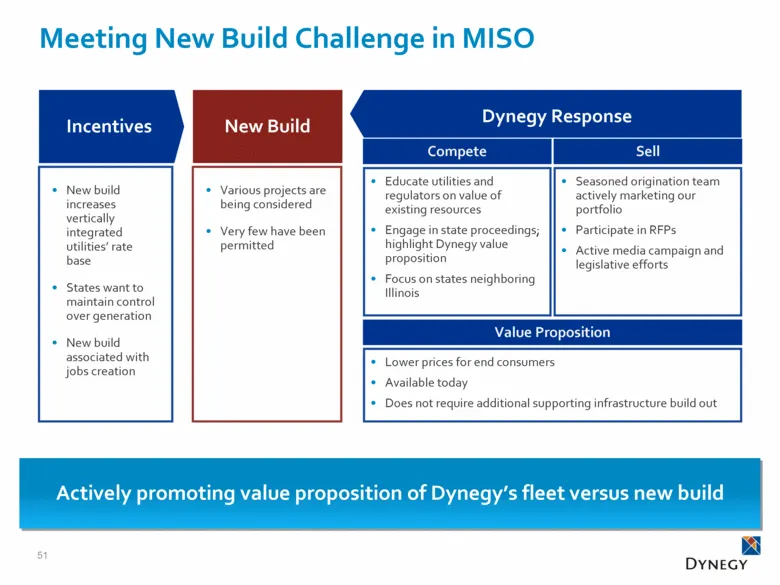
Meeting New Build Challenge in MISO 51 Actively promoting value proposition of Dynegy’s fleet versus new build Incentives New Build Dynegy Response Compete Educate utilities and regulators on value of existing resources Engage in state proceedings; highlight Dynegy value proposition Focus on states
Slide 50: EPA Effluent Limit Guidelines – Assumed Compliance Requirements
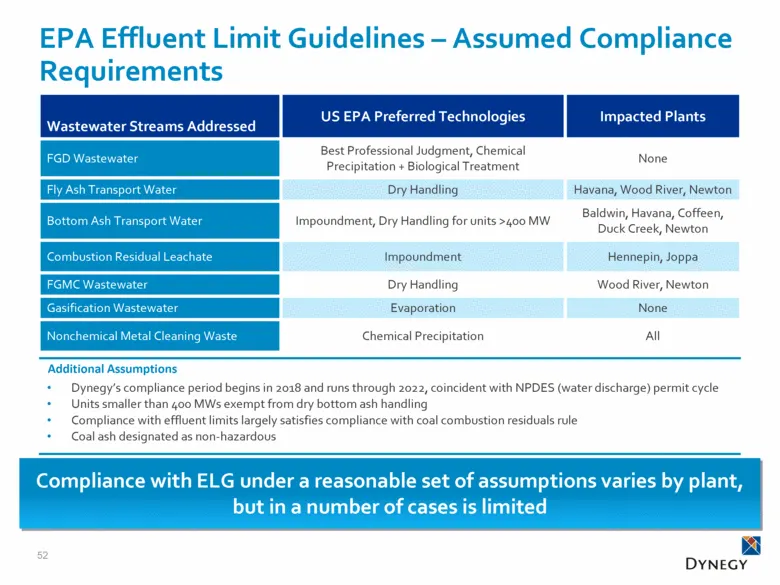
EPA Effluent Limit Guidelines – Assumed Compliance Requirements 52 Wastewater Streams Addressed US EPA Preferred Technologies Impacted Plants FGD Wastewater Best Professional Judgment, Chemical Precipitation + Biological Treatment None Fly Ash Transport Water Dry Handling Havana, Wood River, Newton
Slide 51: Assumed Compliance Timeline: ELG and CCR
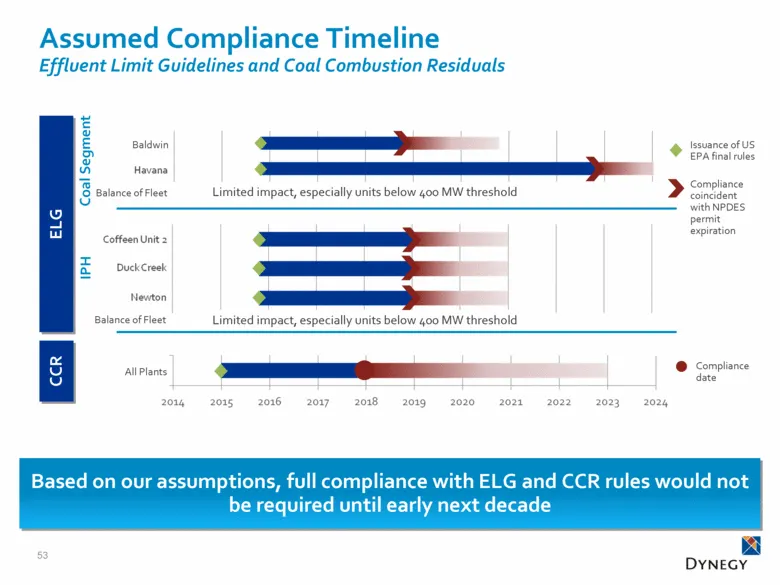
Limited impact, especially units below 400 MW threshold Assumed Compliance Timeline Effluent Limit Guidelines and Coal Combustion Residuals 53 Coal Segment IPH ELG CCR Based on our assumptions, full compliance with ELG and CCR rules would not be required until early next decade Issuance of US EPA fi
Slide 52: Assumed Compliance Timeline: Once-Through Cooling Rules
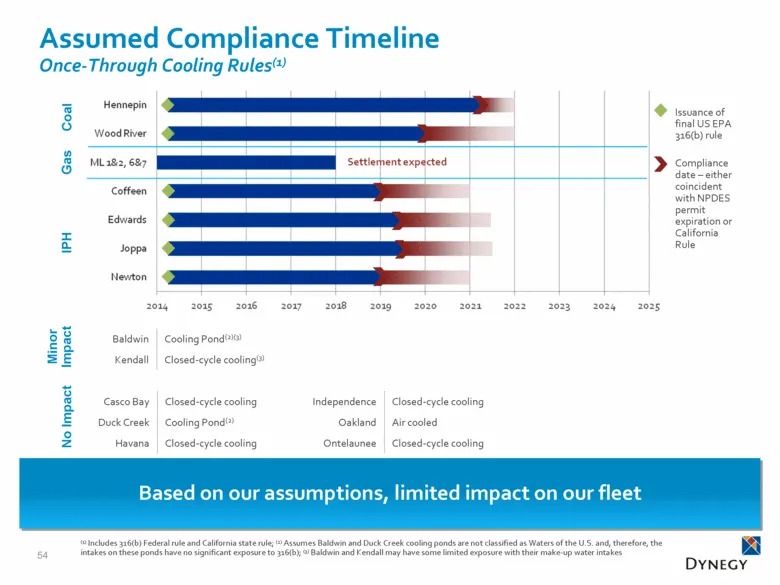
Assumed Compliance Timeline Once-Through Cooling Rules(1) 54 Coal IPH Issuance of final US EPA 316(b) rule Compliance date – either coincident with NPDES permit expiration or California Rule No Impact Gas (1) Includes 316(b) Federal rule and California state rule; (2) Assumes Baldwin and Duck Creek
Slide 53: Regulatory Summary
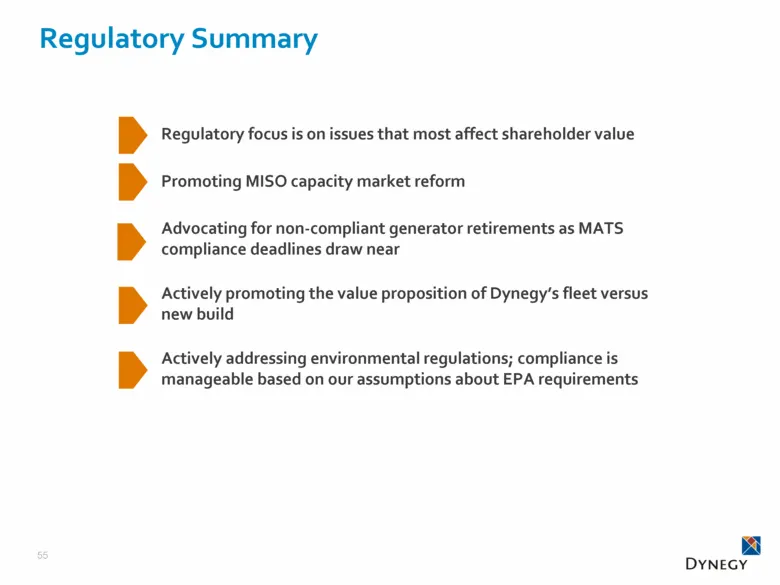
Regulatory Summary 55 Regulatory focus is on issues that most affect shareholder value Promoting MISO capacity market reform Advocating for non-compliant generator retirements as MATS compliance deadlines draw near Actively promoting the value proposition of Dynegy’s fleet versus new build Actively
Slide 54: Coal Operations
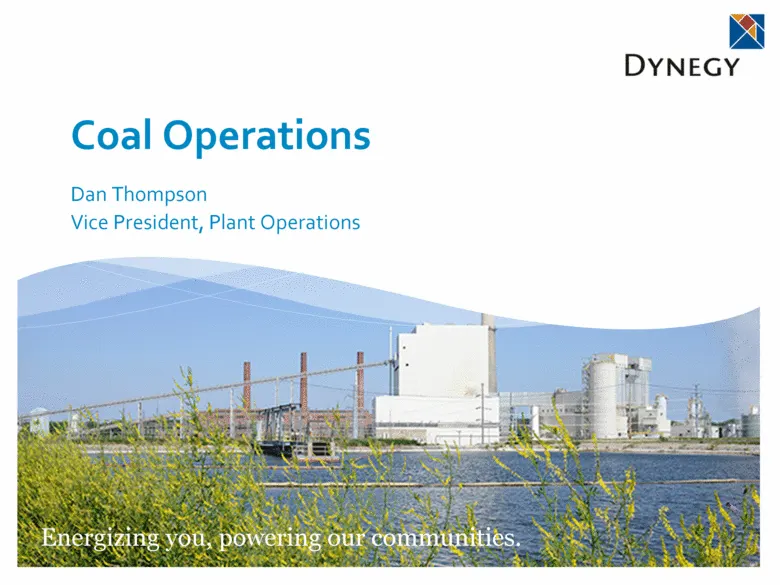
Coal Operations Dan Thompson Vice President, Plant Operations
Slide 55: Coal Operations Snapshot
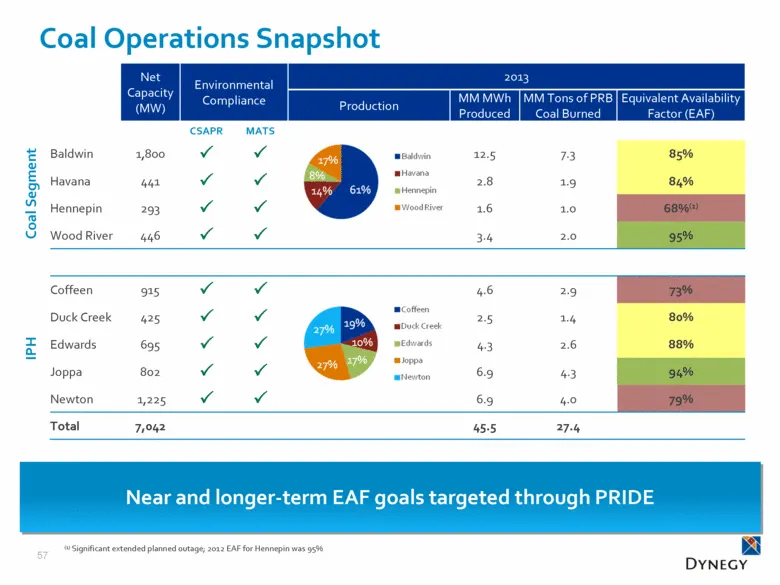
Net Capacity (MW) Environmental Compliance 2013 Production MM MWh Produced MM Tons of PRB Coal Burned Equivalent Availability Factor (EAF) CSAPR MATS Baldwin 1,800 P P 12.5 7.3 85% Havana 441 P P 2.8 1.9 84% Hennepin 293 P P 1.6 1.0 68%(1) Wood River 446 P P 3.4 2.0 95% Coffeen 915 P P 4.6 2.9 73% D
Slide 56: Environmental Equipment
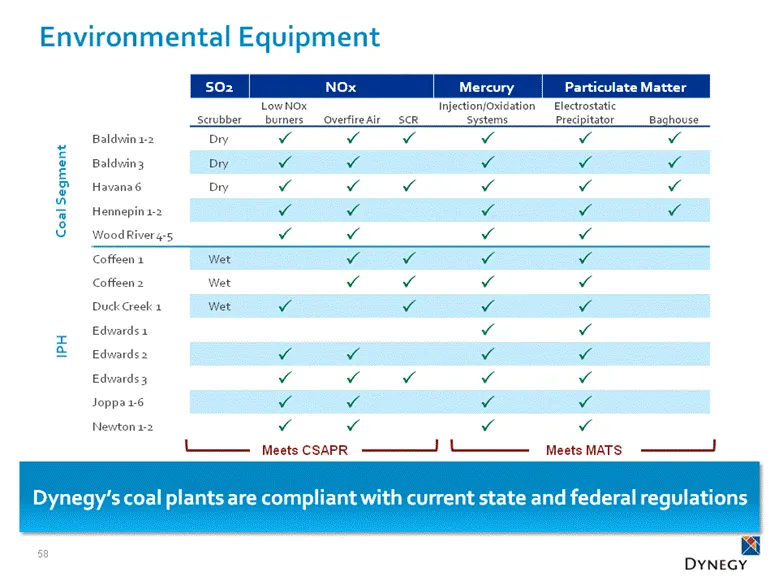
58 Environmental Equipment SO2 NOx Mercury Particulate Matter Scrubber Low NOx burners Overfire Air SCR Injection/Oxidation Systems Electrostatic Precipitator Baghouse Baldwin 1-2 Dry P P P P P P Baldwin 3 Dry P P P P P Havana 6 Dry P P P P P P Hennepin 1-2 P P P P P Wood River 4-5 P P P P Coffeen 1
Slide 57: IPH Plant Profile – Coffeen, Newton and Joppa
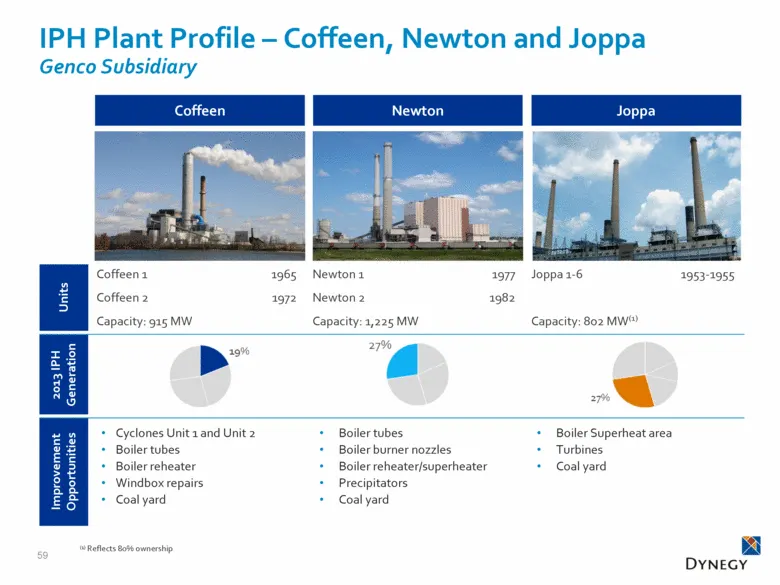
IPH Plant Profile – Coffeen, Newton and Joppa Genco Subsidiary Coffeen Newton Joppa 2013 IPH Generation Improvement Opportunities Cyclones Unit 1 and Unit 2 Boiler tubes Boiler reheater Windbox repairs Coal yard Boiler tubes Boiler burner nozzles Boiler reheater/superheater Precipitators Coal yard B
Slide 58: IPH Plant Profile – Duck Creek and Edwards
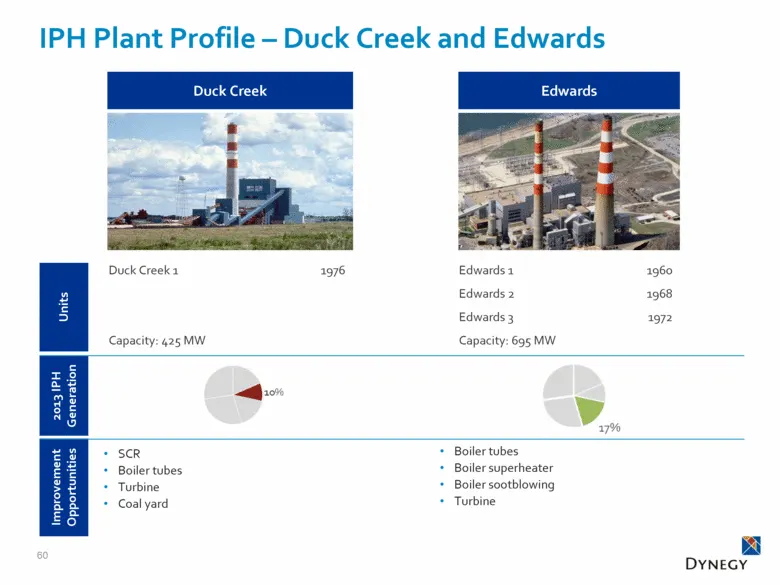
IPH Plant Profile – Duck Creek and Edwards Duck Creek Edwards Units Duck Creek 1 1976 Edwards 1 1960 Edwards 2 1968 Edwards 3 1972 Capacity: 425 MW Capacity: 695 MW 2013 IPH Generation Improvement Opportunities Boiler tubes Boiler superheater Boiler sootblowing Turbine SCR Boiler tubes Turbine Coal
Slide 59: Coal Operations Operating Expense and Capital Spending
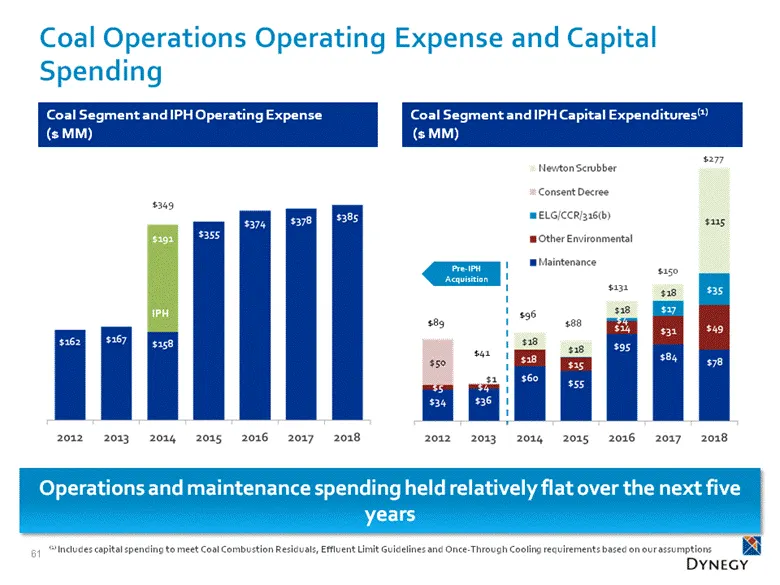
Coal Operations Operating Expense and Capital Spending Operations and maintenance spending held relatively flat over the next five years (1) Includes capital spending to meet Coal Combustion Residuals, Effluent Limit Guidelines and Once-Through Cooling requirements based on our assumptions 61 Coal S
Slide 60: ELG and CCR Compliance Assumptions – Spend Profile
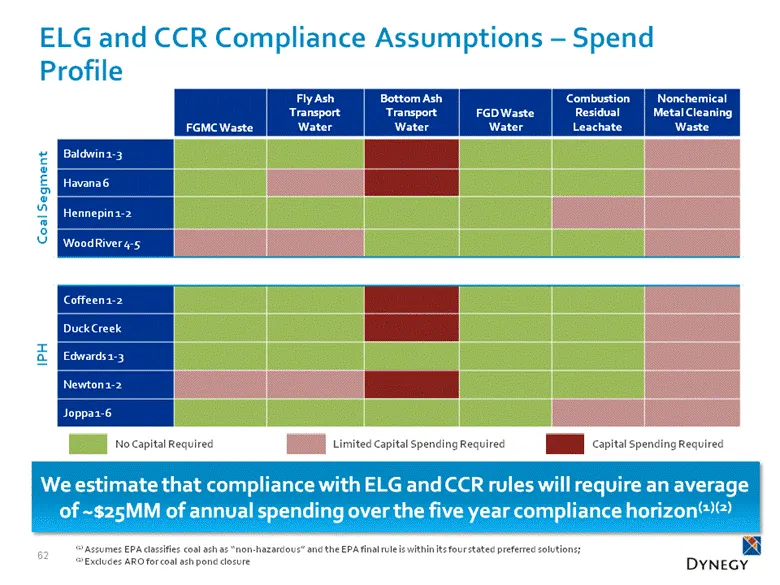
62 FGMC Waste Fly Ash Transport Water Bottom Ash Transport Water FGD Waste Water Combustion Residual Leachate Nonchemical Metal Cleaning Waste Baldwin 1-3 Havana 6 Hennepin 1-2 Wood River 4-5 Coffeen 1-2 Duck Creek Edwards 1-3 Newton 1-2 Joppa 1-6 Coal Segment IPH We estimate that compliance with EL
Slide 61: OTC Compliance Assumptions – Spend Profile
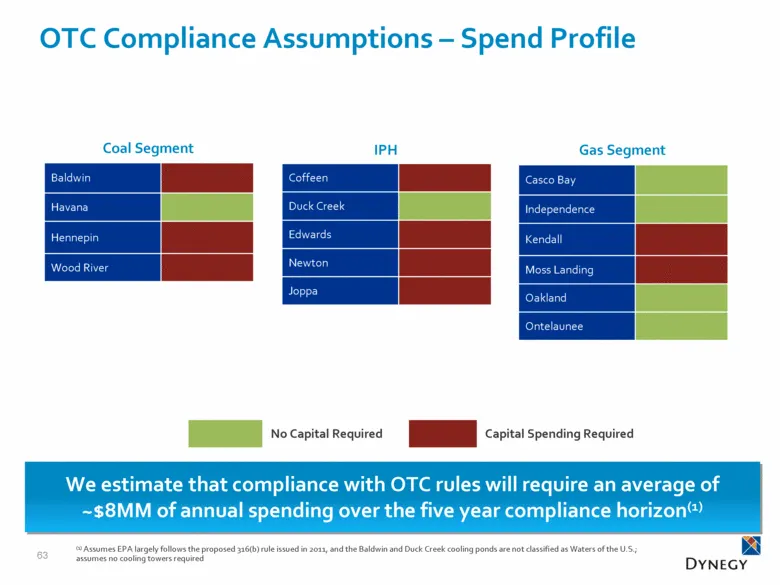
OTC Compliance Assumptions – Spend Profile 63 Coal Segment Baldwin Havana Hennepin Wood River We estimate that compliance with OTC rules will require an average of ~$8MM of annual spending over the five year compliance horizon(1) (1) Assumes EPA largely follows the proposed 316(b) rule issued in 201
Slide 62: Coal Plant Operations Summary
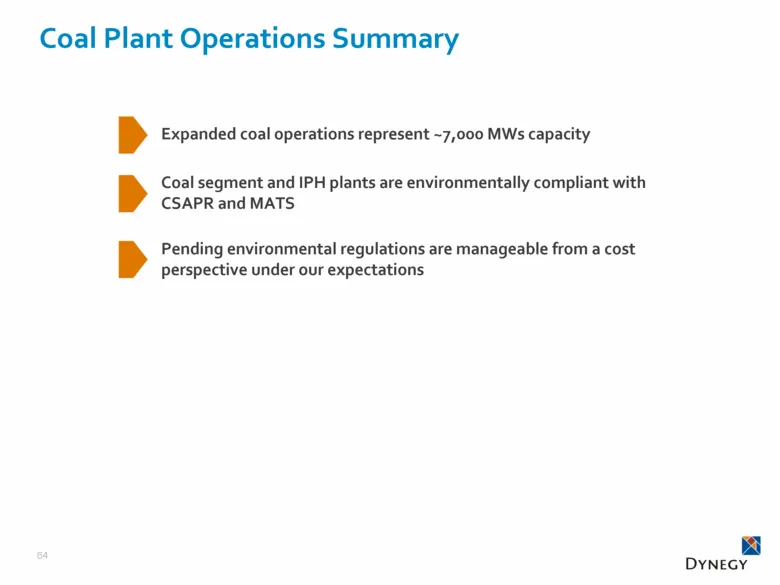
Coal Plant Operations Summary 64 Expanded coal operations represent ~7,000 MWs capacity Coal segment and IPH plants are environmentally compliant with CSAPR and MATS Pending environmental regulations are manageable from a cost perspective under our expectations
Slide 63: PRIDE Reloaded
PRIDE Reloaded Jeff Coyle Vice President, Operations Support
Slide 64: Operations Support
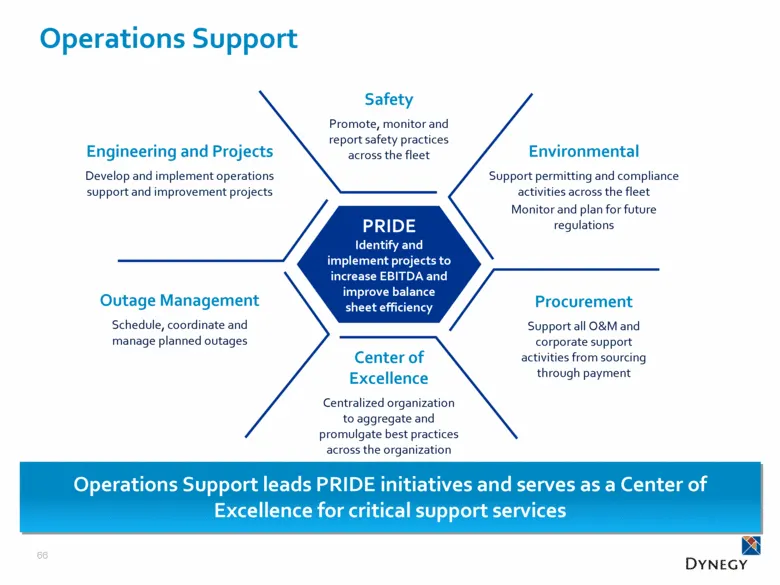
Safety Promote, monitor and report safety practices across the fleet Environmental Support permitting and compliance activities across the fleet Monitor and plan for future regulations Outage Management Schedule, coordinate and manage planned outages Procurement Support all O&M and corporate support
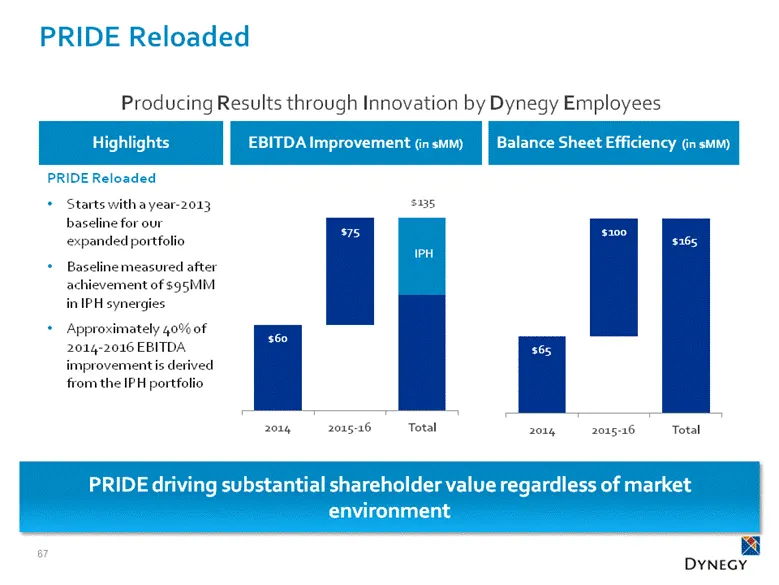
Slide 65: PRIDE Reloaded EBITDA Improvement and Balance Sheet Efficiency
EBITDA Improvement (in $MM) Balance Sheet Efficiency (in $MM) 67 PRIDE Reloaded PRIDE Reloaded Starts with a year-2013 baseline for our expanded portfolio Baseline measured after achievement of $95MM in IPH synergies Approximately 40% of 2014-2016 EBITDA improvement is derived from the IPH portfolio
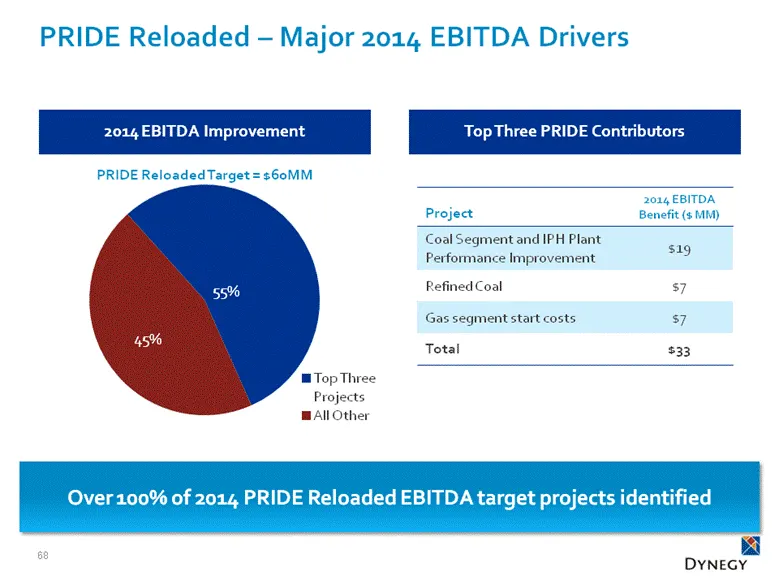
Slide 66: PRIDE Reloaded – Major 2014 EBITDA Drivers
PRIDE Reloaded – Major 2014 EBITDA Drivers 68 2014 EBITDA Improvement Top Three PRIDE Contributors Project 2014 EBITDA Benefit ($ MM) Coal Segment and IPH Plant Performance Improvement $19 Refined Coal $7 Gas segment start costs $7 Total $33 Over 100% of 2014 PRIDE Reloaded EBITDA target projects id
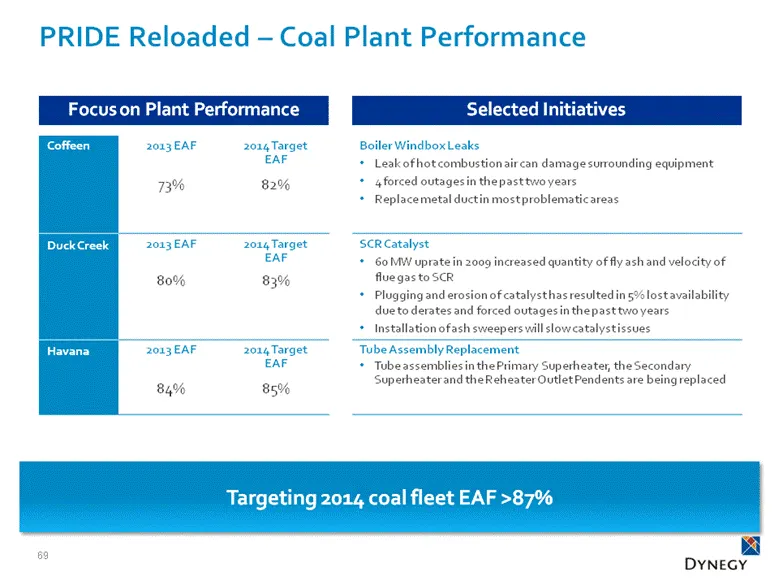
Slide 67: PRIDE Reloaded – Coal Plant Performance
PRIDE Reloaded – Coal Plant Performance 69 Focus on Plant Performance Selected Initiatives Coffeen 2013 EAF 2014 Target EAF Boiler Windbox Leaks Leak of hot combustion air can damage surrounding equipment 4 forced outages in the past two years Replace metal duct in most problematic areas 73% 82% Duc
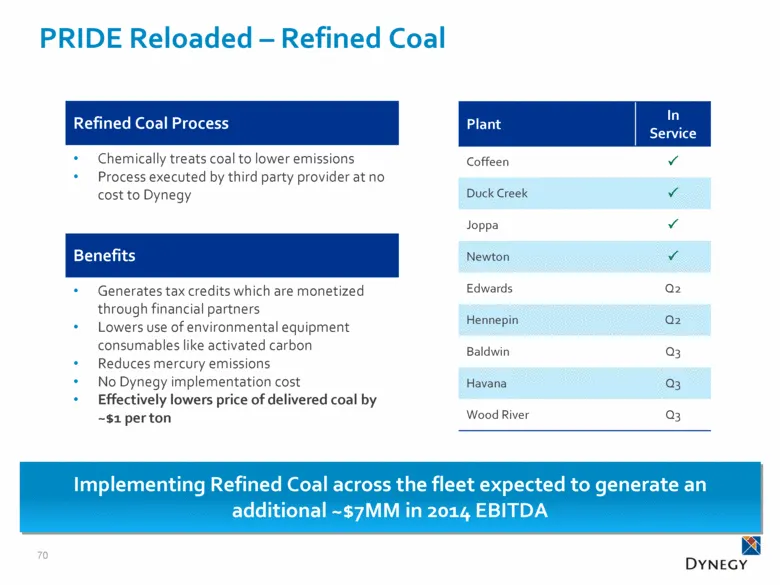
Slide 68: PRIDE Reloaded – Refined Coal
PRIDE Reloaded – Refined Coal 70 Plant In Service Coffeen P Duck Creek P Joppa P Newton P Edwards Q2 Hennepin Q2 Baldwin Q3 Havana Q3 Wood River Q3 Implementing Refined Coal across the fleet expected to generate an additional ~$7MM in 2014 EBITDA Refined Coal Process Chemically treats coal to lower
Slide 69: PRIDE Reloaded - Recycled Coal Ash
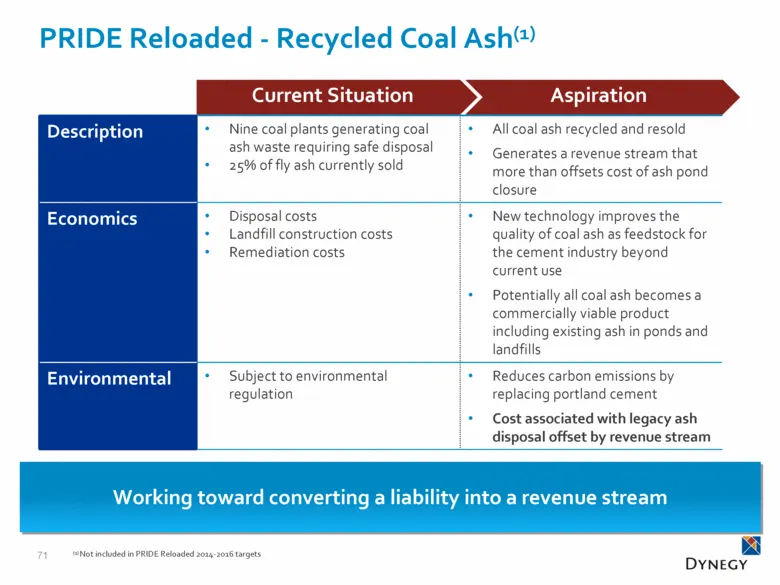
PRIDE Reloaded - Recycled Coal Ash(1) 71 Working toward converting a liability into a revenue stream Current Situation Aspiration Description Nine coal plants generating coal ash waste requiring safe disposal 25% of fly ash currently sold All coal ash recycled and resold Generates a revenue stream t
Slide 70: PRIDE Reloaded Summary
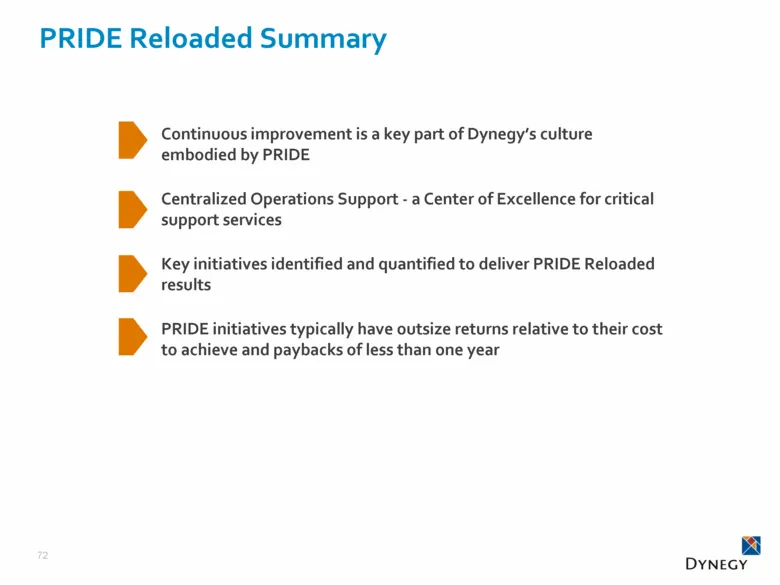
PRIDE Reloaded Summary 72 Continuous improvement is a key part of Dynegy’s culture embodied by PRIDE Centralized Operations Support - a Center of Excellence for critical support services Key initiatives identified and quantified to deliver PRIDE Reloaded results PRIDE initiatives typically have outs
Slide 71: Financial
Financial Clint Freeland CFO
Slide 72: Strategic Financial Objectives
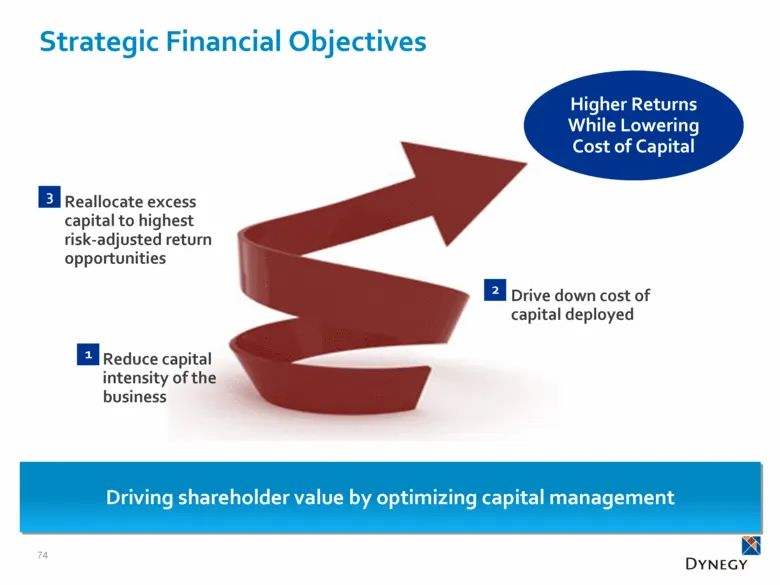
Strategic Financial Objectives Reduce capital intensity of the business Reallocate excess capital to highest risk-adjusted return opportunities Drive down cost of capital deployed 1 2 3 Driving shareholder value by optimizing capital management Higher Returns While Lowering Cost of Capital 74
Slide 73: Balance Sheet Optimization
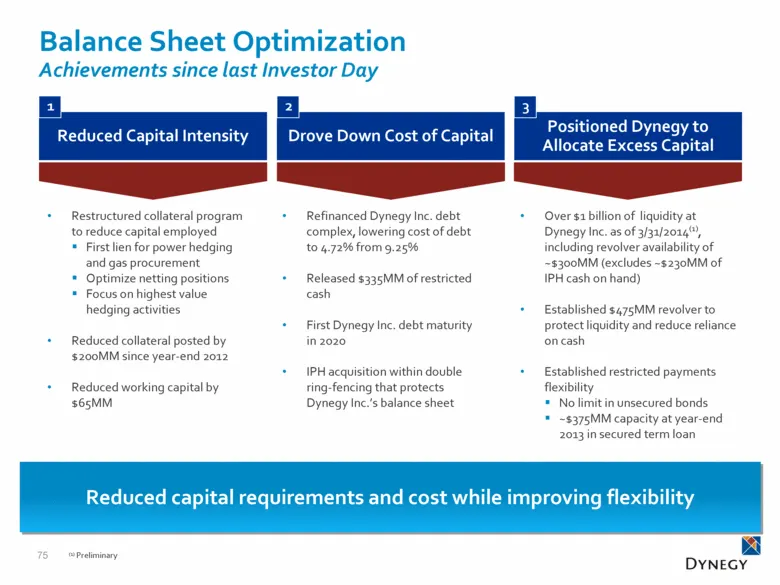
Balance Sheet Optimization Achievements since last Investor Day Restructured collateral program to reduce capital employed First lien for power hedging and gas procurement Optimize netting positions Focus on highest value hedging activities Reduced collateral posted by $200MM since year-end 2012 Red
Slide 74: 2014 Balance Sheet/Liquidity Initiatives
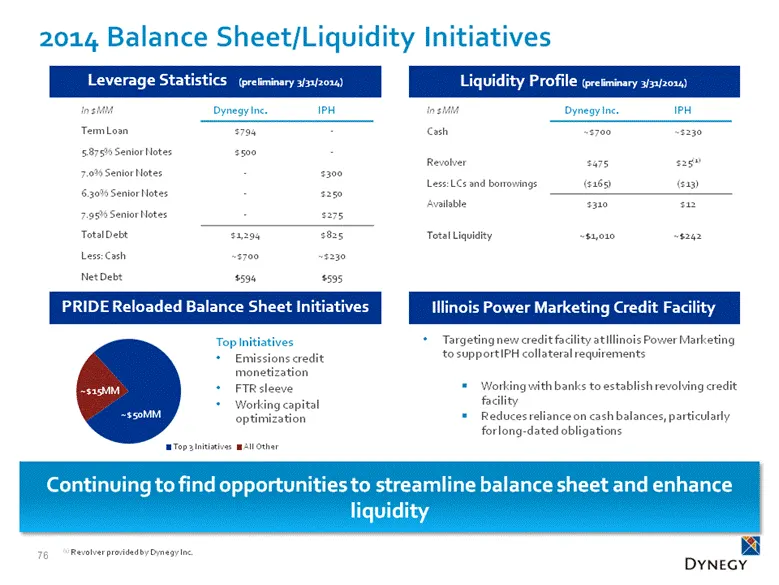
2014 Balance Sheet/Liquidity Initiatives 76 PRIDE Reloaded Balance Sheet Initiatives Top Initiatives Emissions credit monetization FTR sleeve Working capital optimization Illinois Power Marketing Credit Facility Targeting new credit facility at Illinois Power Marketing to support IPH collateral requ
Slide 75: Driving Improvements in ROIC and Leveraging Upside
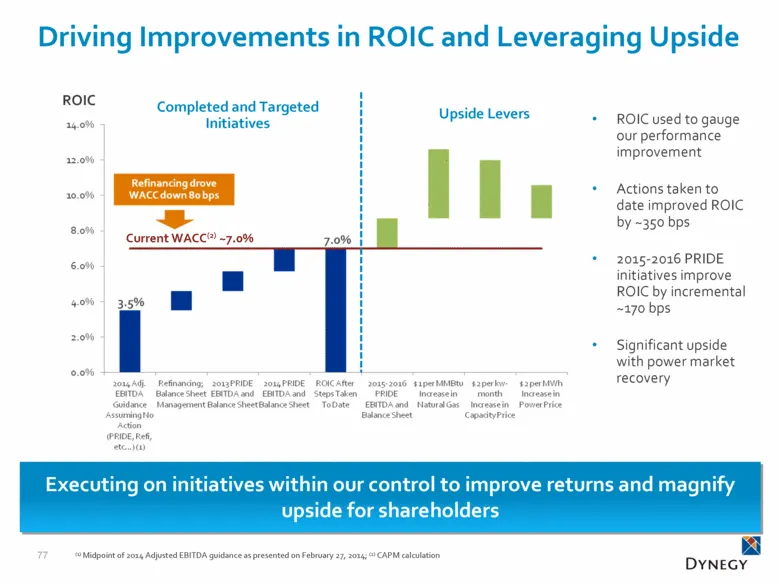
Driving Improvements in ROIC and Leveraging Upside 77 ROIC Completed and Targeted Initiatives Upside Levers Executing on initiatives within our control to improve returns and magnify upside for shareholders ROIC used to gauge our performance improvement Actions taken to date improved ROIC by ~350 bp
Slide 76: Target Liquidity and Excess Capital
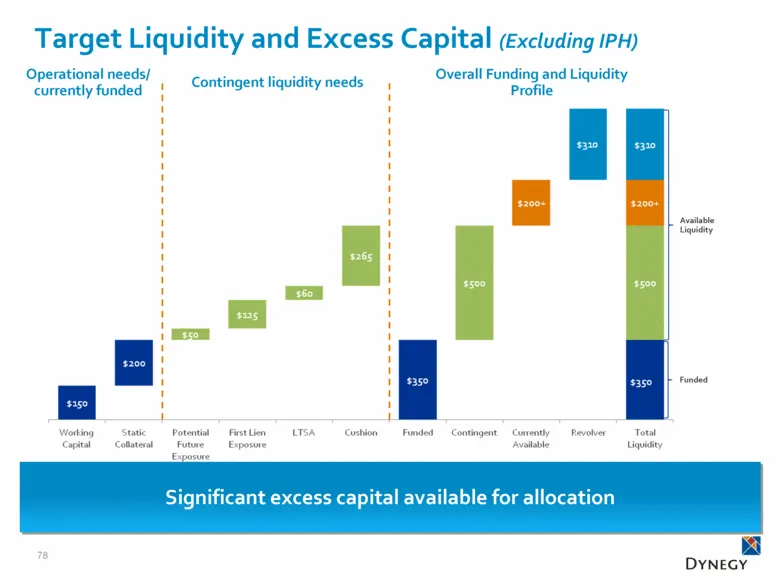
78 Target Liquidity and Excess Capital (Excluding IPH) Operational needs/ currently funded Available Liquidity Funded Significant excess capital available for allocation Overall Funding and Liquidity Profile Contingent liquidity needs
Slide 77: Capital Allocation
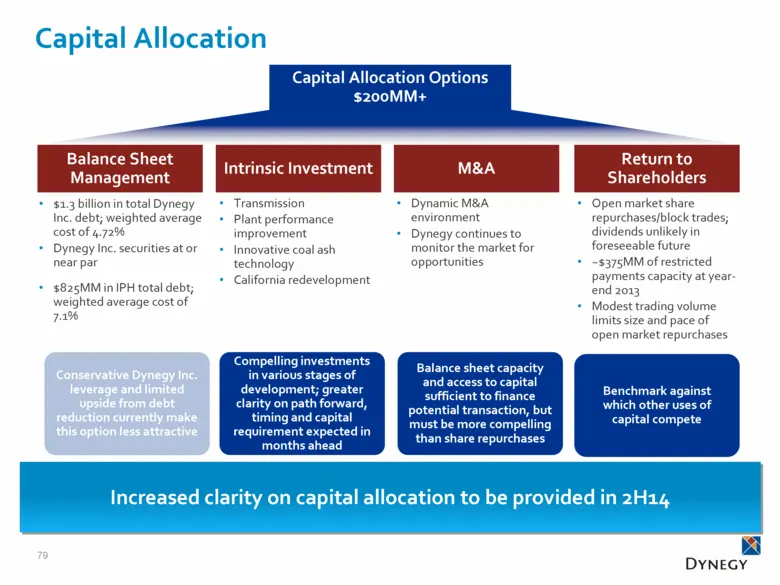
79 Capital Allocation Increased clarity on capital allocation to be provided in 2H14 Capital Allocation Options $200MM+ Balance Sheet Management Intrinsic Investment M&A Return to Shareholders $1.3 billion in total Dynegy Inc. debt; weighted average cost of 4.72% Dynegy Inc. securities at or near pa
Slide 78: Segment Level Unhedged EBITDA and FCF By Plant
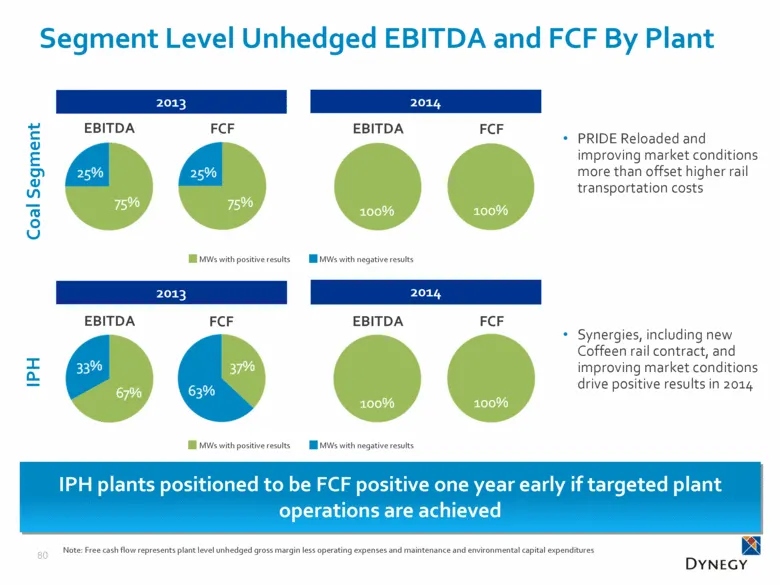
MWs with negative results PRIDE Reloaded and improving market conditions more than offset higher rail transportation costs Segment Level Unhedged EBITDA and FCF By Plant 80 Coal Segment 2013 2014 EBITDA EBITDA FCF FCF MWs with positive results MWs with negative results 2013 2014 EBITDA EBITDA FCF FC
Slide 79: Earnings Potential of Existing Dynegy Fleet
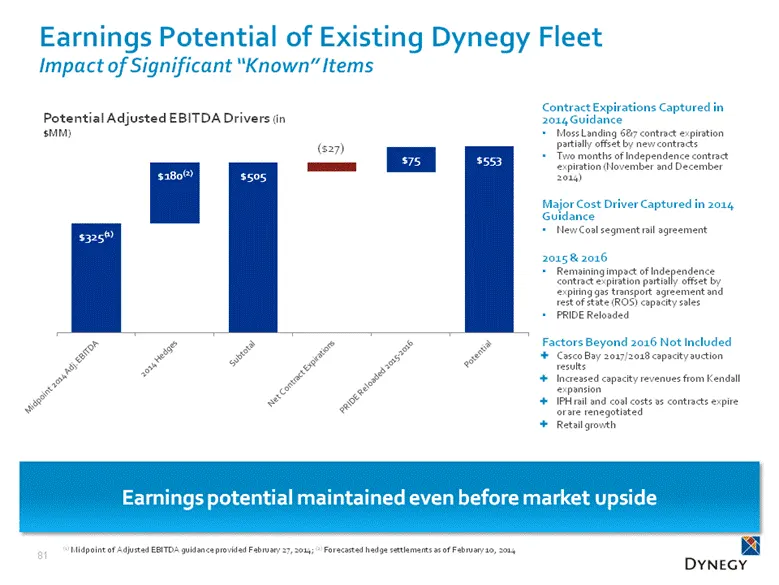
Earnings Potential of Existing Dynegy Fleet Impact of Significant “Known” Items 81 $325(1) Contract Expirations Captured in 2014 Guidance Moss Landing 6&7 contract expiration partially offset by new contracts Two months of Independence contract expiration (November and December 2014) Major Cost Driv
Slide 80: NOL Carryforwards Available to Shield Cash Taxes
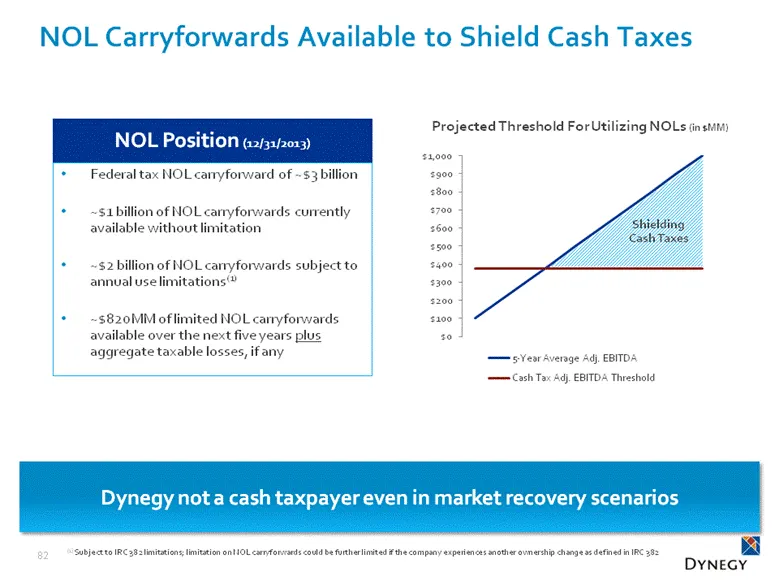
NOL Carryforwards Available to Shield Cash Taxes 82 Projected Threshold For Utilizing NOLs (in $MM) Shielding Cash Taxes NOL Position (12/31/2013) Federal tax NOL carryforward of ~$3 billion ~$1 billion of NOL carryforwards currently available without limitation ~$2 billion of NOL carryforwards subj
Slide 81: Finance Summary
Finance Summary 83 Dynegy remains focused on balance sheet efficiency in 2014 On an unhedged basis, all plants in the Dynegy and IPH fleet are expected to be FCF positive at the segment level and net contributors in 2014 toward IPH and DI overhead expenses Dynegy’s earnings power outlook remains rob
Slide 82: Closing Remarks and Panel Q&A
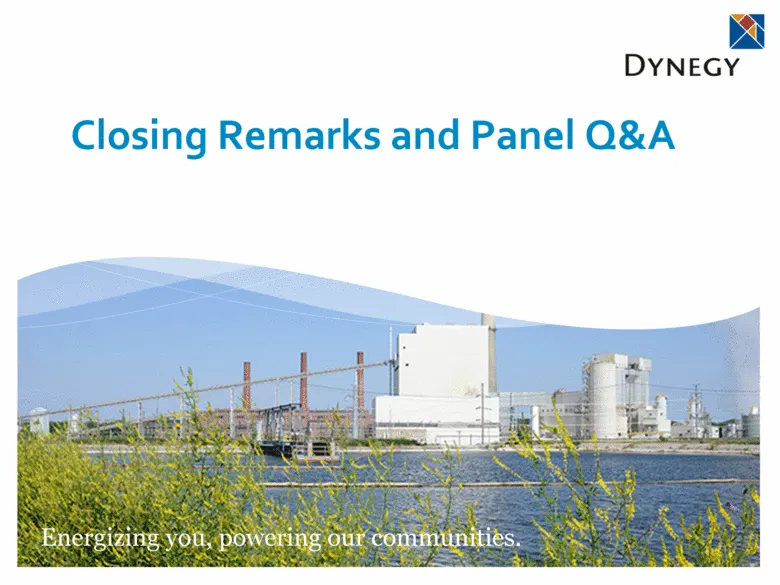
Closing Remarks and Panel Q&A
Slide 83: Themes from 2014 Investor Day
Themes from 2014 Investor Day 85 Levered to, but not dependent on MISO recovery “Overlooked” sources of upside by market Environmental capex requirements appear manageable Capital allocation opportunities and management track record Earnings potential in excess of $500MM
Slide 84: Appendix
Appendix
Slide 85: Our Executive Management Team
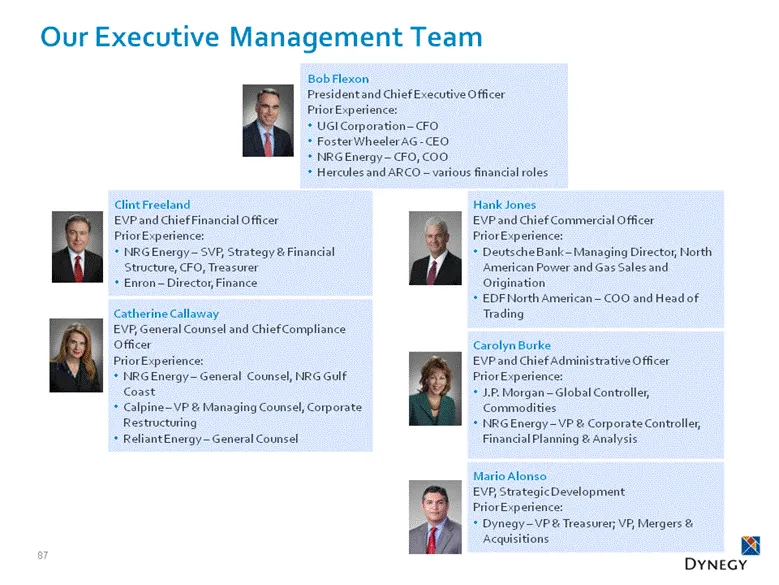
Our Executive Management Team 87 Hank Jones EVP and Chief Commercial Officer Prior Experience: Deutsche Bank – Managing Director, North American Power and Gas Sales and Origination EDF North American – COO and Head of Trading Carolyn Burke EVP and Chief Administrative Officer Prior Experience: J.P.
Slide 86: Board of Directors
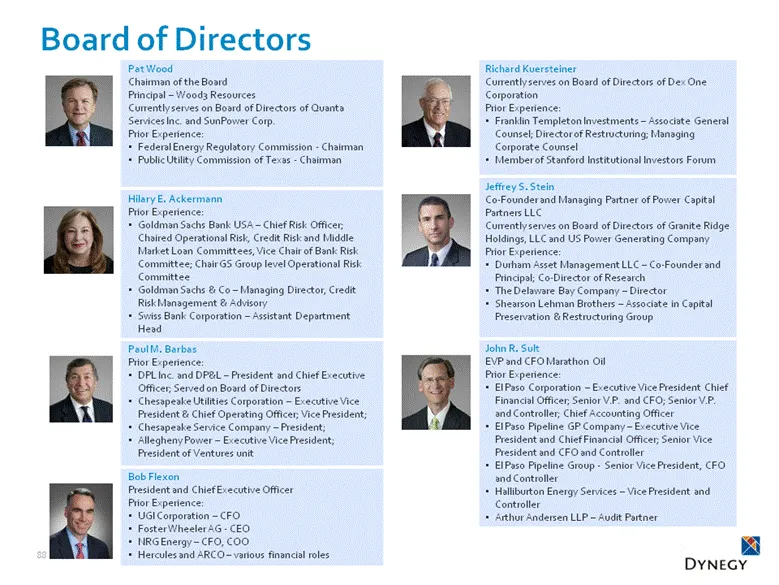
Pat Wood Chairman of the Board Principal – Wood3 Resources Currently serves on Board of Directors of Quanta Services Inc. and SunPower Corp. Prior Experience: Federal Energy Regulatory Commission - Chairman Public Utility Commission of Texas - Chairman Hilary E. Ackermann Prior Experience: Goldman S
Slide 87: Dynegy Generation Facilities
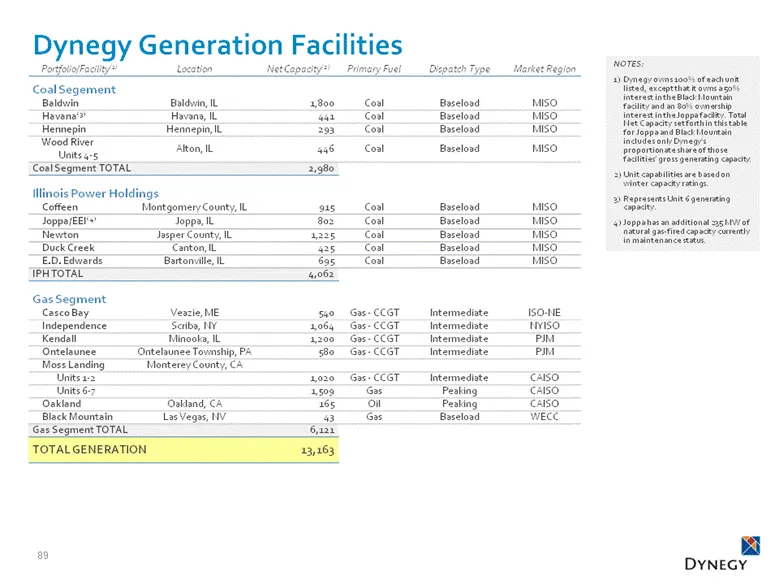
Dynegy Generation Facilities Portfolio/Facility(1) Location Net Capacity(2) Primary Fuel Dispatch Type Market Region Coal Segement Baldwin Baldwin, IL 1,800 Coal Baseload MISO Havana(3) Havana, IL 441 Coal Baseload MISO Hennepin Hennepin, IL 293 Coal Baseload MISO Wood River Units 4-5 Alton, IL 446
Slide 88: 2014 Adjusted EBITDA and Free Cash Flow Guidance
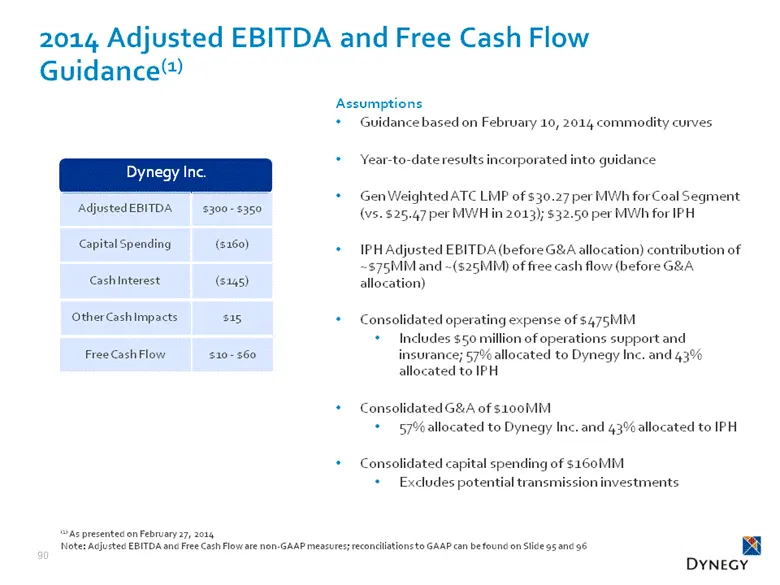
2014 Adjusted EBITDA and Free Cash Flow Guidance(1) 90 Dynegy Inc. Adjusted EBITDA $300 - $350 Capital Spending ($160) Cash Interest ($145) (1) As presented on February 27, 2014 Note: Adjusted EBITDA and Free Cash Flow are non-GAAP measures; reconciliations to GAAP can be found on Slide 95 and 96 As
Slide 89: Gas Segment: Tolling, Capacity and Other
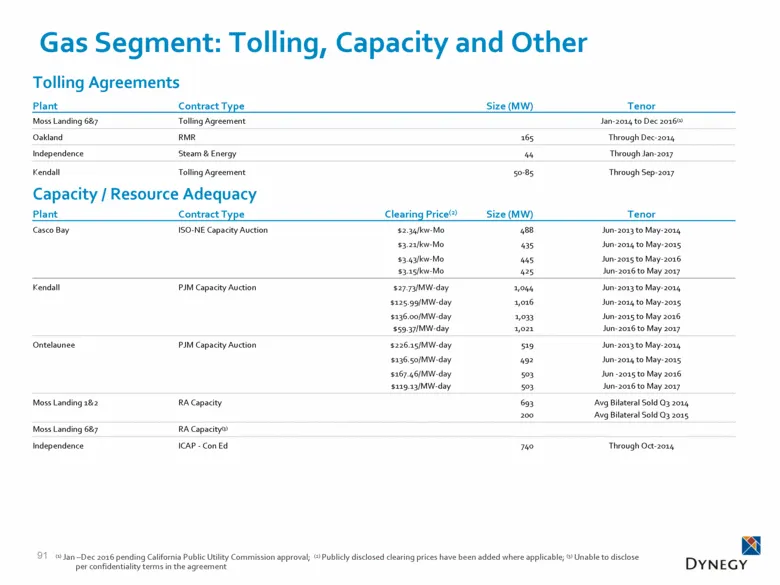
91 Gas Segment: Tolling, Capacity and Other Tolling Agreements Plant Contract Type Size (MW) Tenor Moss Landing 6&7 Tolling Agreement Jan-2014 to Dec 2016(1) Oakland RMR 165 Through Dec-2014 Independence Steam & Energy 44 Through Jan-2017 Kendall Tolling Agreement 50-85 Through Sep-2017 Capacity / R
Slide 90: Current Wastewater Technologies and Containment Methods
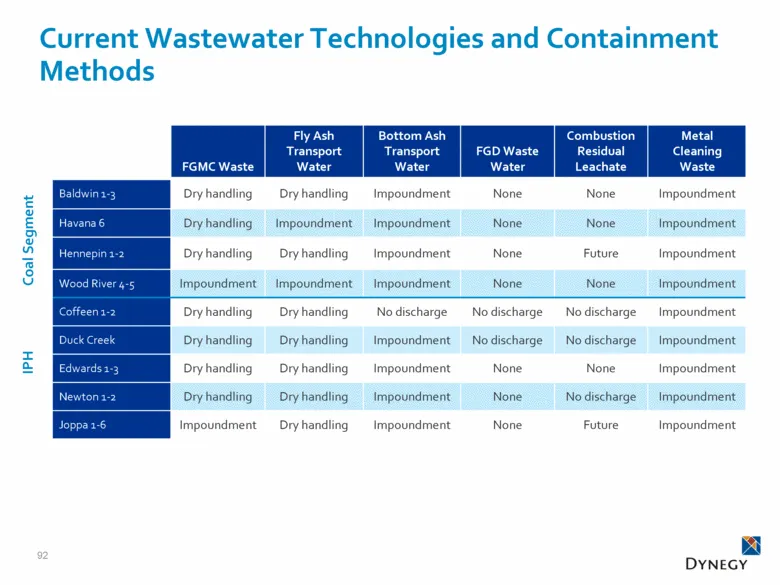
Current Wastewater Technologies and Containment Methods 92 FGMC Waste Fly Ash Transport Water Bottom Ash Transport Water FGD Waste Water Combustion Residual Leachate Nonchemical Metal Cleaning Waste Baldwin 1-3 Dry handling Dry handling Impoundment None None Impoundment Havana 6 Dry handling Impound
Slide 91: Links to reference material
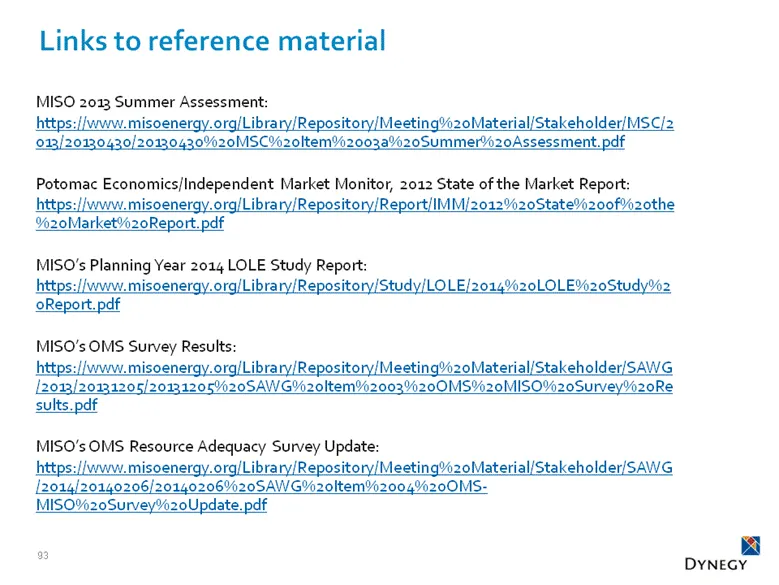
Links to reference material 93 MISO 2013 Summer Assessment: https://www.misoenergy.org/Library/Repository/Meeting%20Material/Stakeholder/MSC/2013/20130430/20130430%20MSC%20Item%2003a%20Summer%20Assessment.pdf Potomac Economics/Independent Market Monitor, 2012 State of the Market Report: https://www.
Slide 92: Appendix Reg G Reconciliations
Appendix Reg G Reconciliations 94
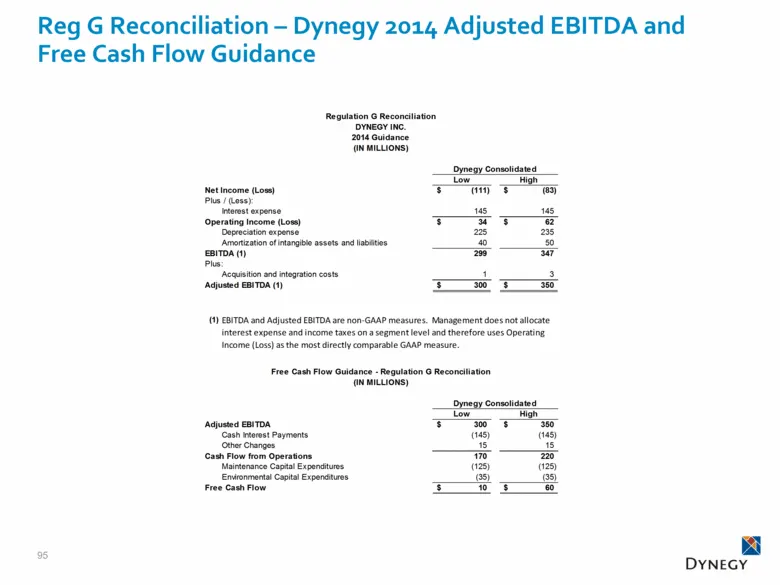
Slide 93: Reg G Reconciliation – Dynegy 2014 Adjusted EBITDA and Free Cash Flow Guidance
95 Reg G Reconciliation – Dynegy 2014 Adjusted EBITDA and Free Cash Flow Guidance Low High Net Income (Loss) (111) $ (83) $ Plus / (Less): Interest expense 145 145 Operating Income (Loss) 34 $ 62 $ Depreciation expense 225 235 Amortization of intangible assets and liabilities 40 50 EBITDA (1) 299 34
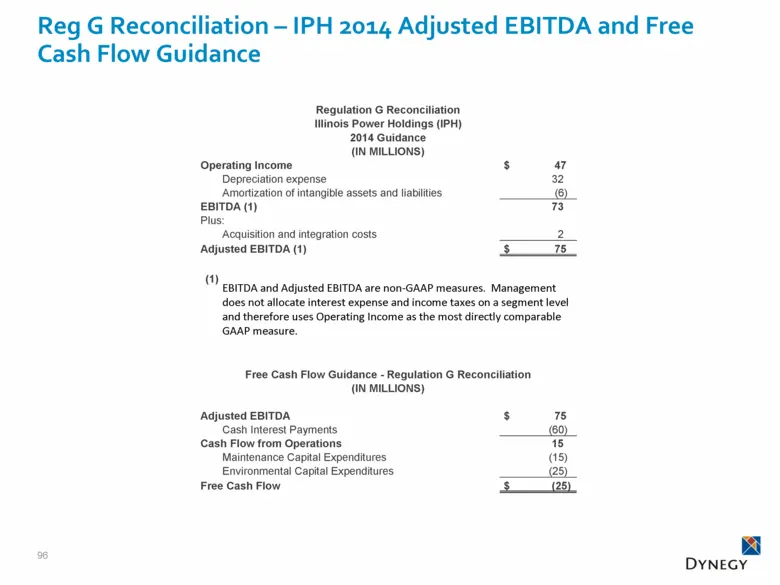
Slide 94: Reg G Reconciliation – IPH 2014 Adjusted EBITDA and Free Cash Flow Guidance
96 Reg G Reconciliation – IPH 2014 Adjusted EBITDA and Free Cash Flow Guidance Regulation G Reconciliation Illinois Power Holdings (IPH) 2014 Guidance (IN MILLIONS) Operating Income $ 47 Depreciation expense 32 Amortization of intangible assets and liabilities (6) EBITDA (1) 73 Plus: Acquisition and
Source: SEC EDGAR · 8-K filed Apr 11, 2014
More decks from Dynegy Inc
 FY2017 Earnings Presentation30 slides · Feb 26, 2018
 Debt Investor Presentation (December 2017)10 slides · Dec 11, 2017
 Merger or Acquisition (October 2017)28 slides · Oct 31, 2017
 Debt Investor Presentation (October 2016)44 slides · Oct 3, 2016
 IPO Roadshow (June 2016)17 slides · Jun 15, 2016
 Wolfe Trahan 2013 Utilities and Gas Conference29 slides · Sep 23, 2013