Dynegy — Wolfe Trahan 2013 Utilities and Gas Conference
29 slides from Dynegy's conference presentation, Sep 23, 2013
Slide 1: Wolfe Trahan 2013 Utilities and Gas Conference
Wolfe Trahan 2013 Utilities and Gas Conference September 24, 2013 Robert C. Flexon, President and CEO
Slide 2: Bank of America/Merrill Lynch Power and Gas Leaders Conference
Bank of America/Merrill Lynch Power and Gas Leaders Conference September 25, 2013 Robert C. Flexon, President and CEO
Slide 3: CRT Capital Group 2013 Investor Conference
CRT Capital Group 2013 Investor Conference September 23, 2013 Robert C. Flexon, President and CEO
Slide 4: Houlihan Lokey 2013 Energy Conference
Houlihan Lokey 2013 Energy Conference October 1, 2013 Robert C. Flexon, President and CEO
Slide 5: Forward-Looking Statements
Forward-Looking Statements Cautionary Statement Regarding Forward-Looking Statements This presentation contains statements reflecting assumptions, expectations, projections, intentions or beliefs about future events that are intended as “forward looking statements.” You can identify these statements
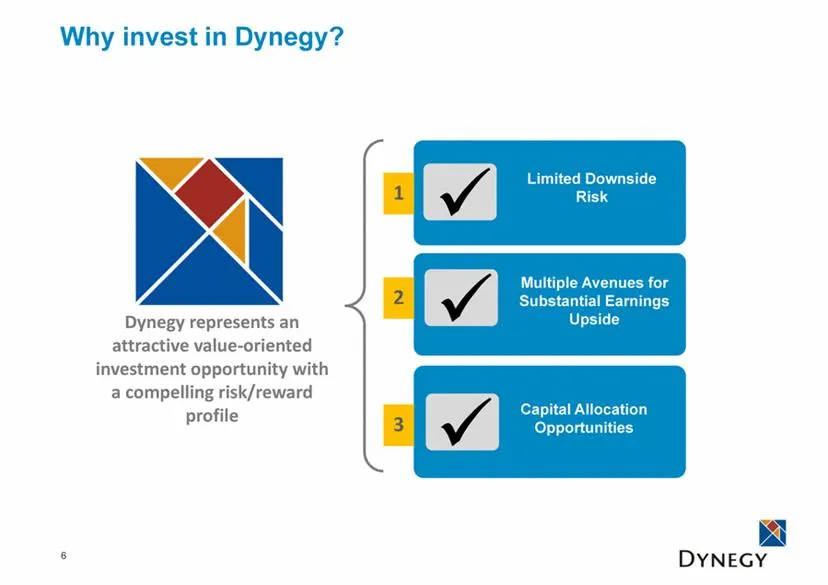
Slide 6: Why invest in Dynegy?
Why invest in Dynegy? 6 Dynegy represents an attractive value-oriented investment opportunity with a compelling risk/reward profile Capital Allocation Opportunities Multiple Avenues for Substantial Earnings Upside Limited Downside Risk 1 2 3
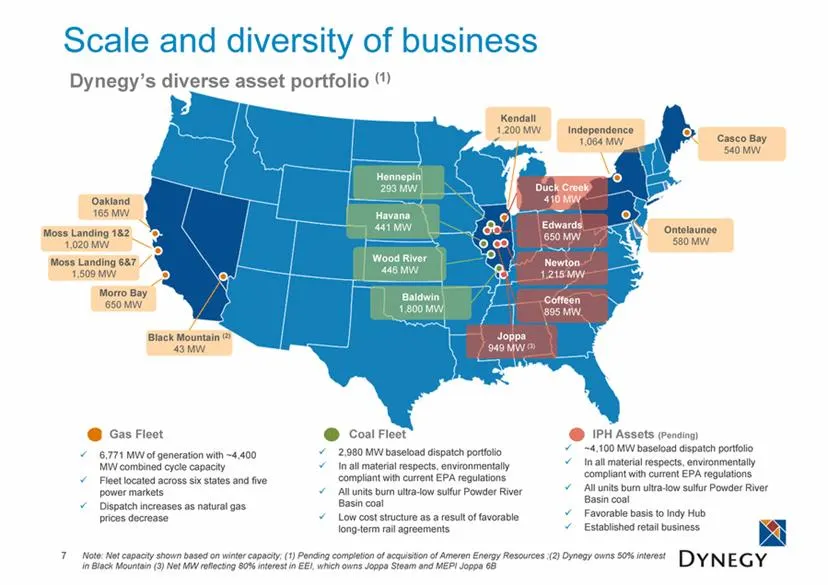
Slide 7: Scale and diversity of business
7 Scale and diversity of business Dynegy’s diverse asset portfolio (1) Oakland 165 MW Moss Landing 1&2 1,020 MW Moss Landing 6&7 1,509 MW Morro Bay 650 MW 6,771 MW of generation with ~4,400 MW combined cycle capacity Fleet located across six states and five power markets Dispatch increases as natura
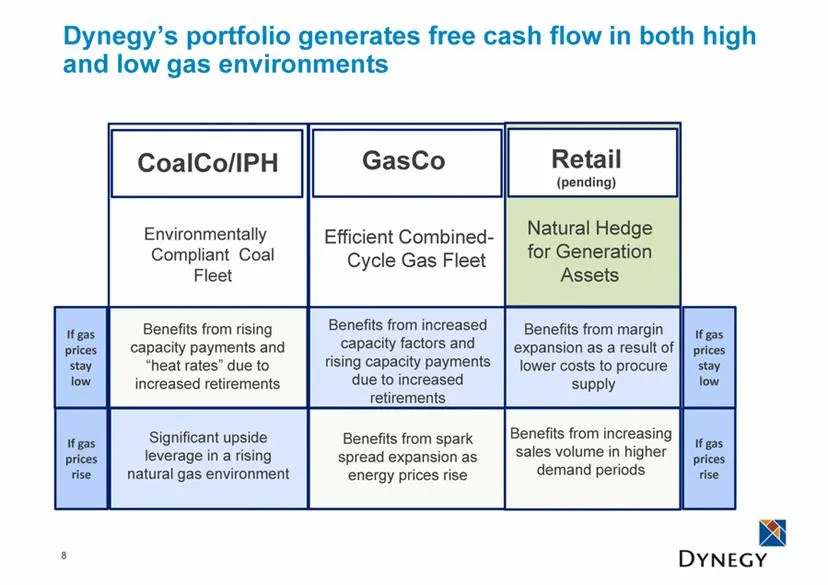
Slide 8: Portfolio generates free cash flow in both high and low gas environments
Dynegy’s portfolio generates free cash flow in both high and low gas environments 8 Environmentally Compliant Coal Fleet If gas prices stay low If gas prices rise Benefits from rising capacity payments and “heat rates” due to increased retirements Significant upside leverage in a rising natural gas
Slide 9: Ascribing all value to GasCo
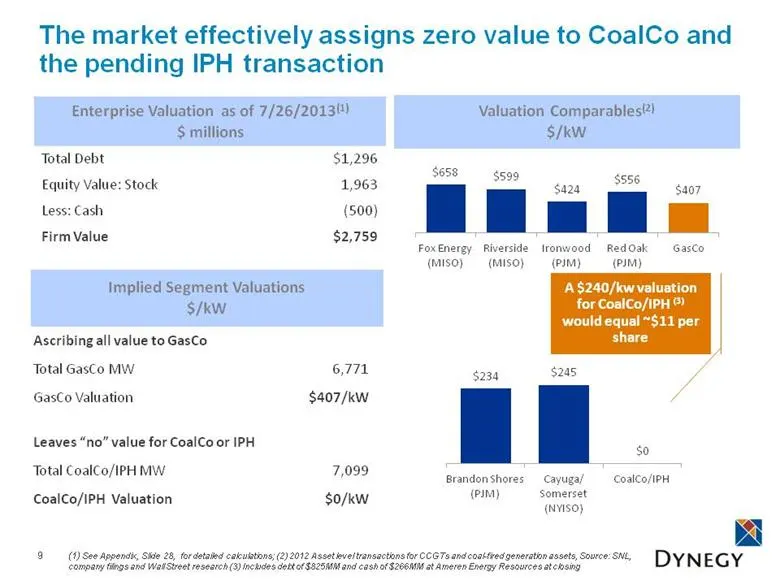
Ascribing all value to GasCo Total GasCo MW 6,771 GasCo Valuation $407/kW Leaves “no” value for CoalCo or IPH Total CoalCo/IPH MW 7,099 CoalCo/IPH Valuation $0/kW The market effectively assigns zero value to CoalCo and the pending IPH transaction 9 Enterprise Valuation as of 7/26/2013(1) $ millions
Slide 10: Dynegy Shareholder Value Drivers
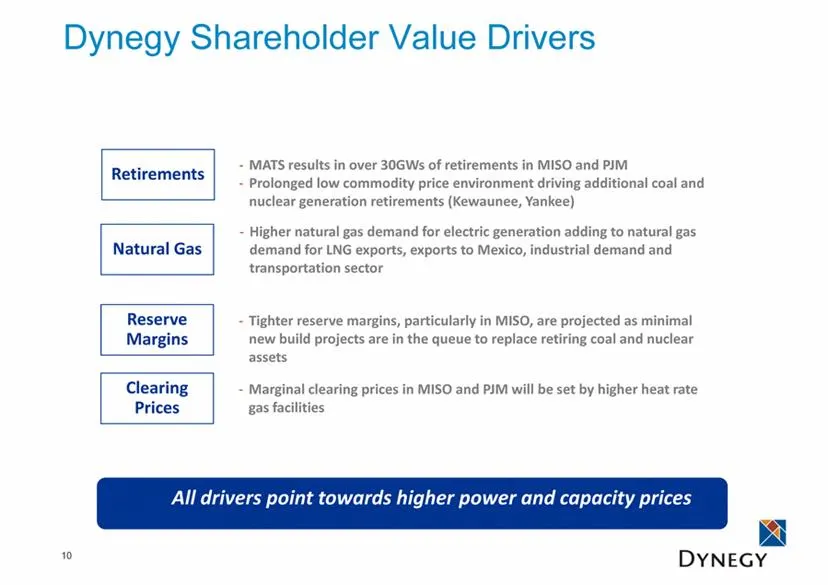
10 Dynegy Shareholder Value Drivers All drivers point towards higher power and capacity prices MATS results in over 30GWs of retirements in MISO and PJM Prolonged low commodity price environment driving additional coal and nuclear generation retirements (Kewaunee, Yankee) Retirements Natural Gas Hig
Slide 11: Adjusted EBITDA sensitivities to changing market conditions
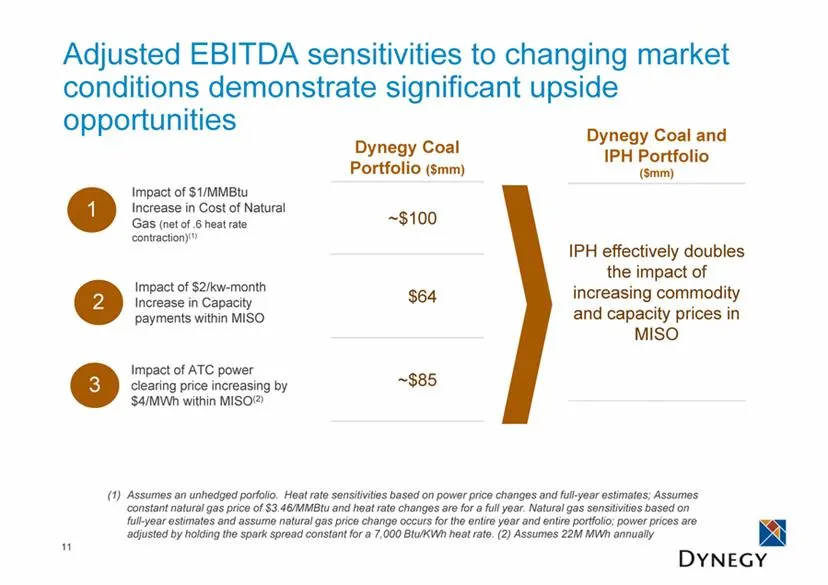
Adjusted EBITDA sensitivities to changing market conditions demonstrate significant upside opportunities (1) Assumes an unhedged porfolio. Heat rate sensitivities based on power price changes and full-year estimates; Assumes constant natural gas price of $3.46/MMBtu and heat rate changes are for a f
Slide 12: Retirement, supply and demand, and reserve margin outlook
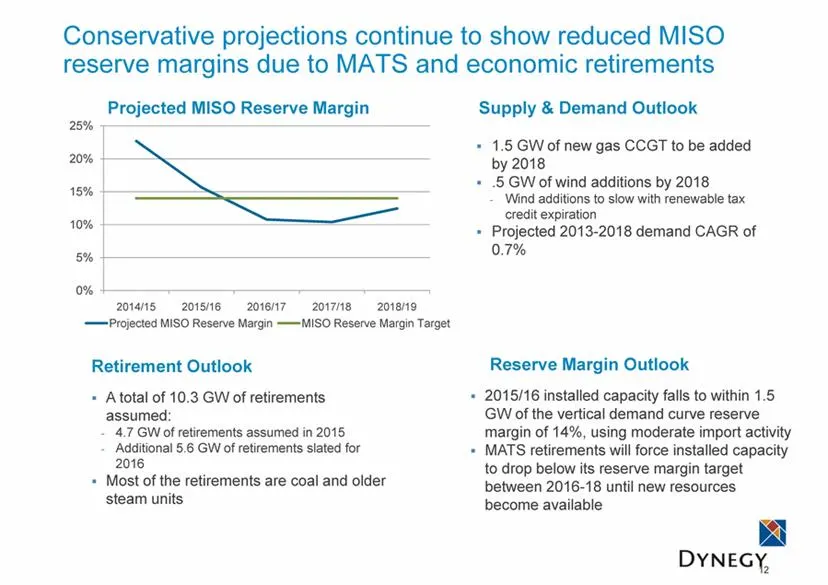
A total of 10.3 GW of retirements assumed: 4.7 GW of retirements assumed in 2015 Additional 5.6 GW of retirements slated for 2016 Most of the retirements are coal and older steam units Conservative projections continue to show reduced MISO reserve margins due to MATS and economic retirements Retirem
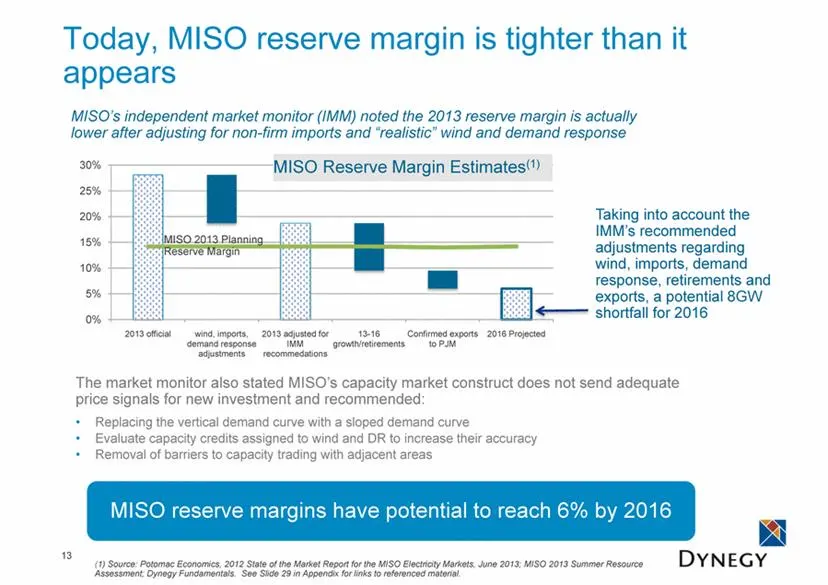
Slide 13: Today, MISO reserve margin is tighter than it appears
Today, MISO reserve margin is tighter than it appears Taking into account the IMM’s recommended adjustments regarding wind, imports, demand response, retirements and exports, a potential 8GW shortfall for 2016 MISO Reserve Margin Estimates(1) The market monitor also stated MISO’s capacity market con
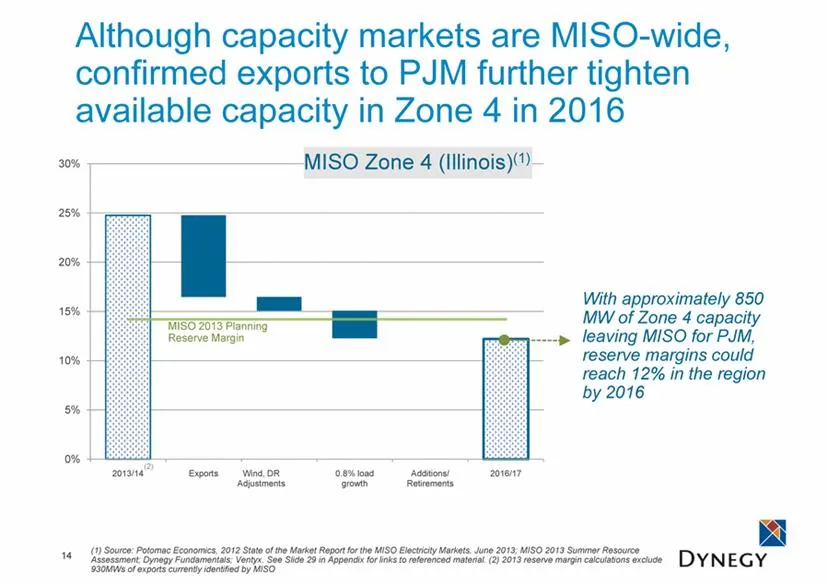
Slide 14: Exports to PJM further tighten Zone 4 capacity in 2016
Although capacity markets are MISO-wide, confirmed exports to PJM further tighten available capacity in Zone 4 in 2016 14 MISO Zone 4 (Illinois)(1) MISO 2013 Planning Reserve Margin With approximately 850 MW of Zone 4 capacity leaving MISO for PJM, reserve margins could reach 12% in the region by 20
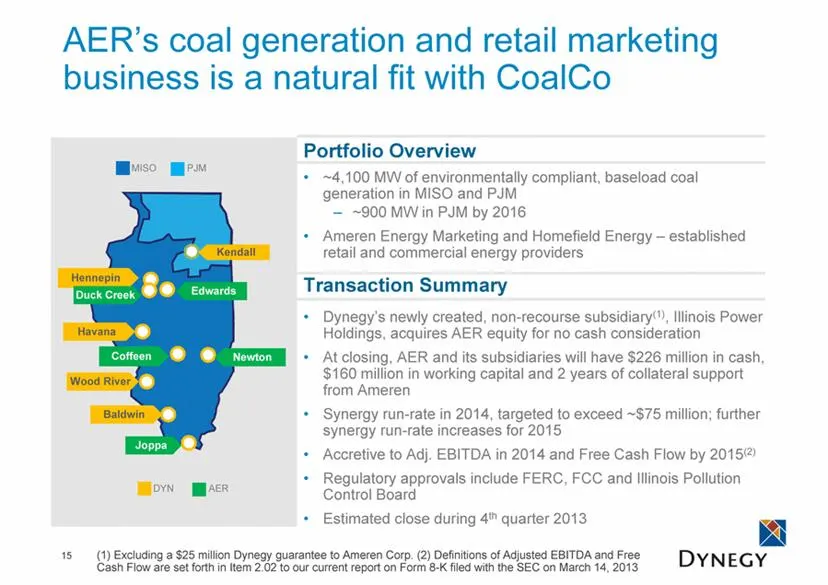
Slide 15: AER's coal generation and retail business fits CoalCo Portfolio
AER’s coal generation and retail marketing business is a natural fit with CoalCo Portfolio Overview ~4,100 MW of environmentally compliant, baseload coal generation in MISO and PJM ~900 MW in PJM by 2016 Ameren Energy Marketing and Homefield Energy – established retail and commercial energy provider
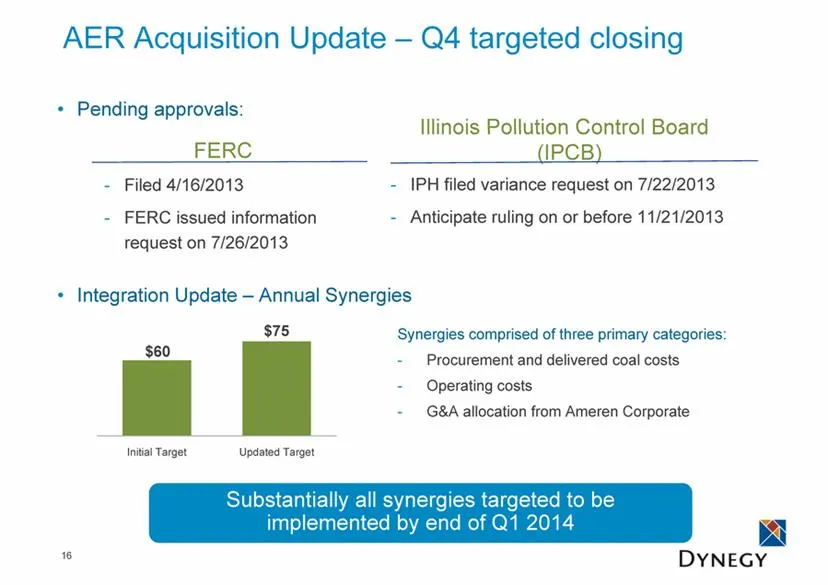
Slide 16: AER Acquisition Update
AER Acquisition Update – Q4 targeted closing 16 Pending approvals: Integration Update – Annual Synergies Filed 4/16/2013 FERC issued information request on 7/26/2013 Illinois Pollution Control Board (IPCB) IPH filed variance request on 7/22/2013 Anticipate ruling on or before 11/21/2013 FERC Synergi
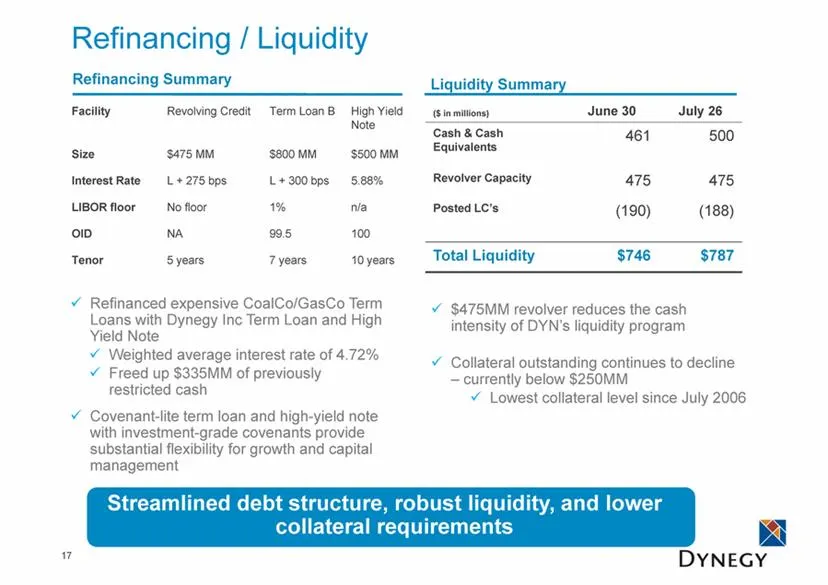
Slide 17: Refinancing / Liquidity
Refinancing / Liquidity ($ in millions) June 30 July 26 Cash & Cash Equivalents 461 500 Revolver Capacity 475 475 Posted LC’s (190) (188) Total Liquidity $746 $787 Liquidity Summary Refinancing Summary Refinanced expensive CoalCo/GasCo Term Loans with Dynegy Inc Term Loan and High Yield Note Weighte
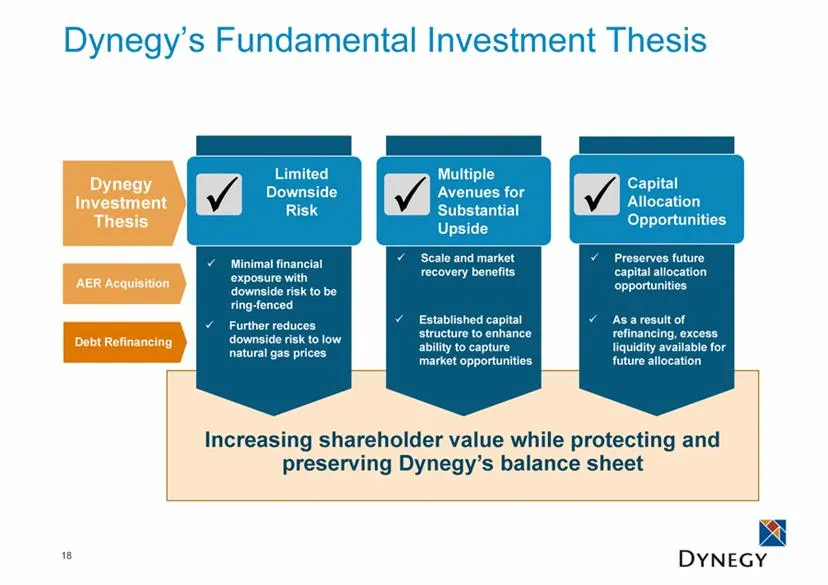
Slide 18: Dynegy Investment Thesis
AER Acquisition Dynegy Investment Thesis Dynegy’s Fundamental Investment Thesis 18 Capital Allocation Opportunities Multiple Avenues for Substantial Upside Limited Downside Risk Increasing shareholder value while protecting and preserving Dynegy’s balance sheet Minimal financial exposure with downsi
Slide 19: Appendix
Appendix ° DYNEGY
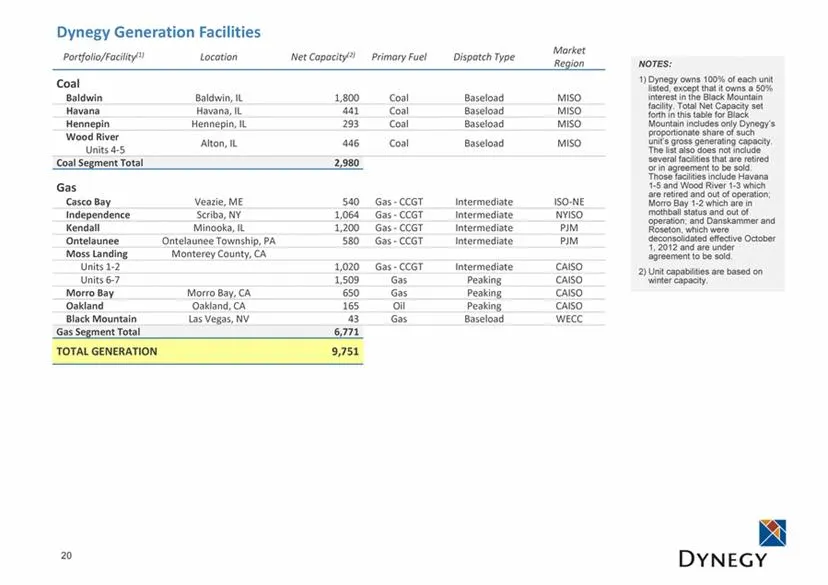
Slide 20: Dynegy Generation Facilities
20 Dynegy Generation Facilities Portfolio/Facility(1) Location Net Capacity(2) Primary Fuel Dispatch Type Market Region Coal Baldwin Baldwin, IL 1,800 Coal Baseload MISO Havana Havana, IL 441 Coal Baseload MISO Hennepin Hennepin, IL 293 Coal Baseload MISO Wood River Units 4-5 Alton, IL 446 Coal Base
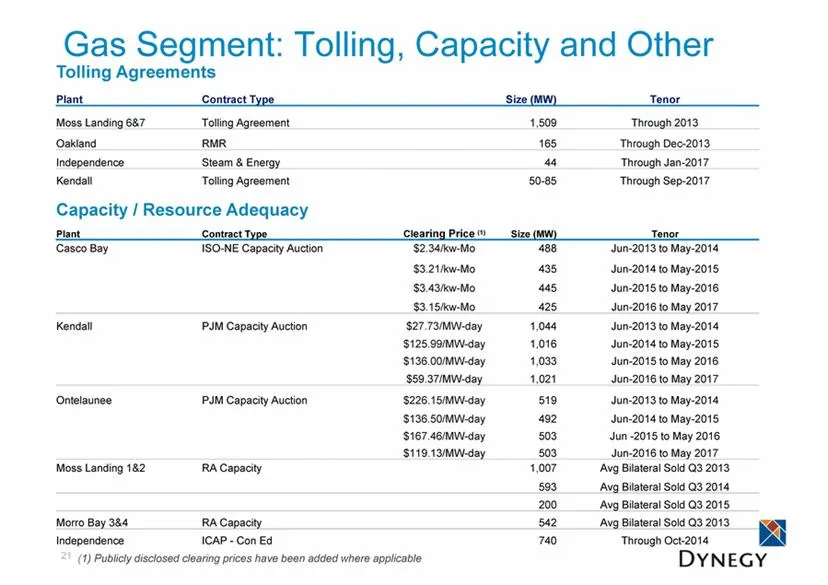
Slide 21: Gas Segment: Tolling, Capacity and Other
21 Gas Segment: Tolling, Capacity and Other Tolling Agreements Plant Contract Type Size (MW) Tenor Moss Landing 6&7 Tolling Agreement 1,509 Through 2013 Oakland RMR 165 Through Dec-2013 Independence Steam & Energy 44 Through Jan-2017 Kendall Tolling Agreement 50-85 Through Sep-2017 Capacity / Resour
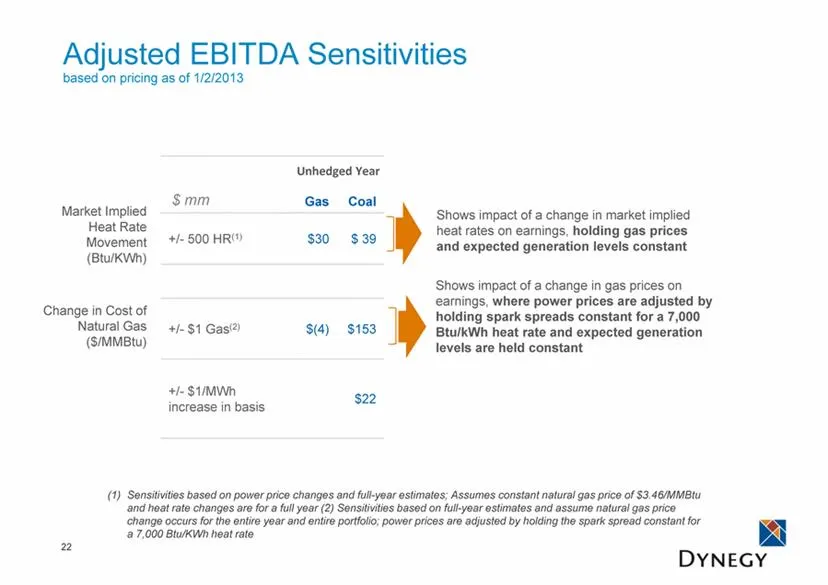
Slide 22: Adjusted EBITDA Sensitivities
Adjusted EBITDA Sensitivities based on pricing as of 1/2/2013 22 Gas Coal +/- 500 HR(1) $30 $ 39 +/- $1 Gas(2) $(4) $153 +/- $1/MWh increase in basis $22 $ mm Market Implied Heat Rate Movement (Btu/KWh) Change in Cost of Natural Gas ($/MMBtu) Sensitivities based on power price changes and full-year
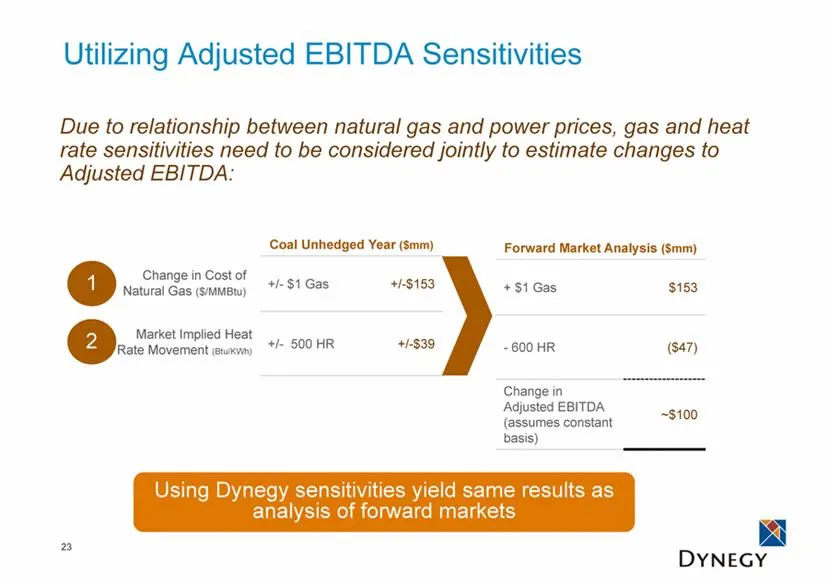
Slide 23: Utilizing Adjusted EBITDA Sensitivities
Utilizing Adjusted EBITDA Sensitivities 23 Coal Unhedged Year ($mm) +/- $1 Gas +/-$153 +/- 500 HR +/-$39 Market Implied Heat Rate Movement (Btu/KWh) Change in Cost of Natural Gas ($/MMBtu) Due to relationship between natural gas and power prices, gas and heat rate sensitivities need to be considered
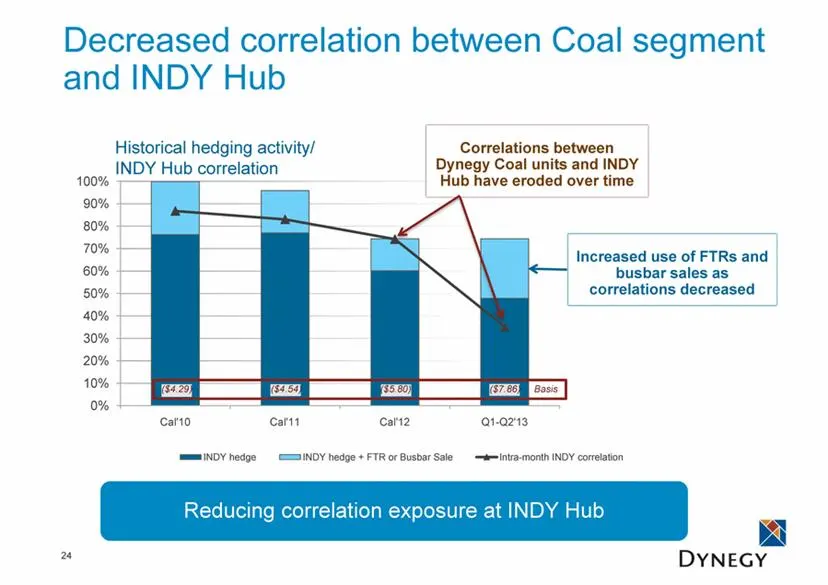
Slide 24: Decreased correlation between Coal segment and INDY Hub
Decreased correlation between Coal segment and INDY Hub 24 Historical hedging activity/INDY Hub correlation Correlations between Dynegy Coal units and INDY Hub have eroded over time Reducing correlation exposure at INDY Hub ($4.29) ($4.54) ($5.80) ($7.86) Basis Increased use of FTRs and busbar sales
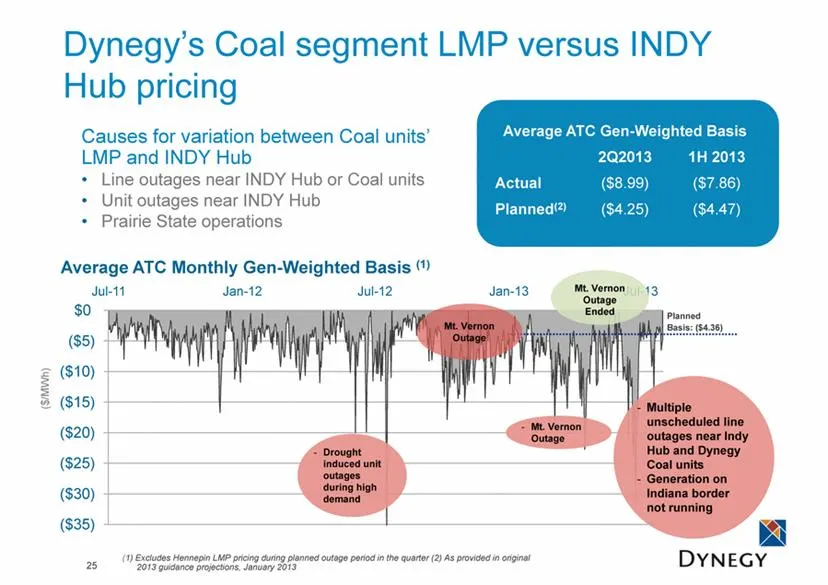
Slide 25: Multiple unscheduled line outages near Indy Hub and Coal units
Multiple unscheduled line outages near Indy Hub and Dynegy Coal units Generation on Indiana border not running Mt. Vernon Outage Ended Dynegy’s Coal segment LMP versus INDY Hub pricing Causes for variation between Coal units’ LMP and INDY Hub Line outages near INDY Hub or Coal units Unit outages nea
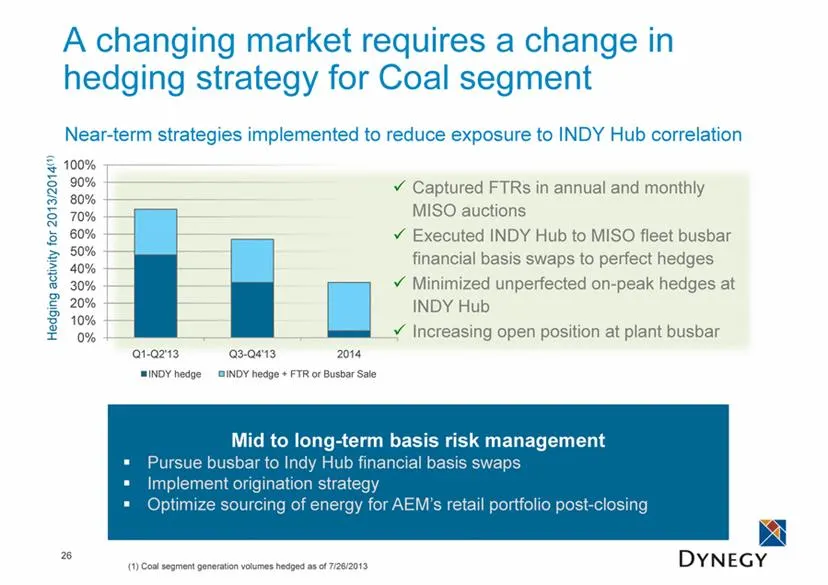
Slide 26: A changing market requires a change in hedging strategy for Coal segment
A changing market requires a change in hedging strategy for Coal segment Captured FTRs in annual and monthly MISO auctions Executed INDY Hub to MISO fleet busbar financial basis swaps to perfect hedges Minimized unperfected on-peak hedges at INDY Hub Increasing open position at plant busbar 26 Mid t
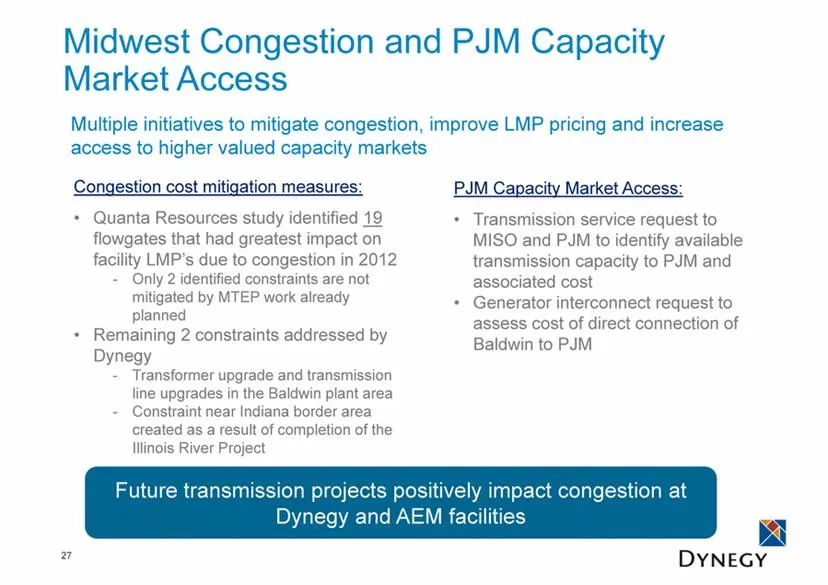
Slide 27: Midwest Congestion and PJM Capacity Market Access
Midwest Congestion and PJM Capacity Market Access Congestion cost mitigation measures: Quanta Resources study identified 19 flowgates that had greatest impact on facility LMP’s due to congestion in 2012 Only 2 identified constraints are not mitigated by MTEP work already planned Remaining 2 constrai
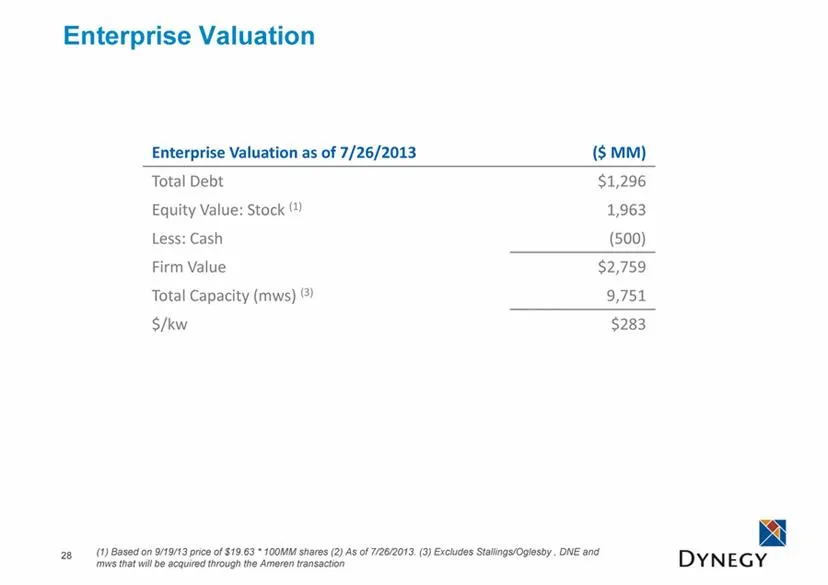
Slide 28: Enterprise Valuation
Enterprise Valuation Enterprise Valuation as of 7/26/2013 ($ MM) Total Debt $1,296 Equity Value: Stock (1) 1,963 Less: Cash (500) Firm Value $2,759 Total Capacity (mws) (3) 9,751 $/kw $283 28 (1) Based on 9/19/13 price of $19.63 * 100MM shares (2) As of 7/26/2013. (3) Excludes Stallings/Oglesby , DN
Slide 29: Links to referenced material
Links to referenced material 29 MISO 2013 Summer Assessment: https://www.midwestiso.org/Library/Repository/Study/Seasonal%20Assessments/2013%20Summer%20Resource%20Assessment.pdf Potomac Economics/Independent Market Monitor, 2012 State of the Market Report: https://www.midwestiso.org/Library/Reposito
Source: SEC EDGAR · 8-K filed Sep 23, 2013
More decks from Dynegy Inc
 FY2017 Earnings Presentation30 slides · Feb 26, 2018
 Debt Investor Presentation (December 2017)10 slides · Dec 11, 2017
 Merger or Acquisition (October 2017)28 slides · Oct 31, 2017
 Debt Investor Presentation (October 2016)44 slides · Oct 3, 2016
 IPO Roadshow (June 2016)17 slides · Jun 15, 2016
 Investor Day (April 2014)94 slides · Apr 11, 2014