Reliant Bancorp — Hovde Group 2019 Community Bank Investor Conference
26 slides from Reliant Bancorp's conference presentation, Nov 1, 2019
Slide 1: Hovde Group 2019 Community Bank Investor Conference
Filed by Reliant Bancorp, Inc. Pursuant to Rule 425 under the Securities Act of 1933, as amended and deemed filed pursuant to Rule 14a-12 under the Securities Exchange Act of 1934, as amended Subject Company: Tennessee Community Bank Holdings, Inc. (Commission File No. 001-37391) Hovde Group 2019 Co
Slide 2: Safe Harbor Statements: Forward Looking Statements
Safe Harbor Statements FORWARD LOOKING STATEMENTS This document contains “forward-looking statements” within the meaning of Section 27A of the Securities Act of 1933, as amended, and Section 21E of the Securities Exchange Act of 1934, as amended. The words “believe,” “anticipate,” “expect,” “may,” “
Slide 3: Safe Harbor Statements: Additional Information and Where to Find It
Safe Harbor Statements ADDITIONAL INFORMATION ABOUT THE TCB HOLDINGS TRANSACTION AND WHERE TO FIND IT In connection with TCB Holdings Transaction, Reliant intends to file a registration statement on Form S-4 with the SEC to register the shares of Reliant common stock that will be issued to TCB Holdi
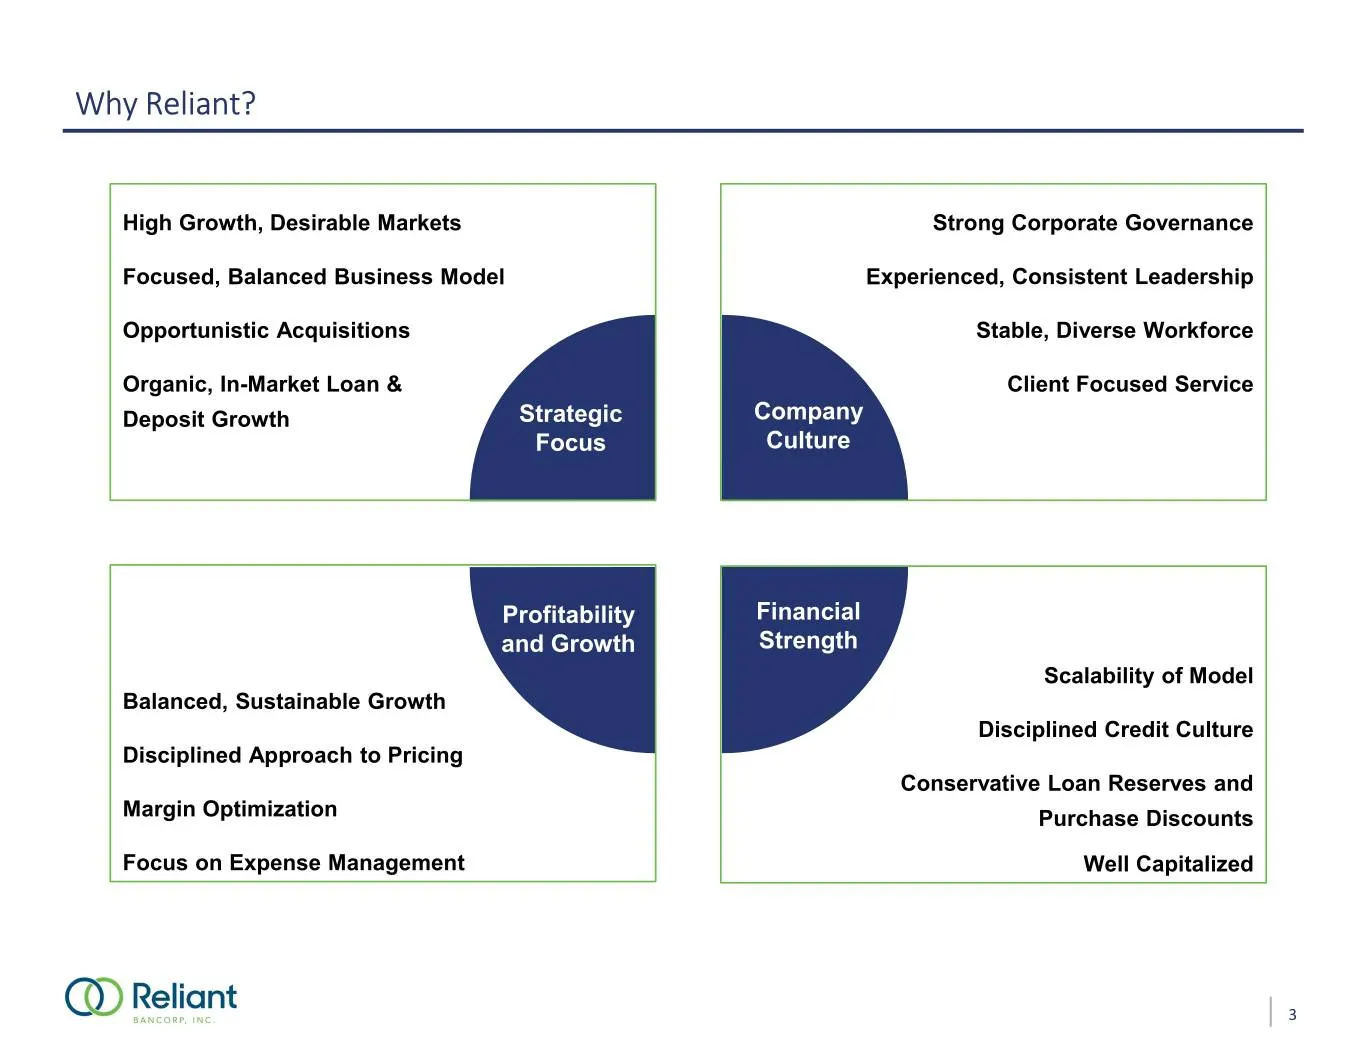
Slide 4: Why Reliant?
Why Reliant? High Growth, Desirable Markets Strong Corporate Governance Focused, Balanced Business Model Experienced, Consistent Leadership Opportunistic Acquisitions Stable, Diverse Workforce Organic, In-Market Loan & Client Focused Service Deposit Growth Strategic Company Focus Culture Profitabili
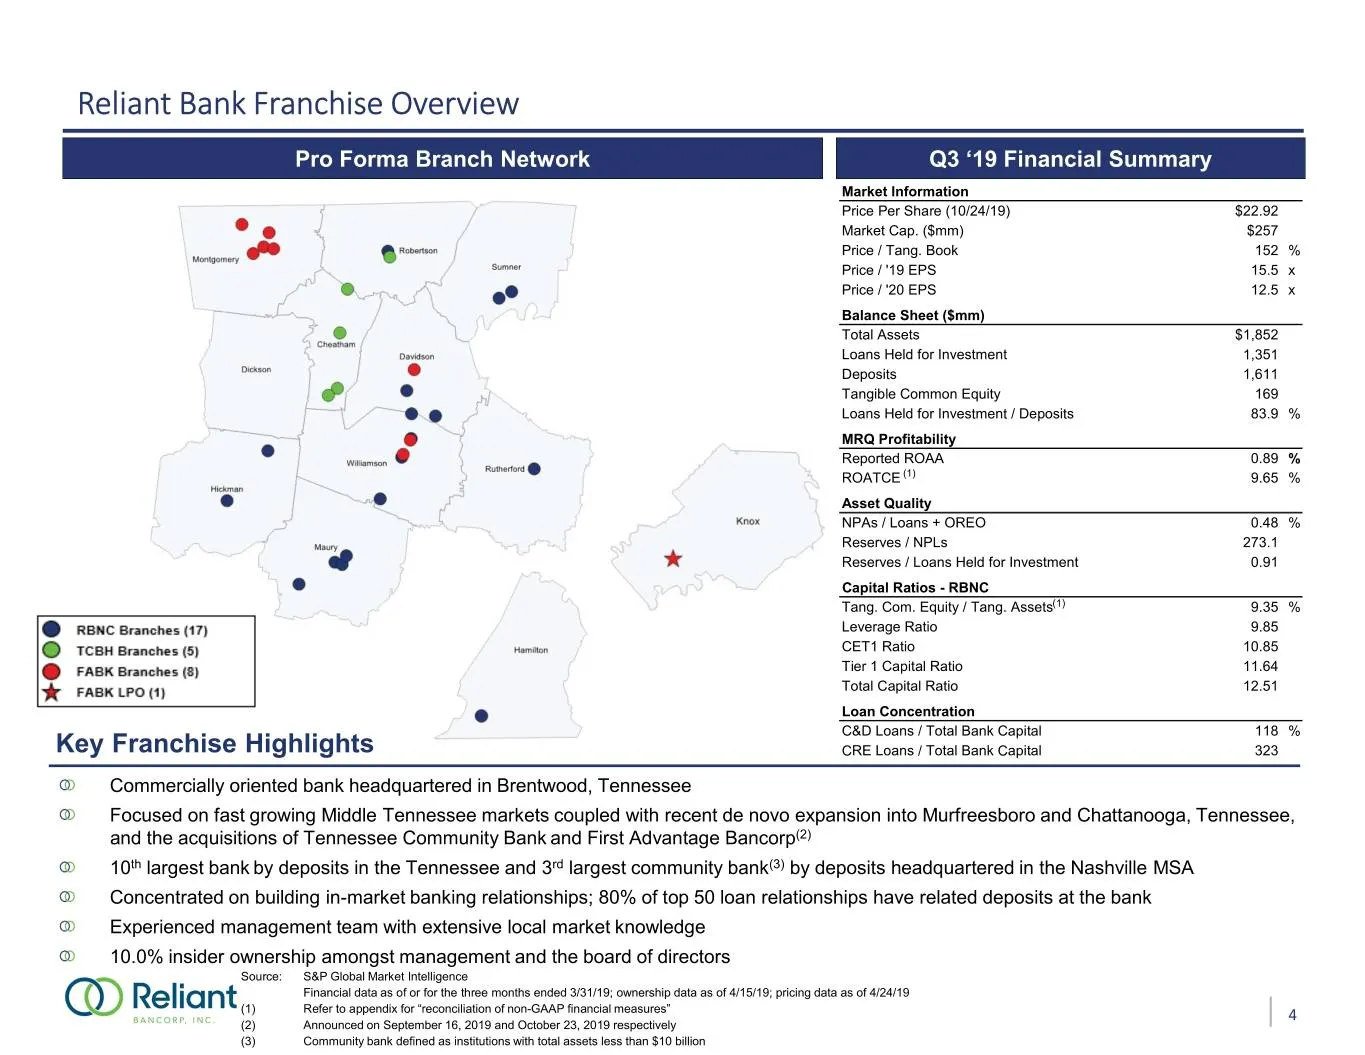
Slide 5: Reliant Bank Franchise Overview
Reliant Bank Franchise Overview Pro Forma Branch Network Q3 ‘19 Financial Summary Market Information Price Per Share (10/24/19) $22.92 Market Cap. ($mm) $257 Price / Tang. Book 152 % Price / '19 EPS 15.5 x Price / '20 EPS 12.5 x Balance Sheet ($mm) Total Assets $1,852 Loans Held for Investment 1,351
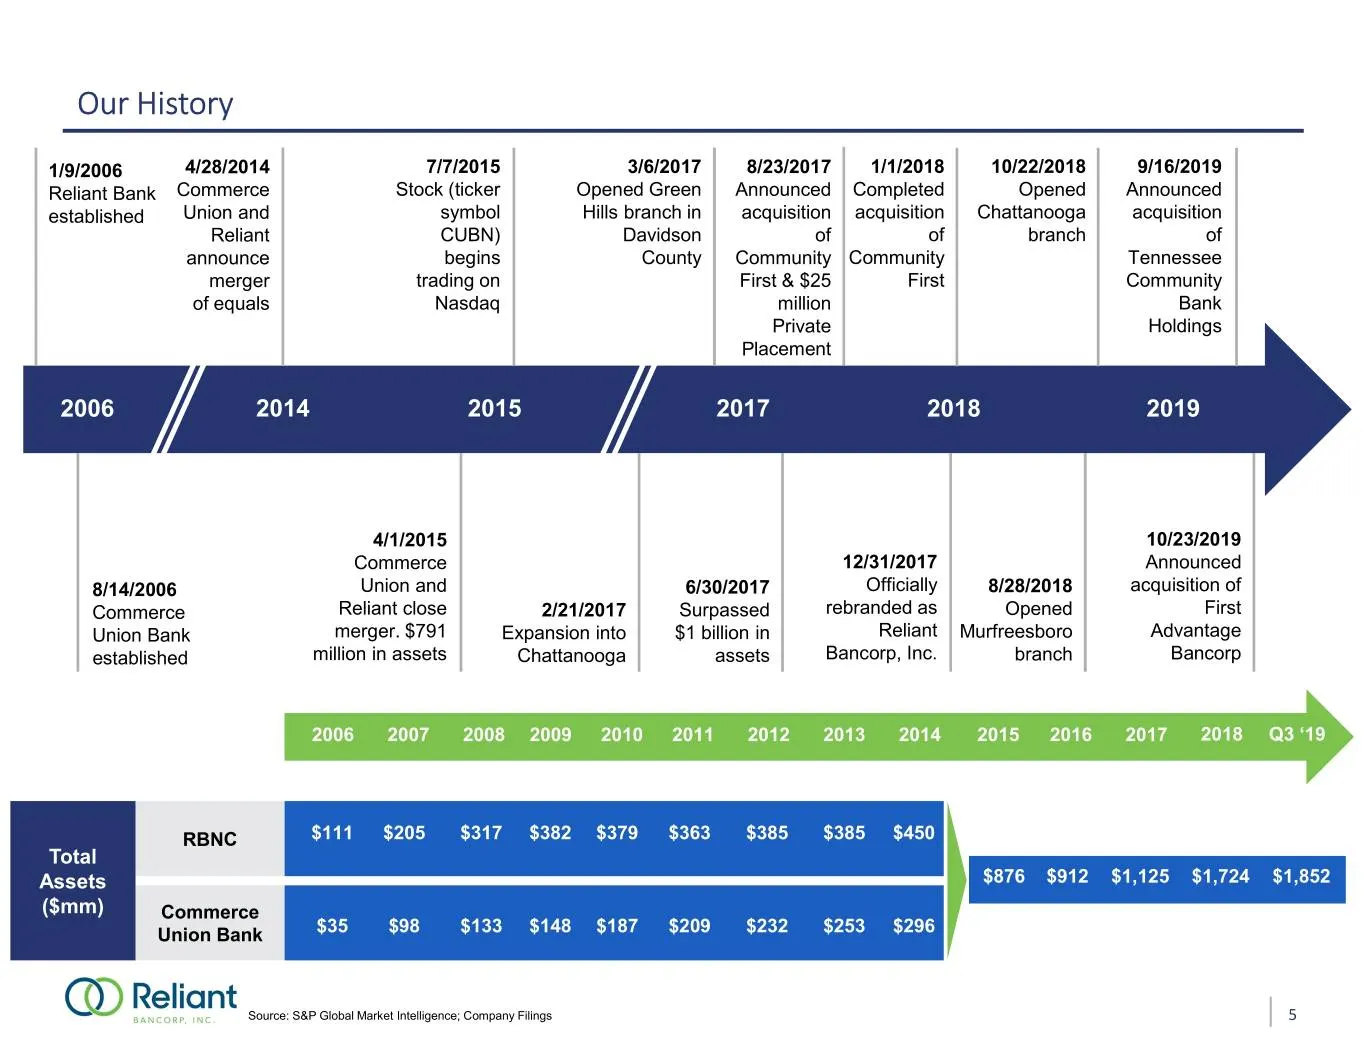
Slide 6: Our History
Our History 1/9/2006 4/28/2014 7/7/2015 3/6/2017 8/23/2017 1/1/2018 10/22/2018 9/16/2019 Reliant Bank Commerce Stock (ticker Opened Green Announced Completed Opened Announced established Union and symbol Hills branch in acquisition acquisition Chattanooga acquisition Reliant CUBN) Davidson of of bra
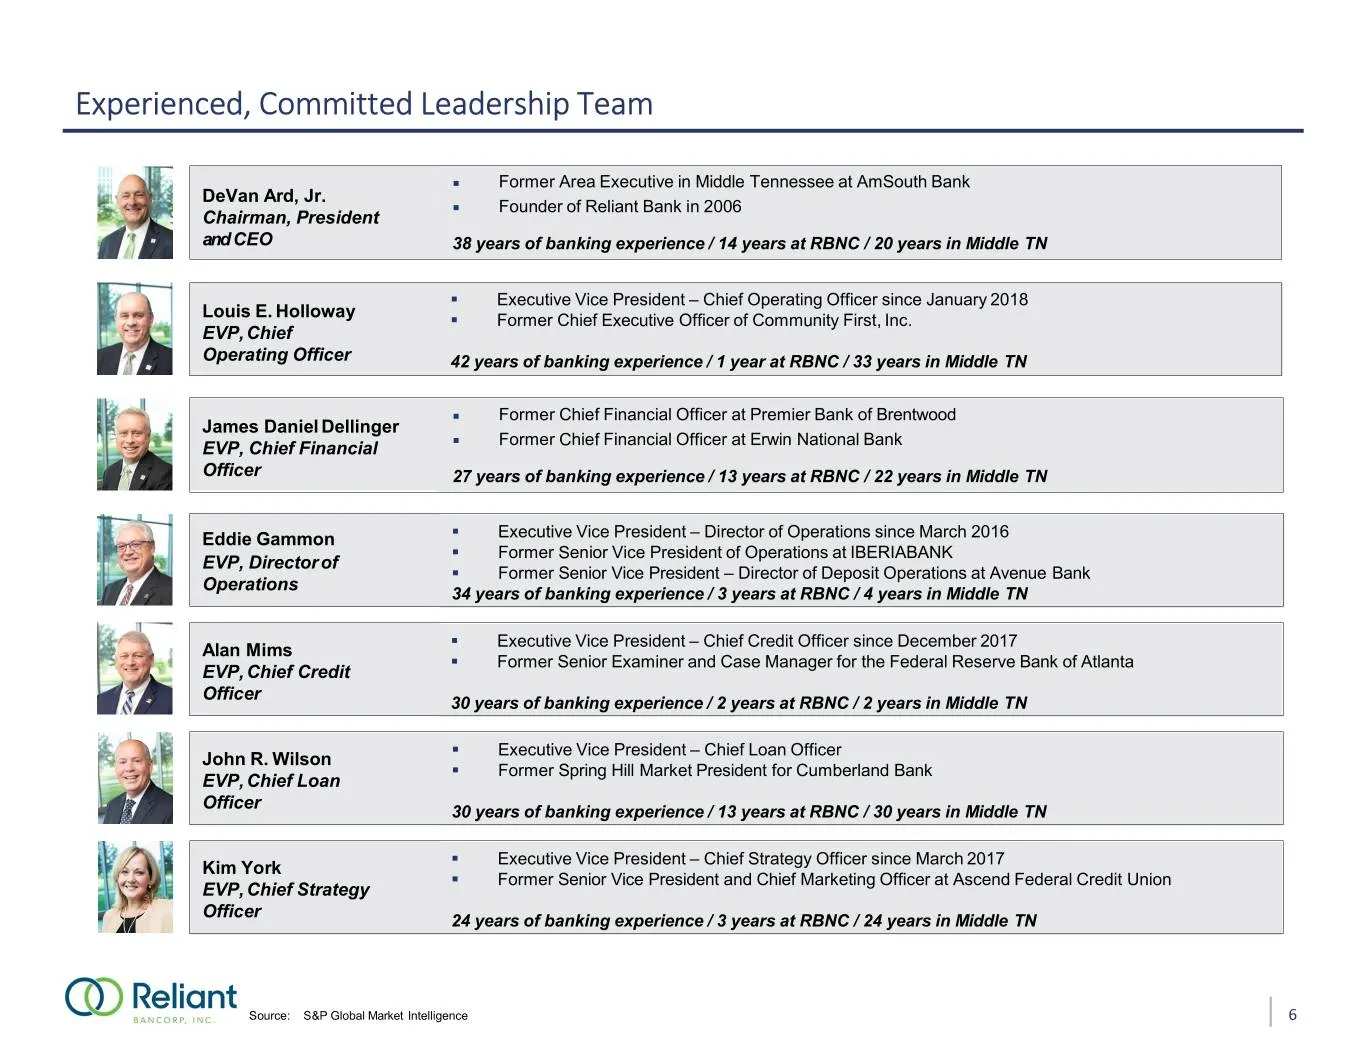
Slide 7: Experienced, Committed Leadership Team
Experienced, Committed Leadership Team . Former Area Executive in Middle Tennessee at AmSouth Bank DeVan Ard, Jr. . Founder of Reliant Bank in 2006 Chairman, President and CEO 38 years of banking experience / 14 years at RBNC / 20 years in Middle TN . Executive Vice President – Chief Operating Offic
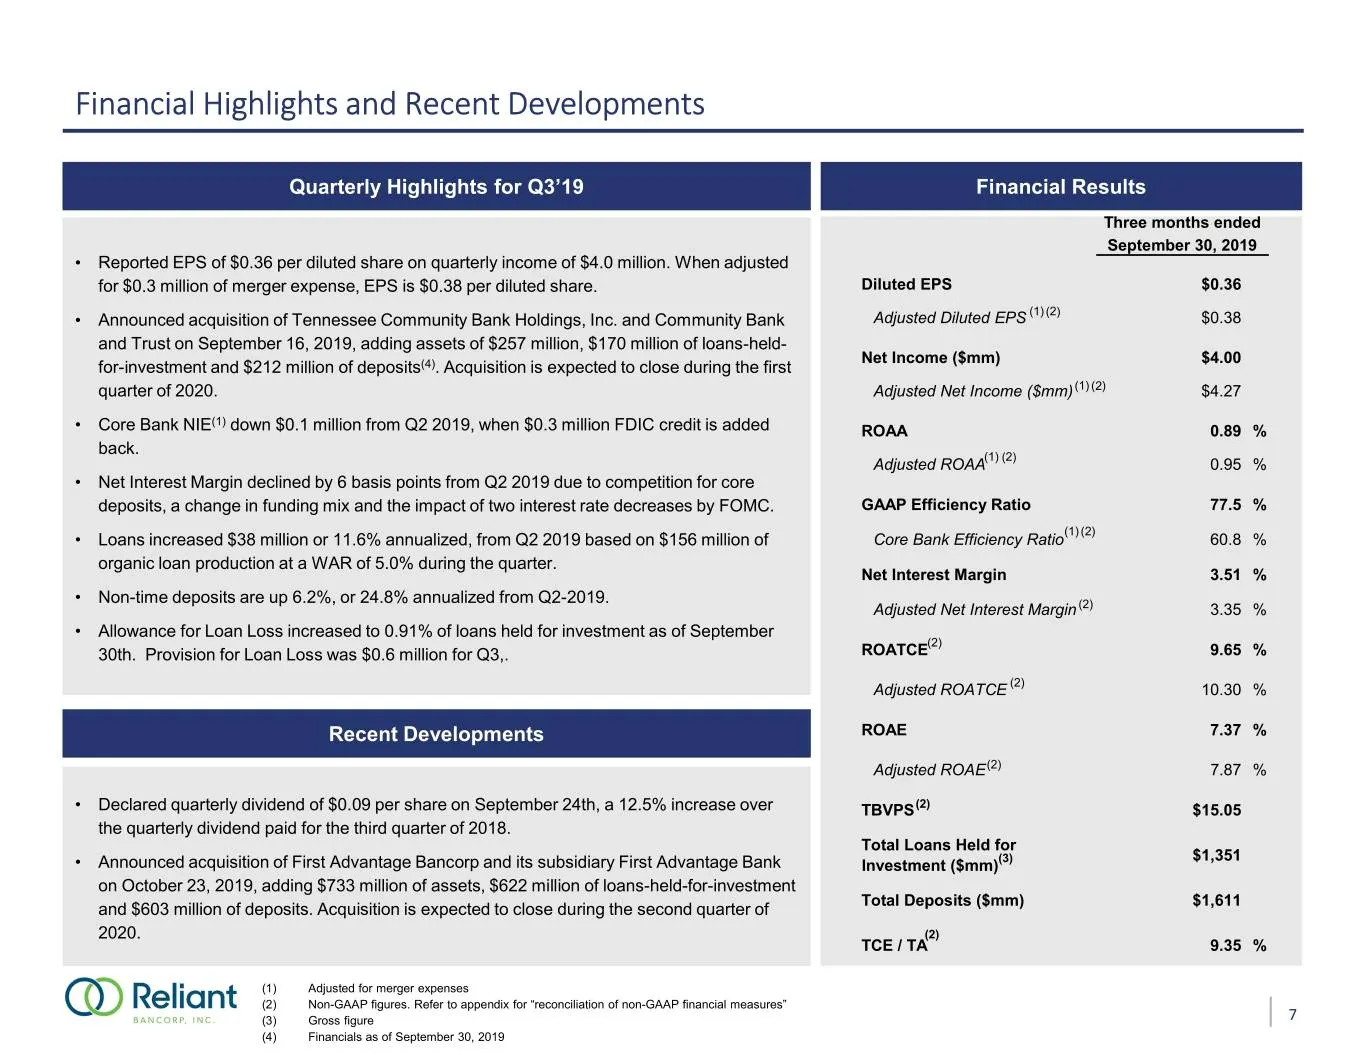
Slide 8: Financial Highlights and Recent Developments
Financial Highlights and Recent Developments Quarterly Highlights for Q3’19 Financial Results Three months ended September 30, 2019 • Reported EPS of $0.36 per diluted share on quarterly income of $4.0 million. When adjusted for $0.3 million of merger expense, EPS is $0.38 per diluted share. Diluted
Slide 9: Strategic Acquisitions to Solidify Presence in Middle Tennessee
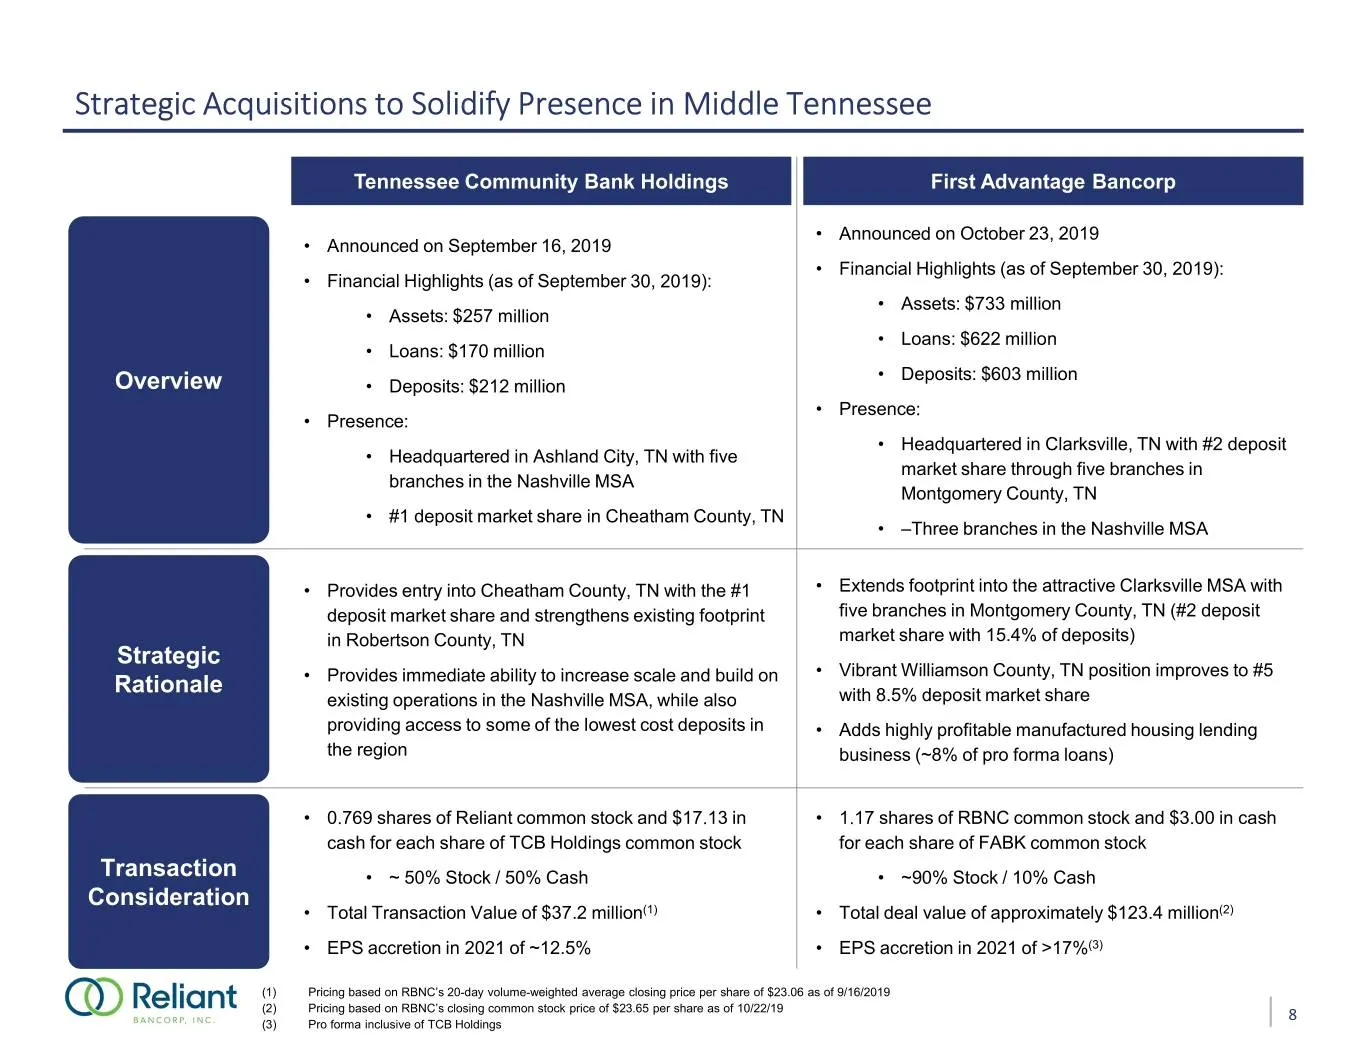
Strategic Acquisitions to Solidify Presence in Middle Tennessee Tennessee Community Bank Holdings First Advantage Bancorp • Announced on October 23, 2019 • Announced on September 16, 2019 • Financial Highlights (as of September 30, 2019): • Financial Highlights (as of September 30, 2019): • Assets:
Slide 10: Nashville MSA Deposit Market Share
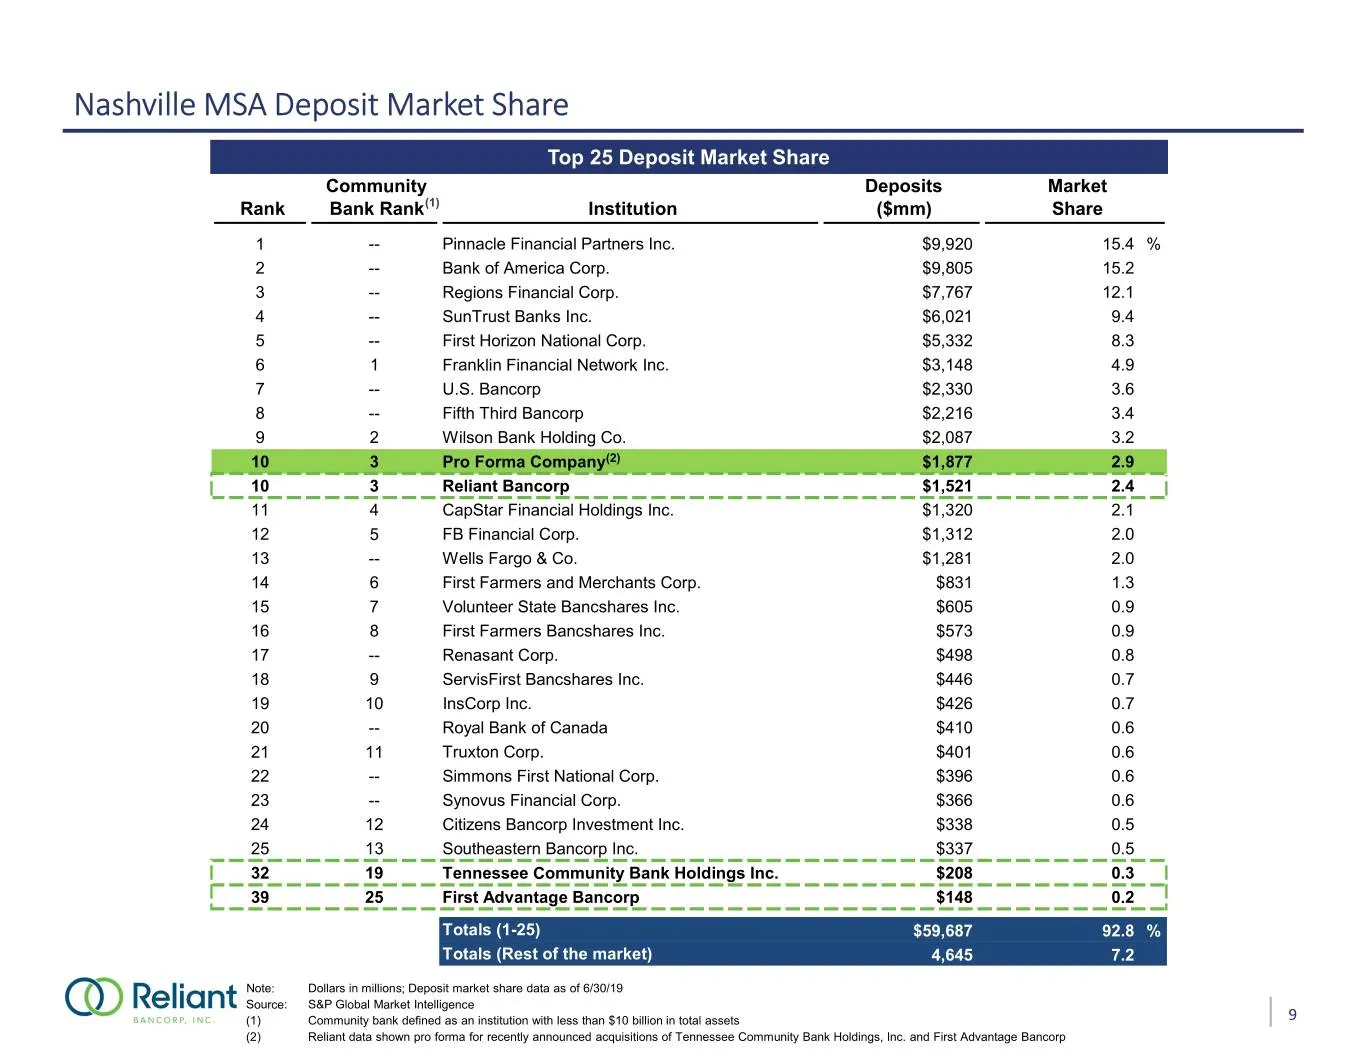
Nashville MSA Deposit Market Share Top 25 Deposit Market Share Community Deposits Market Rank Bank Rank (1) Institution ($mm) Share 1 -- Pinnacle Financial Partners Inc. $9,920 15.4 % 2 -- Bank of America Corp. $9,805 15.2 3 -- Regions Financial Corp. $7,767 12.1 4 -- SunTrust Banks Inc. $6,021 9.4
Slide 11: RNBC Market Demographics
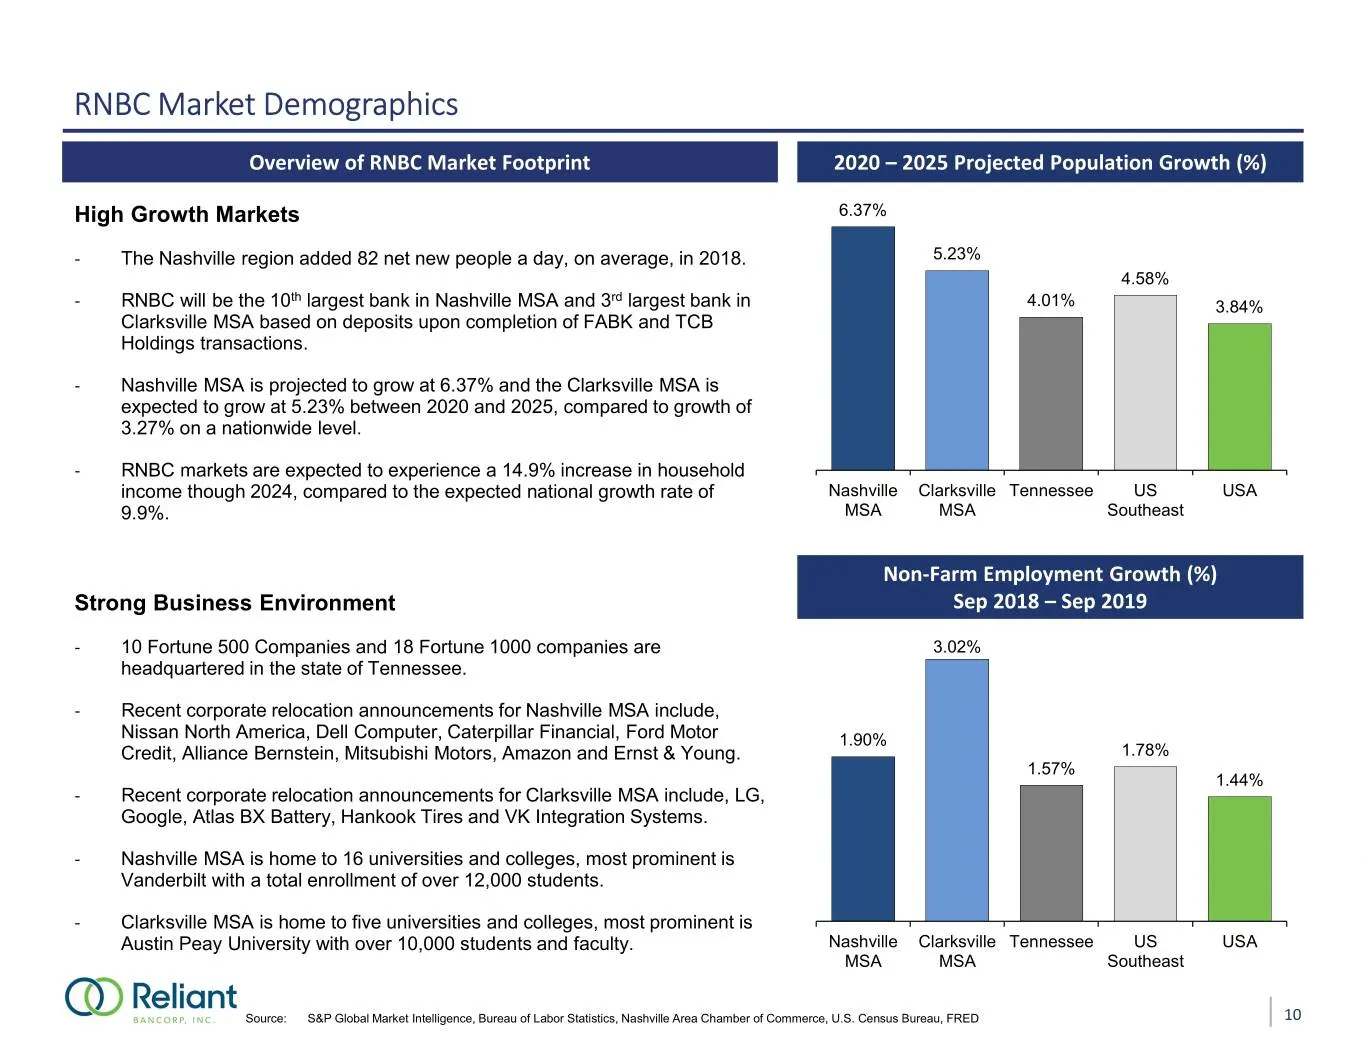
RNBC Market Demographics Overview of RNBC Market Footprint 2020 – 2025 Projected Population Growth (%) High Growth Markets 6.37% - The Nashville region added 82 net new people a day, on average, in 2018. 5.23% 4.58% th rd - RNBC will be the 10 largest bank in Nashville MSA and 3 largest bank in 4.01
Slide 12: Diverse Deposit Portfolio Mix
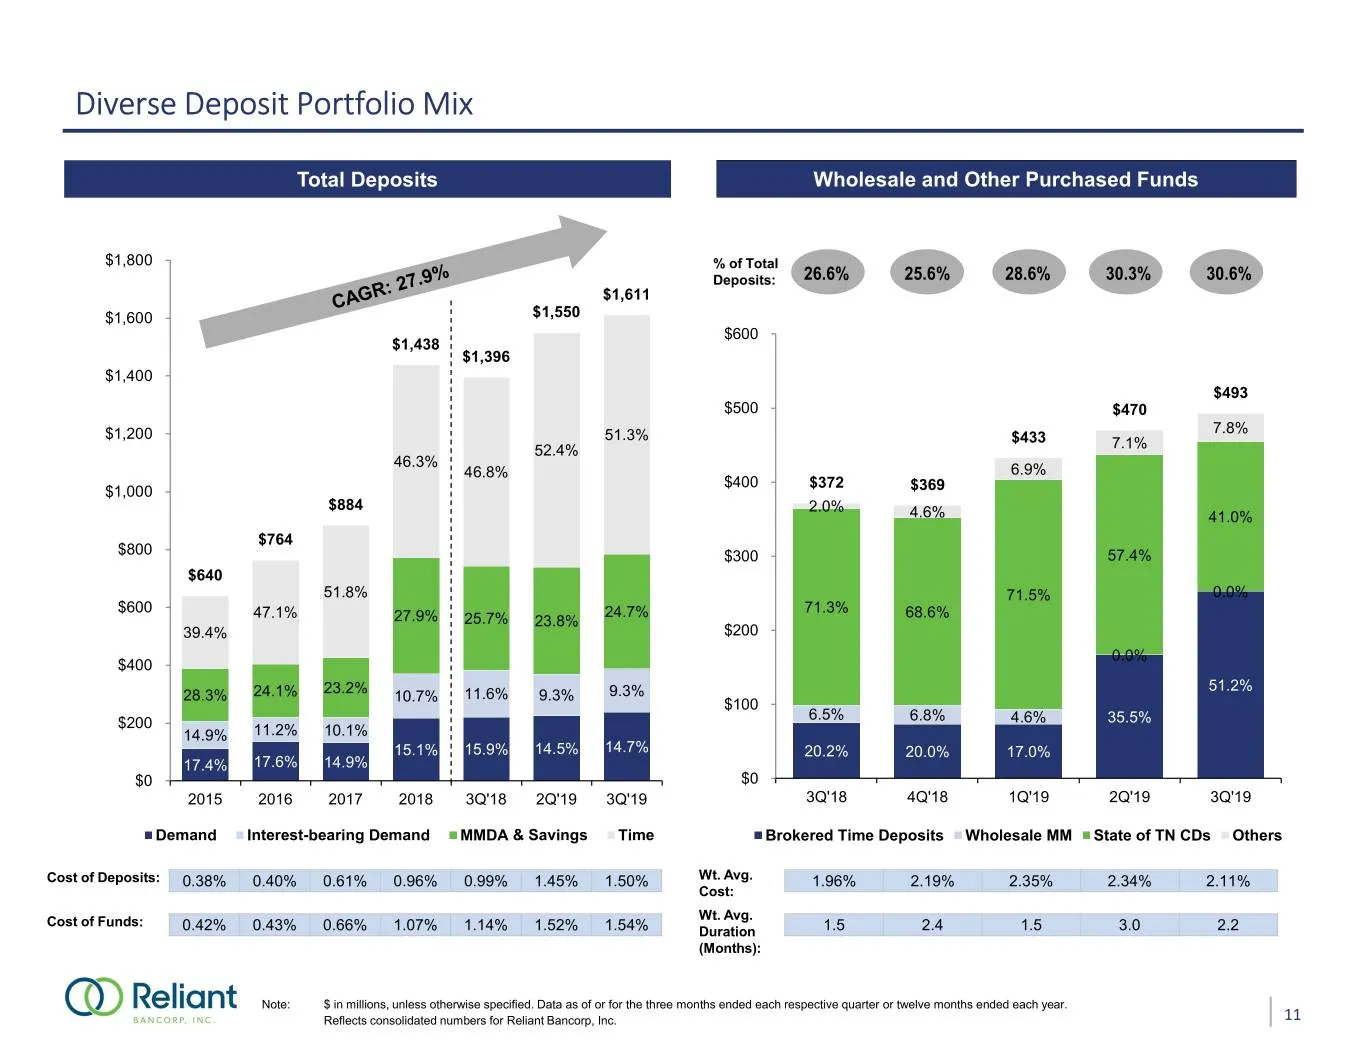
Diverse Deposit Portfolio Mix Total Deposits Wholesale and Other Purchased Funds $1,800 % of Total Deposits: 26.6% 25.6% 28.6% 30.3% 30.6% $1,611 $1,600 $1,550 $600 $1,438 $1,396 $1,400 $493 $500 $470 7.8% $1,200 51.3% $433 52.4% 7.1% 46.3% 46.8% 6.9% $400 $372 $1,000 $369 $884 2.0% 4.6% 41.0% $764
Slide 13: Balancing Growth and Profitability
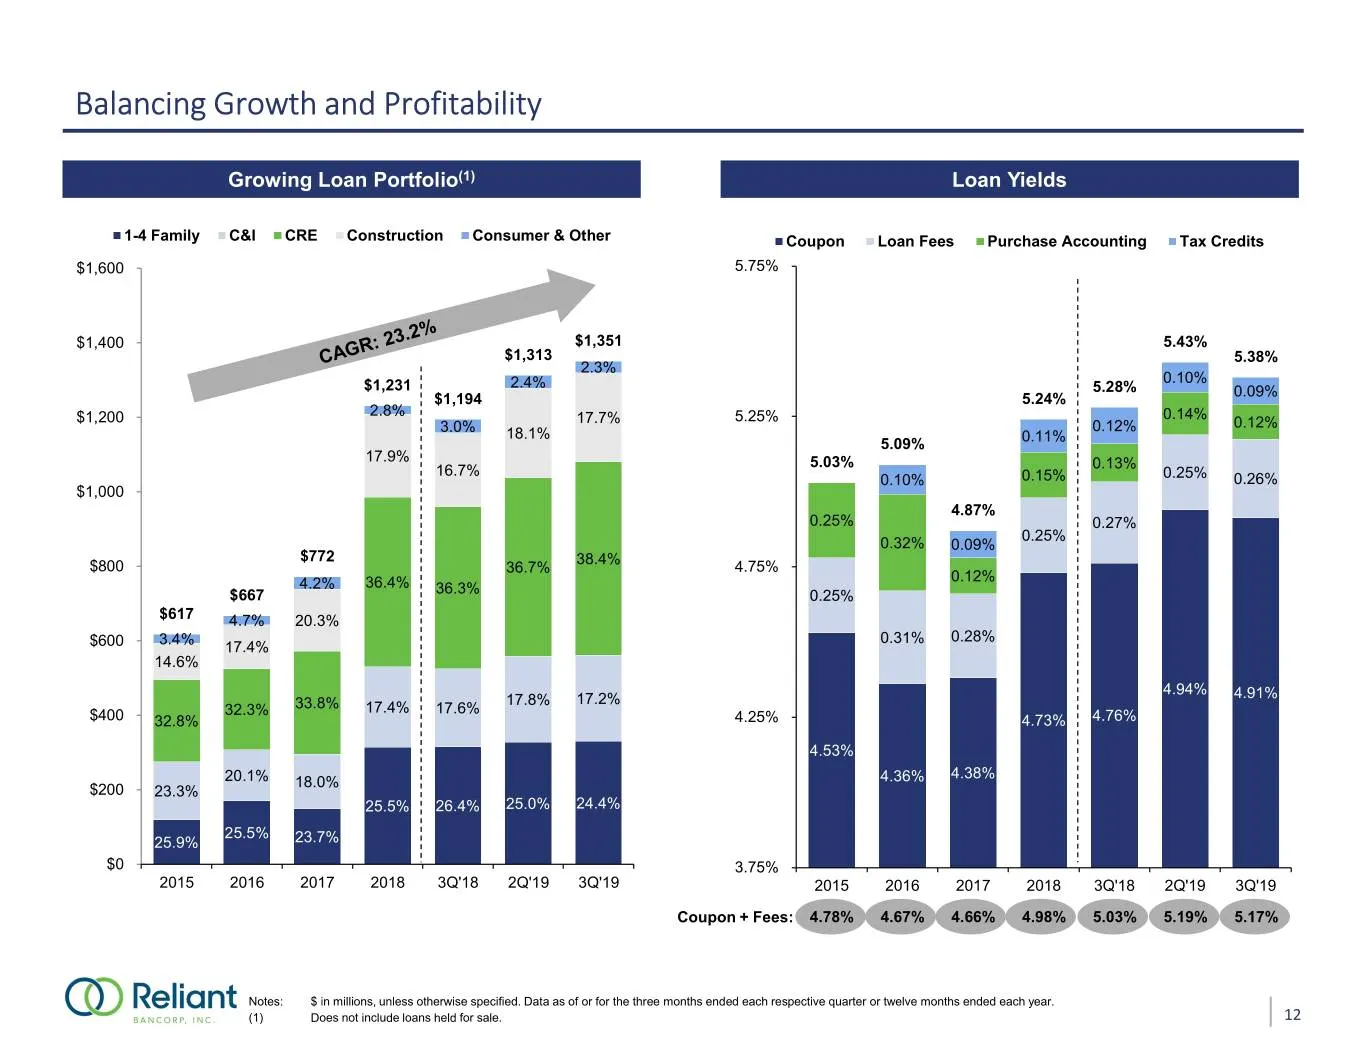
Balancing Growth and Profitability Growing Loan Portfolio(1) Loan Yields 1-4 Family C&I CRE Construction Consumer & Other Coupon Loan Fees Purchase Accounting Tax Credits $1,600 5.75% $1,400 $1,351 5.43% $1,313 5.38% 2.3% 2.4% 0.10% $1,231 5.28% 0.09% $1,194 5.24% $1,200 2.8% 17.7% 5.25% 0.14% 3.0%
Slide 14: Disciplined Credit Culture
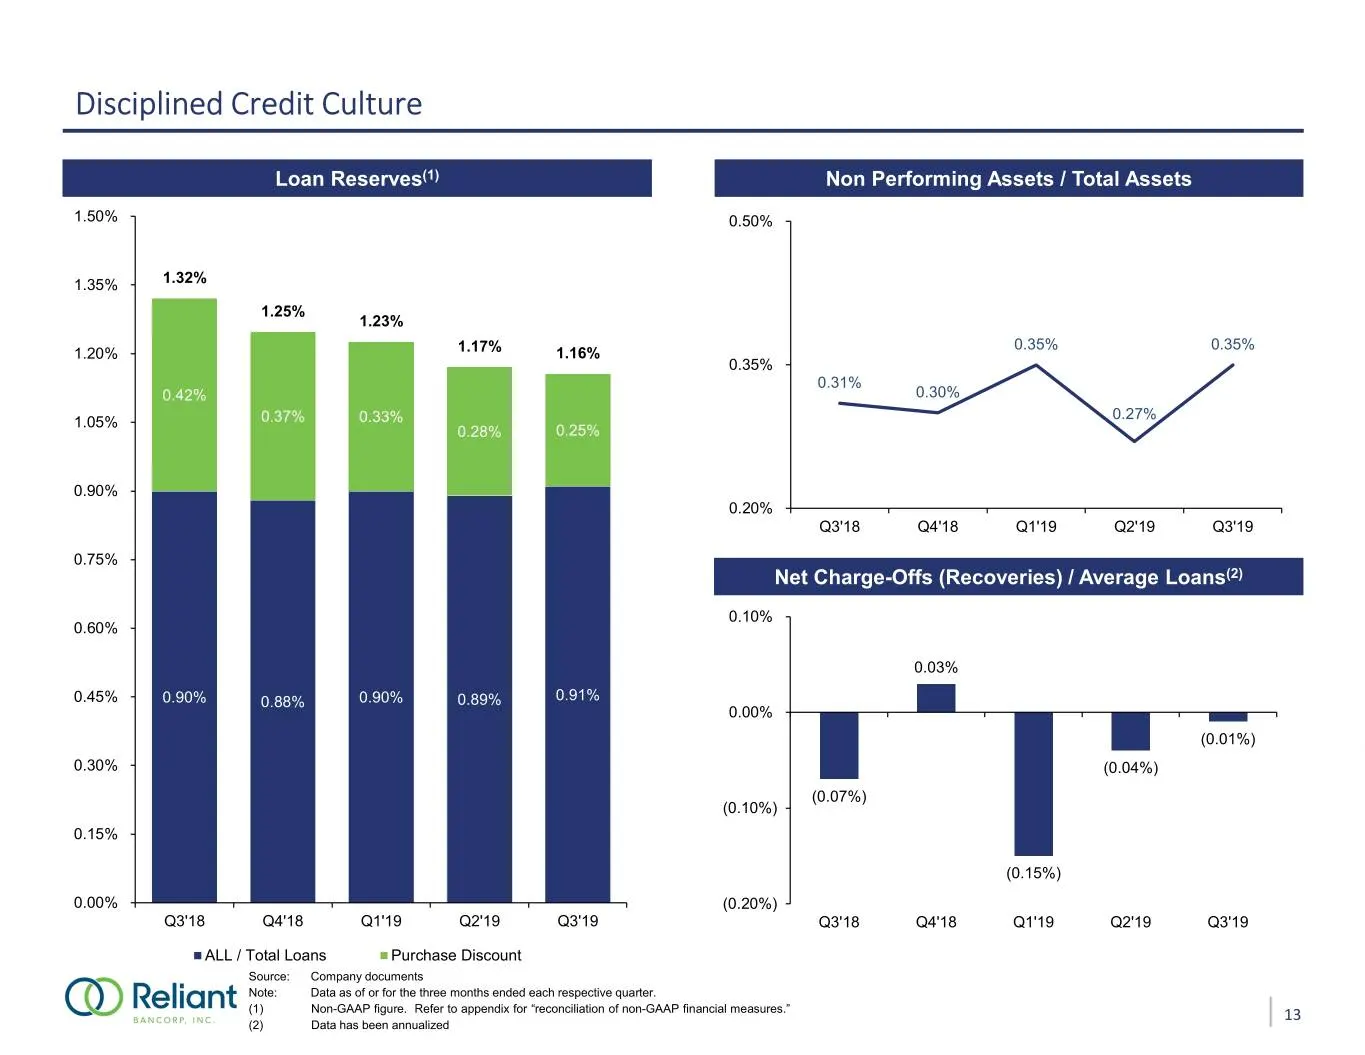
Disciplined Credit Culture Loan Reserves(1) Non Performing Assets / Total Assets 1.50% 0.50% 1.35% 1.32% 1.25% 1.23% 0.35% 0.35% 1.20% 1.17% 1.16% 0.35% 0.31% 0.42% 0.30% 0.27% 1.05% 0.37% 0.33% 0.28% 0.25% 0.90% 0.20% Q3'18 Q4'18 Q1'19 Q2'19 Q3'19 0.75% Net Charge-Offs (Recoveries) / Average Loans(
Slide 15: Diversified Lending Platform
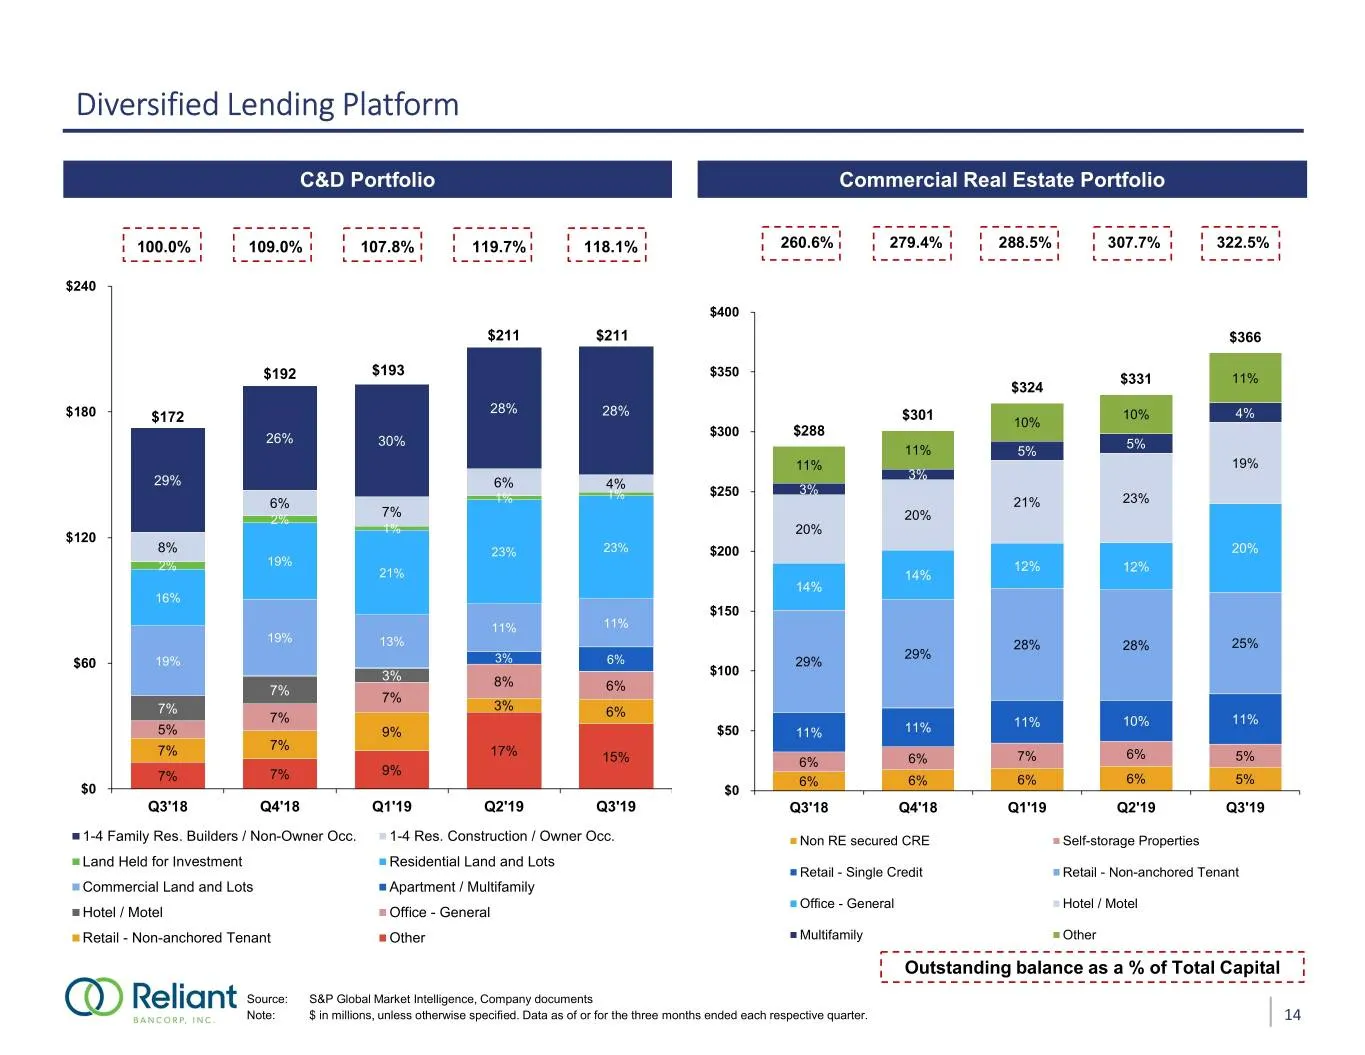
Diversified Lending Platform C&D Portfolio Commercial Real Estate Portfolio 100.0% 109.0% 107.8% 119.7% 118.1% 260.6% 279.4% 288.5% 307.7% 322.5% $240 $400 $211 $211 $366 $193 $350 $192 $331 11% $324 $180 28% 28% 10% 4% $172 $301 10% $300 $288 26% 30% 5% 11% 5% 11% 19% 3% 29% 6% 4% 1% $250 3% 6% 1%
Slide 16: Growing, Profitable Core Bank
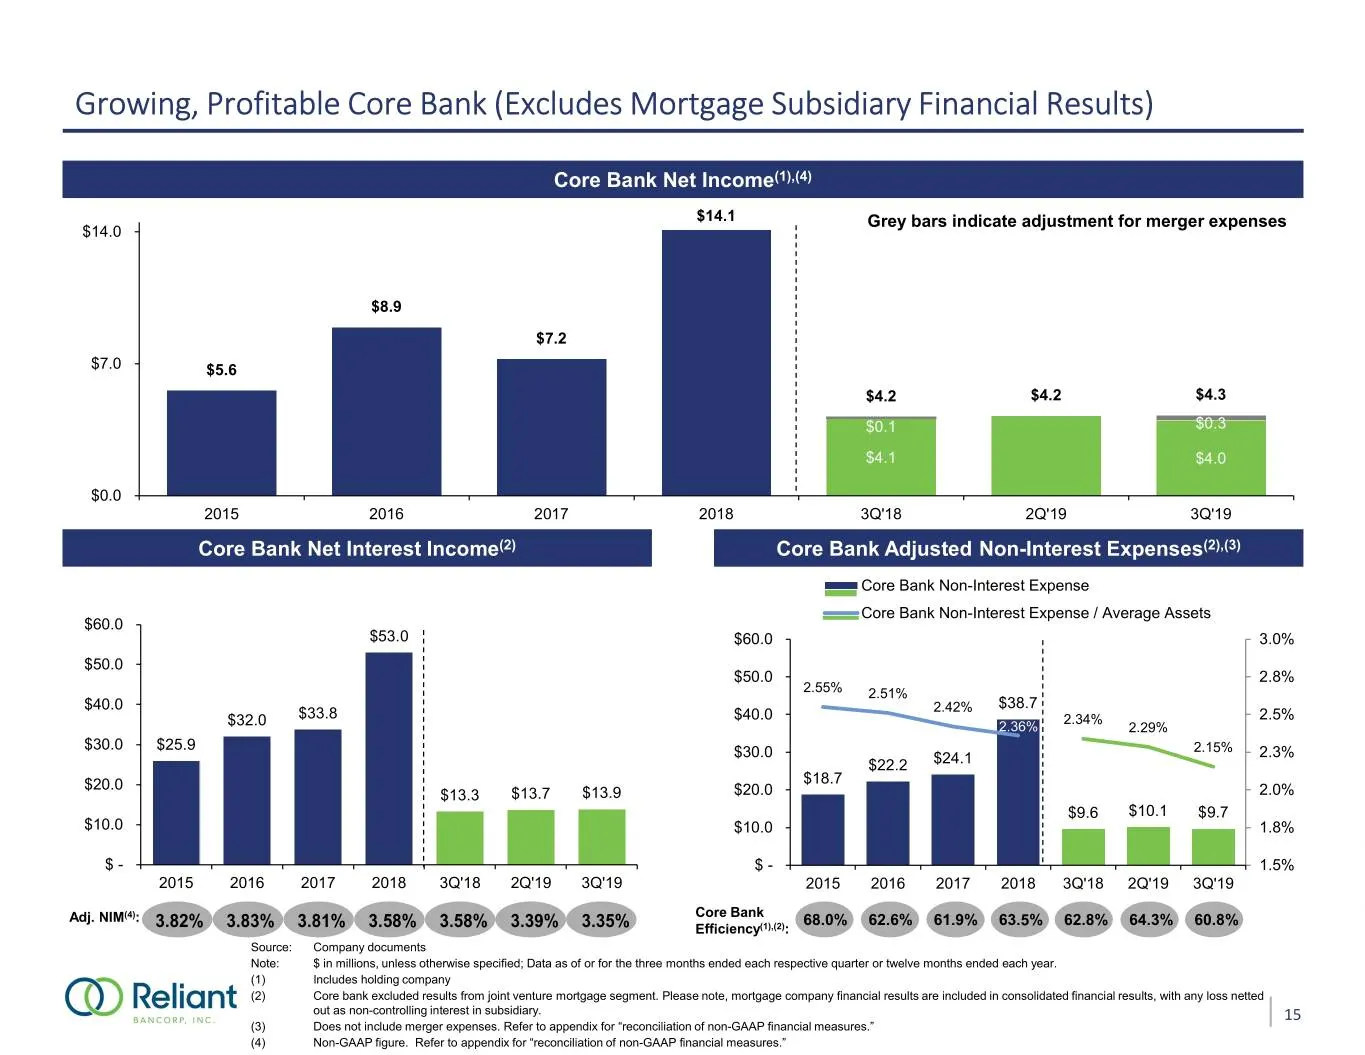
Growing, Profitable Core Bank (Excludes Mortgage Subsidiary Financial Results) Core Bank Net Income(1),(4) $14.1 Grey bars indicate adjustment for merger expenses $14.0 $8.9 $7.2 $7.0 $5.6 $4.2 $4.2 $4.3 $0.1 $0.3 $4.1 $4.0 $0.0 2015 2016 2017 2018 3Q'18 2Q'19 3Q'19 Core Bank Net Interest Income(2)
Slide 17: Financial Strength Positions Company for Growth
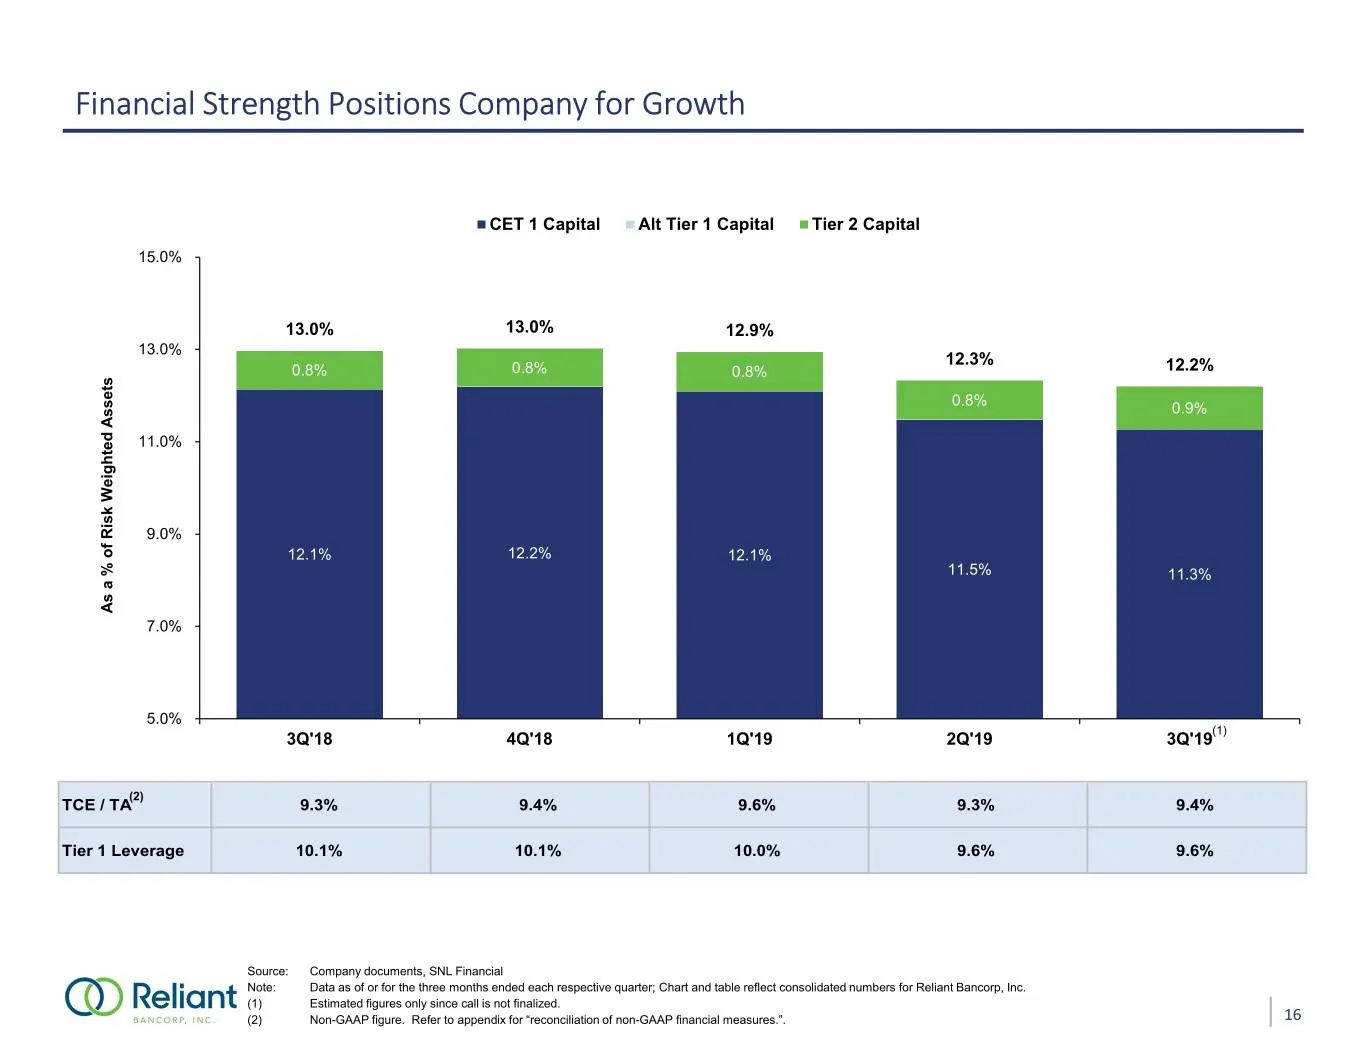
Financial Strength Positions Company for Growth CET 1 Capital Alt Tier 1 Capital Tier 2 Capital 15.0% 13.0% 13.0% 12.9% 13.0% 12.3% 0.8% 0.8% 0.8% 12.2% 0.8% 0.9% 11.0% 9.0% 12.1% 12.2% 12.1% 11.5% 11.3% As a % Assets As a % Risk Weighted of 7.0% 5.0% (1) 3Q'18 4Q'18 1Q'19 2Q'19 3Q'19 (2) TCE / TA 9
Slide 18: Delivering Shareholder Value
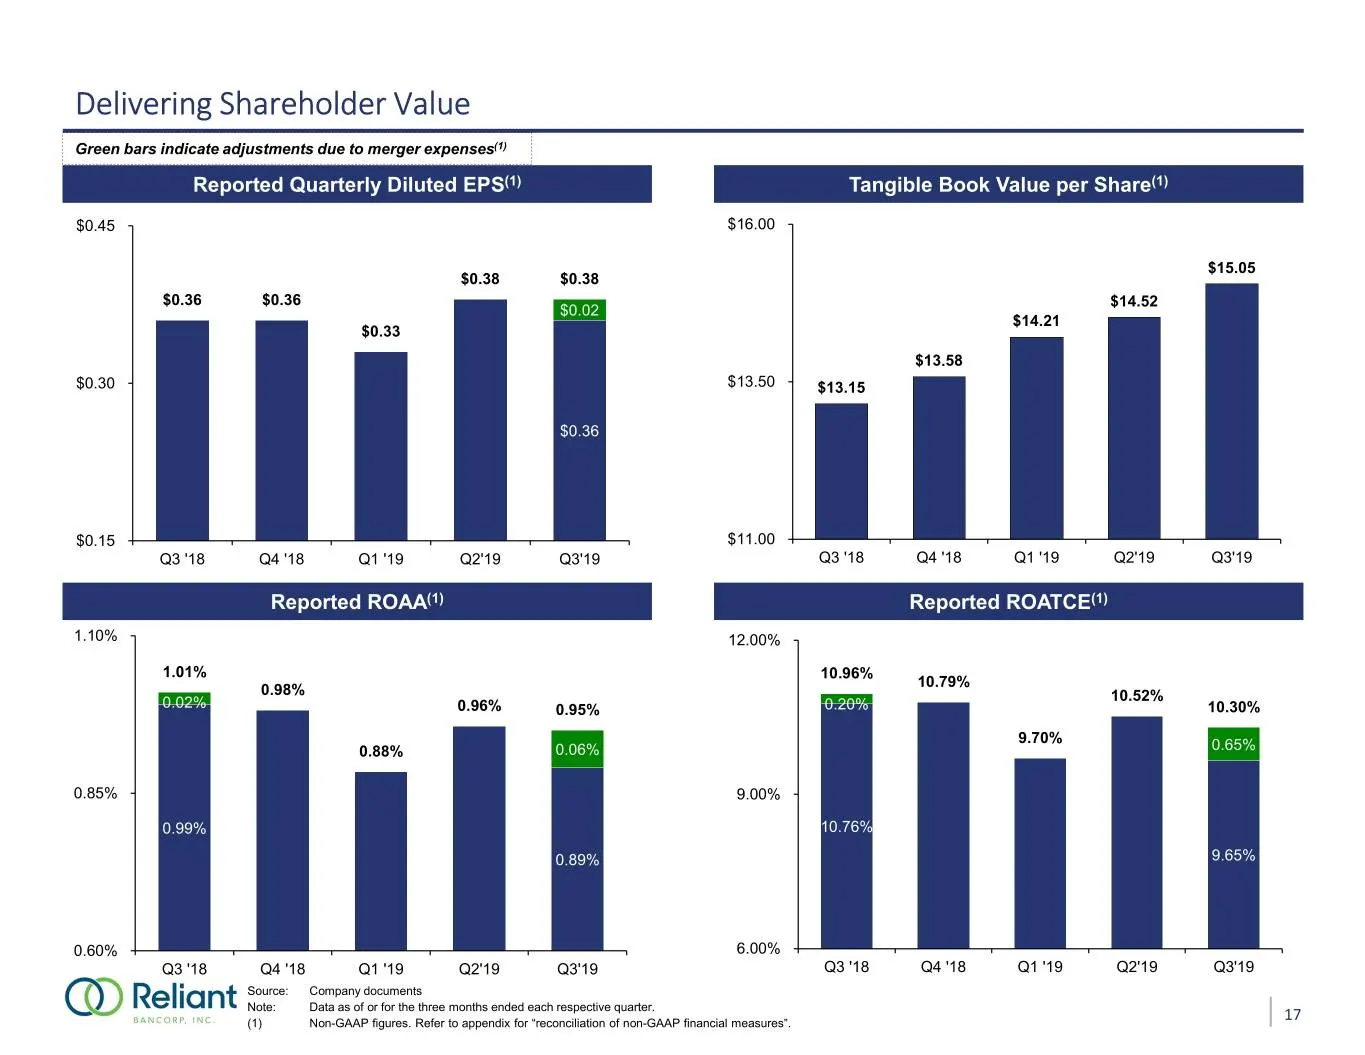
Delivering Shareholder Value Green bars indicate adjustments due to merger expenses(1) Reported Quarterly Diluted EPS(1) Tangible Book Value per Share(1) $0.45 $16.00 $15.05 $0.38 $0.38 $0.36 $0.36 $14.52 $0.02 $14.21 $0.33 $13.58 $0.30 $13.50 $13.15 $0.36 $0.15 $11.00 Q3 '18 Q4 '18 Q1 '19 Q2'19 Q3'
Slide 19: Our Strategy for Q4-2019 and 2020
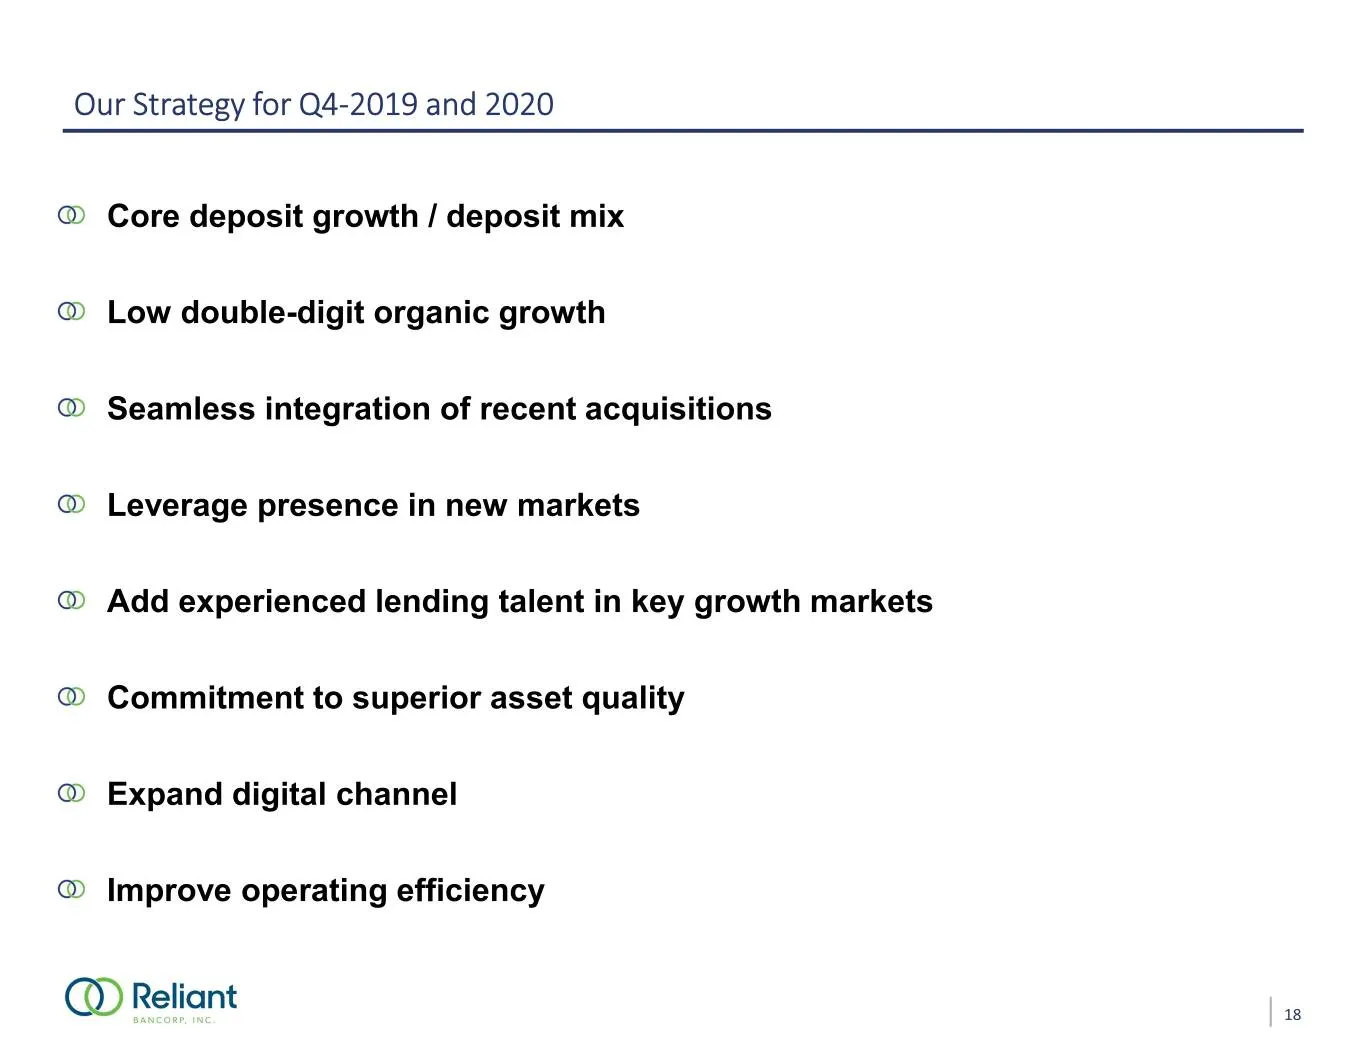
Our Strategy for Q4-2019 and 2020 Core deposit growth / deposit mix Low double-digit organic growth Seamless integration of recent acquisitions Leverage presence in new markets Add experienced lending talent in key growth markets Commitment to superior asset quality Expand digital channel Improve op
Slide 20: Appendix
GROW TOGETHER Appendix
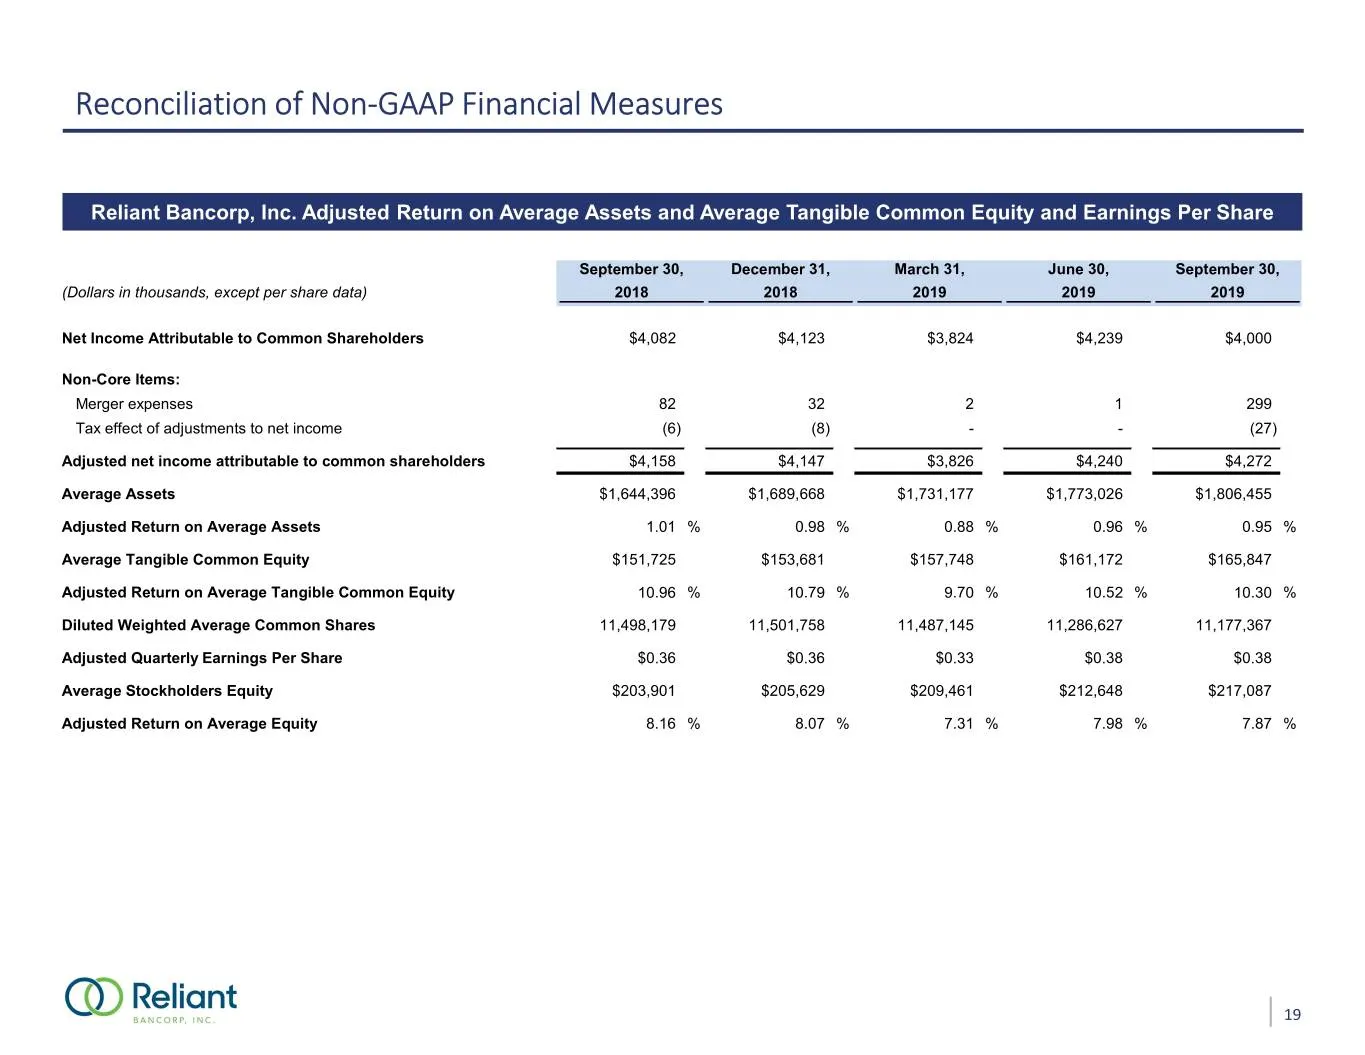
Slide 21: Reconciliation of Non-GAAP Financial Measures: Adjusted ROAA, ROATCE and EPS
Reconciliation of Non-GAAP Financial Measures Reliant Bancorp, Inc. Adjusted Return on Average Assets and Average Tangible Common Equity and Earnings Per Share September 30, December 31, March 31, June 30, September 30, (Dollars in thousands, except per share data) 2018 2018 2019 2019 2019 Net Incom
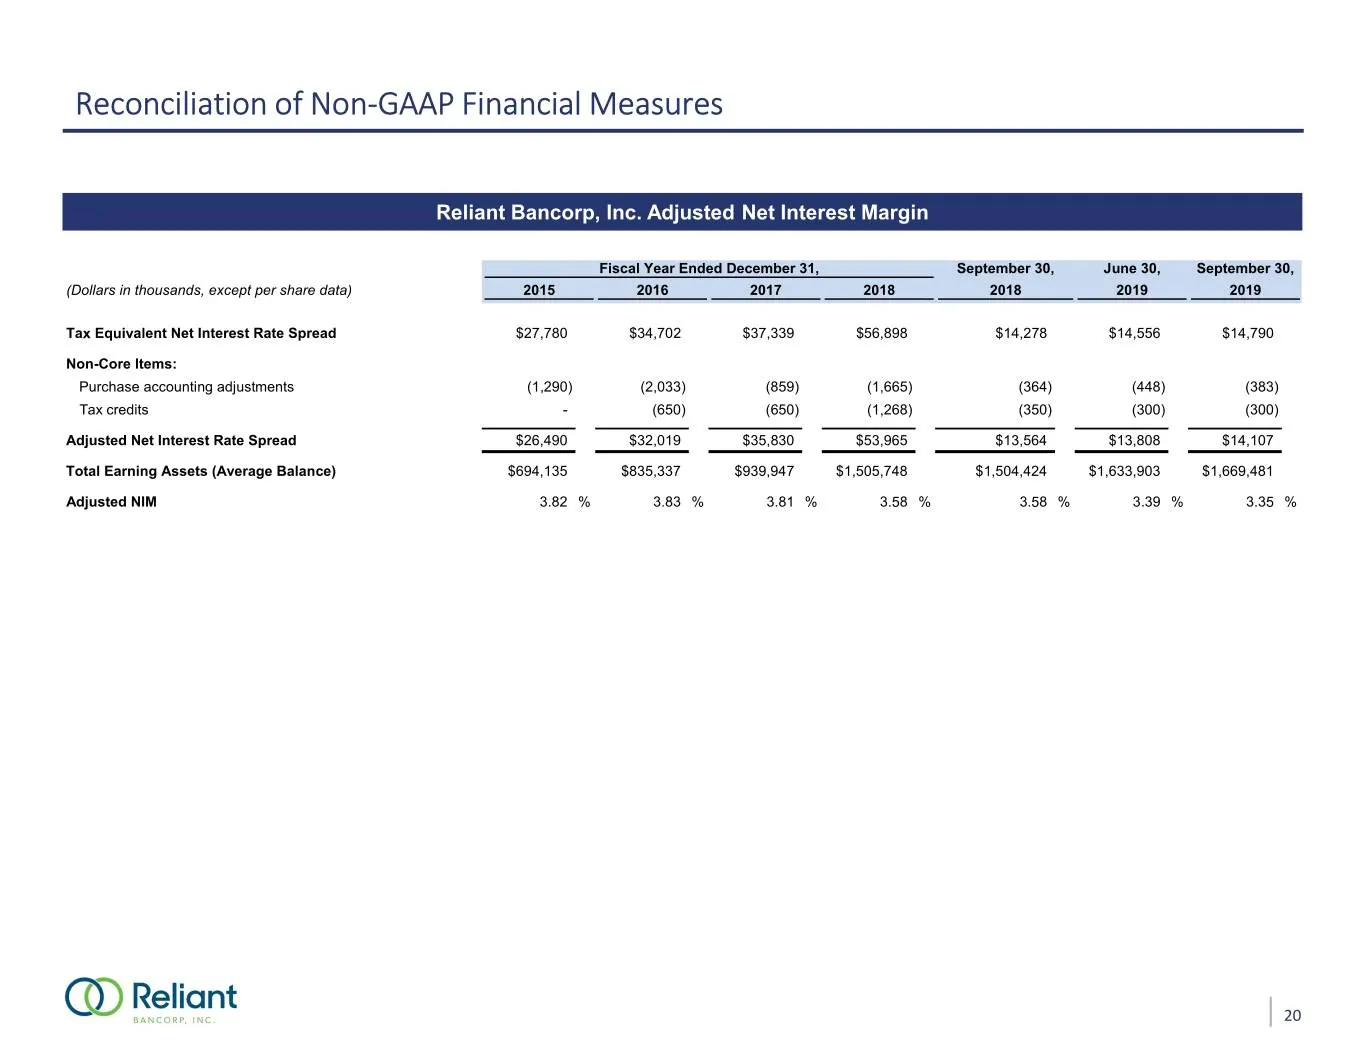
Slide 22: Reconciliation of Non-GAAP Financial Measures: Adjusted Net Interest Margin
Reconciliation of Non-GAAP Financial Measures Reliant Bancorp, Inc. Adjusted Net Interest Margin Fiscal Year Ended December 31, September 30, June 30, September 30, (Dollars in thousands, except per share data) 2015 2016 2017 2018 2018 2019 2019 Tax Equivalent Net Interest Rate Spread $27,780 $34,70
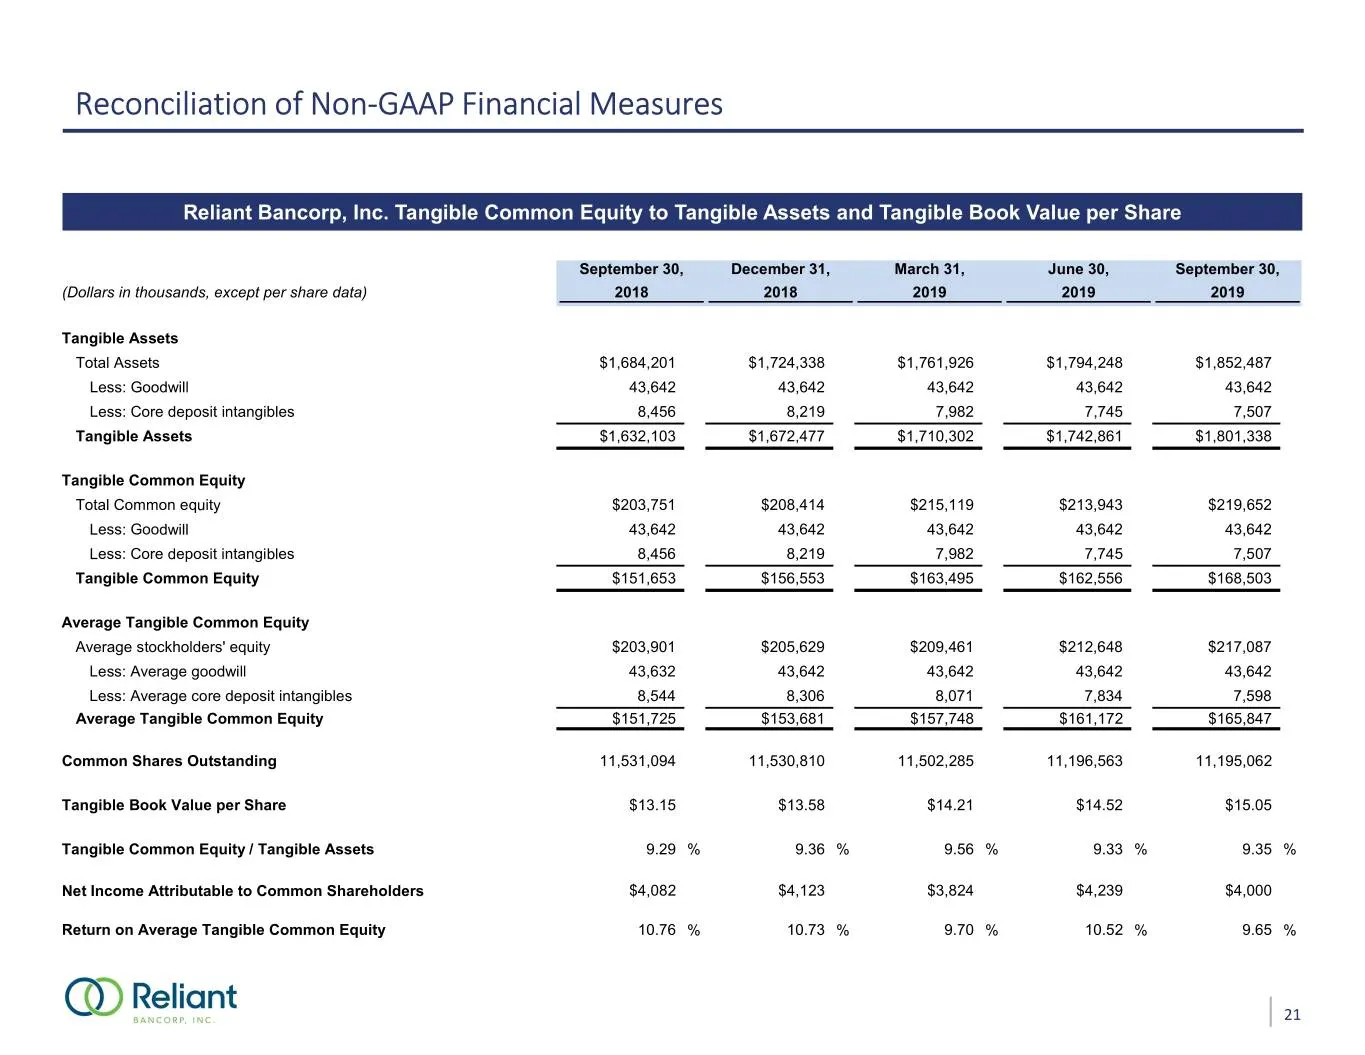
Slide 23: Reconciliation of Non-GAAP Financial Measures: Tangible Common Equity
Reconciliation of Non-GAAP Financial Measures Reliant Bancorp, Inc. Tangible Common Equity to Tangible Assets and Tangible Book Value per Share September 30, December 31, March 31, June 30, September 30, (Dollars in thousands, except per share data) 2018 2018 2019 2019 2019 Tangible Assets Total Ass
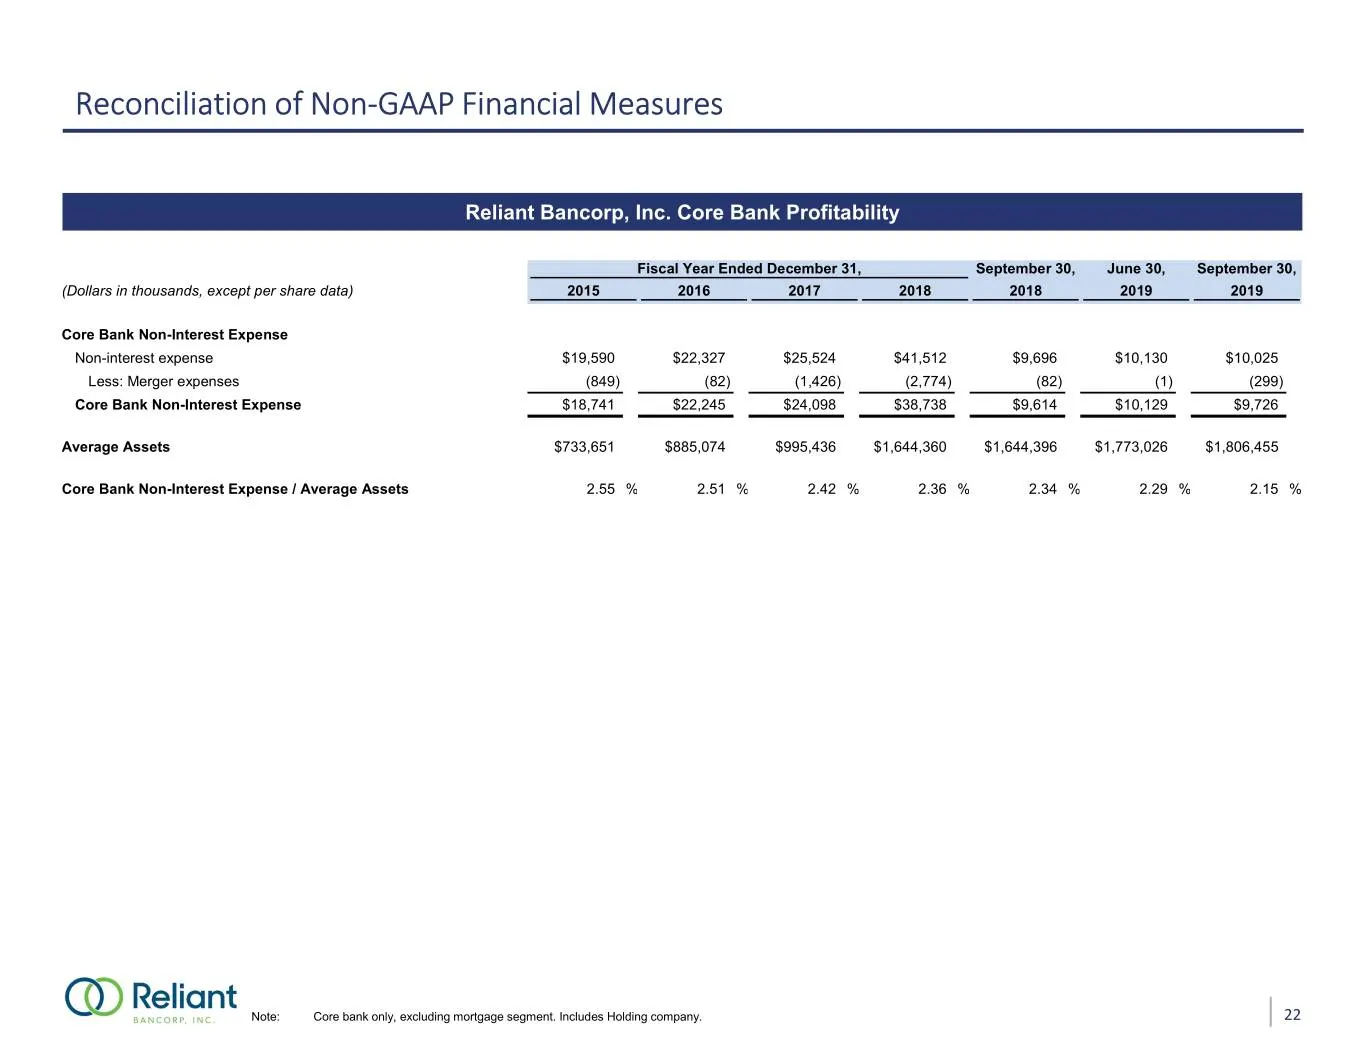
Slide 24: Reconciliation of Non-GAAP Financial Measures: Core Bank Profitability
Reconciliation of Non-GAAP Financial Measures Reliant Bancorp, Inc. Core Bank Profitability Fiscal Year Ended December 31, September 30, June 30, September 30, (Dollars in thousands, except per share data) 2015 2016 2017 2018 2018 2019 2019 Core Bank Non-Interest Expense Non-interest expense $19,590
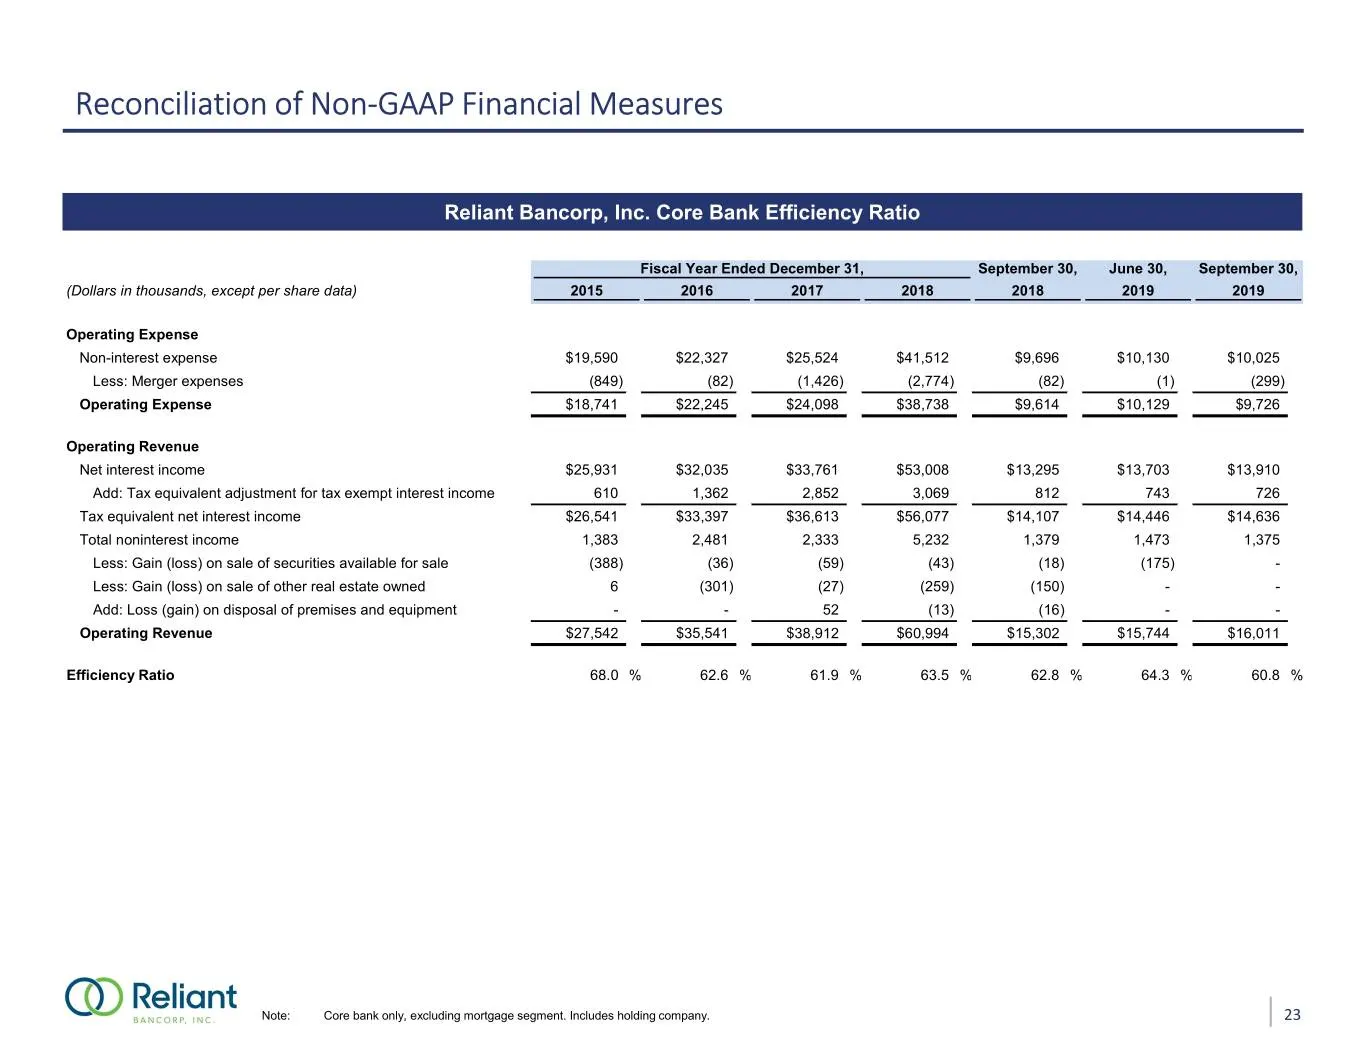
Slide 25: Reconciliation of Non-GAAP Financial Measures: Core Bank Efficiency Ratio
Reconciliation of Non-GAAP Financial Measures Reliant Bancorp, Inc. Core Bank Efficiency Ratio Fiscal Year Ended December 31, September 30, June 30, September 30, (Dollars in thousands, except per share data) 2015 2016 2017 2018 2018 2019 2019 Operating Expense Non-interest expense $19,590 $22,327 $
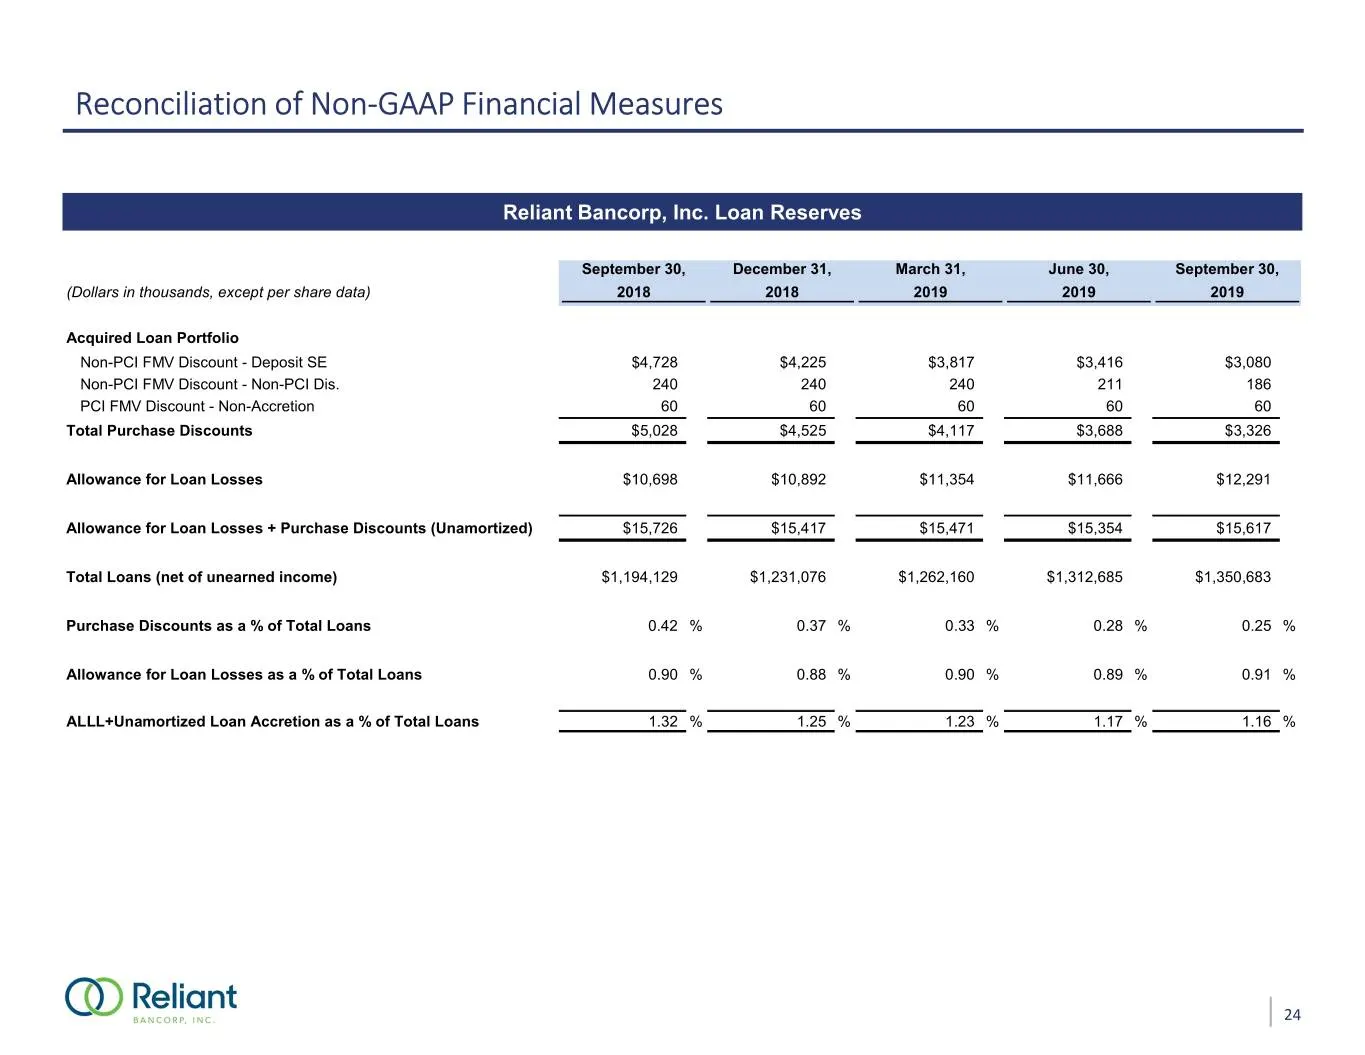
Slide 26: Reconciliation of Non-GAAP Financial Measures: Loan Reserves
Reconciliation of Non-GAAP Financial Measures Reliant Bancorp, Inc. Loan Reserves September 30, December 31, March 31, June 30, September 30, (Dollars in thousands, except per share data) 2018 2018 2019 2019 2019 Acquired Loan Portfolio Non-PCI FMV Discount - Deposit SE $4,728 $4,225 $3,817 $3,416 $
Source: SEC EDGAR · 425 filed Nov 1, 2019
More decks from Reliant Bancorp Inc
 Q3 2021 Earnings Presentation29 slides · Oct 21, 2021
 Q2 2021 Earnings Presentation28 slides · Jul 21, 2021
 Merger or Acquisition (July 2021)13 slides · Jul 15, 2021
 Gulf South Bank Conference 202128 slides · Apr 30, 2021
 Q1 2021 Earnings Presentation18 slides · Apr 22, 2021
 Raymond James Virtual Investor Meetings 202130 slides · Mar 10, 2021