Reliant Bancorp — Gulf South Bank Conference 2021
28 slides from Reliant Bancorp's conference presentation, Apr 30, 2021

Slide 1: Gulf South Bank Conference May 3-4, 2021
R-36 G-53 B-111 R-105 G-189 B-69 R-174 G-174 B-174 R-125 G-170 B-234 R-26 G-94 B-193 R-204 G-214 B-234 R-142 G-180 B-226 R-217 G-149 B-147 Gulf South Bank Conference May 3-4, 2021
Slide 2: Safe Harbor Statements
R-36 G-53 B-111 R-105 G-189 B-69 R-174 G-174 B-174 R-125 G-170 B-234 R-26 G-94 B-193 R-204 G-214 B-234 R-142 G-180 B-226 R-217 G-149 B-147 1 Safe Harbor Statements Forward-Looking Statements All statements, other than statements of historical fact, included in this presentation and any oral statemen
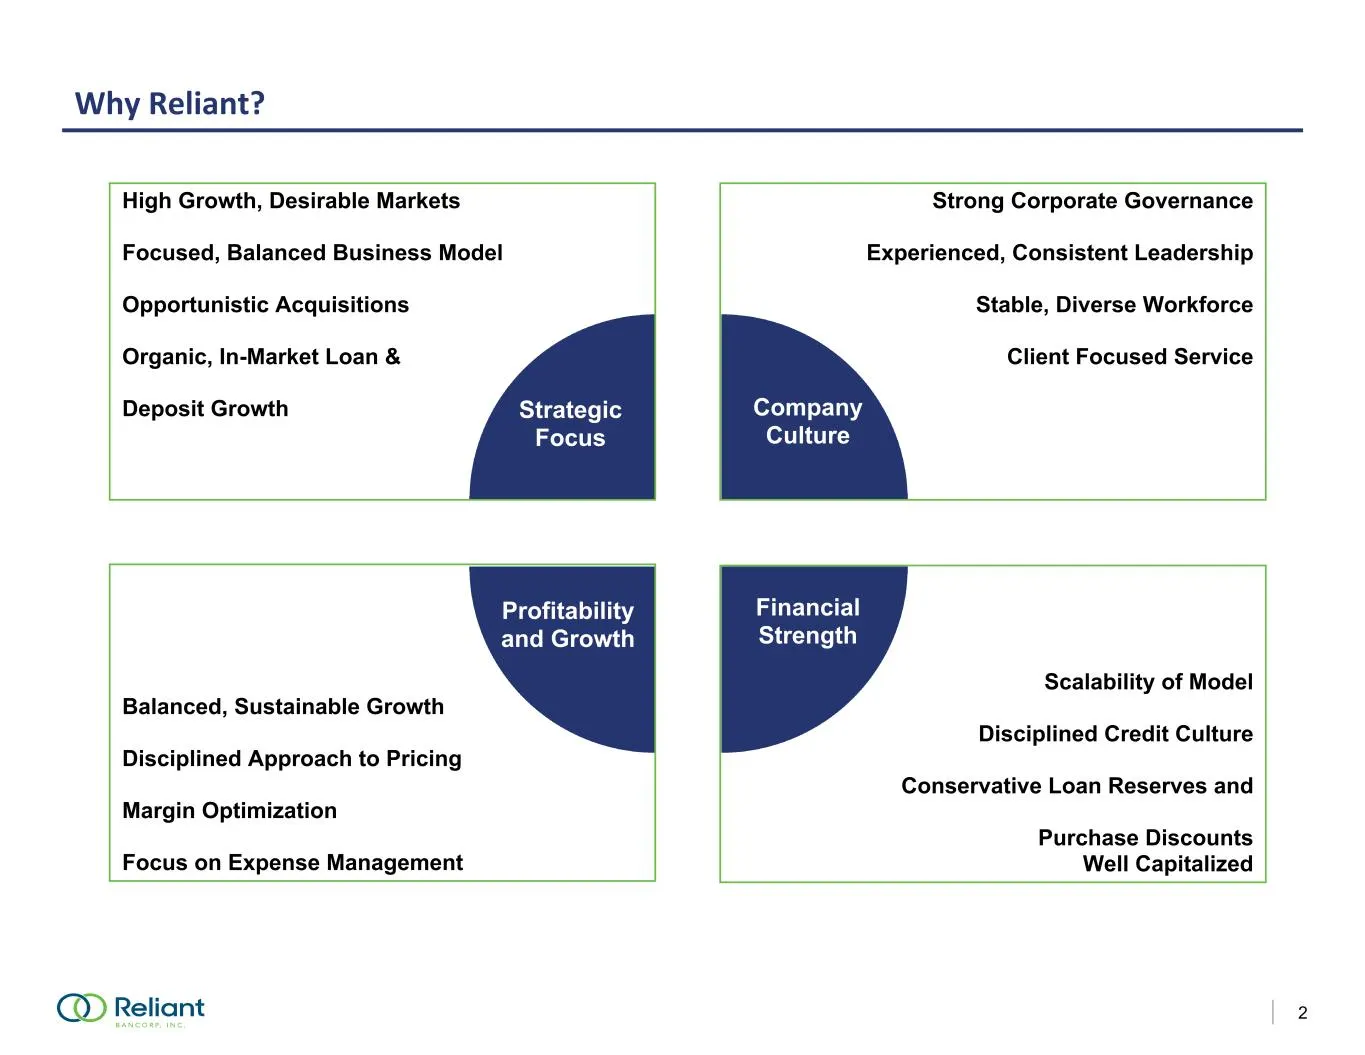
Slide 3: Why Reliant?
R-36 G-53 B-111 R-105 G-189 B-69 R-174 G-174 B-174 R-125 G-170 B-234 R-26 G-94 B-193 R-204 G-214 B-234 R-142 G-180 B-226 R-217 G-149 B-147 2 Why Reliant? High Growth, Desirable Markets Focused, Balanced Business Model Opportunistic Acquisitions Organic, In-Market Loan & Deposit Growth Balanced, Sust
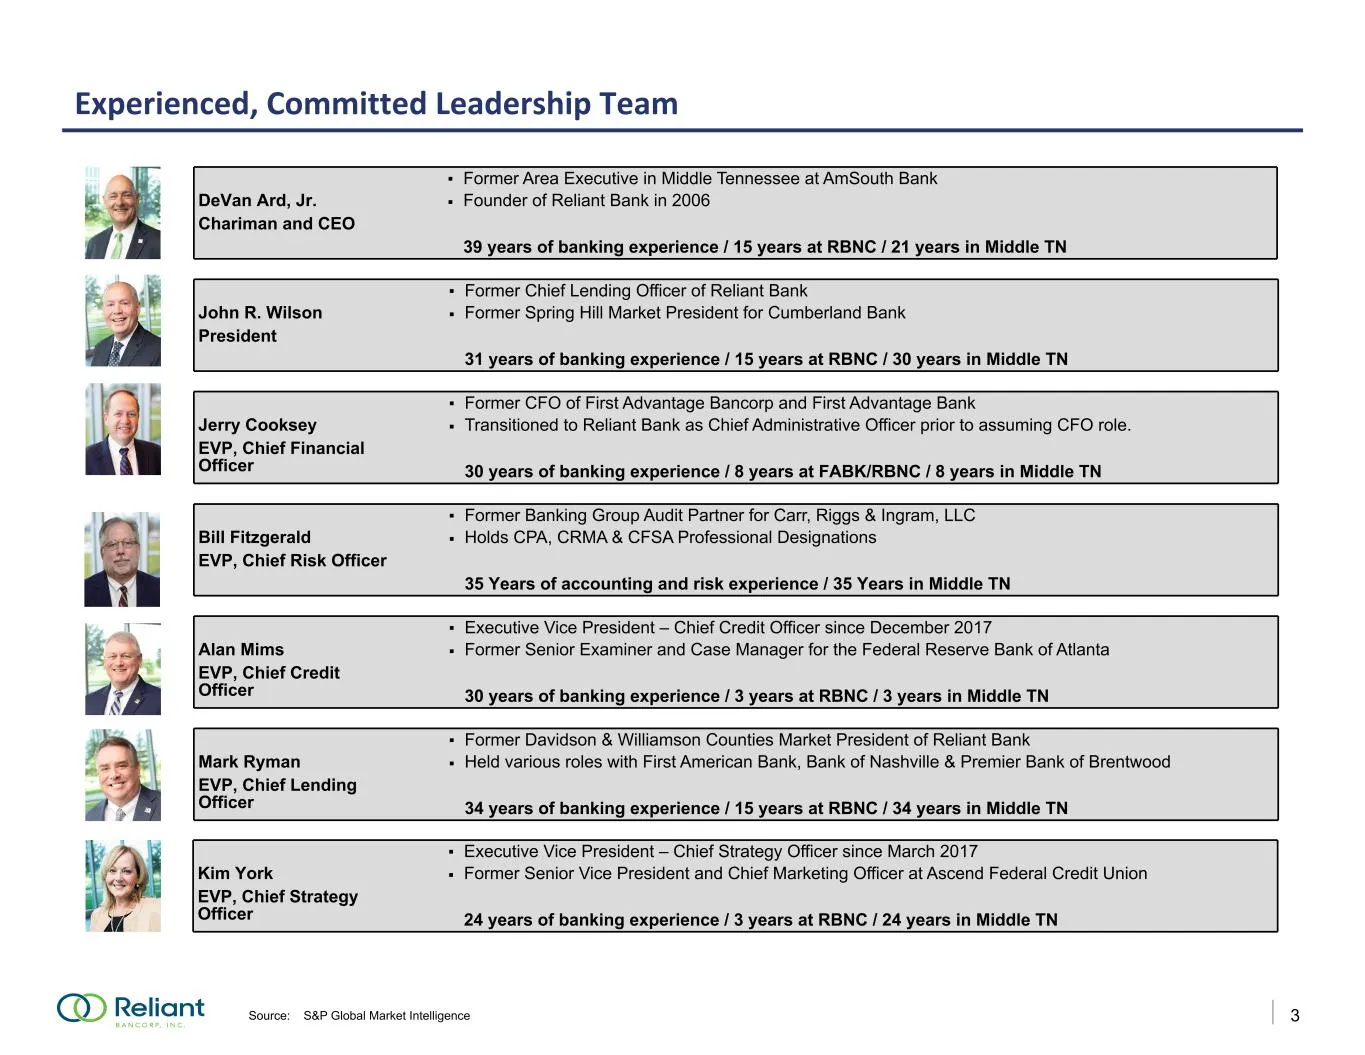
Slide 4: Experienced, Committed Leadership Team
R-36 G-53 B-111 R-105 G-189 B-69 R-174 G-174 B-174 R-125 G-170 B-234 R-26 G-94 B-193 R-204 G-214 B-234 R-142 G-180 B-226 R-217 G-149 B-147 3 Experienced, Committed Leadership Team Source: S&P Global Market Intelligence . Former Area Executive in Middle Tennessee at AmSouth Bank DeVan Ard, Jr. . Foun
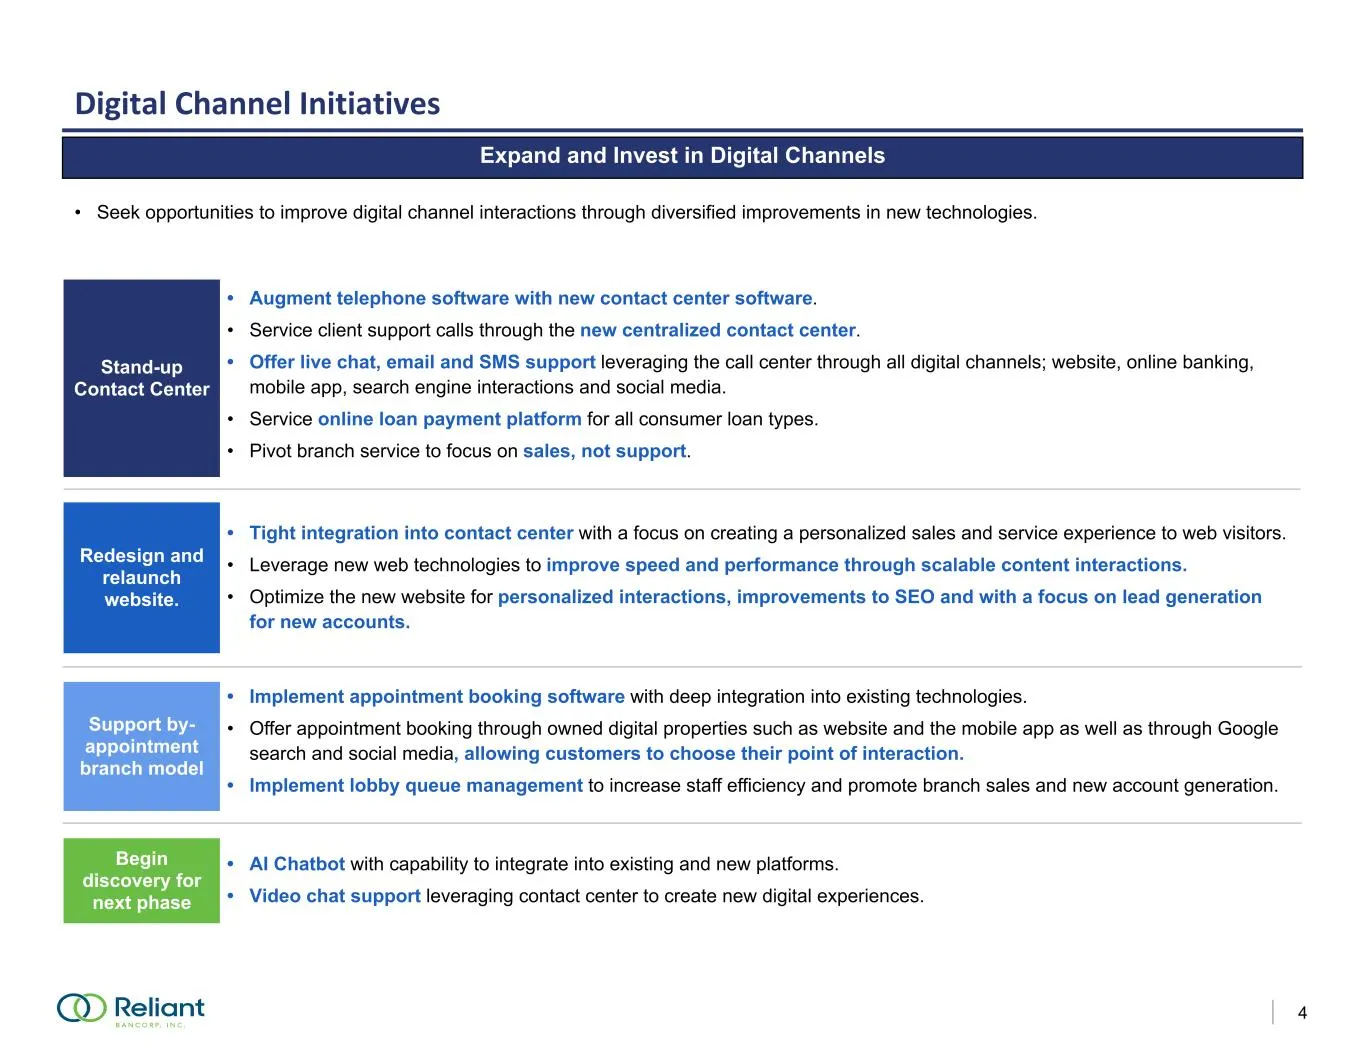
Slide 5: Digital Channel Initiatives
R-36 G-53 B-111 R-105 G-189 B-69 R-174 G-174 B-174 R-125 G-170 B-234 R-26 G-94 B-193 R-204 G-214 B-234 R-142 G-180 B-226 R-217 G-149 B-147 4 Digital Channel Initiatives Employees Ensuring Health and Safety of our Team Members Communities Helping the Communities we Serve Communities Helping the Commu
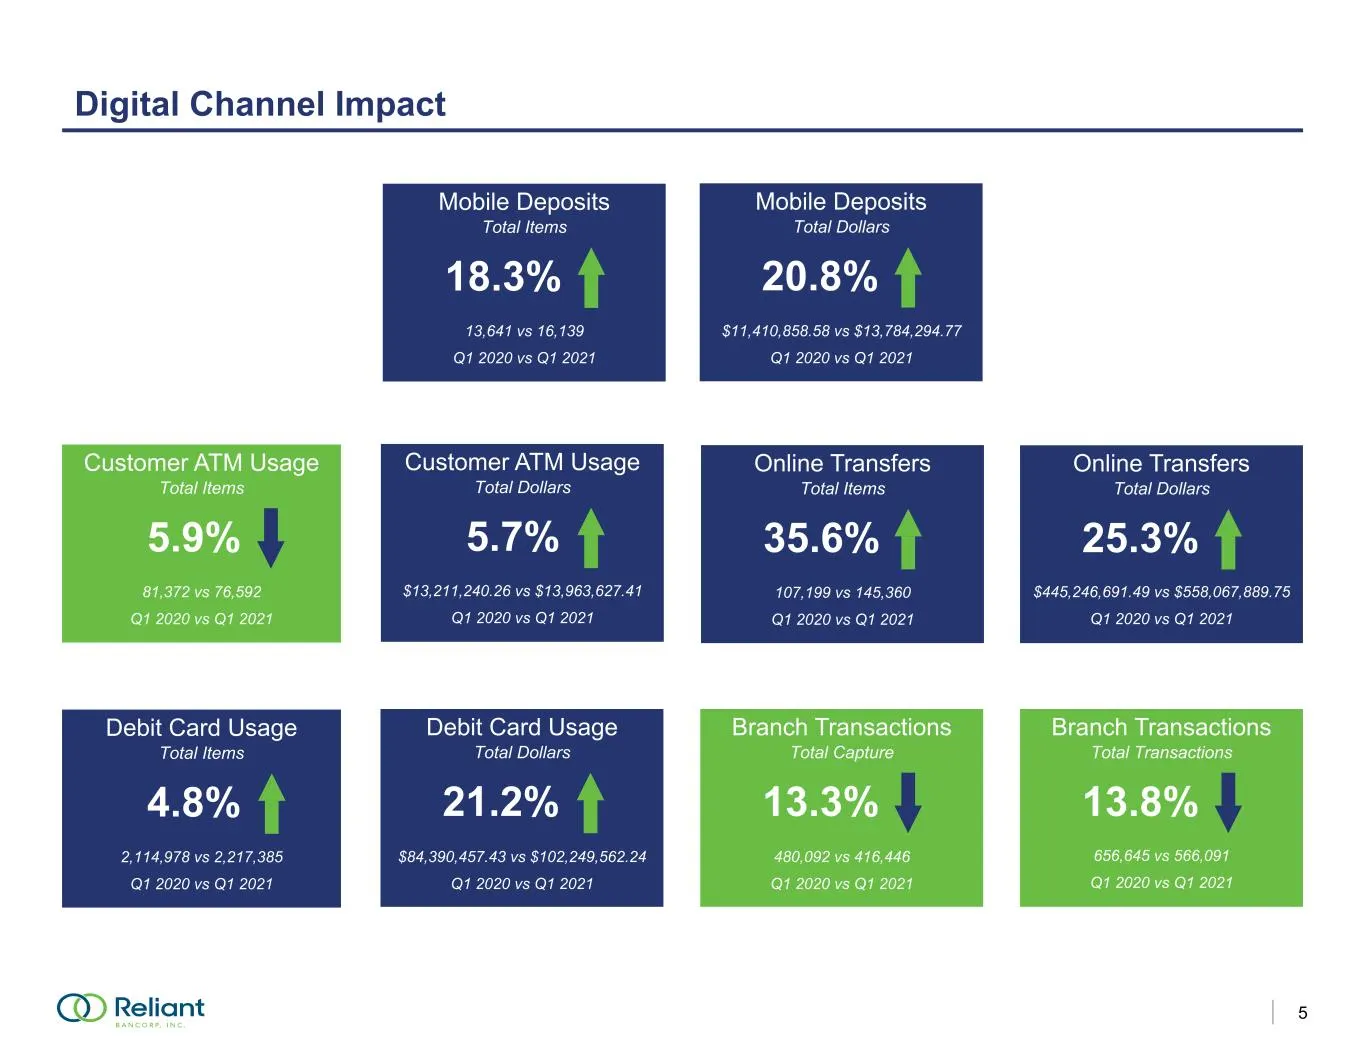
Slide 6: Digital Channel Impact
R-36 G-53 B-111 R-105 G-189 B-69 R-174 G-174 B-174 R-125 G-170 B-234 R-26 G-94 B-193 R-204 G-214 B-234 R-142 G-180 B-226 R-217 G-149 B-147 5 Digital Channel Impact 18.3% Mobile Deposits Total Items 13,641 vs 16,139 Q1 2020 vs Q1 2021 20.8% Mobile Deposits Total Dollars $11,410,858.58 vs $13,784,294.
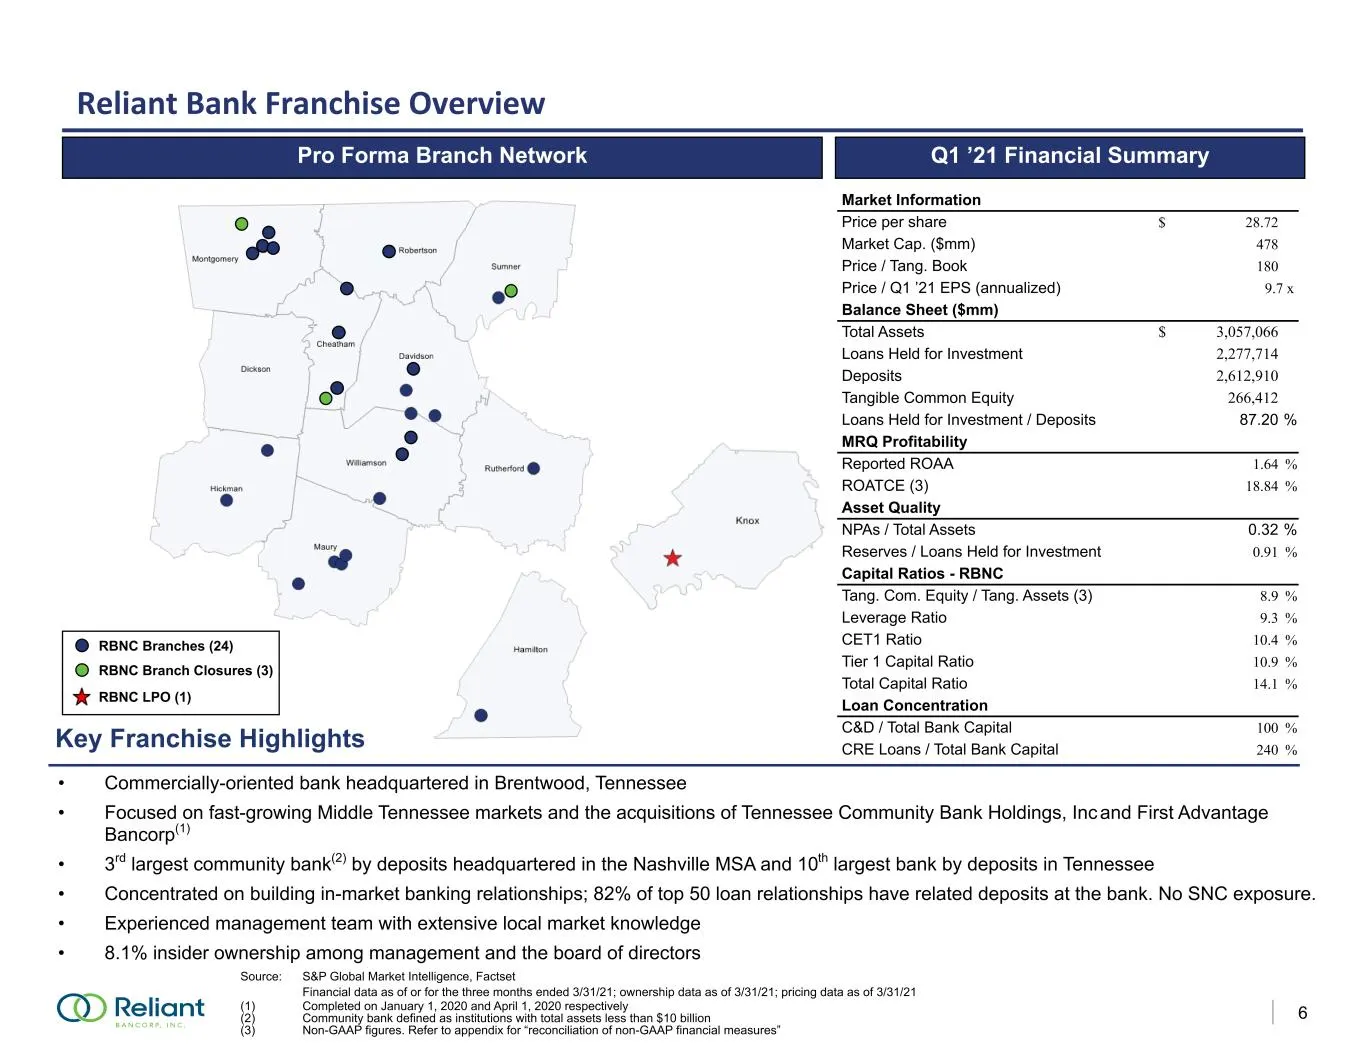
Slide 7: Reliant Bank Franchise Overview and Q1 '21 Financial Summary
R-36 G-53 B-111 R-105 G-189 B-69 R-174 G-174 B-174 R-125 G-170 B-234 R-26 G-94 B-193 R-204 G-214 B-234 R-142 G-180 B-226 R-217 G-149 B-147 6 Reliant Bank Franchise Overview Q1 ’21 Financial Summary Key Franchise Highlights Source: S&P Global Market Intelligence, Factset Financial data as of or for t
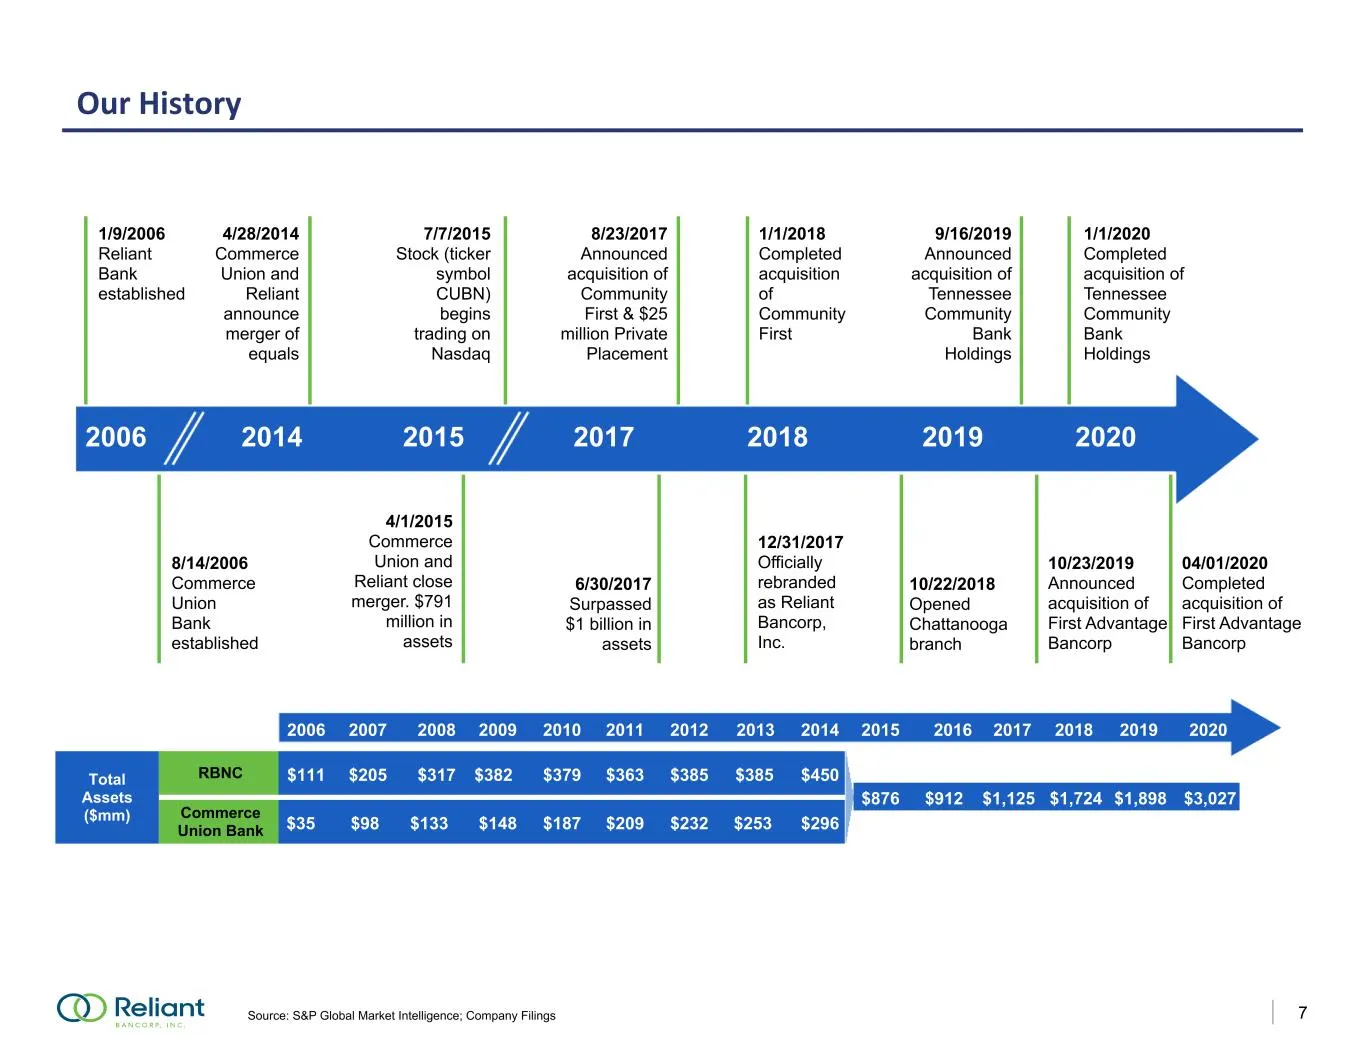
Slide 8: Our History
R-36 G-53 B-111 R-105 G-189 B-69 R-174 G-174 B-174 R-125 G-170 B-234 R-26 G-94 B-193 R-204 G-214 B-234 R-142 G-180 B-226 R-217 G-149 B-147 7Source: S&P Global Market Intelligence; Company Filings 2006 Our History Total Assets ($mm) RBNC Commerce Union Bank 1/9/2006 Reliant Bank established 4/28/2014
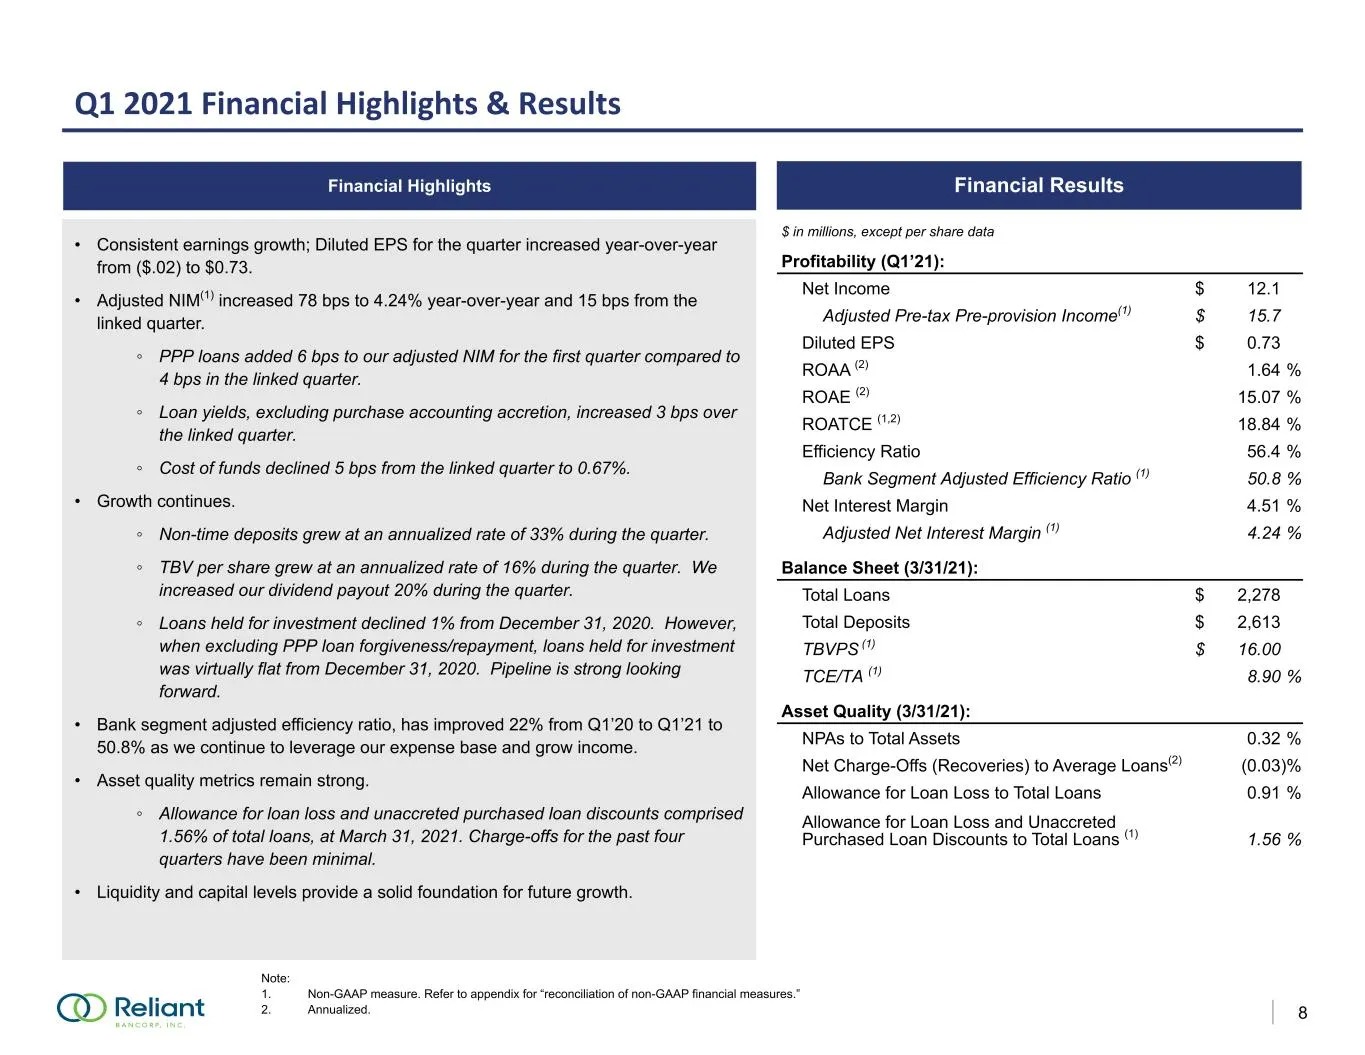
Slide 9: Q1 2021 Financial Highlights & Results
R-36 G-53 B-111 R-105 G-189 B-69 R-174 G-174 B-174 R-125 G-170 B-234 R-26 G-94 B-193 R-204 G-214 B-234 R-142 G-180 B-226 R-217 G-149 B-147 8 Q1 2021 Financial Highlights & Results Financial Highlights Financial Results Note: 1. Non-GAAP measure. Refer to appendix for “reconciliation of non-GAAP fina
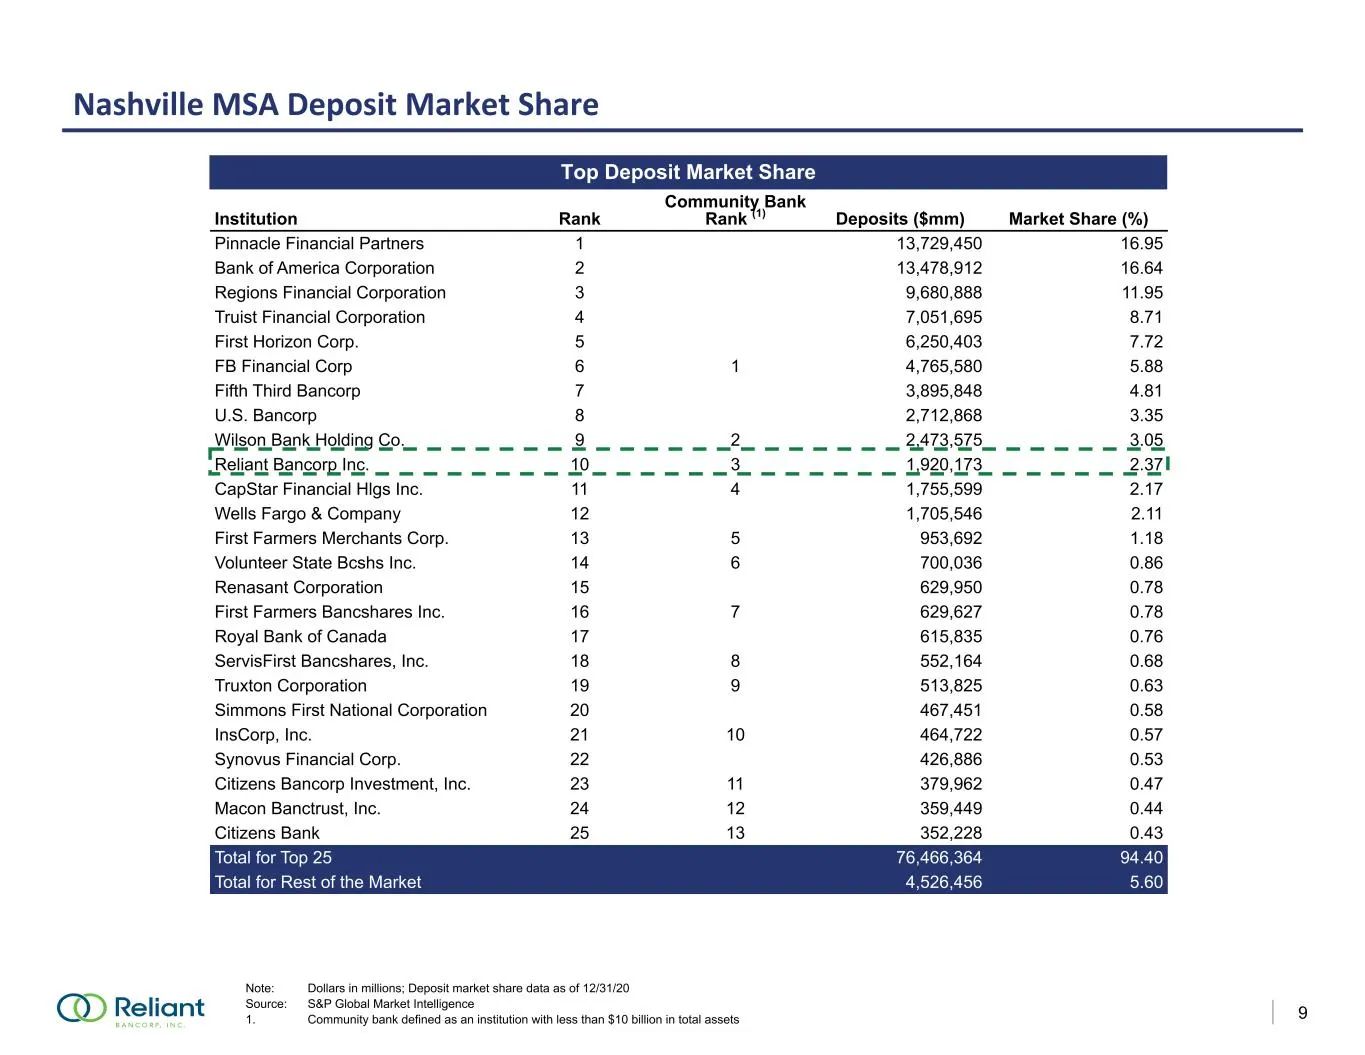
Slide 10: Nashville MSA Deposit Market Share
R-36 G-53 B-111 R-105 G-189 B-69 R-174 G-174 B-174 R-125 G-170 B-234 R-26 G-94 B-193 R-204 G-214 B-234 R-142 G-180 B-226 R-217 G-149 B-147 9 Nashville MSA Deposit Market Share Top Deposit Market Share Note: Dollars in millions; Deposit market share data as of 12/31/20 Source: S&P Global Market Intel
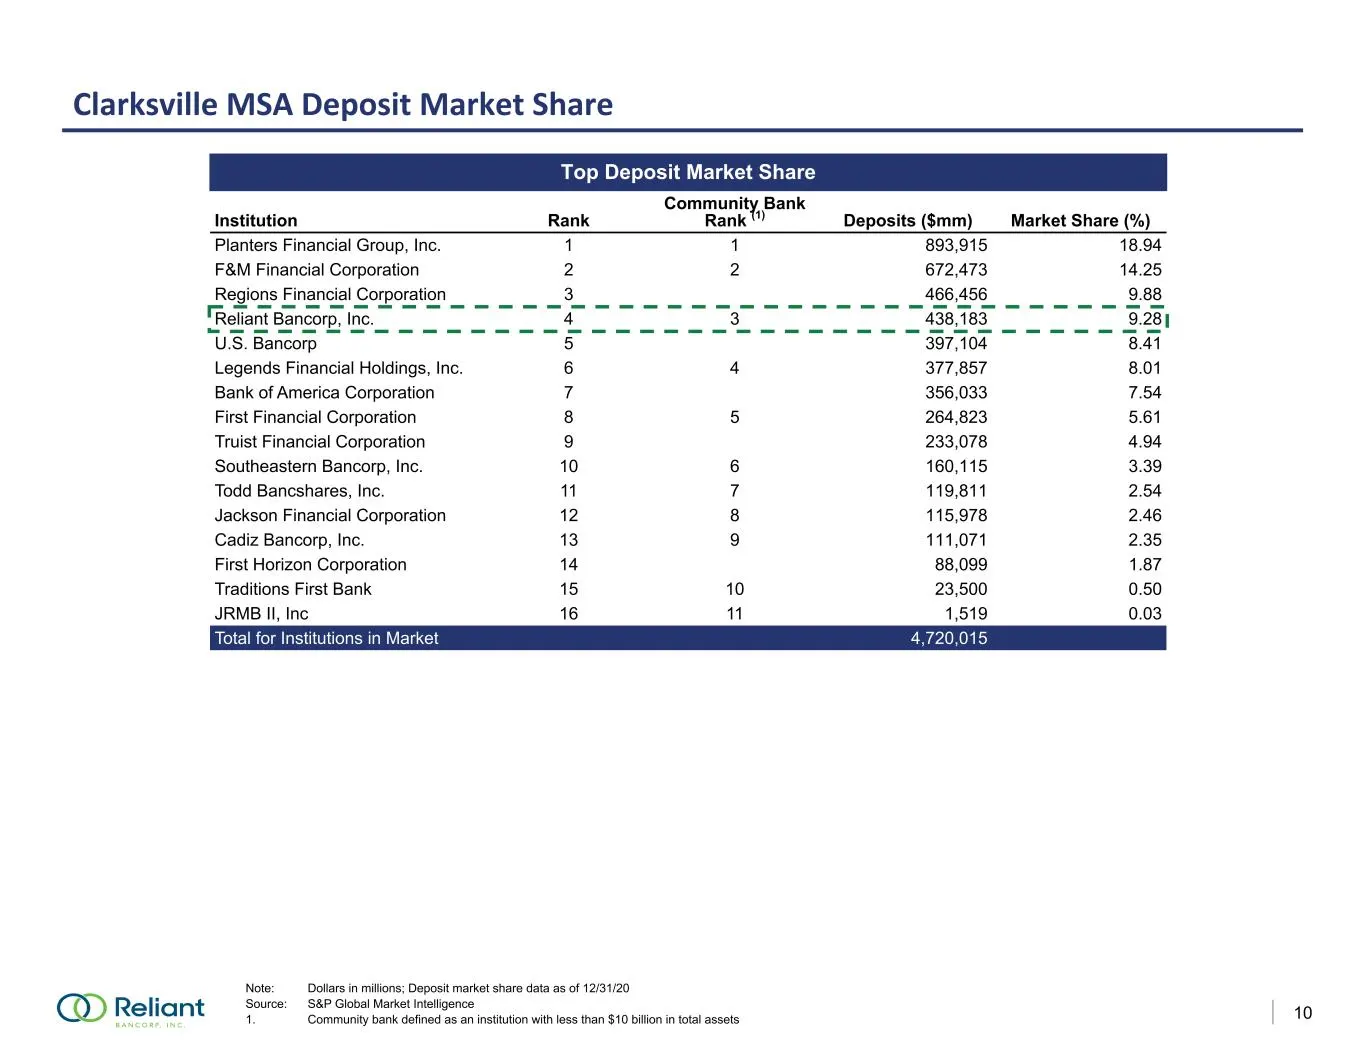
Slide 11: Clarksville MSA Deposit Market Share
R-36 G-53 B-111 R-105 G-189 B-69 R-174 G-174 B-174 R-125 G-170 B-234 R-26 G-94 B-193 R-204 G-214 B-234 R-142 G-180 B-226 R-217 G-149 B-147 10 Clarksville MSA Deposit Market Share Top Deposit Market Share Note: Dollars in millions; Deposit market share data as of 12/31/20 Source: S&P Global Market In
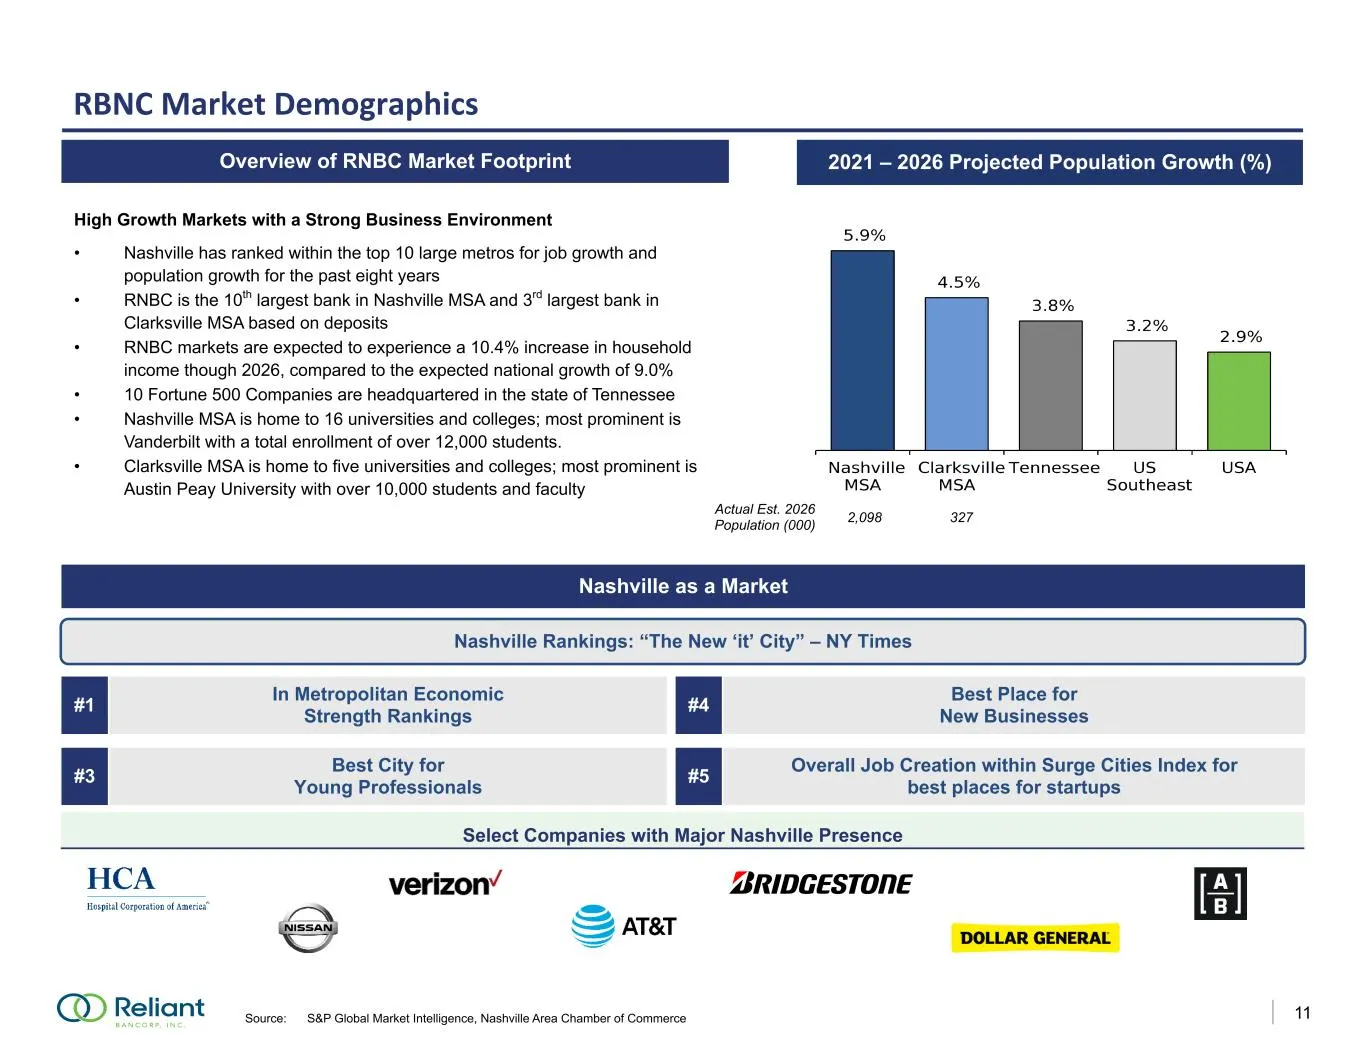
Slide 12: RBNC Market Demographics
R-36 G-53 B-111 R-105 G-189 B-69 R-174 G-174 B-174 R-125 G-170 B-234 R-26 G-94 B-193 R-204 G-214 B-234 R-142 G-180 B-226 R-217 G-149 B-147 11 RBNC Market Demographics Overview of RNBC Market Footprint High Growth Markets with a Strong Business Environment • Nashville has ranked within the top 10 lar
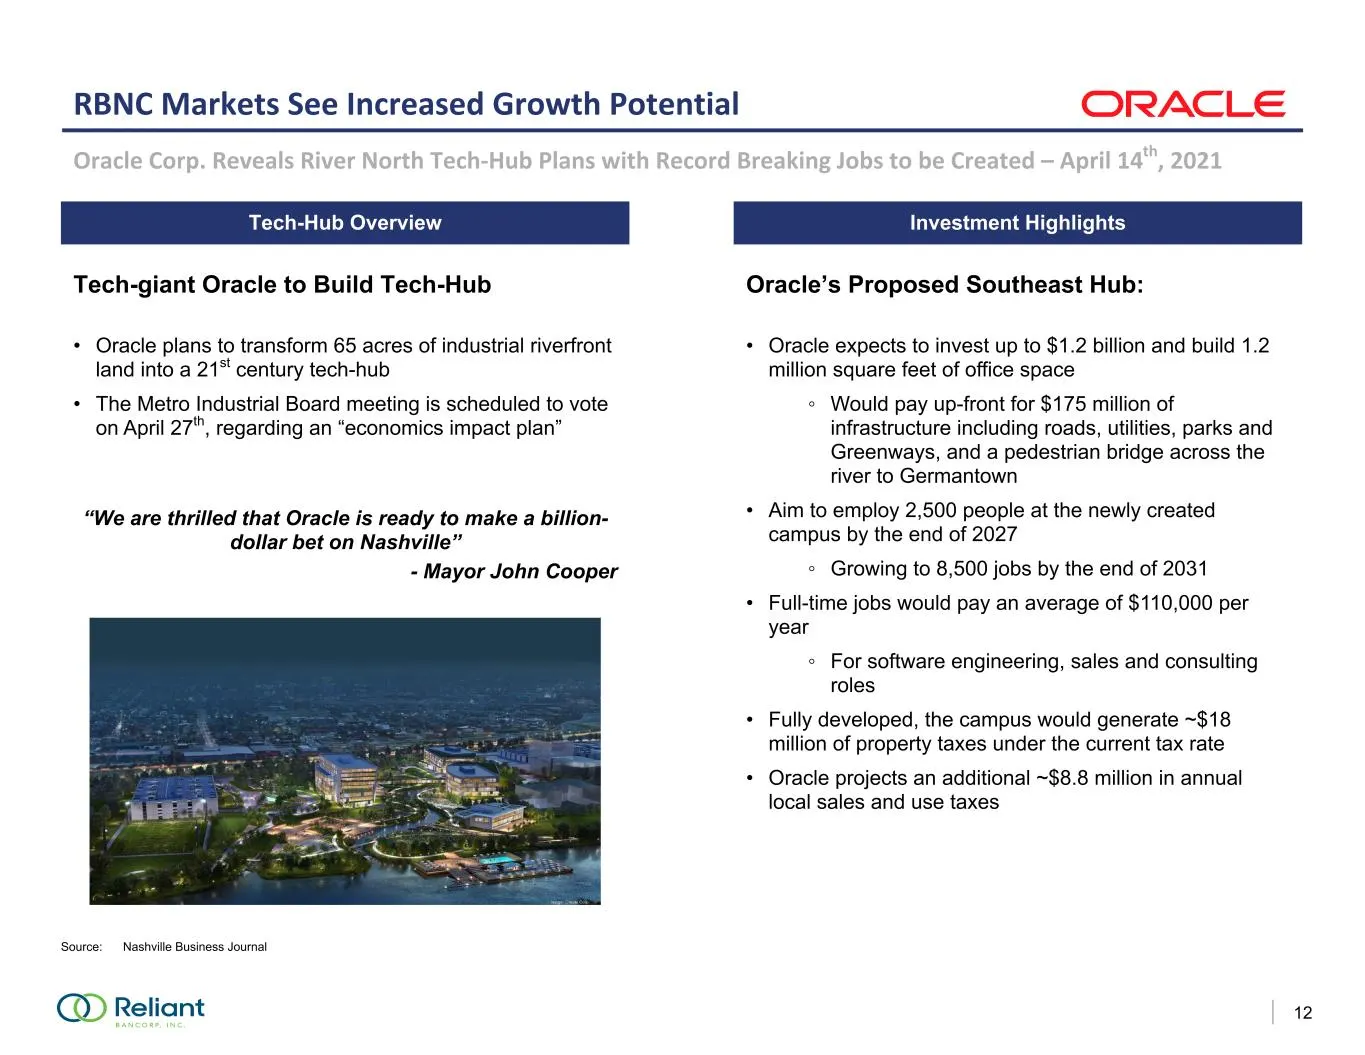
Slide 13: RBNC Markets See Increased Growth Potential
R-36 G-53 B-111 R-105 G-189 B-69 R-174 G-174 B-174 R-125 G-170 B-234 R-26 G-94 B-193 R-204 G-214 B-234 R-142 G-180 B-226 R-217 G-149 B-147 12 RBNC Markets See Increased Growth Potential Tech-Hub Overview Source: Nashville Business Journal Oracle Corp. Reveals River North Tech-Hub Plans with Record B
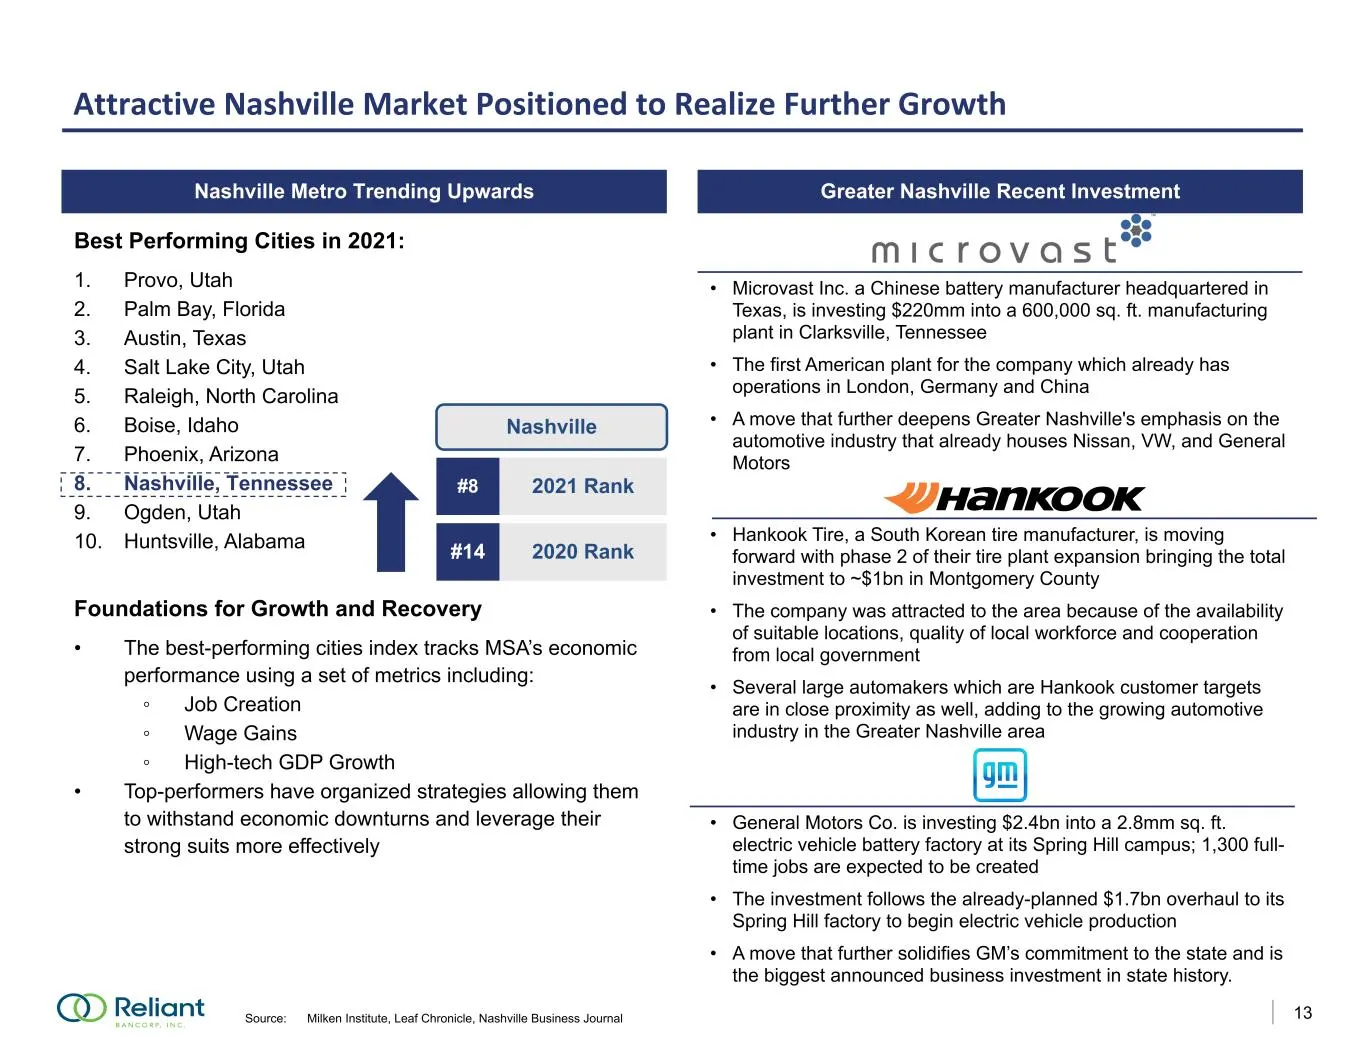
Slide 14: Best Performing Cities in 2021
R-36 G-53 B-111 R-105 G-189 B-69 R-174 G-174 B-174 R-125 G-170 B-234 R-26 G-94 B-193 R-204 G-214 B-234 R-142 G-180 B-226 R-217 G-149 B-147 13 Best Performing Cities in 2021: 1. Provo, Utah 2. Palm Bay, Florida 3. Austin, Texas 4. Salt Lake City, Utah 5. Raleigh, North Carolina 6. Boise, Idaho 7. Pho
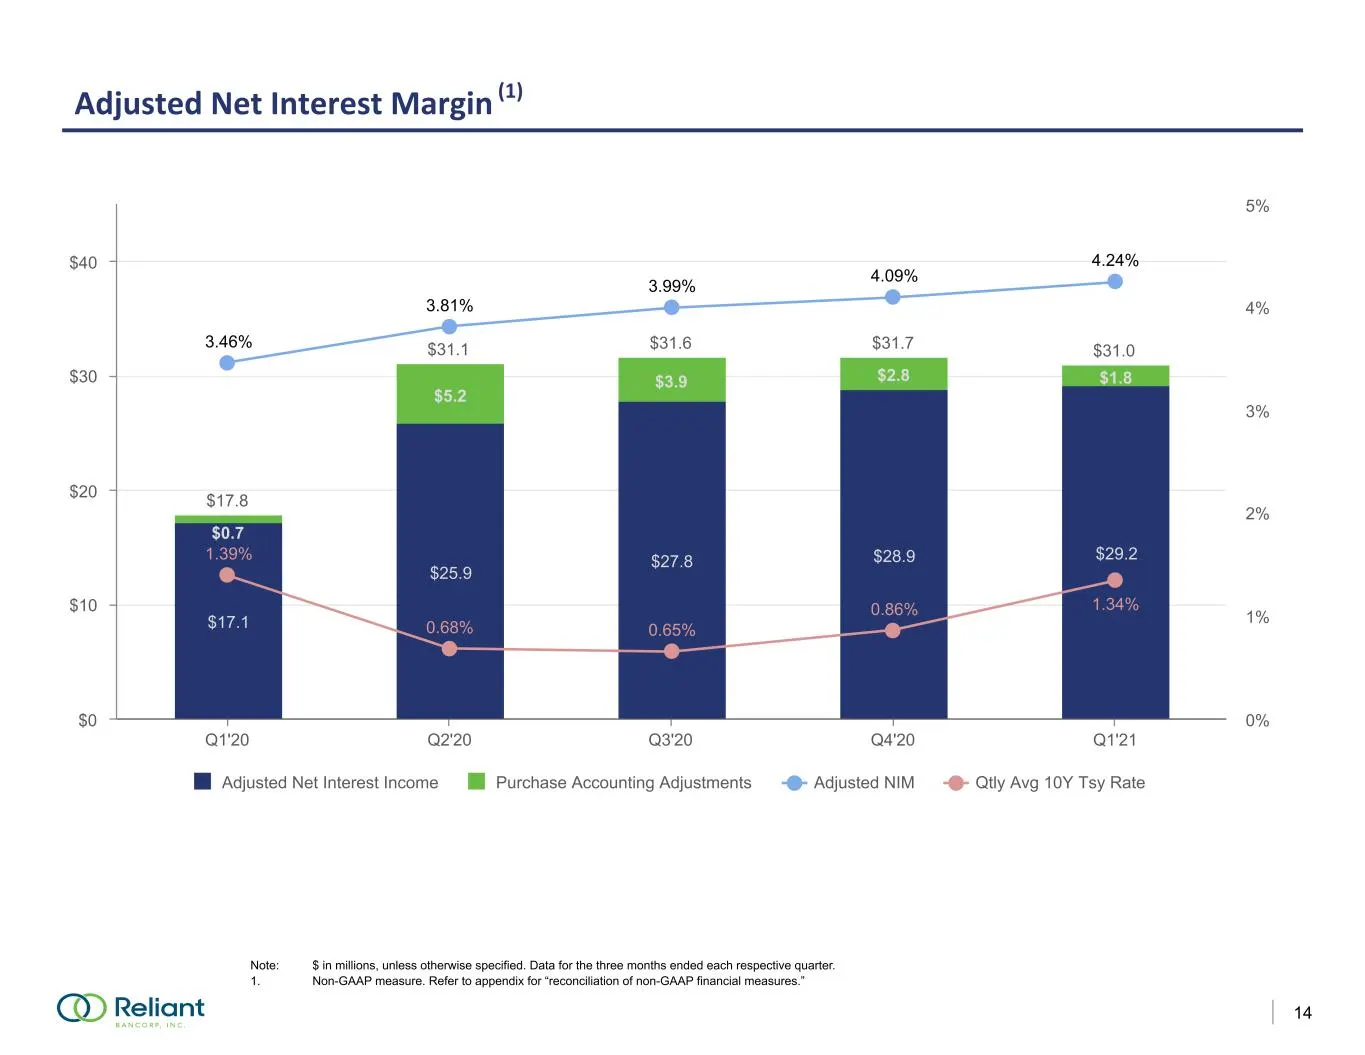
Slide 15: Adjusted Net Interest Margin
R-36 G-53 B-111 R-105 G-189 B-69 R-174 G-174 B-174 R-125 G-170 B-234 R-26 G-94 B-193 R-204 G-214 B-234 R-142 G-180 B-226 R-217 G-149 B-147 14 Adjusted Net Interest Margin (1) Note: $ in millions, unless otherwise specified. Data for the three months ended each respective quarter. 1. Non-GAAP measure
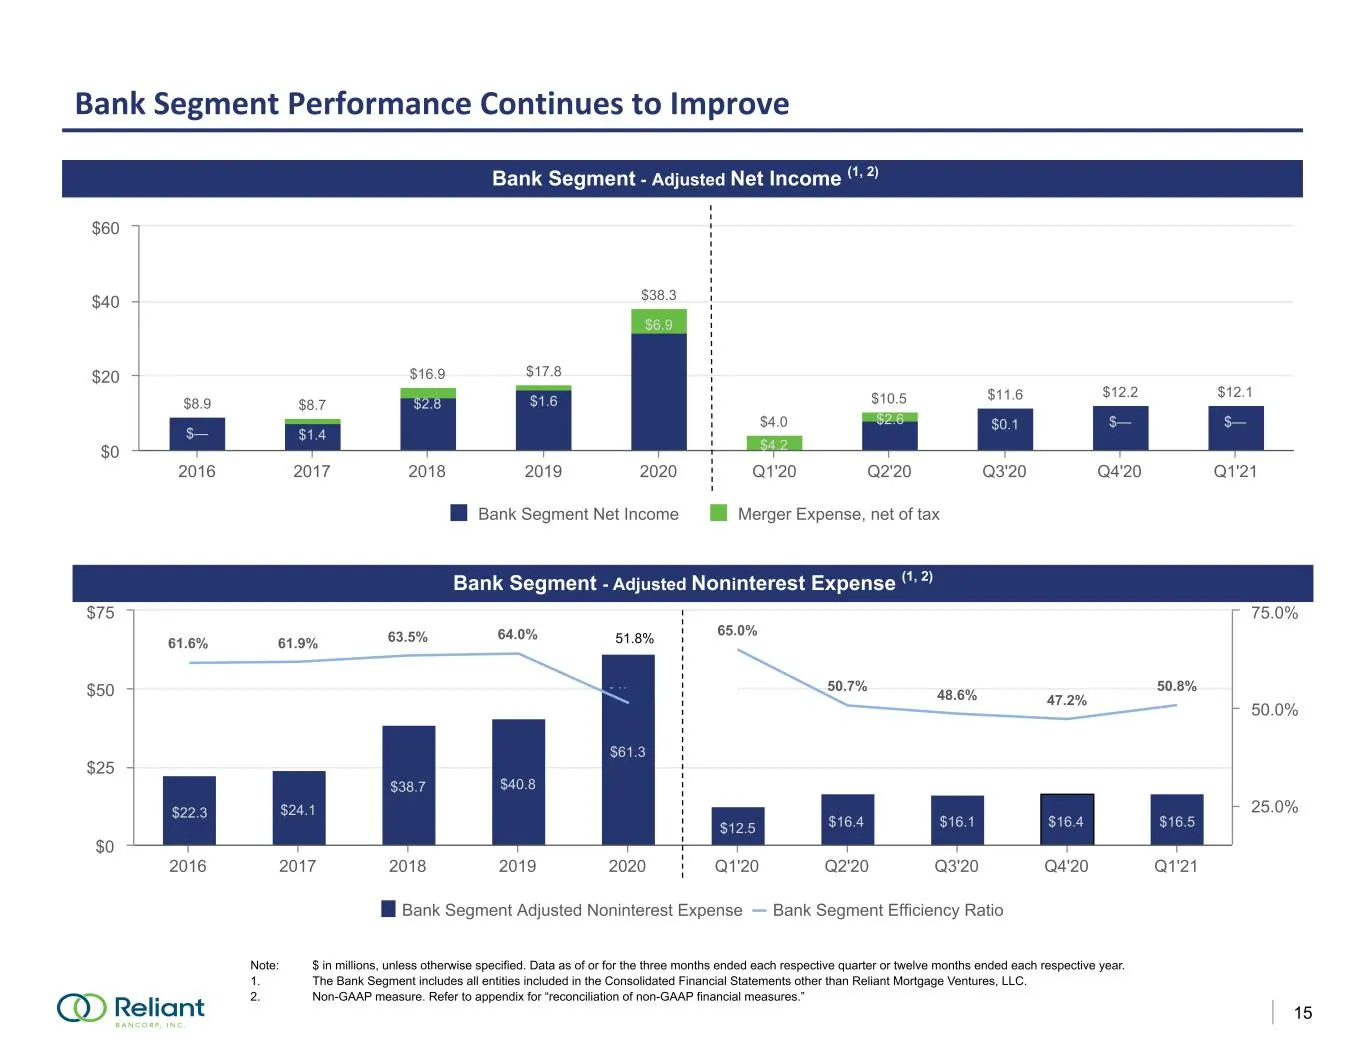
Slide 16: Bank Segment Performance Continues to Improve
R-36 G-53 B-111 R-105 G-189 B-69 R-174 G-174 B-174 R-125 G-170 B-234 R-26 G-94 B-193 R-204 G-214 B-234 R-142 G-180 B-226 R-217 G-149 B-147 15 Bank Segment Performance Continues to Improve Bank Segment - Adjusted Net Income (1, 2) Note: $ in millions, unless otherwise specified. Data as of or for the
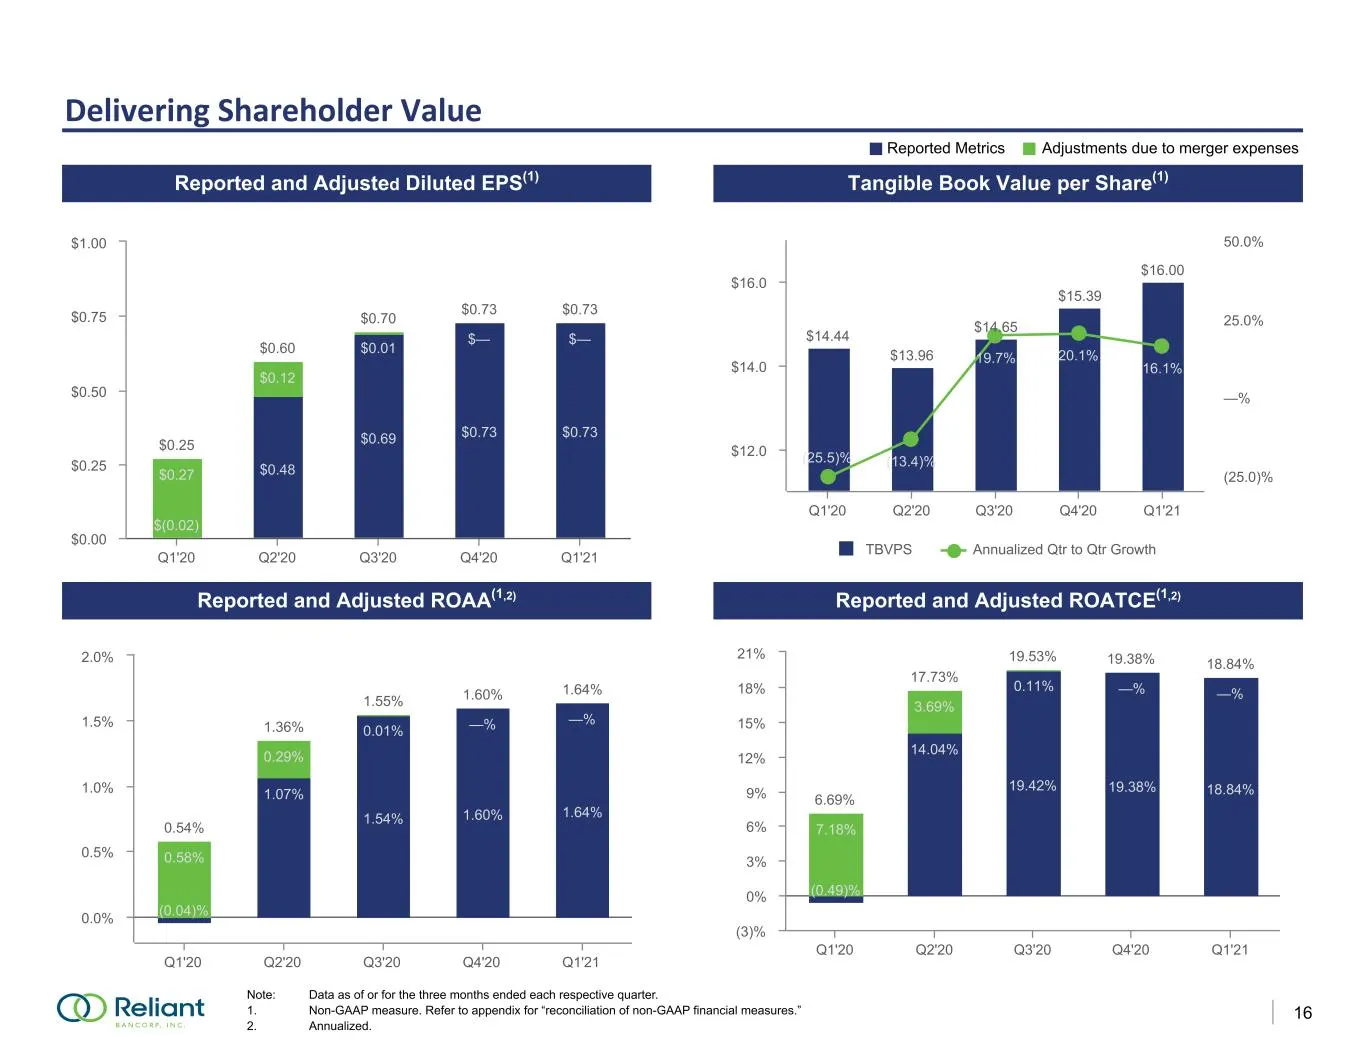
Slide 17: Delivering Shareholder Value
R-36 G-53 B-111 R-105 G-189 B-69 R-174 G-174 B-174 R-125 G-170 B-234 R-26 G-94 B-193 R-204 G-214 B-234 R-142 G-180 B-226 R-217 G-149 B-147 16 Delivering Shareholder Value Reported and Adjusted Diluted EPS(1) Tangible Book Value per Share(1) Reported and Adjusted ROAA(1,2) Reported and Adjusted ROATC
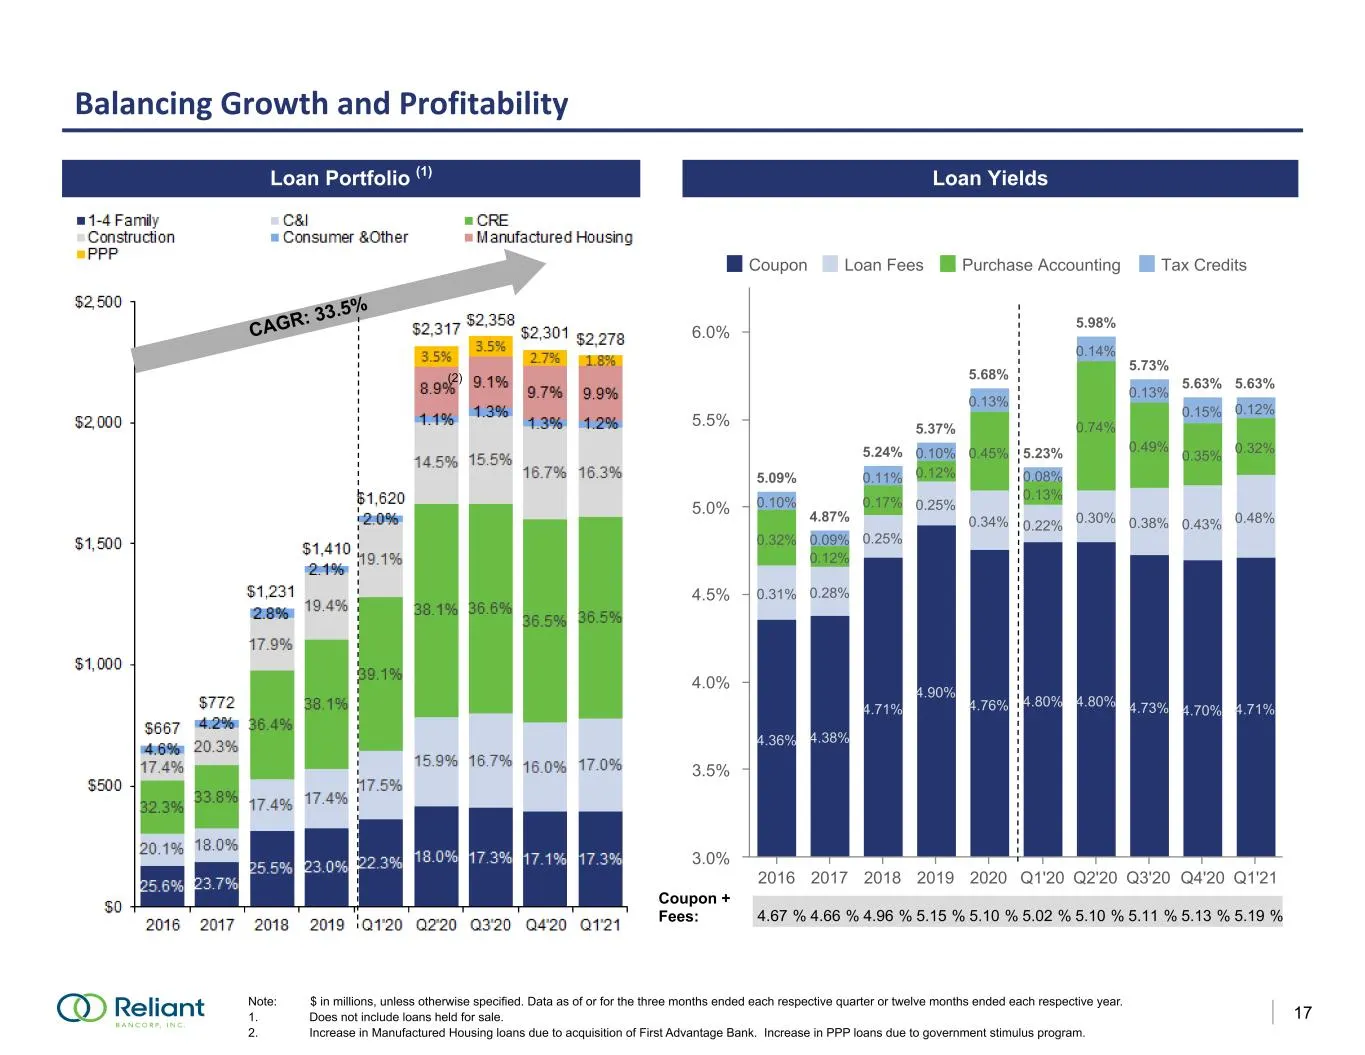
Slide 18: Balancing Growth and Profitability
R-36 G-53 B-111 R-105 G-189 B-69 R-174 G-174 B-174 R-125 G-170 B-234 R-26 G-94 B-193 R-204 G-214 B-234 R-142 G-180 B-226 R-217 G-149 B-147 17 Balancing Growth and Profitability Coupon + Fees: Loan Portfolio (1) Note: $ in millions, unless otherwise specified. Data as of or for the three months ended
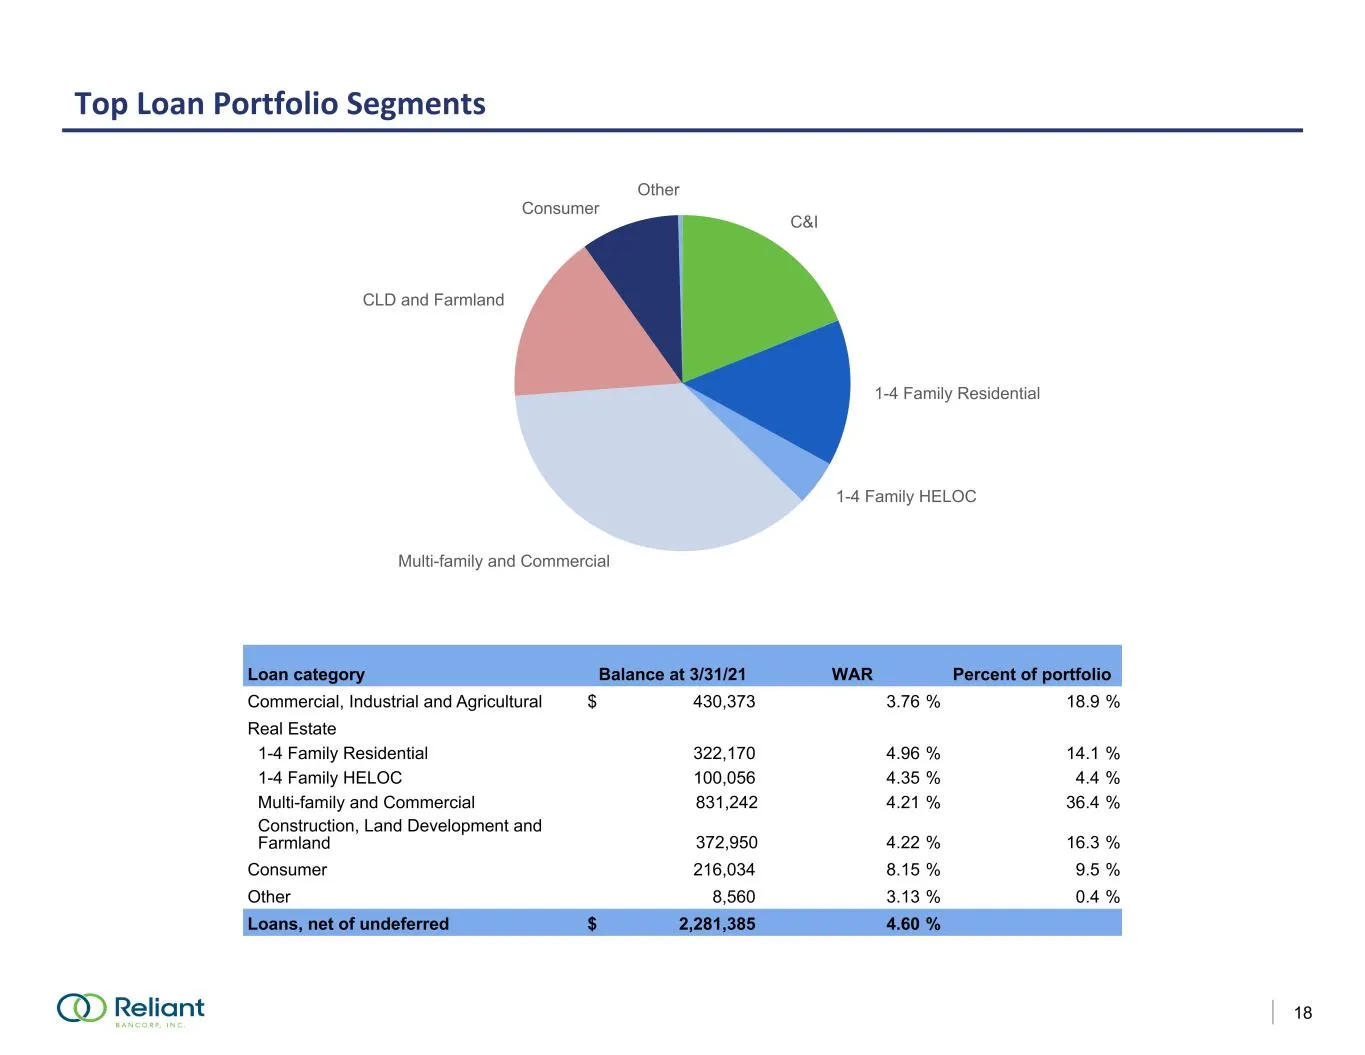
Slide 19: Top Loan Portfolio Segments
R-36 G-53 B-111 R-105 G-189 B-69 R-174 G-174 B-174 R-125 G-170 B-234 R-26 G-94 B-193 R-204 G-214 B-234 R-142 G-180 B-226 R-217 G-149 B-147 18 Top Loan Portfolio Segments Loan category Balance at 3/31/21 WAR Percent of portfolio Commercial, Industrial and Agricultural $ 430,373 3.76 % 18.9 % Real Est
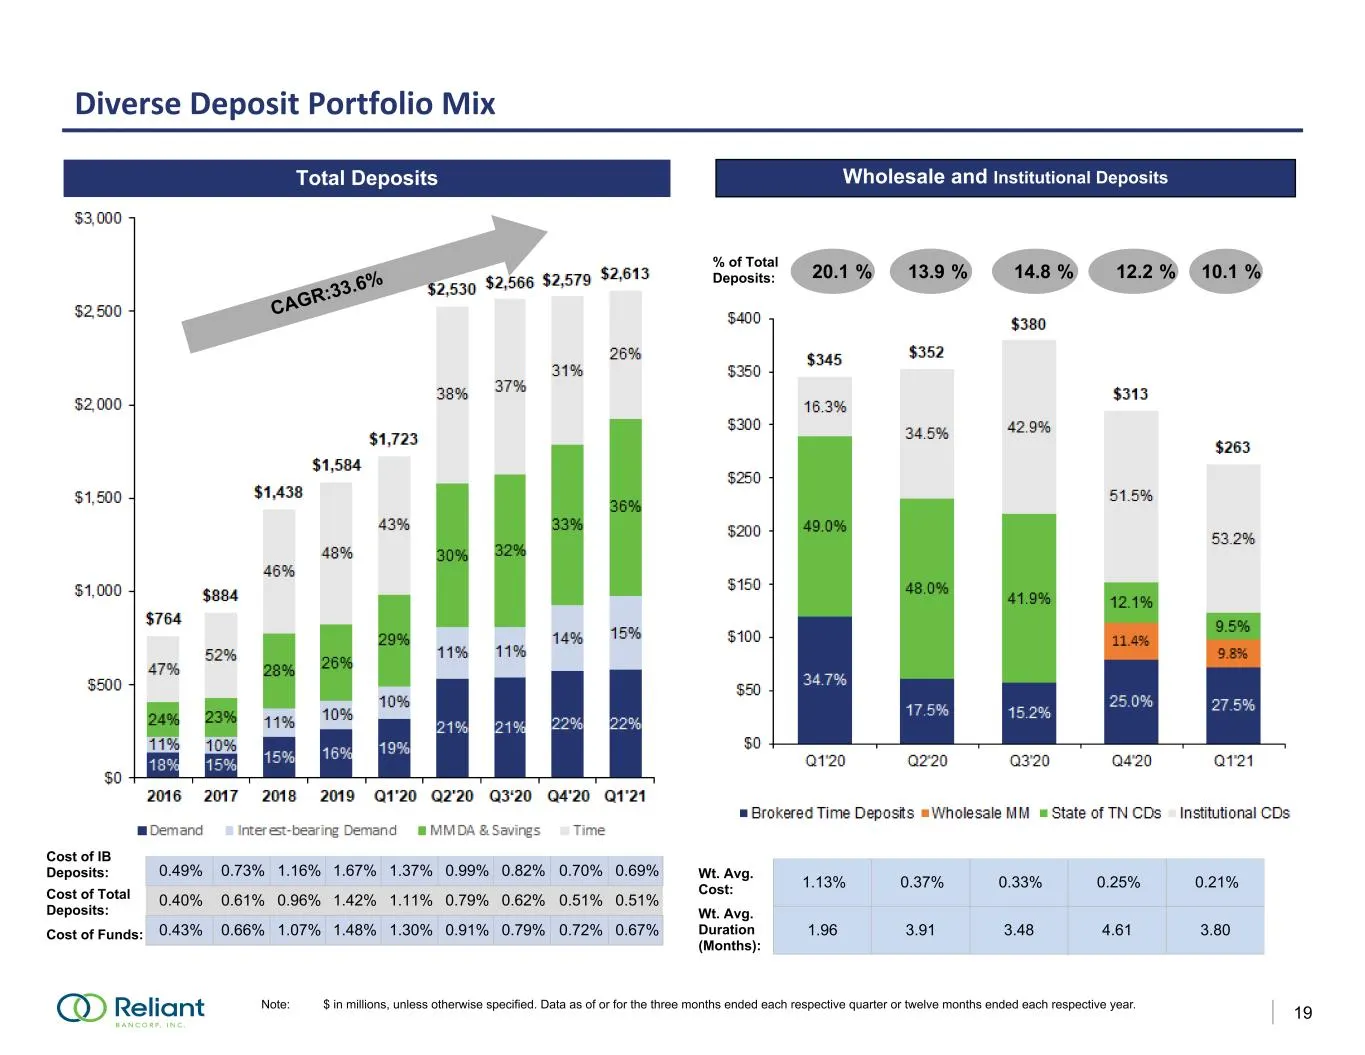
Slide 20: Diverse Deposit Portfolio Mix
R-36 G-53 B-111 R-105 G-189 B-69 R-174 G-174 B-174 R-125 G-170 B-234 R-26 G-94 B-193 R-204 G-214 B-234 R-142 G-180 B-226 R-217 G-149 B-147 19 Diverse Deposit Portfolio Mix Cost of IB Deposits: Cost of Funds: Note: $ in millions, unless otherwise specified. Data as of or for the three months ended ea
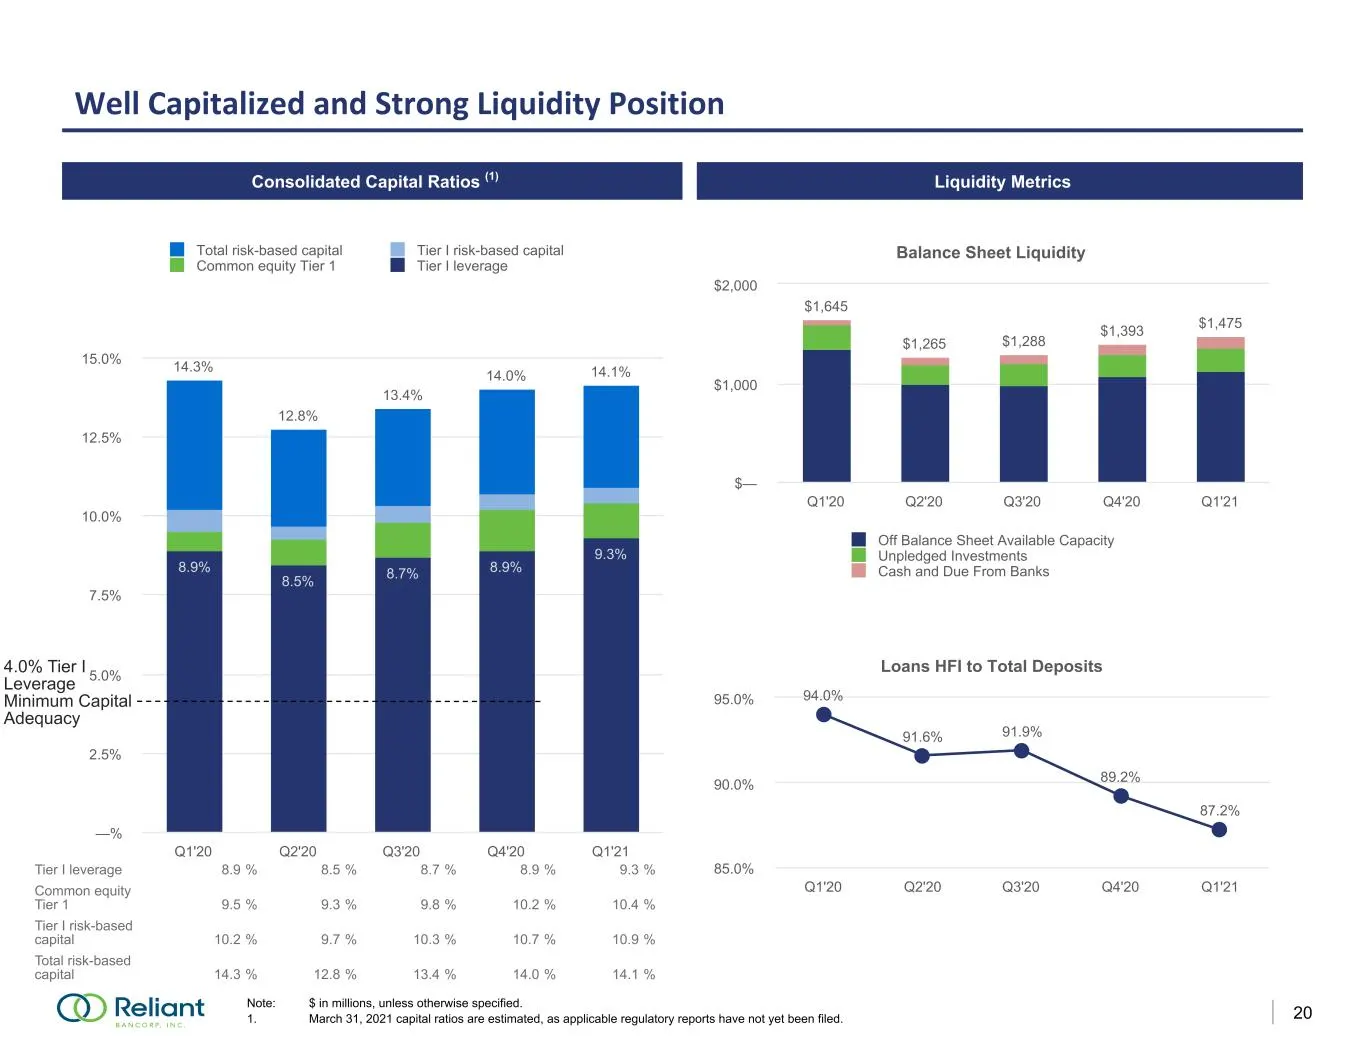
Slide 21: Well Capitalized and Strong Liquidity Position
R-36 G-53 B-111 R-105 G-189 B-69 R-174 G-174 B-174 R-125 G-170 B-234 R-26 G-94 B-193 R-204 G-214 B-234 R-142 G-180 B-226 R-217 G-149 B-147 20 Well Capitalized and Strong Liquidity Position Note: $ in millions, unless otherwise specified. 1. March 31, 2021 capital ratios are estimated, as applicable
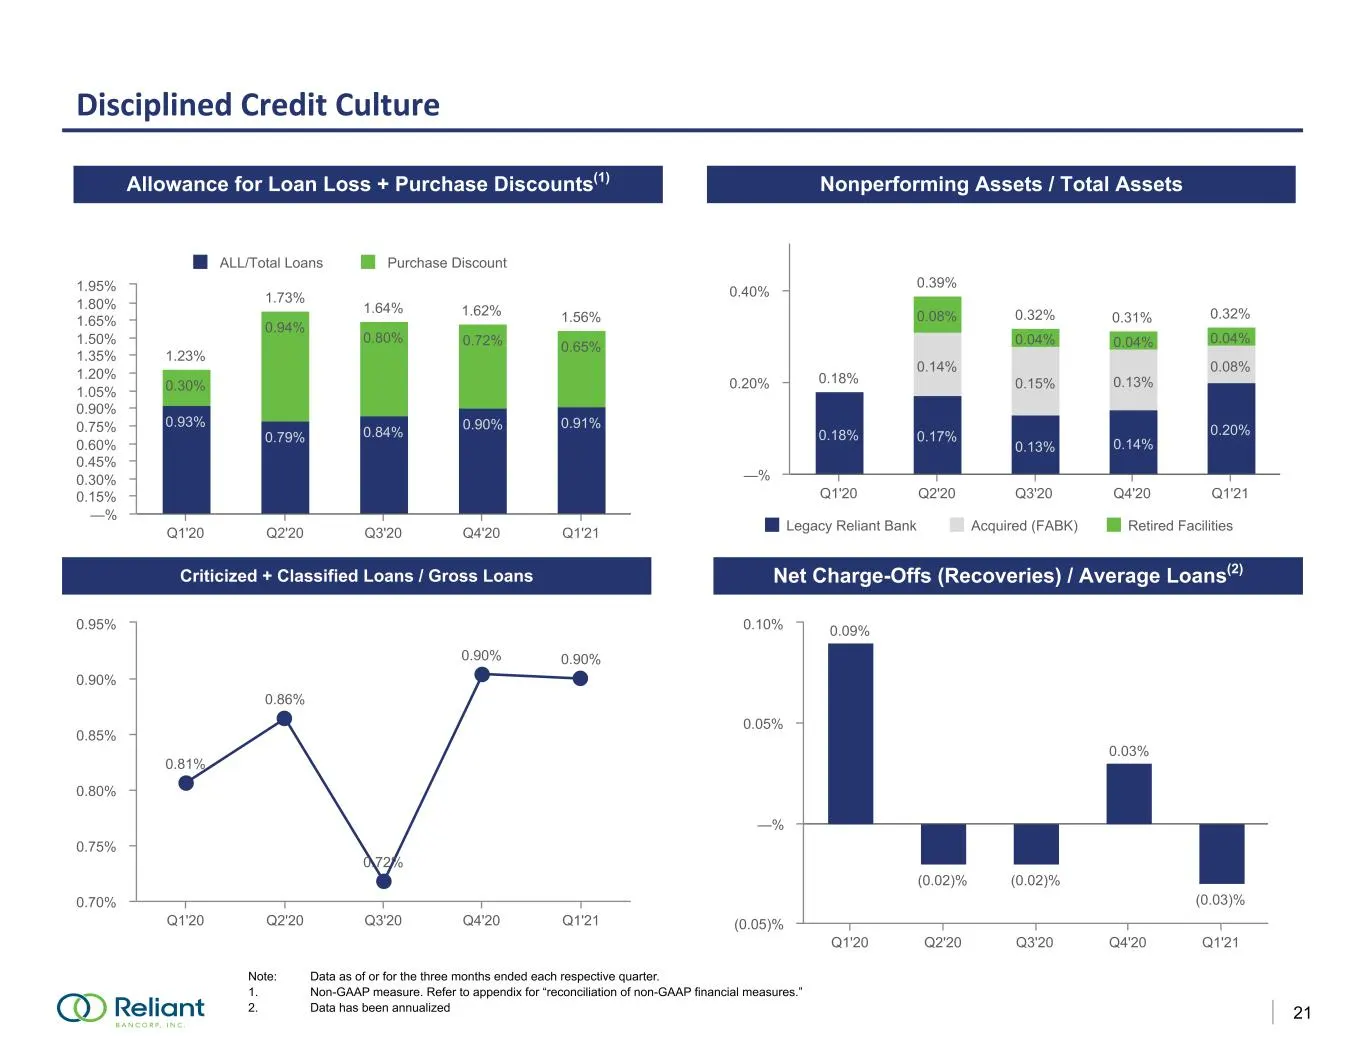
Slide 22: Disciplined Credit Culture
R-36 G-53 B-111 R-105 G-189 B-69 R-174 G-174 B-174 R-125 G-170 B-234 R-26 G-94 B-193 R-204 G-214 B-234 R-142 G-180 B-226 R-217 G-149 B-147 21 Disciplined Credit Culture Note: Data as of or for the three months ended each respective quarter. 1. Non-GAAP measure. Refer to appendix for “reconciliation
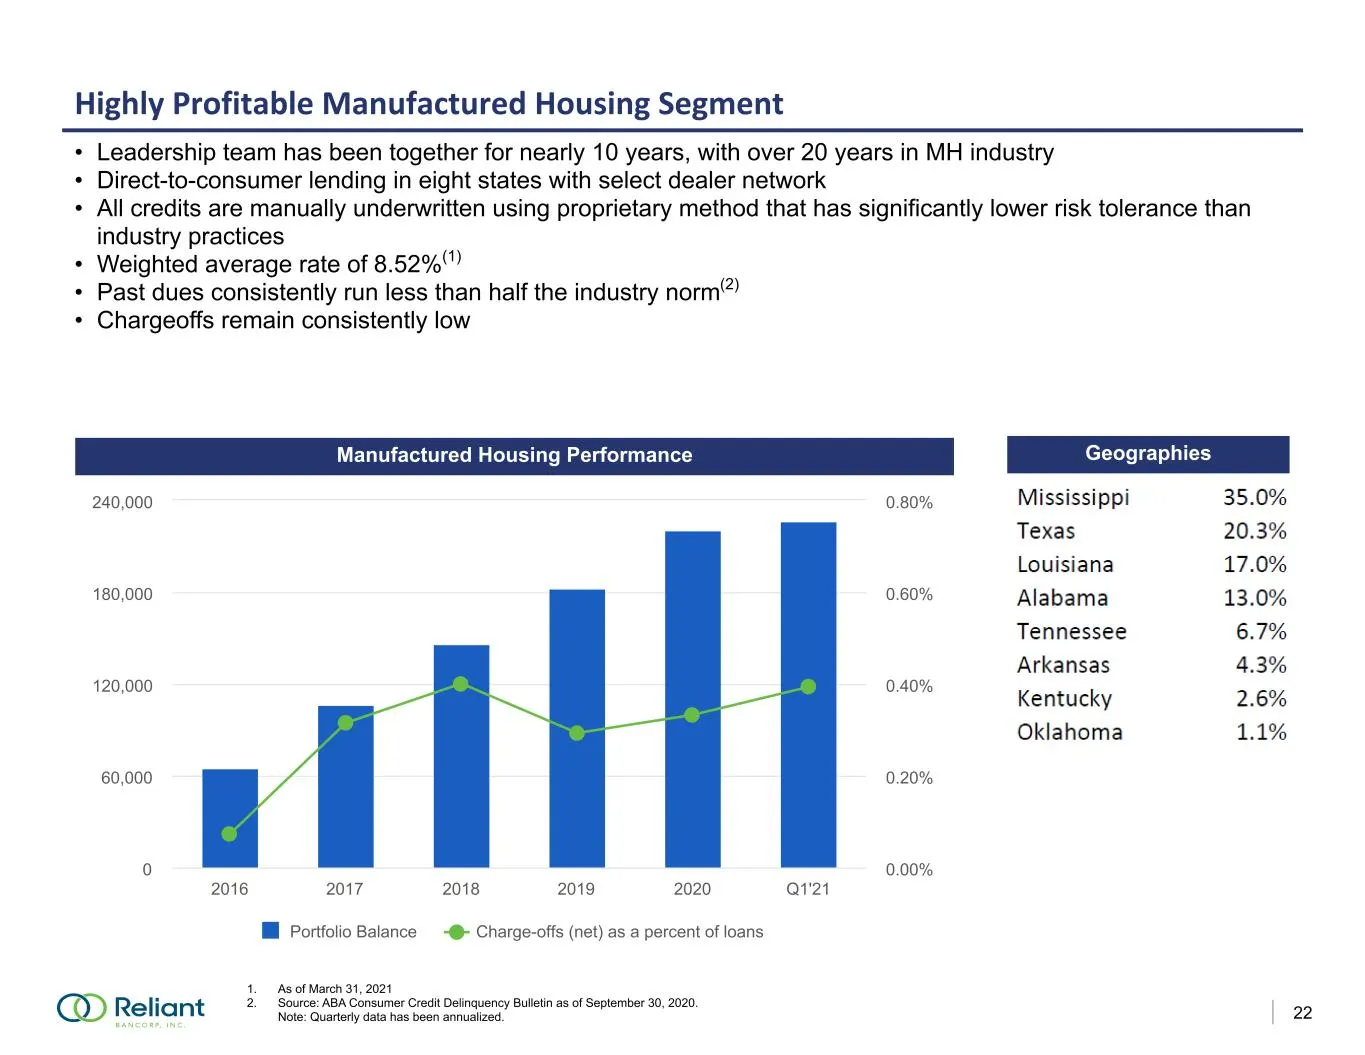
Slide 23: Highly Profitable Manufactured Housing Segment
R-36 G-53 B-111 R-105 G-189 B-69 R-174 G-174 B-174 R-125 G-170 B-234 R-26 G-94 B-193 R-204 G-214 B-234 R-142 G-180 B-226 R-217 G-149 B-147 22 Highly Profitable Manufactured Housing Segment • Leadership team has been together for nearly 10 years, with over 20 years in MH industry • Direct-to-consumer
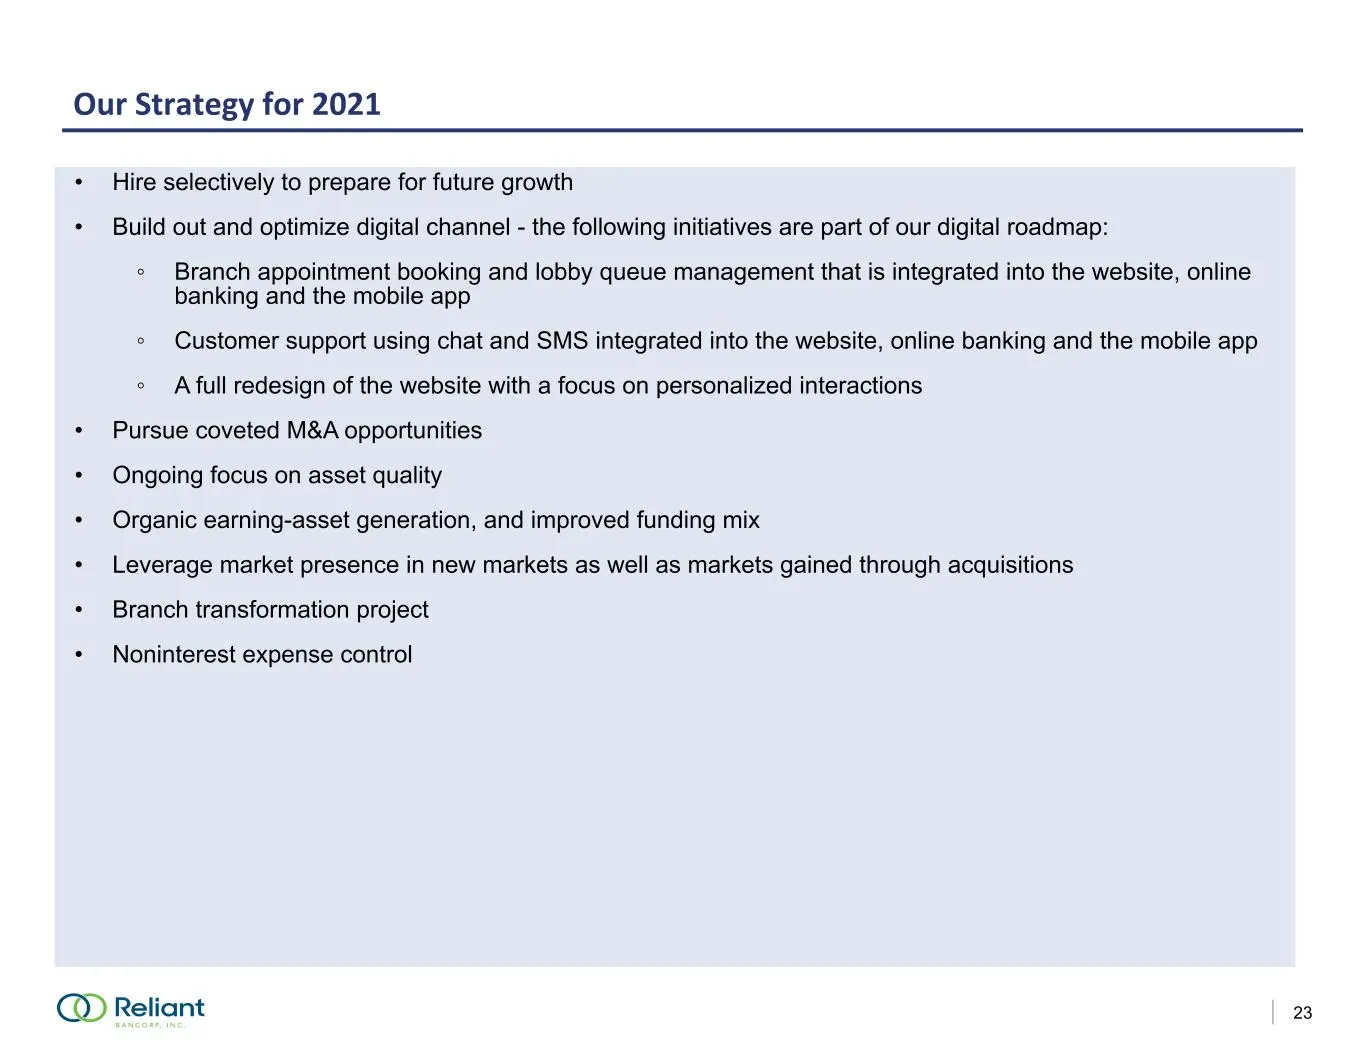
Slide 24: Our Strategy for '21
R-36 G-53 B-111 R-105 G-189 B-69 R-174 G-174 B-174 R-125 G-170 B-234 R-26 G-94 B-193 R-204 G-214 B-234 R-142 G-180 B-226 R-217 G-149 B-147 23 Our Strategy for 2021 • Hire selectively to prepare for future growth • Build out and optimize digital channel - the following initiatives are part of our dig
Slide 25: Appendix
R-36 G-53 B-111 R-105 G-189 B-69 R-174 G-174 B-174 R-125 G-170 B-234 R-26 G-94 B-193 R-204 G-214 B-234 R-142 G-180 B-226 R-217 G-149 B-147 Appendix
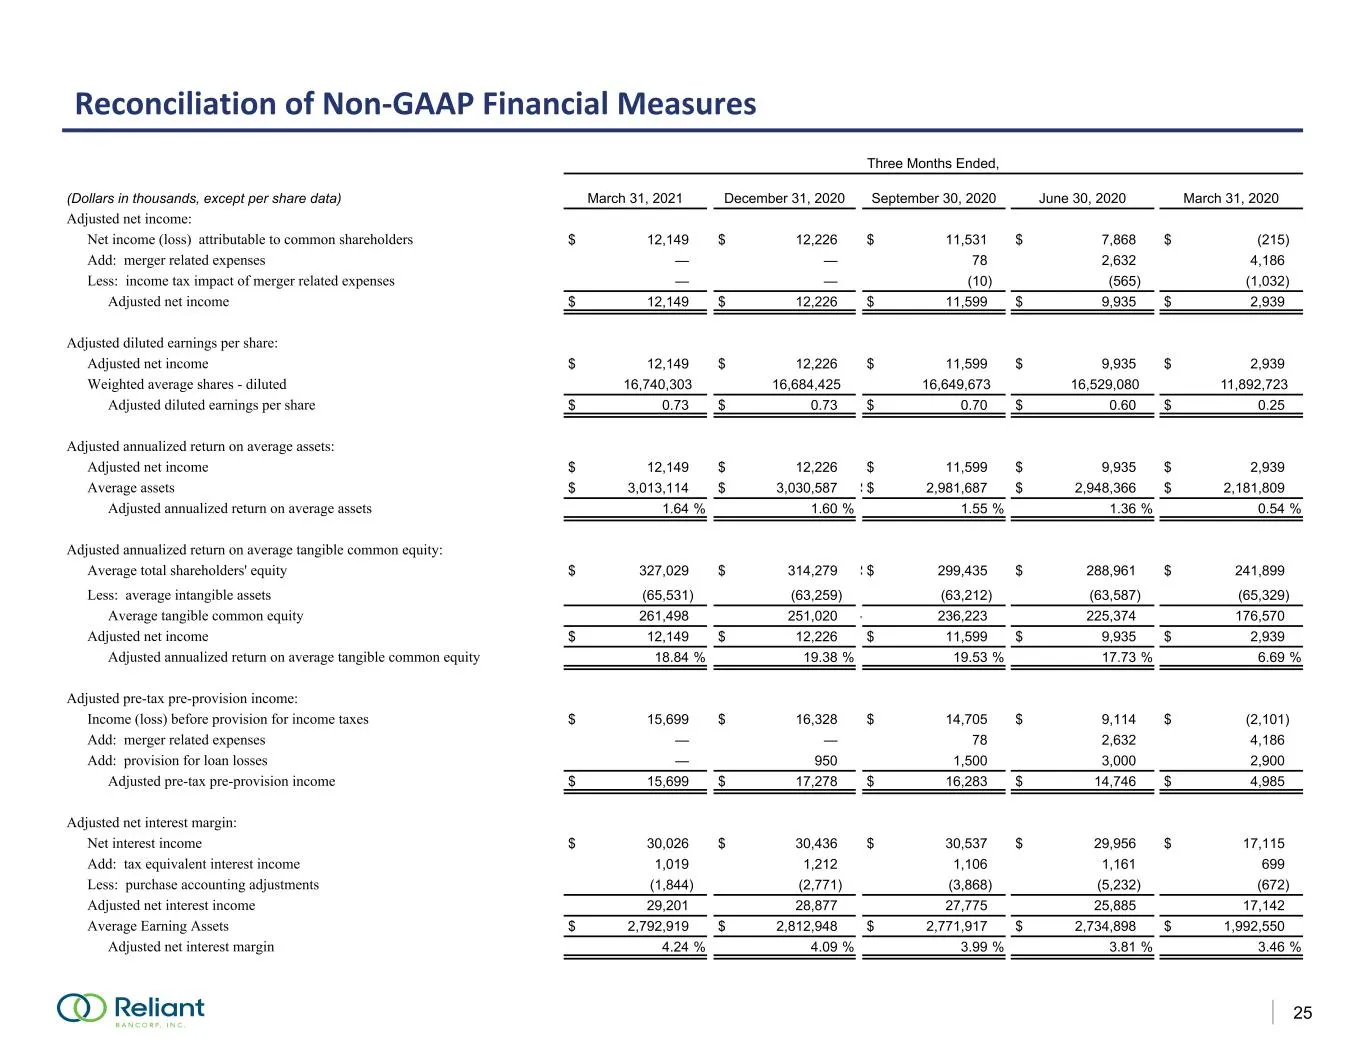
Slide 26: Reconciliation of Non-GAAP Financial Measures
R-36 G-53 B-111 R-105 G-189 B-69 R-174 G-174 B-174 R-125 G-170 B-234 R-26 G-94 B-193 R-204 G-214 B-234 R-142 G-180 B-226 R-217 G-149 B-147 25 Reconciliation of Non-GAAP Financial Measures Three Months Ended, (Dollars in thousands, except per share data) March 31, 2021 December 31, 2020 September 30,
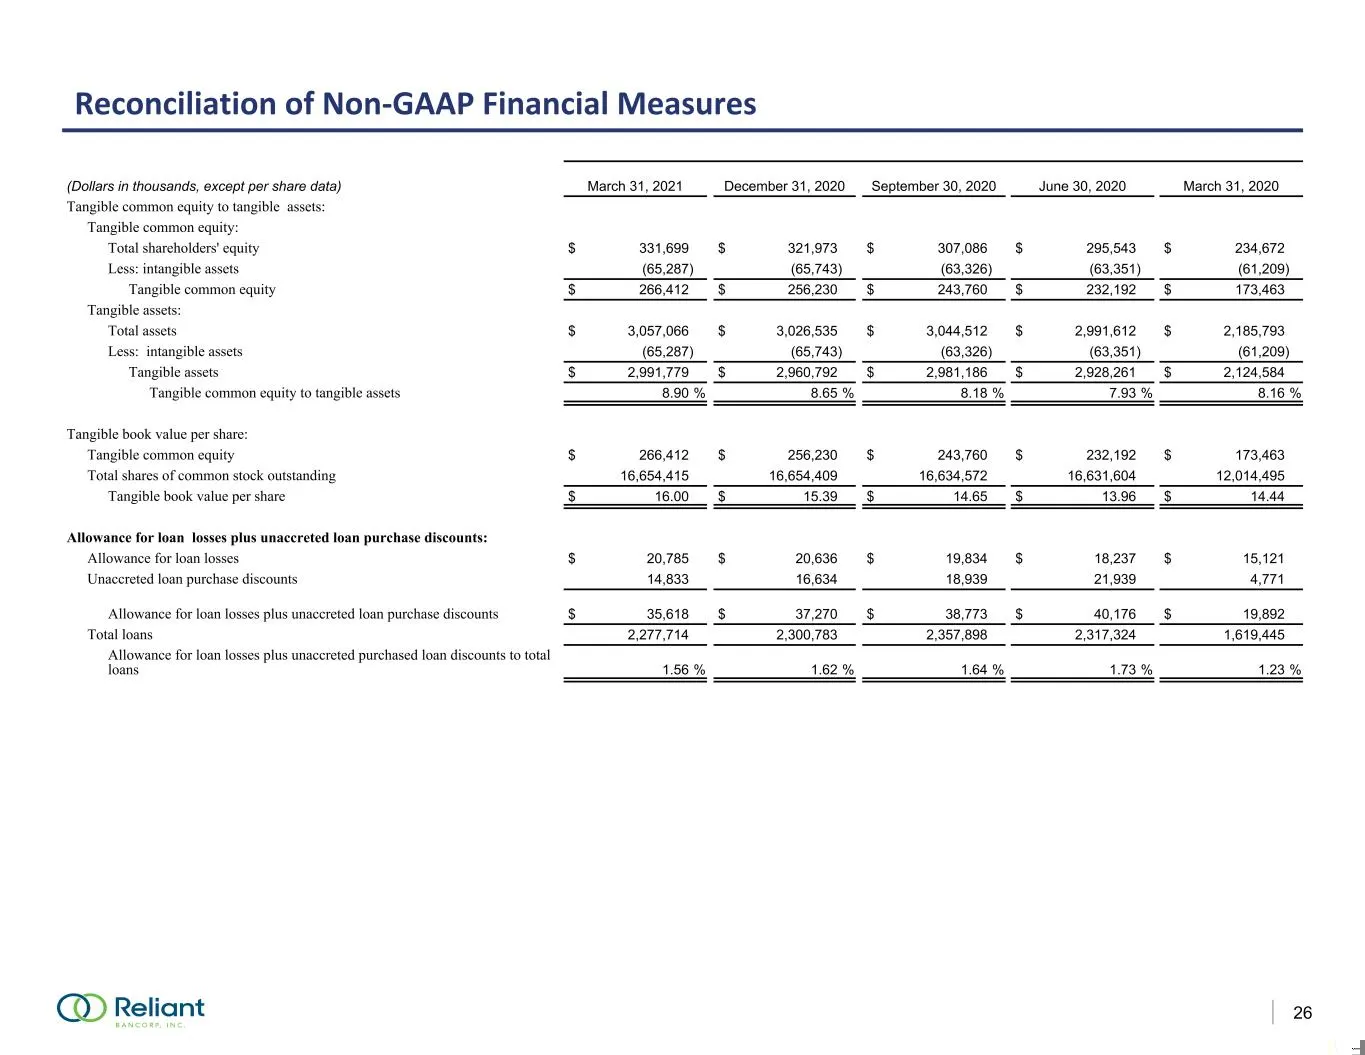
Slide 27: Reconciliation of Non-GAAP Financial Measures
R-36 G-53 B-111 R-105 G-189 B-69 R-174 G-174 B-174 R-125 G-170 B-234 R-26 G-94 B-193 R-204 G-214 B-234 R-142 G-180 B-226 R-217 G-149 B-147 26 Reconciliation of Non-GAAP Financial Measures (Dollars in thousands, except per share data) March 31, 2021 December 31, 2020 September 30, 2020 June 30, 2020
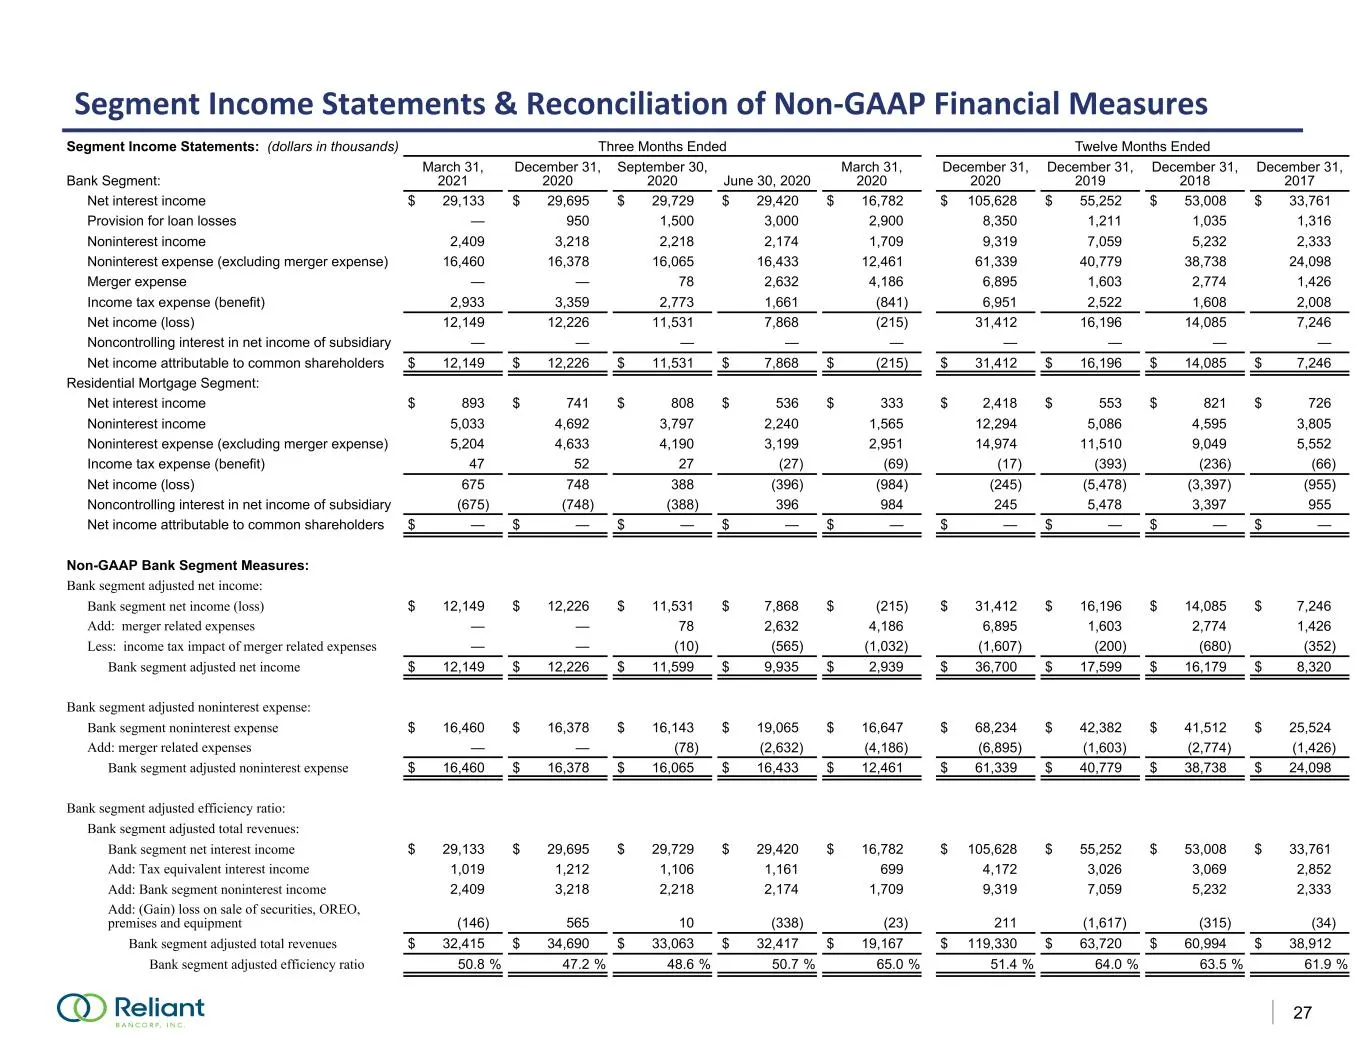
Slide 28: Segment Income Statements & Reconciliation of Non-GAAP Financial Measures
R-36 G-53 B-111 R-105 G-189 B-69 R-174 G-174 B-174 R-125 G-170 B-234 R-26 G-94 B-193 R-204 G-214 B-234 R-142 G-180 B-226 R-217 G-149 B-147 27 Segment Income Statements & Reconciliation of Non-GAAP Financial Measures Segment Income Statements: (dollars in thousands) Three Months Ended Twelve Months E
Source: SEC EDGAR · 8-K filed Apr 30, 2021
More decks from Reliant Bancorp Inc
 Q3 2021 Earnings Presentation29 slides · Oct 21, 2021
 Q2 2021 Earnings Presentation28 slides · Jul 21, 2021
 Merger or Acquisition (July 2021)13 slides · Jul 15, 2021
 Q1 2021 Earnings Presentation18 slides · Apr 22, 2021
 Raymond James Virtual Investor Meetings 202130 slides · Mar 10, 2021
 Janney CEO Virtual Forum 202129 slides · Feb 2, 2021