Strategic Hotels and Resorts Inc
Strategic Hotels and Resorts — Investor Presentation (May 2012)
33 slides from Strategic Hotels and Resorts's investor presentation, May 14, 2012
Slide 1: Investor Presentation May 2012
Investor Presentation May 2012
Slide 2: I.BEE’s II.Company III.Industry
I.BEE’s II.Company III.Industry IV.Operating V.Financial 1B EE’s Unique Unique Overview Update Overview Trends Value ValueProposition Proposition
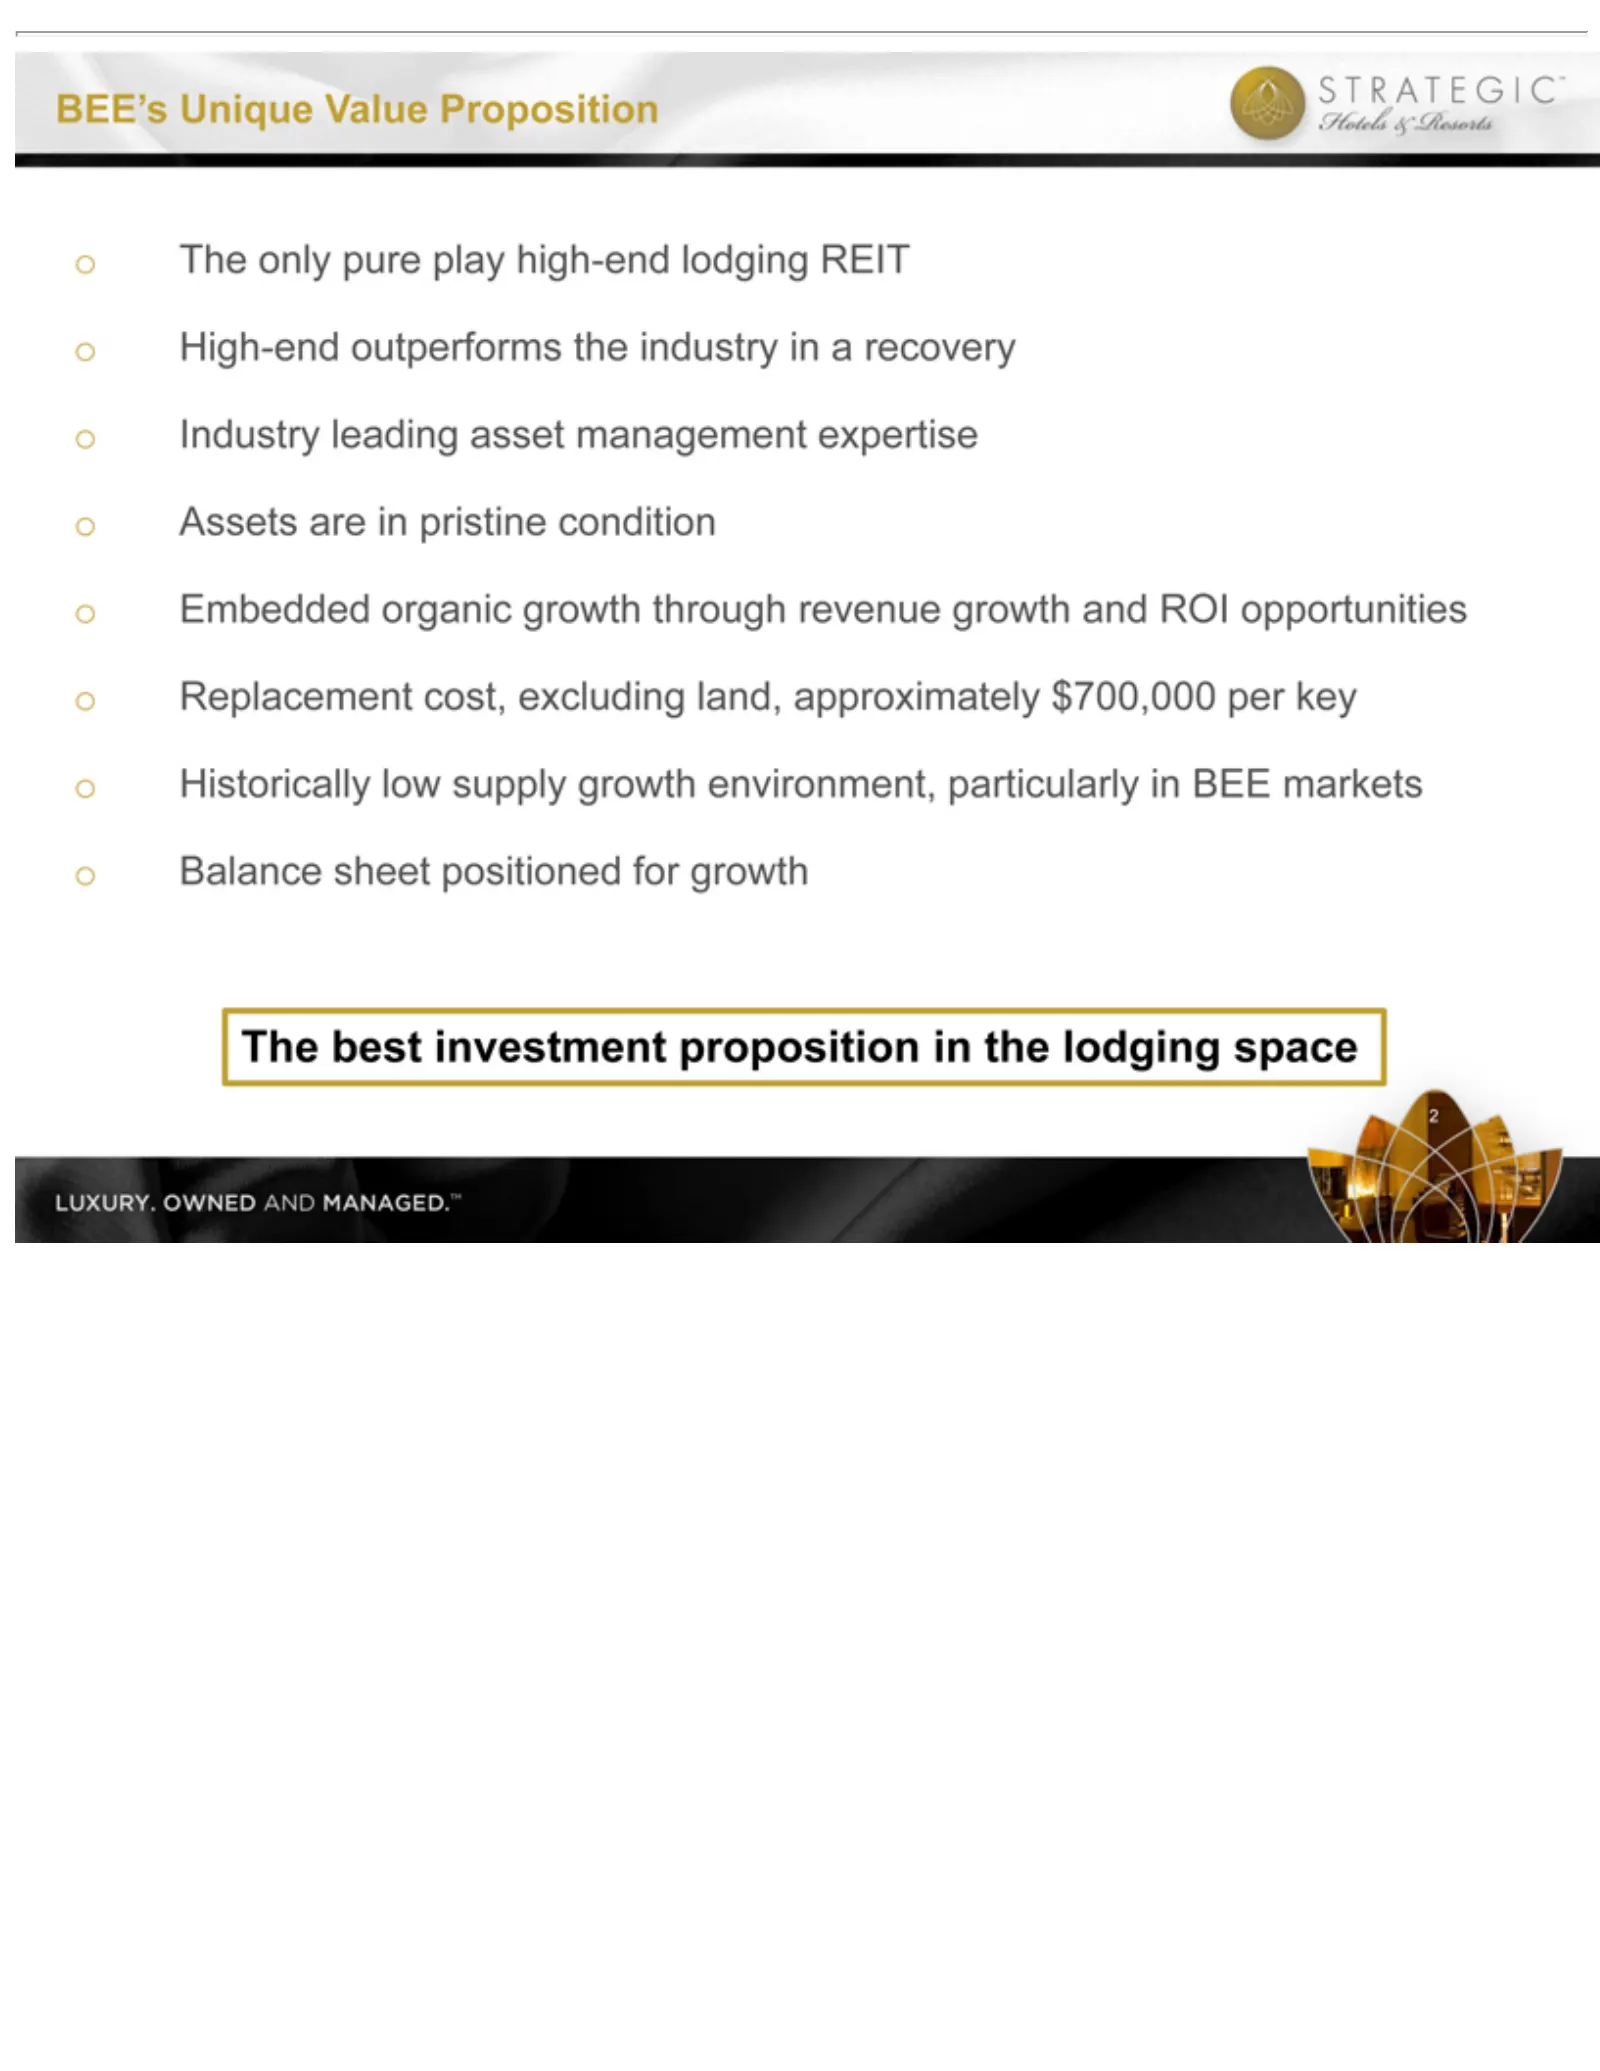
Slide 3: Unique Value Proposition
BEE’s oThe oHigh-end oIndustry oAssets oEmbedded oReplacement oHistorically oBalance 2The best only Unique are investment sheet leading pure outperforms in organic low pristine cost, Value positioned play supply asset excluding growth proposition high-end Proposition condition management the growth
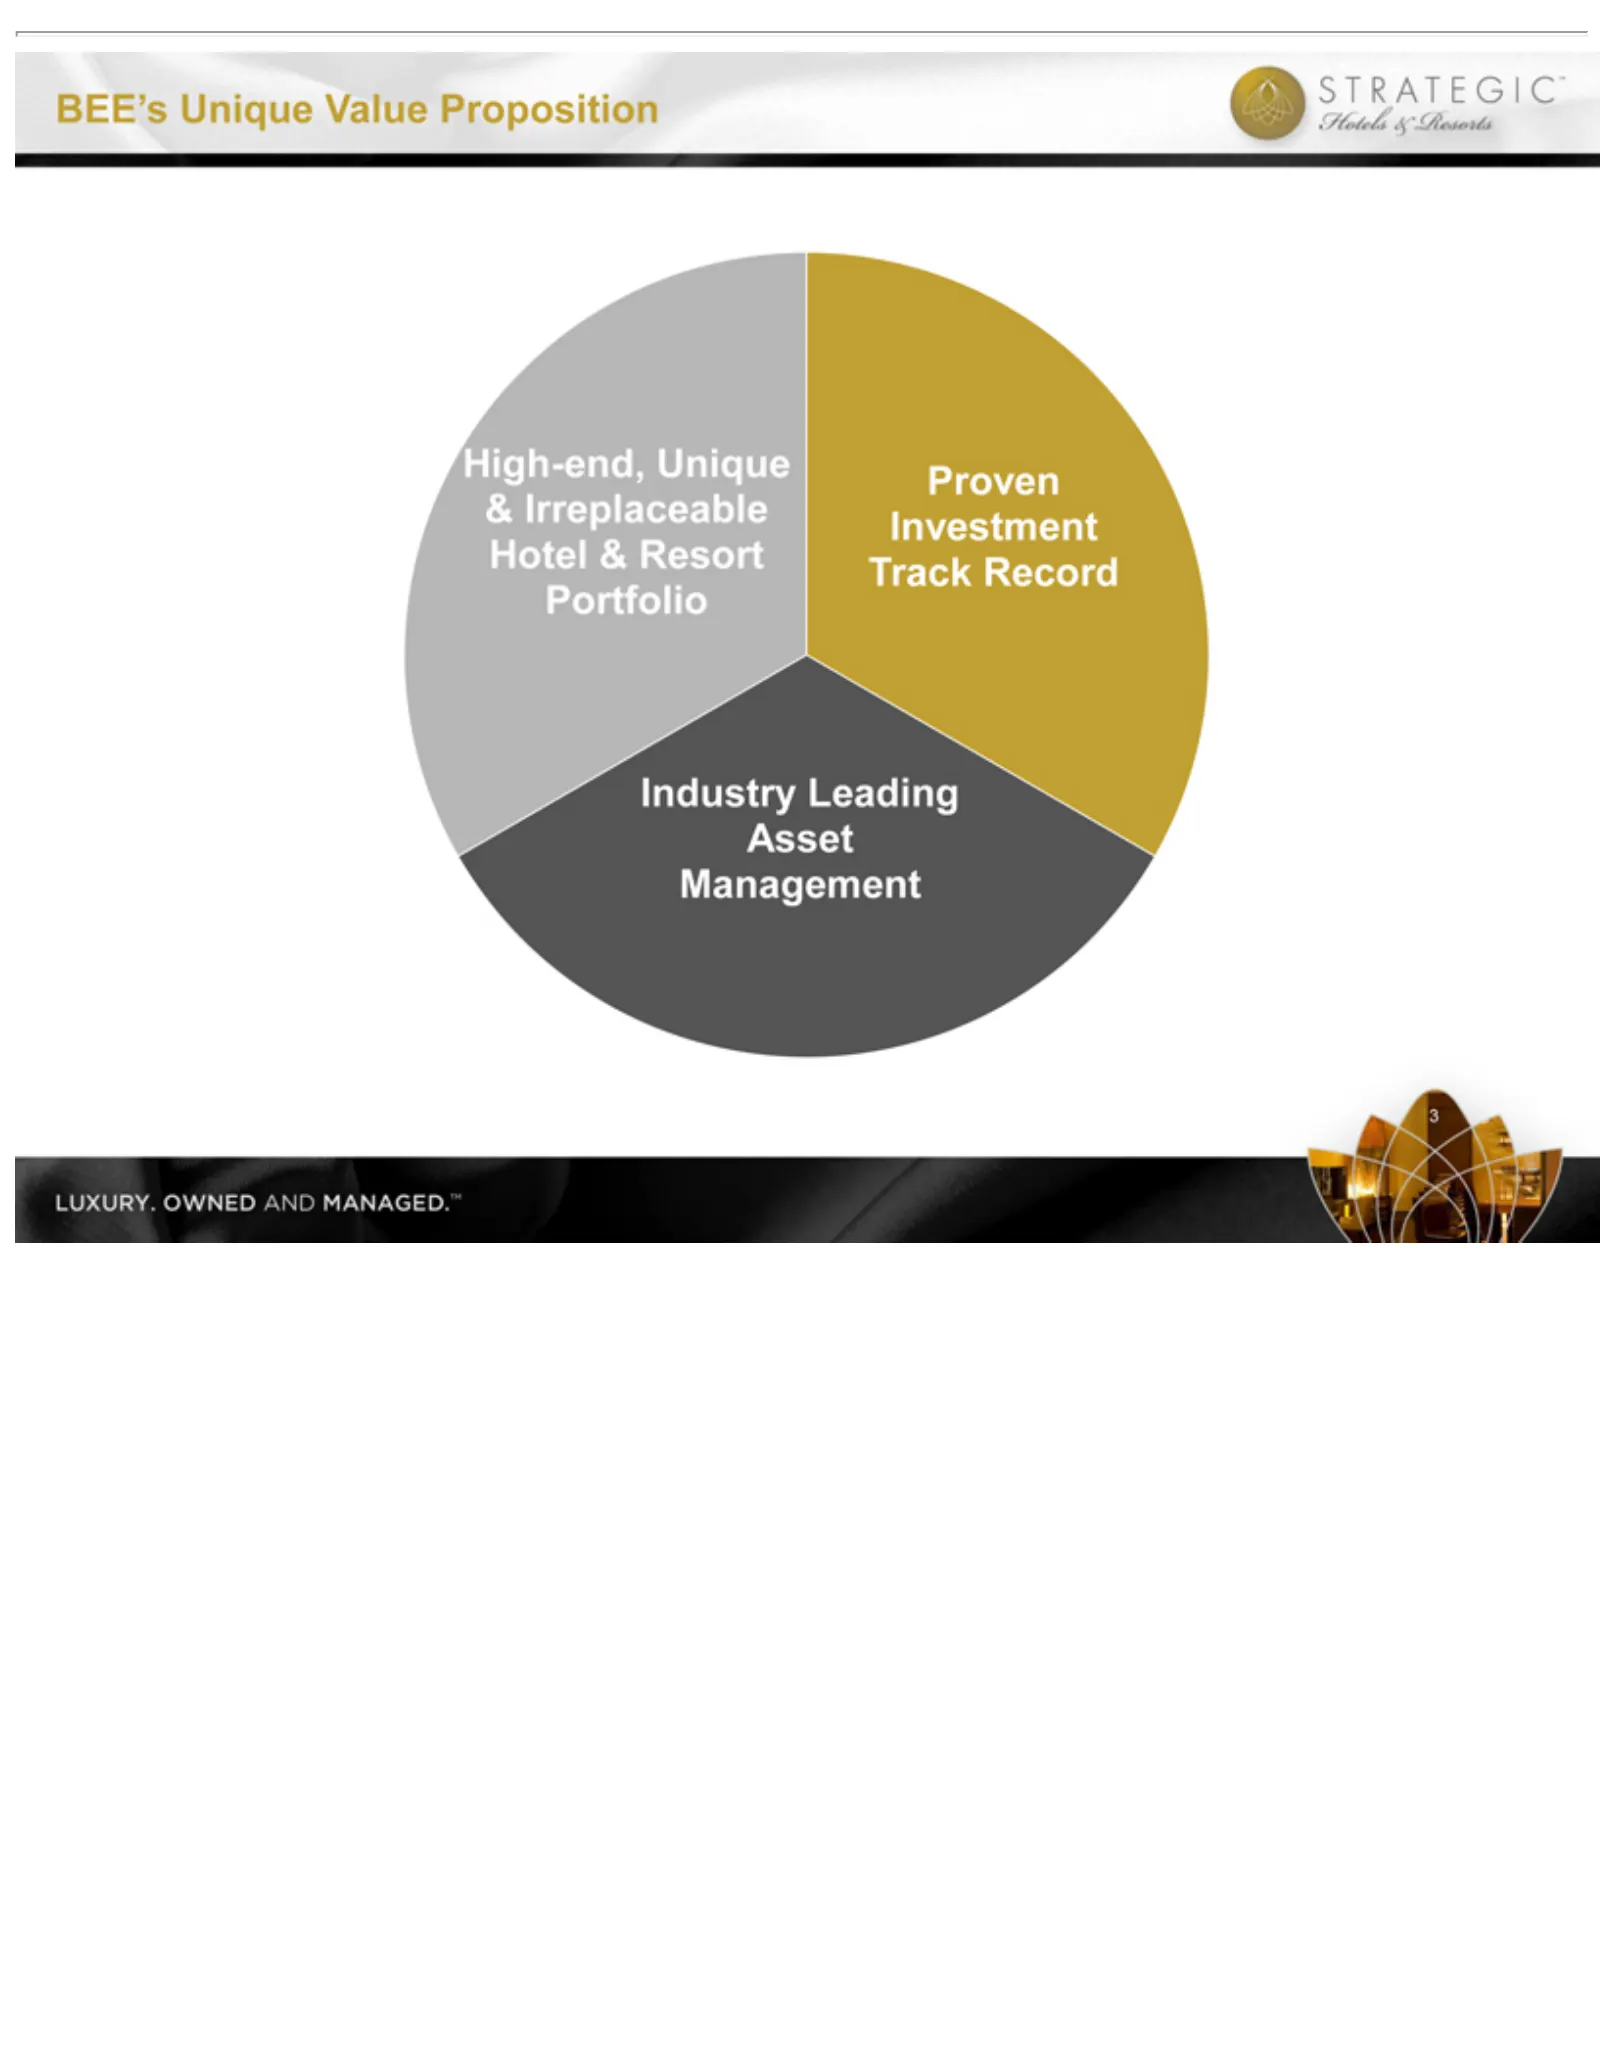
Slide 4: Unique Value Proposition
3BEE’s Unique Proven Industry High-end, Investment Leading Unique Value Asset &Track Irreplaceable Proposition Management Record Hotel & Resort Portfolio
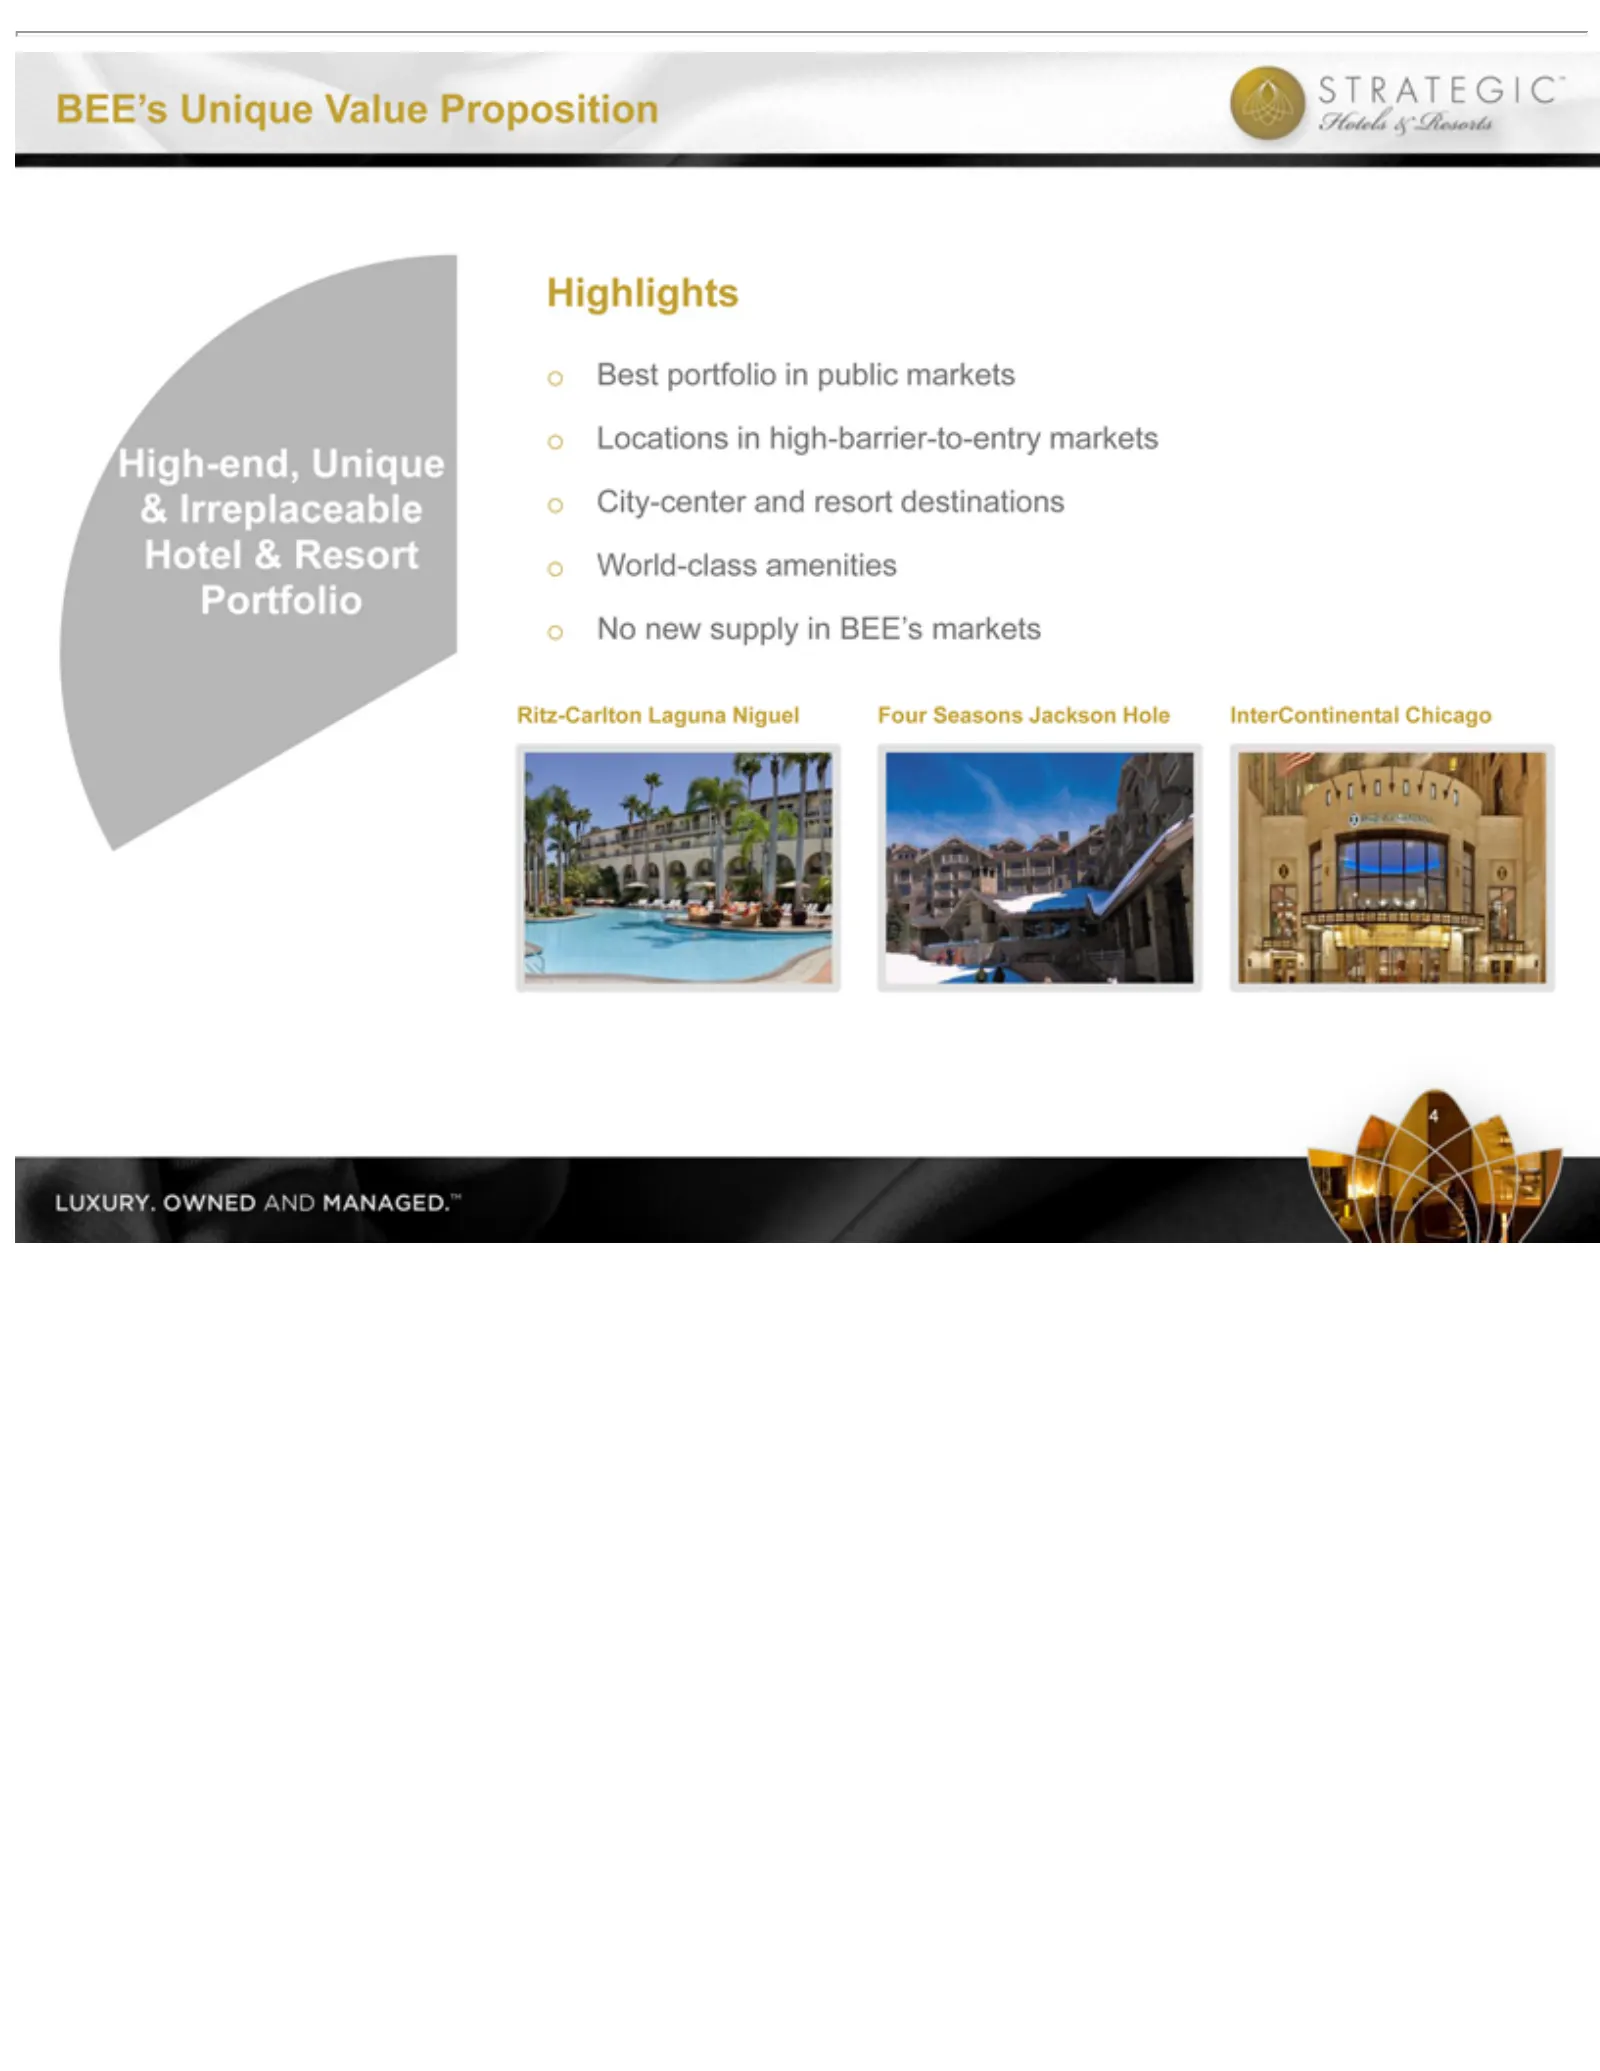
Slide 5: High-end, Unique & Irreplaceable Hotel & Resort Portfolio Highlights
oBest Highlights oLocations oCity-center oWorld-class oNo Four InterContinental 4B EE’s new Seasons portfolio Unique supply inand amenities Jackson high-barrier-to-entry Value inChicago in resort public BEE’s Proposition Hole destinations markets markets Ritz-Carlton Proven markets Investment Laguna
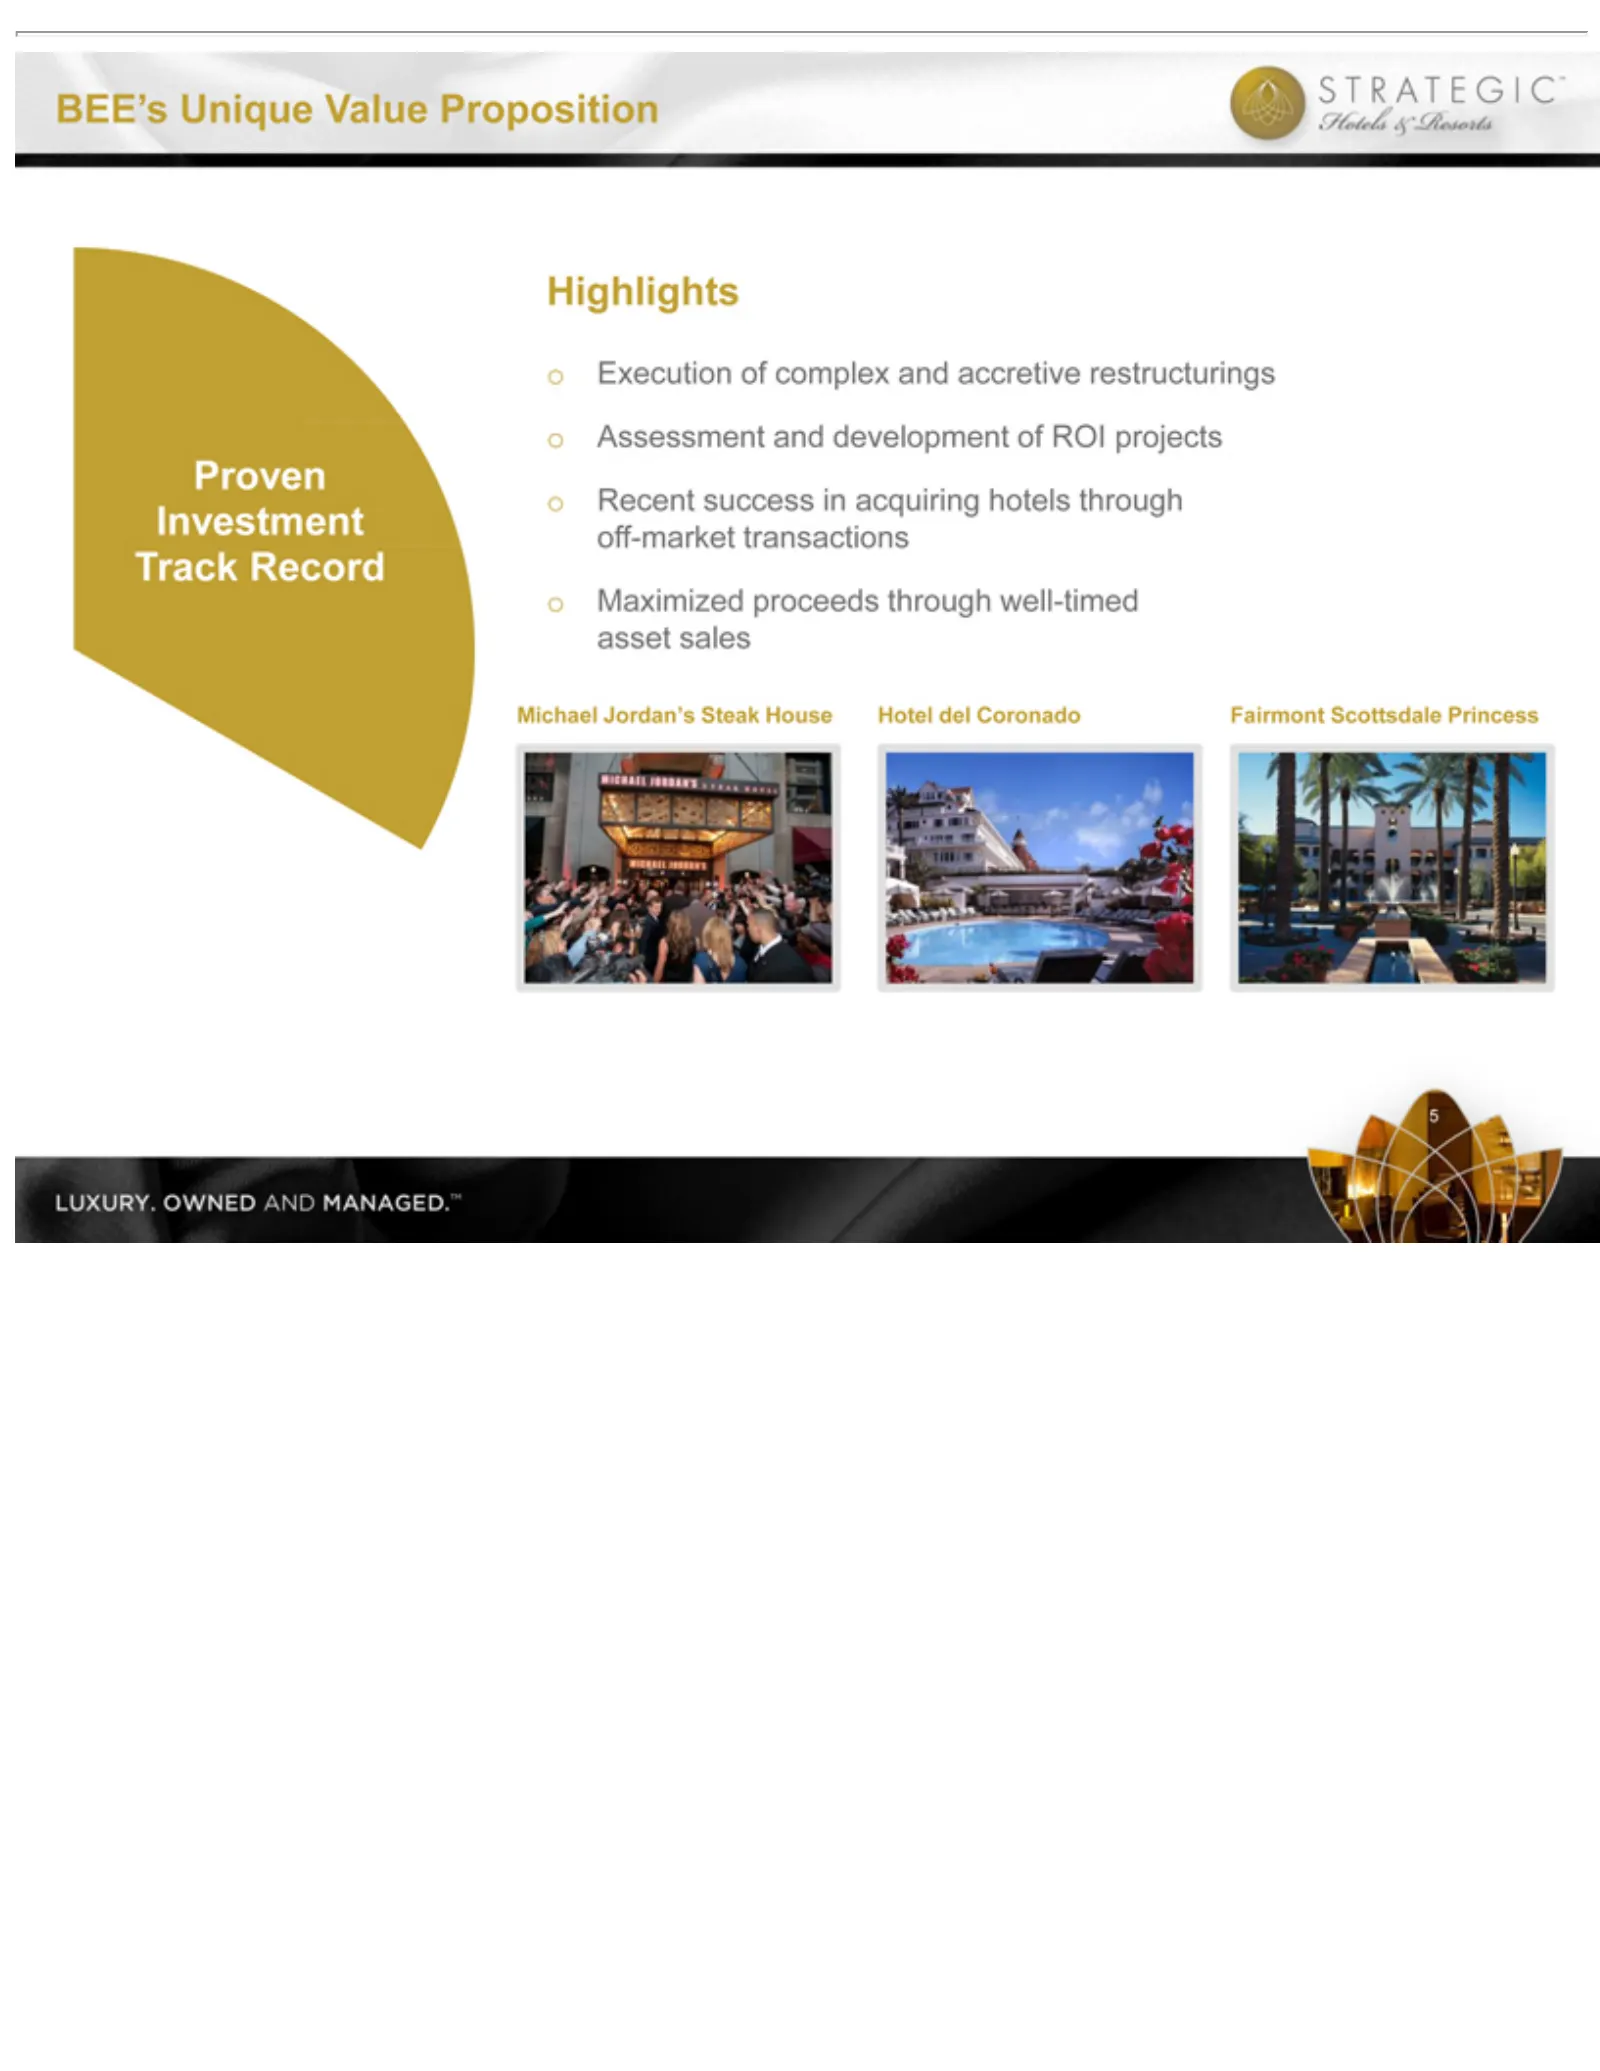
Slide 6: Proven Investment Track Record Highlights
BEE’sdel Proven oExecution Highlights oAssessment oRecent oMaximized 5Hotel Unique Investment success Coronado ofproceeds and complex Value indevelopment Track acquiring Michael Proposition through and Record accretive Jordan’s hotels well-timed ofIndustry ROI through restructurings Steak projects a
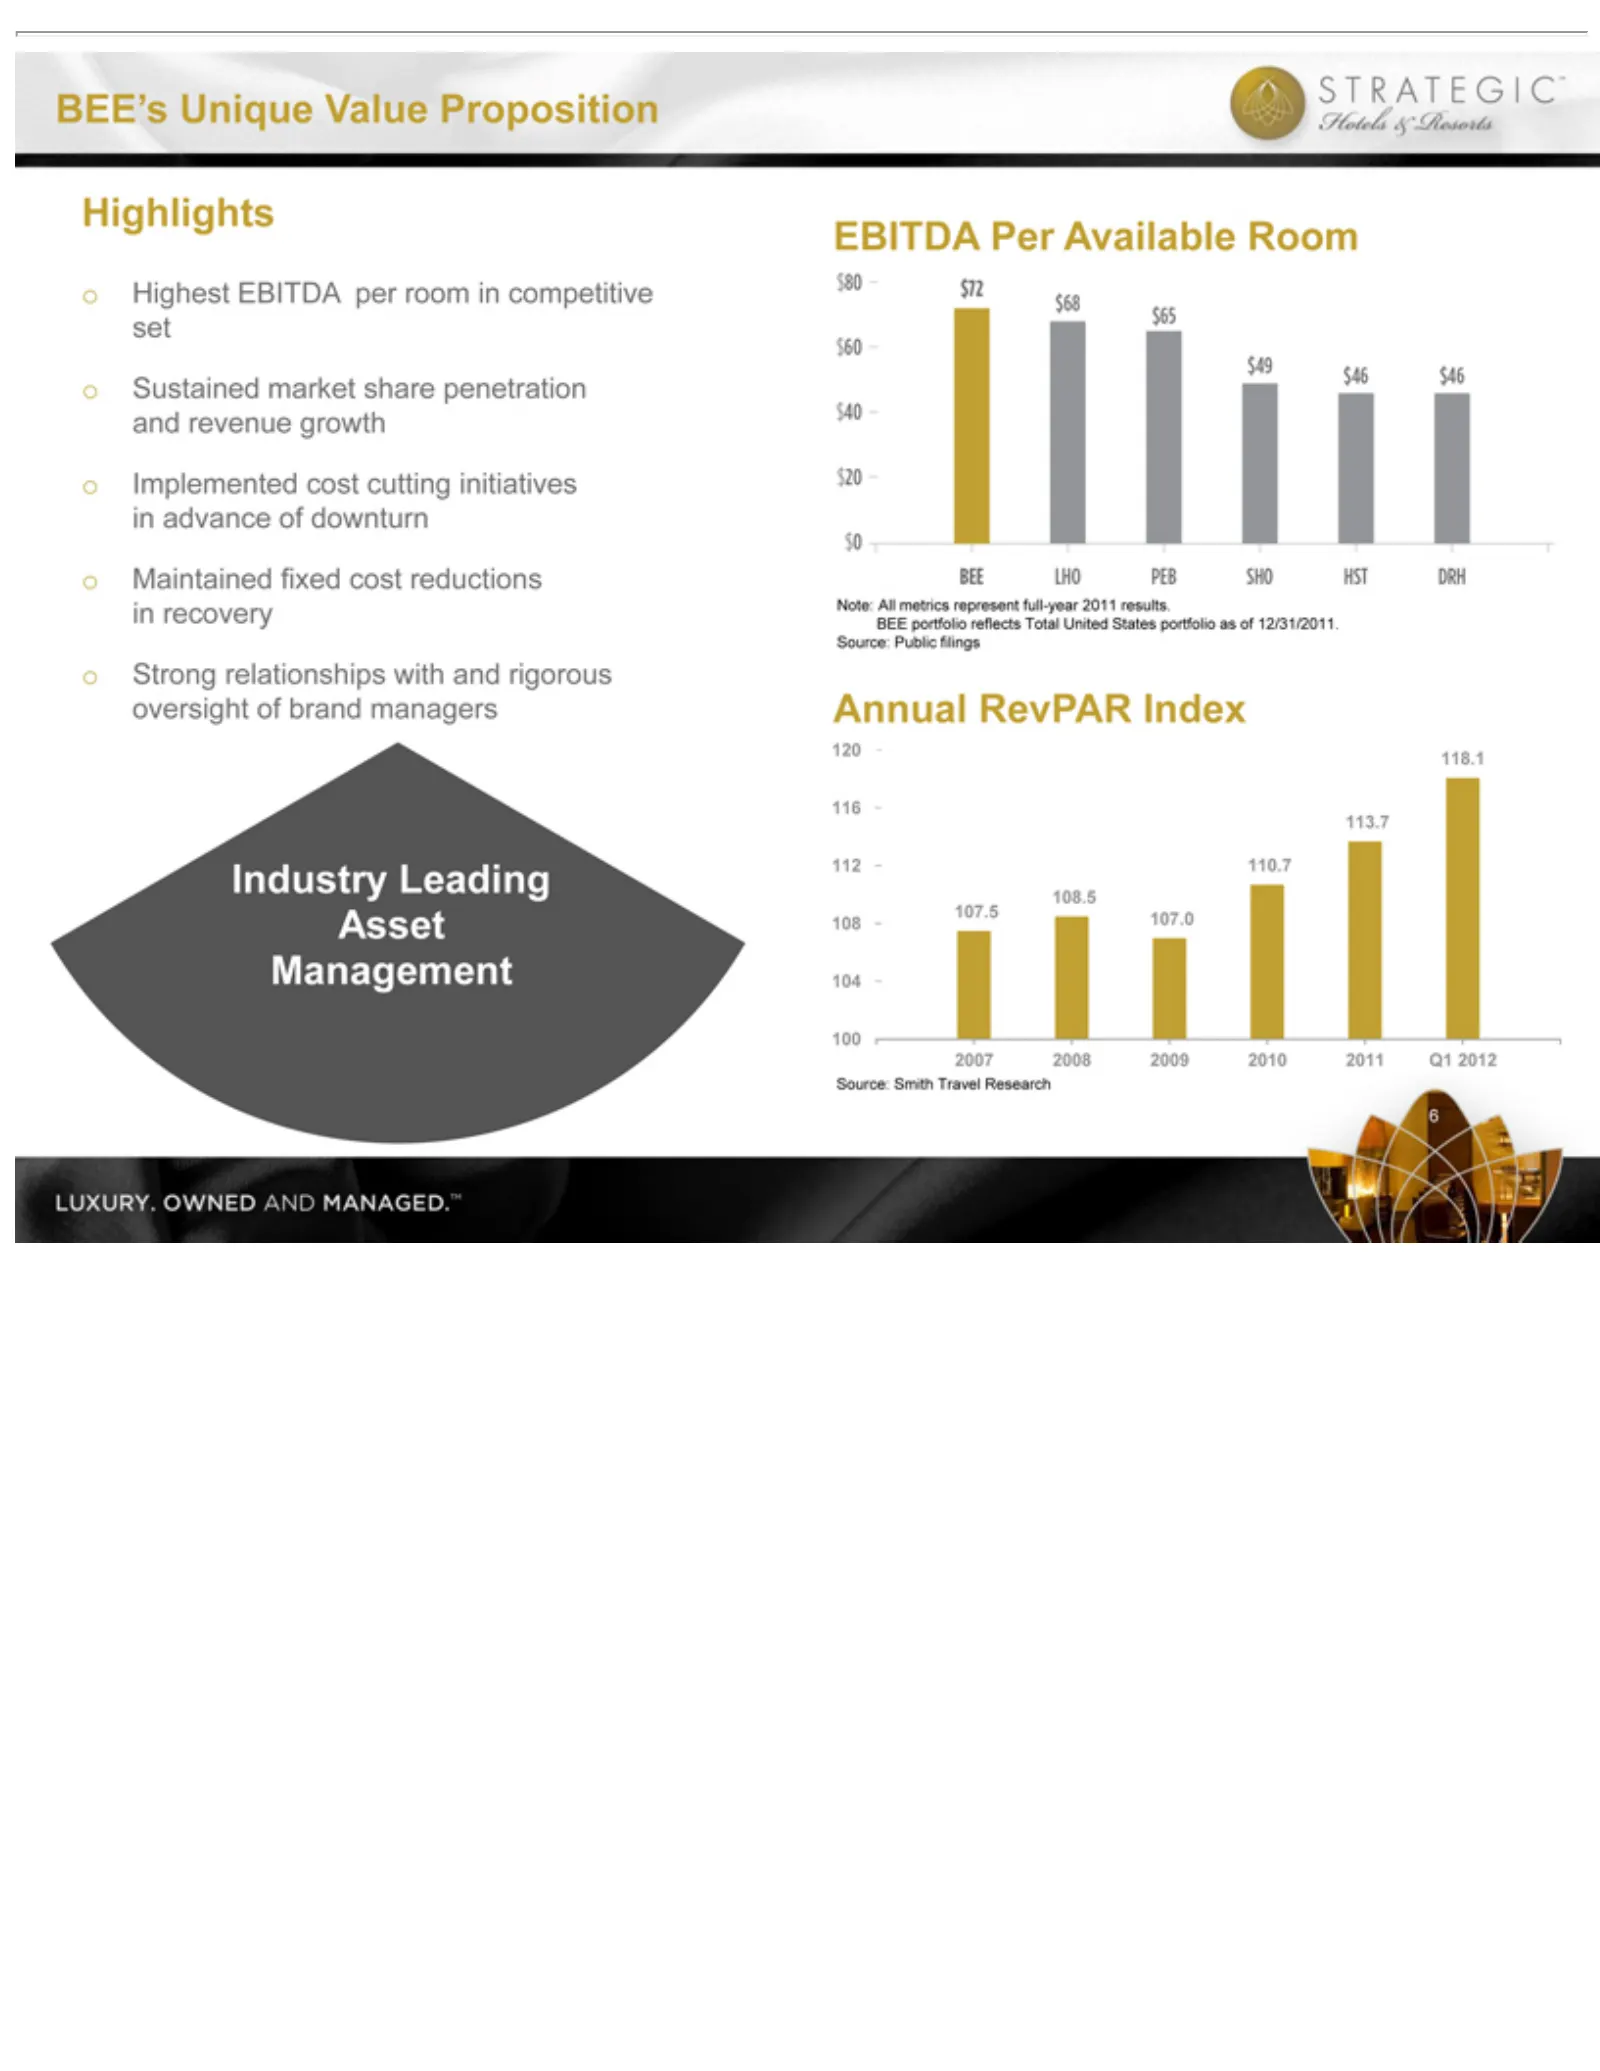
Slide 7: Leading Asset Management Highlights
Proven oHighest oSustained oImplemented oMaintained oStrong EBITDA Annual 6B Note: BEE Source: EE’sportfolio All Unique Investment RevPAR Public Smith relationships Per EBITDA metrics market fixed Available reflects Travel Value cost filings Index represent cost share per Track cutting Proposition R
Slide 8: Company Overview
I.BEE’s Unique II.Company III.Industry IV.Operating V.Financial Company Overview Overview Update Overview Trends Value Proposition
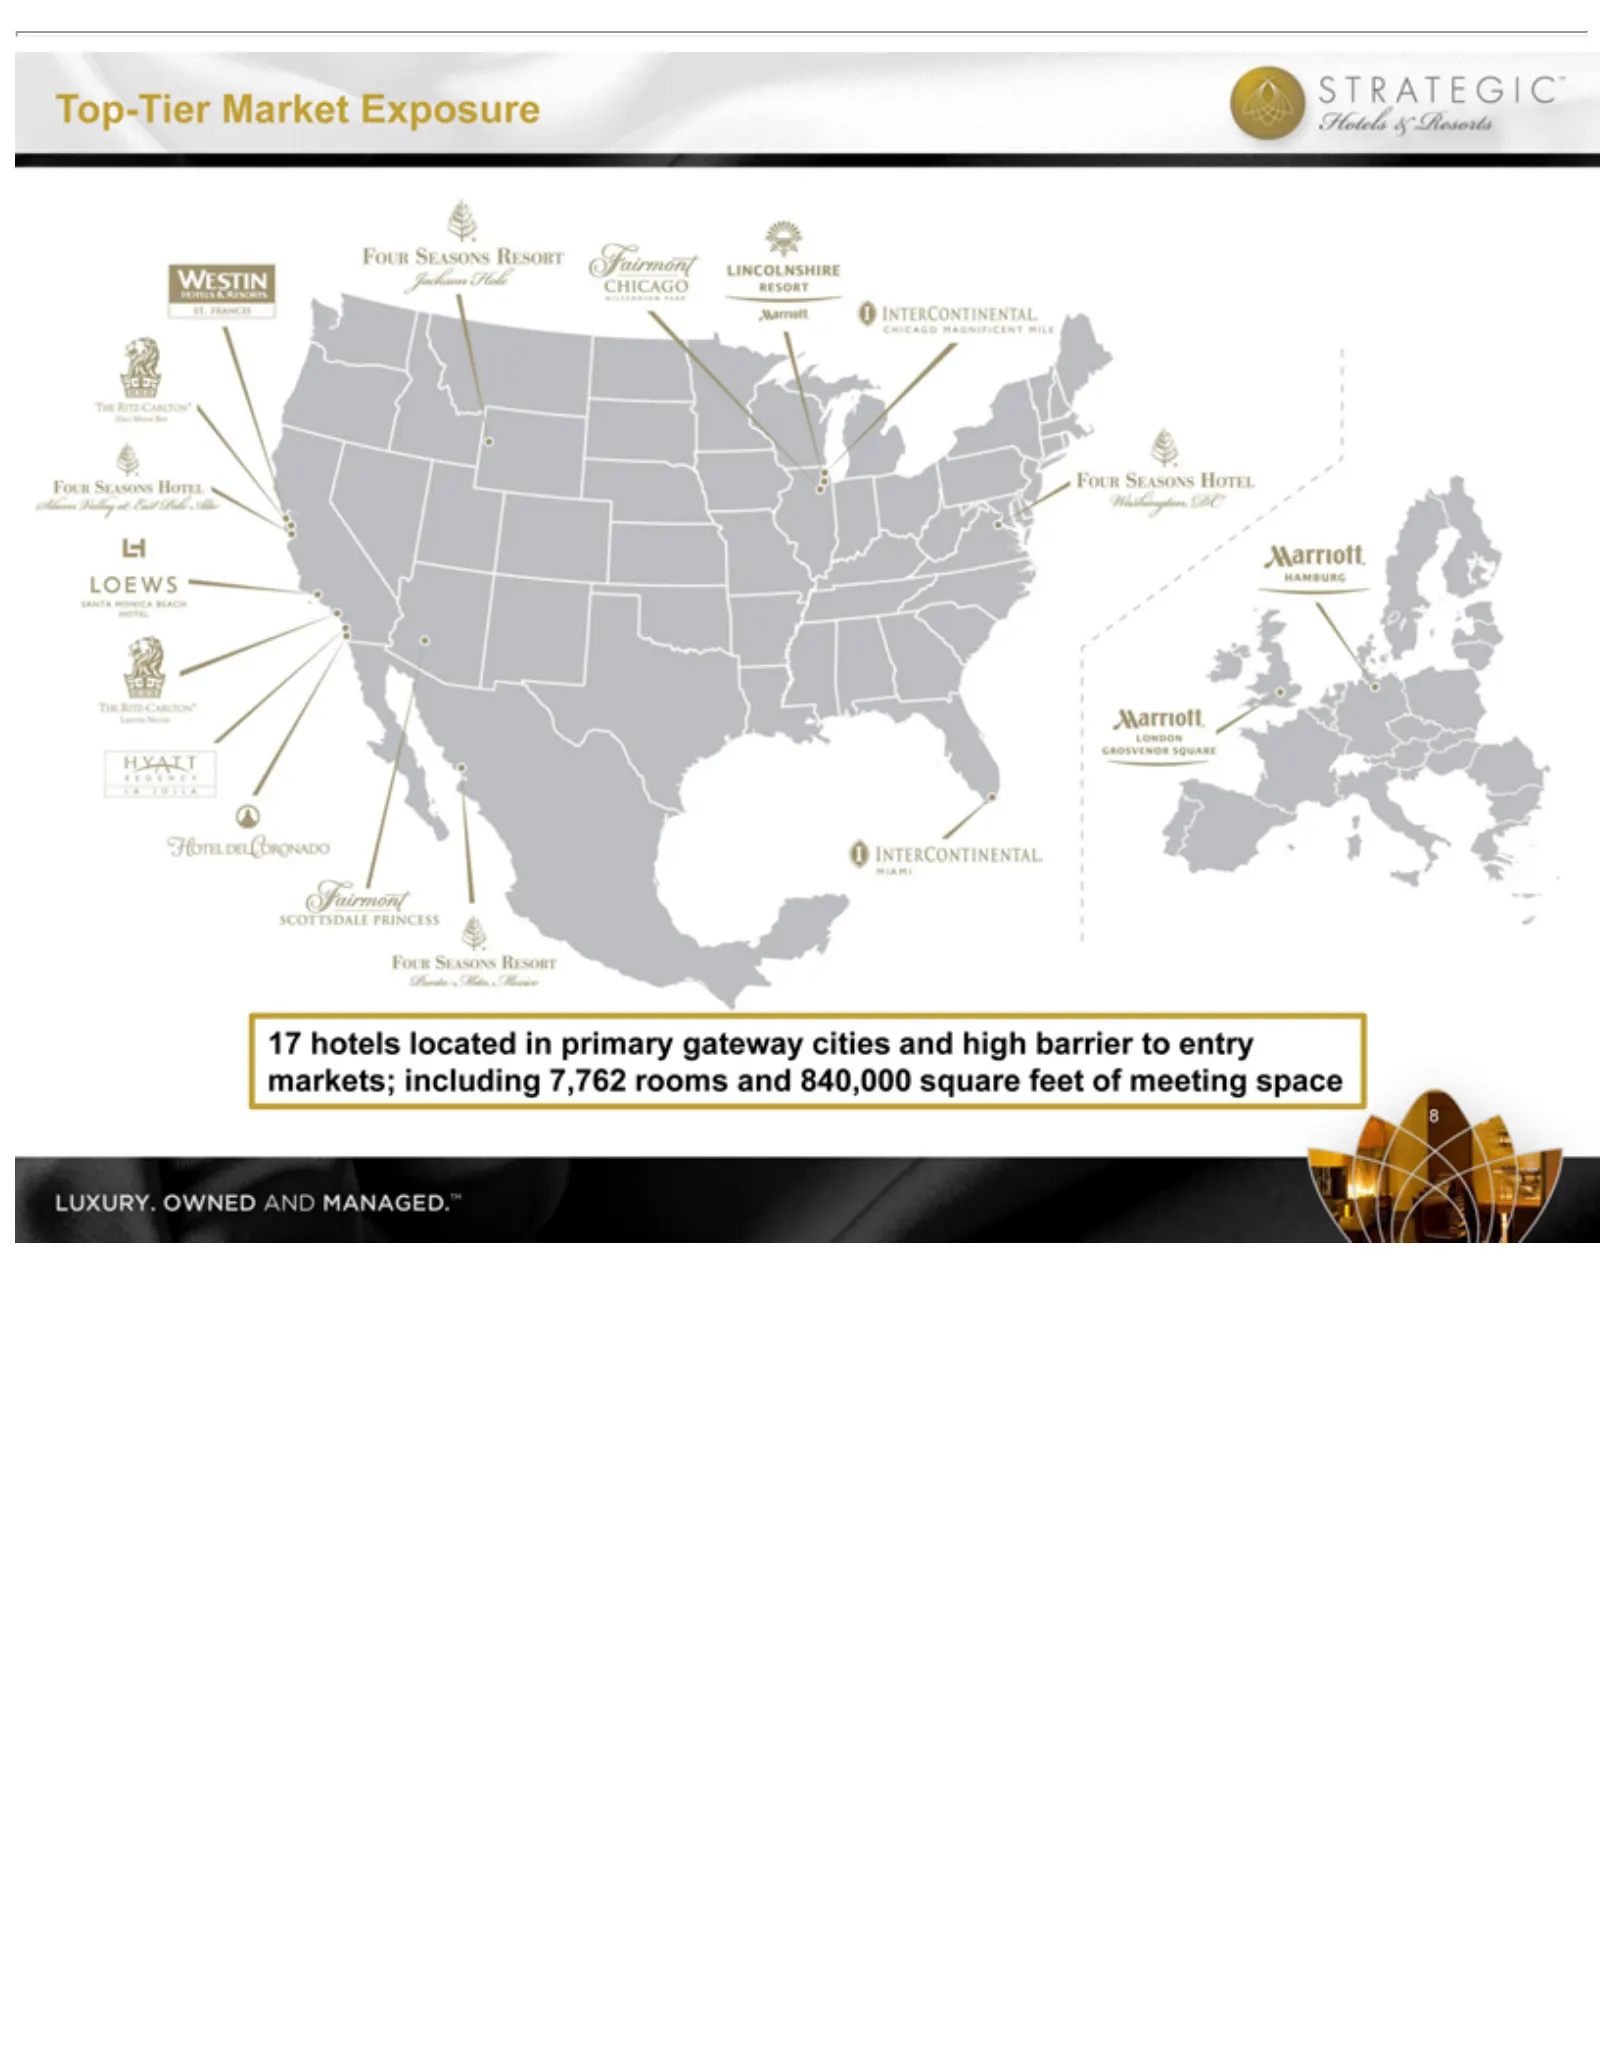
Slide 9: Top-Tier Hotels, Market Exposure
8Top-Tier 17 hotels Market located Exposure in primary gateway cities and high barrier to entry markets; including 7,762 rooms and 840,000 square feet of meeting space
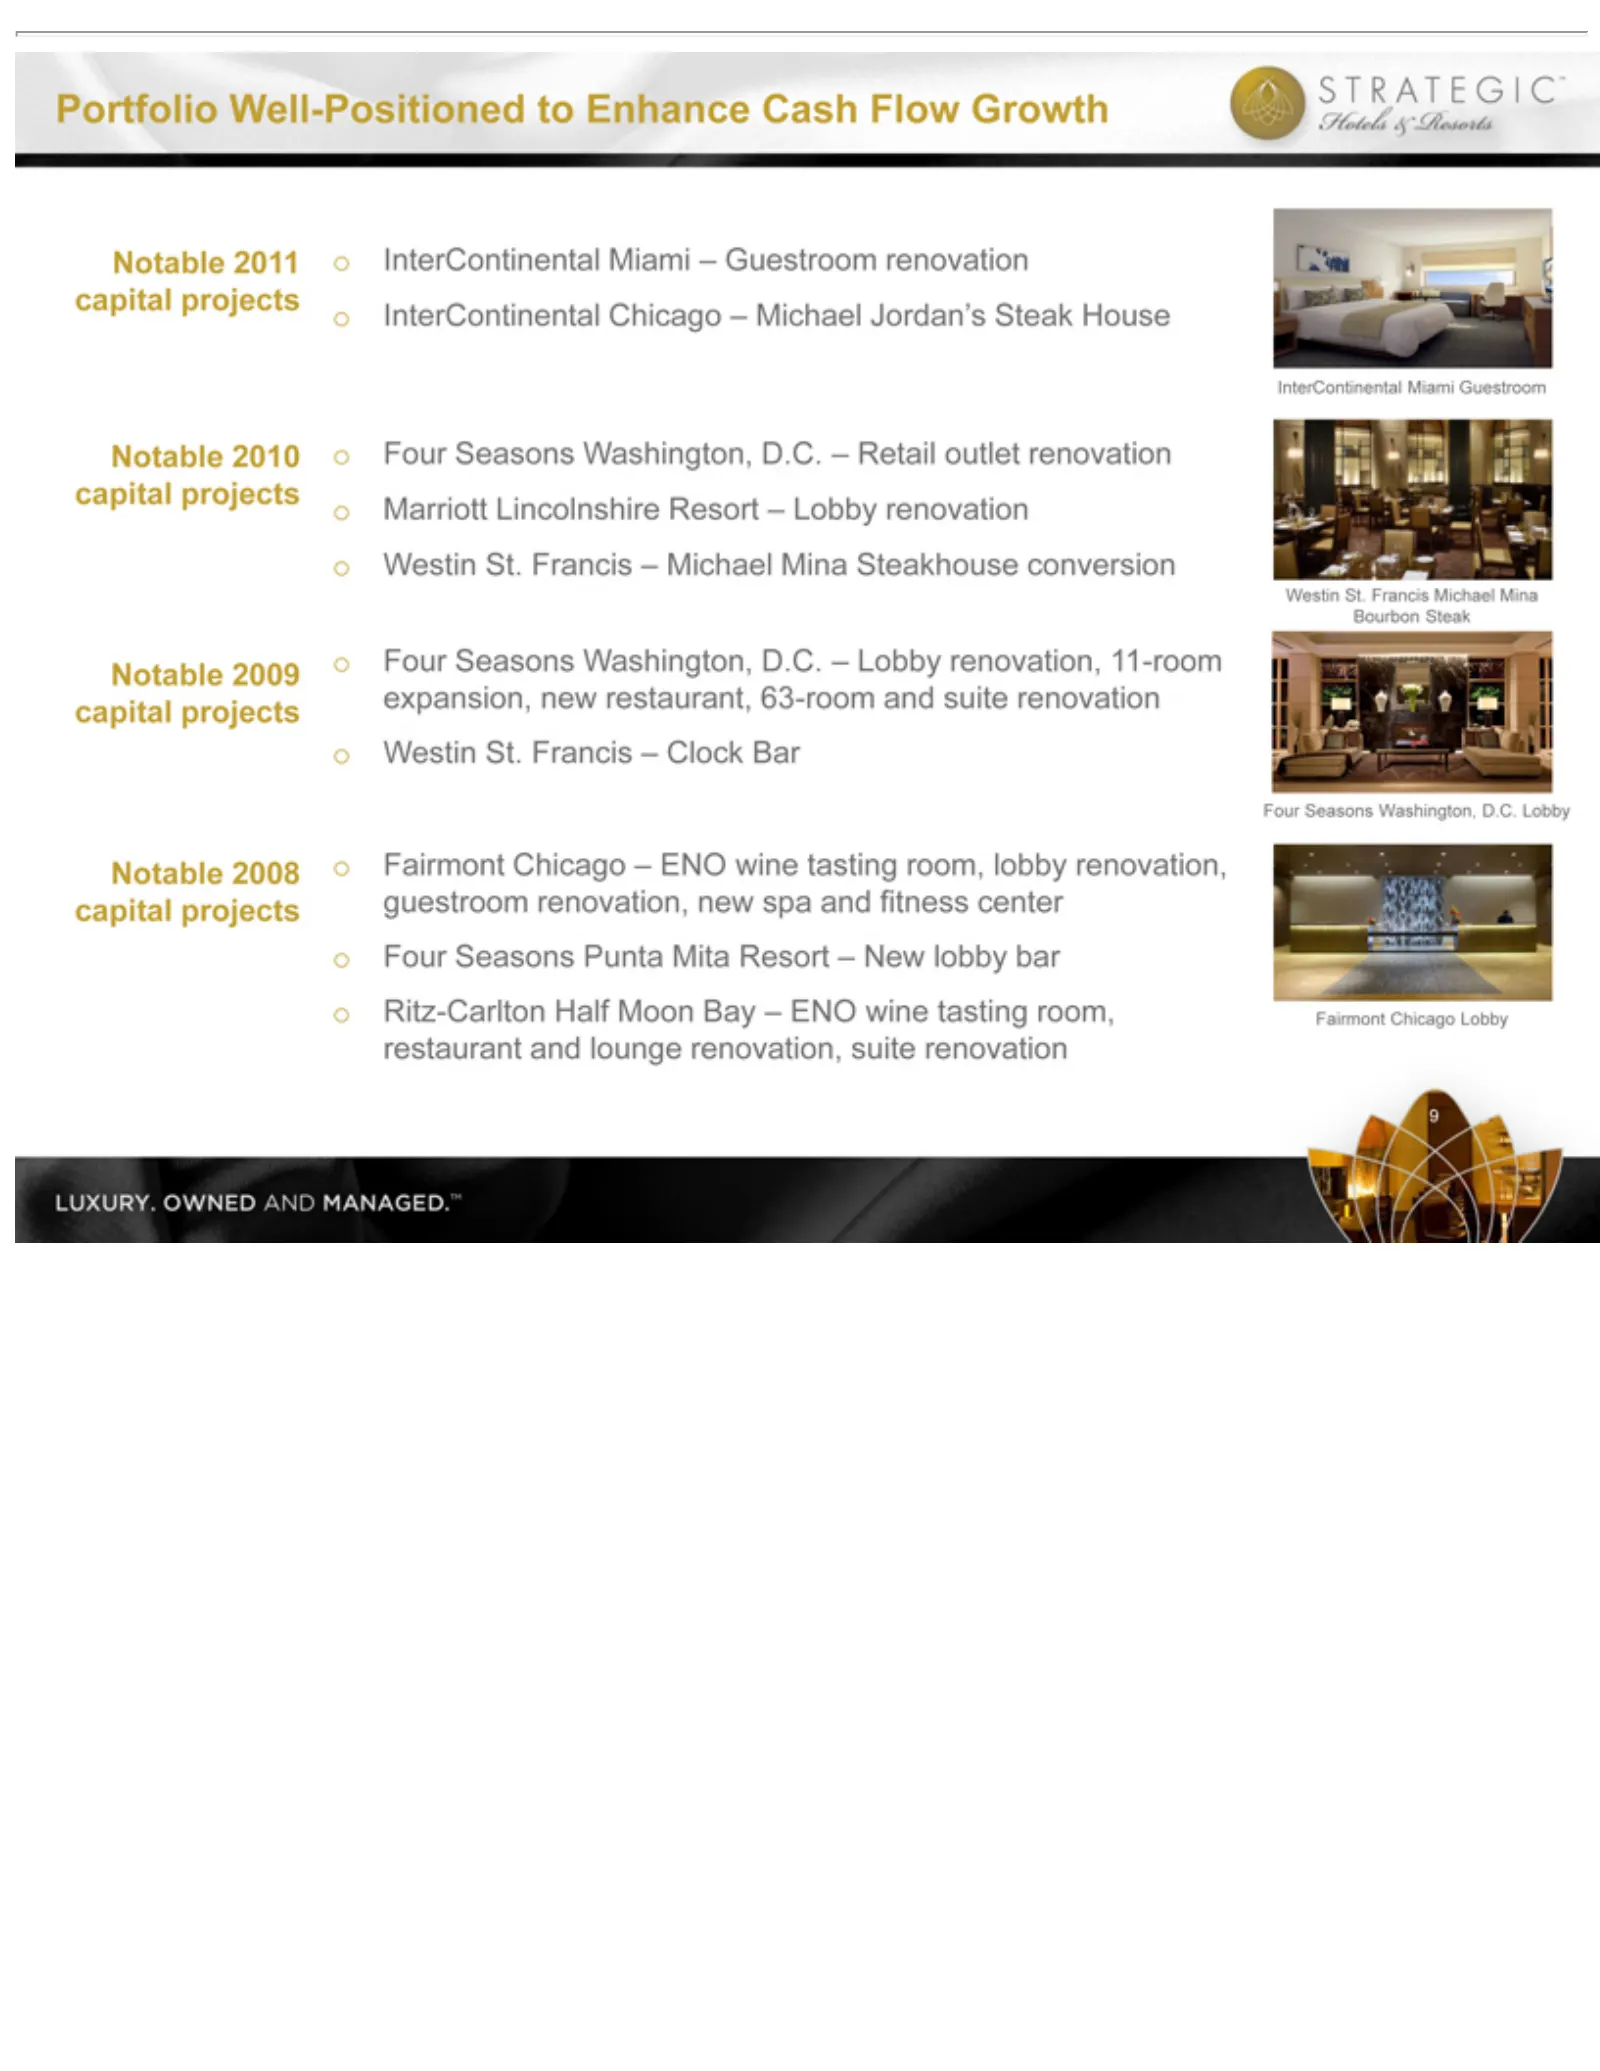
Slide 10: Well-Positioned Portfolio: Notable Capital Projects
oInterContinental oMarriott oWestin oFairmont oFour oRitz-Carlton Notable InterContinental 9P ortfolio Seasons 2008 2009 2010 2011 St. Well-Positioned Lincolnshire Chicago Francis capital Half Washington, Punta Miami Miami Chicago Moon – projects Mita ENO Michael Clock Resort Guestroom –Bay toResort
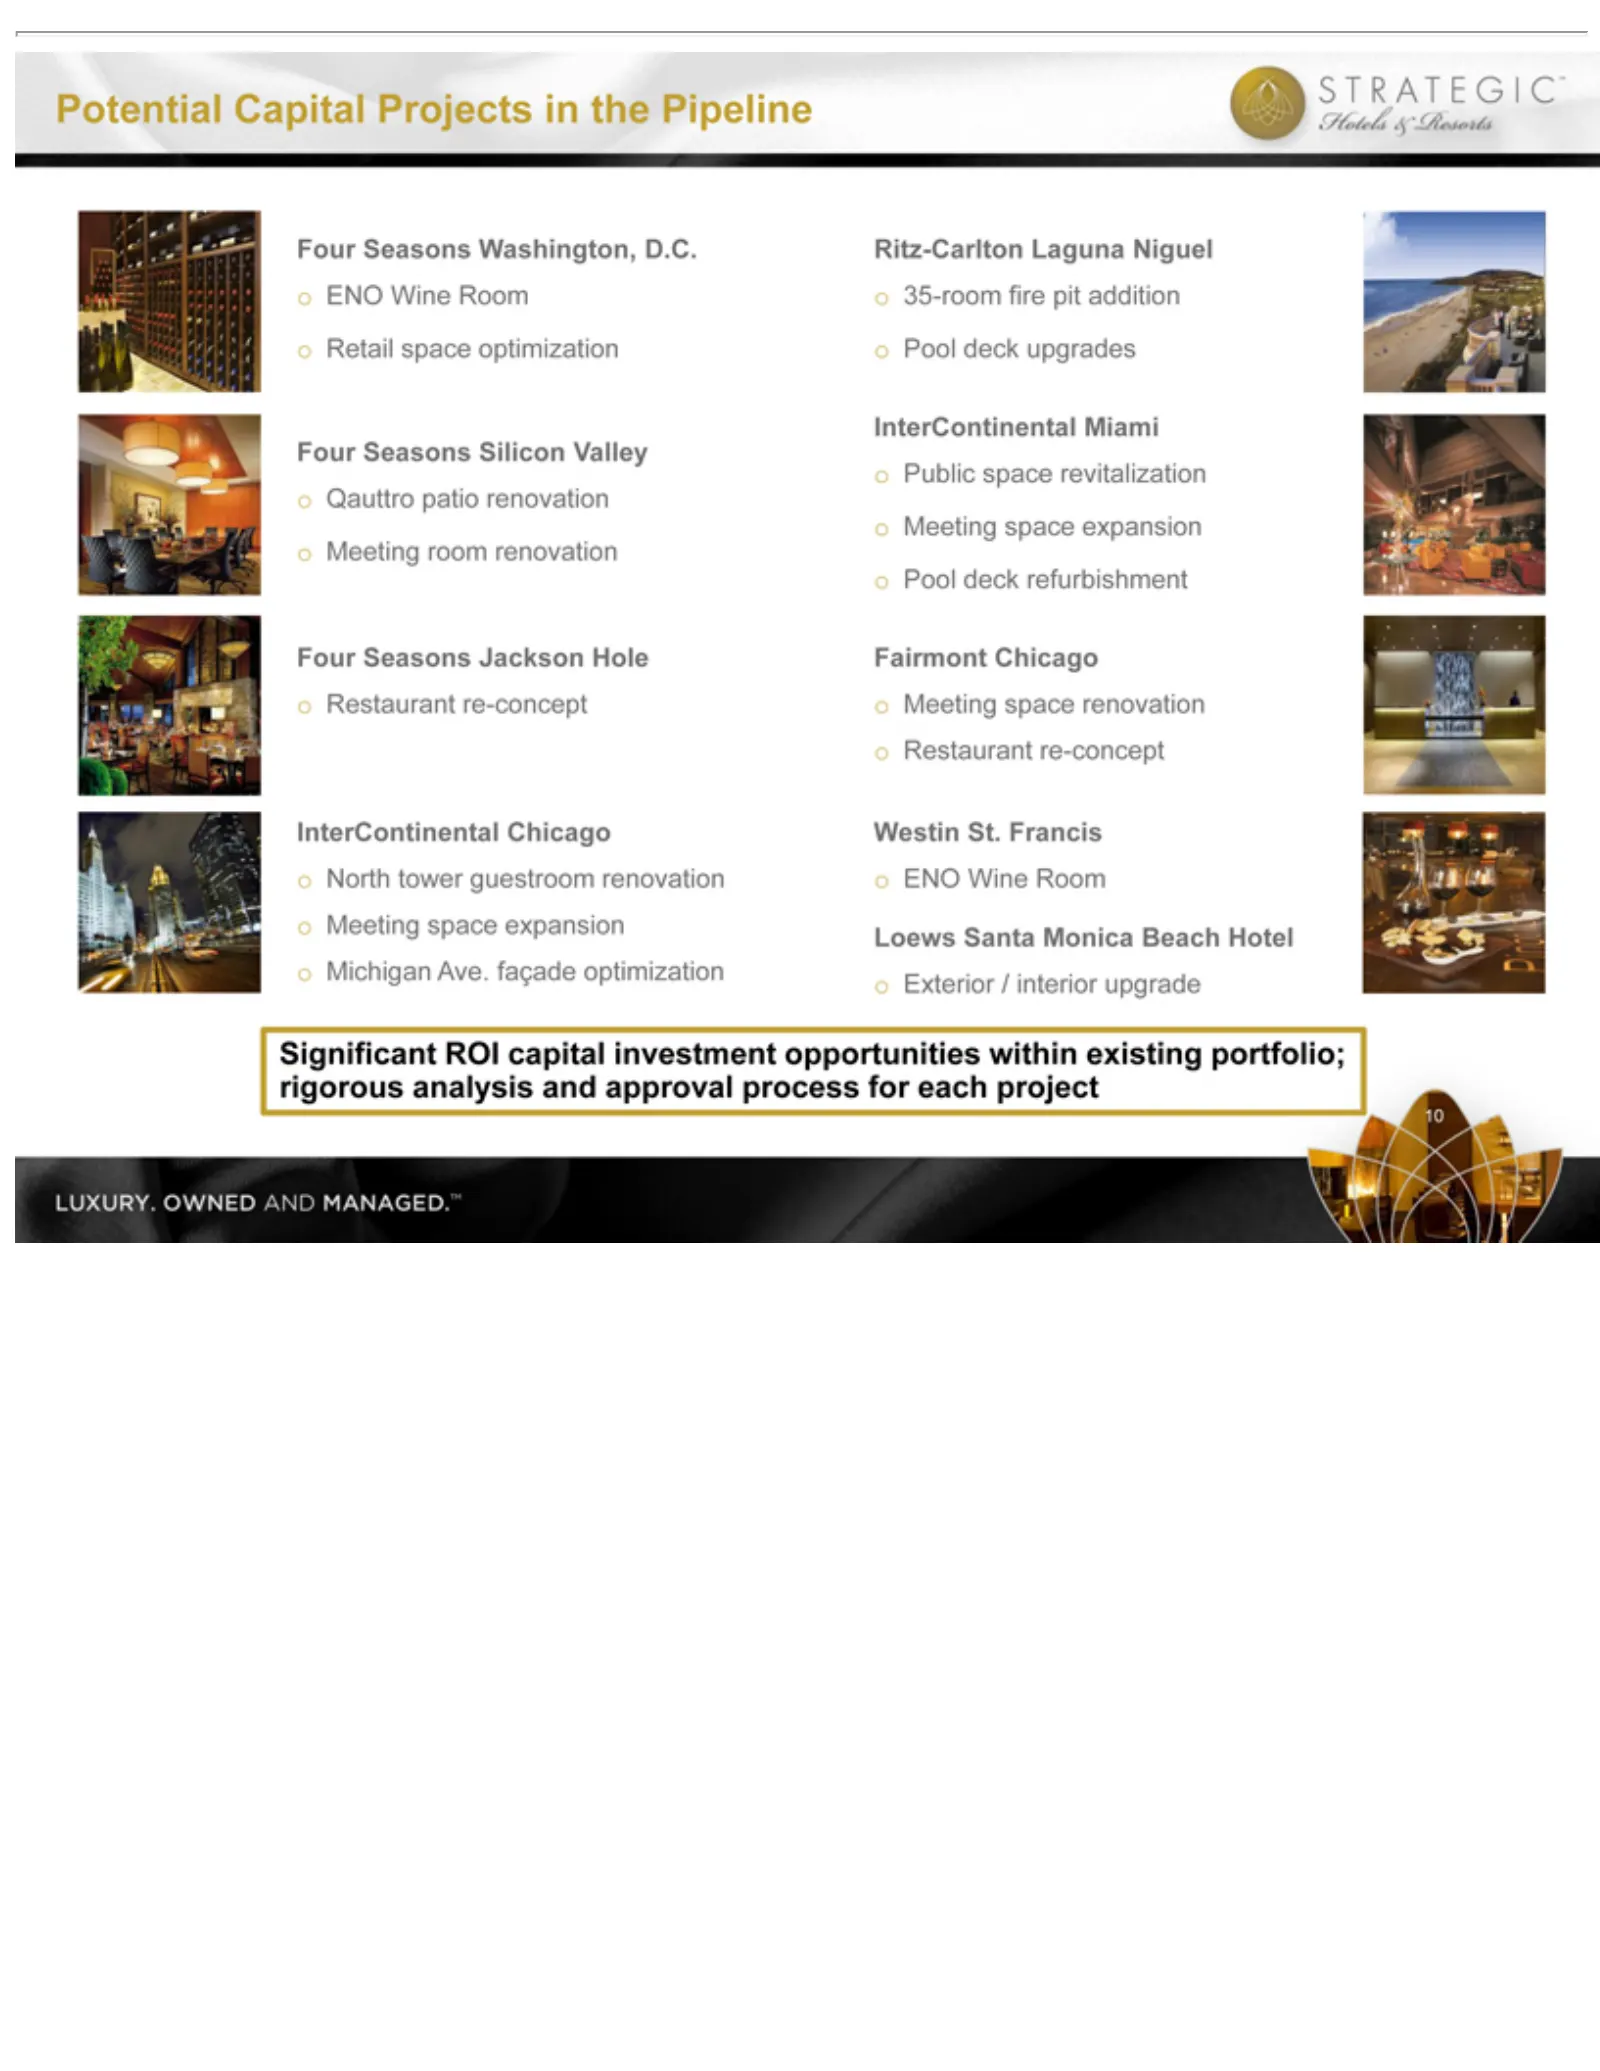
Slide 11: Potential Capital Projects in the Pipeline
oRetail oQauttro Four oNorth oMichigan Ritz-Carlton o35-room InterContinental oPublic oPool Fairmont oMeeting oRestaurant Westin oENO Loews oExterior Significant Seasons deck Wine Santa St. tower space space patio Chicago /space room fire Francis Ave. interior ROI upgrades refurbishment re-concept R
Slide 12: Industry Update
I.BEE’s Unique II.Company III.Industry IV.Operating V.Financial Industry Update Overview Update Overview Trends Value Proposition
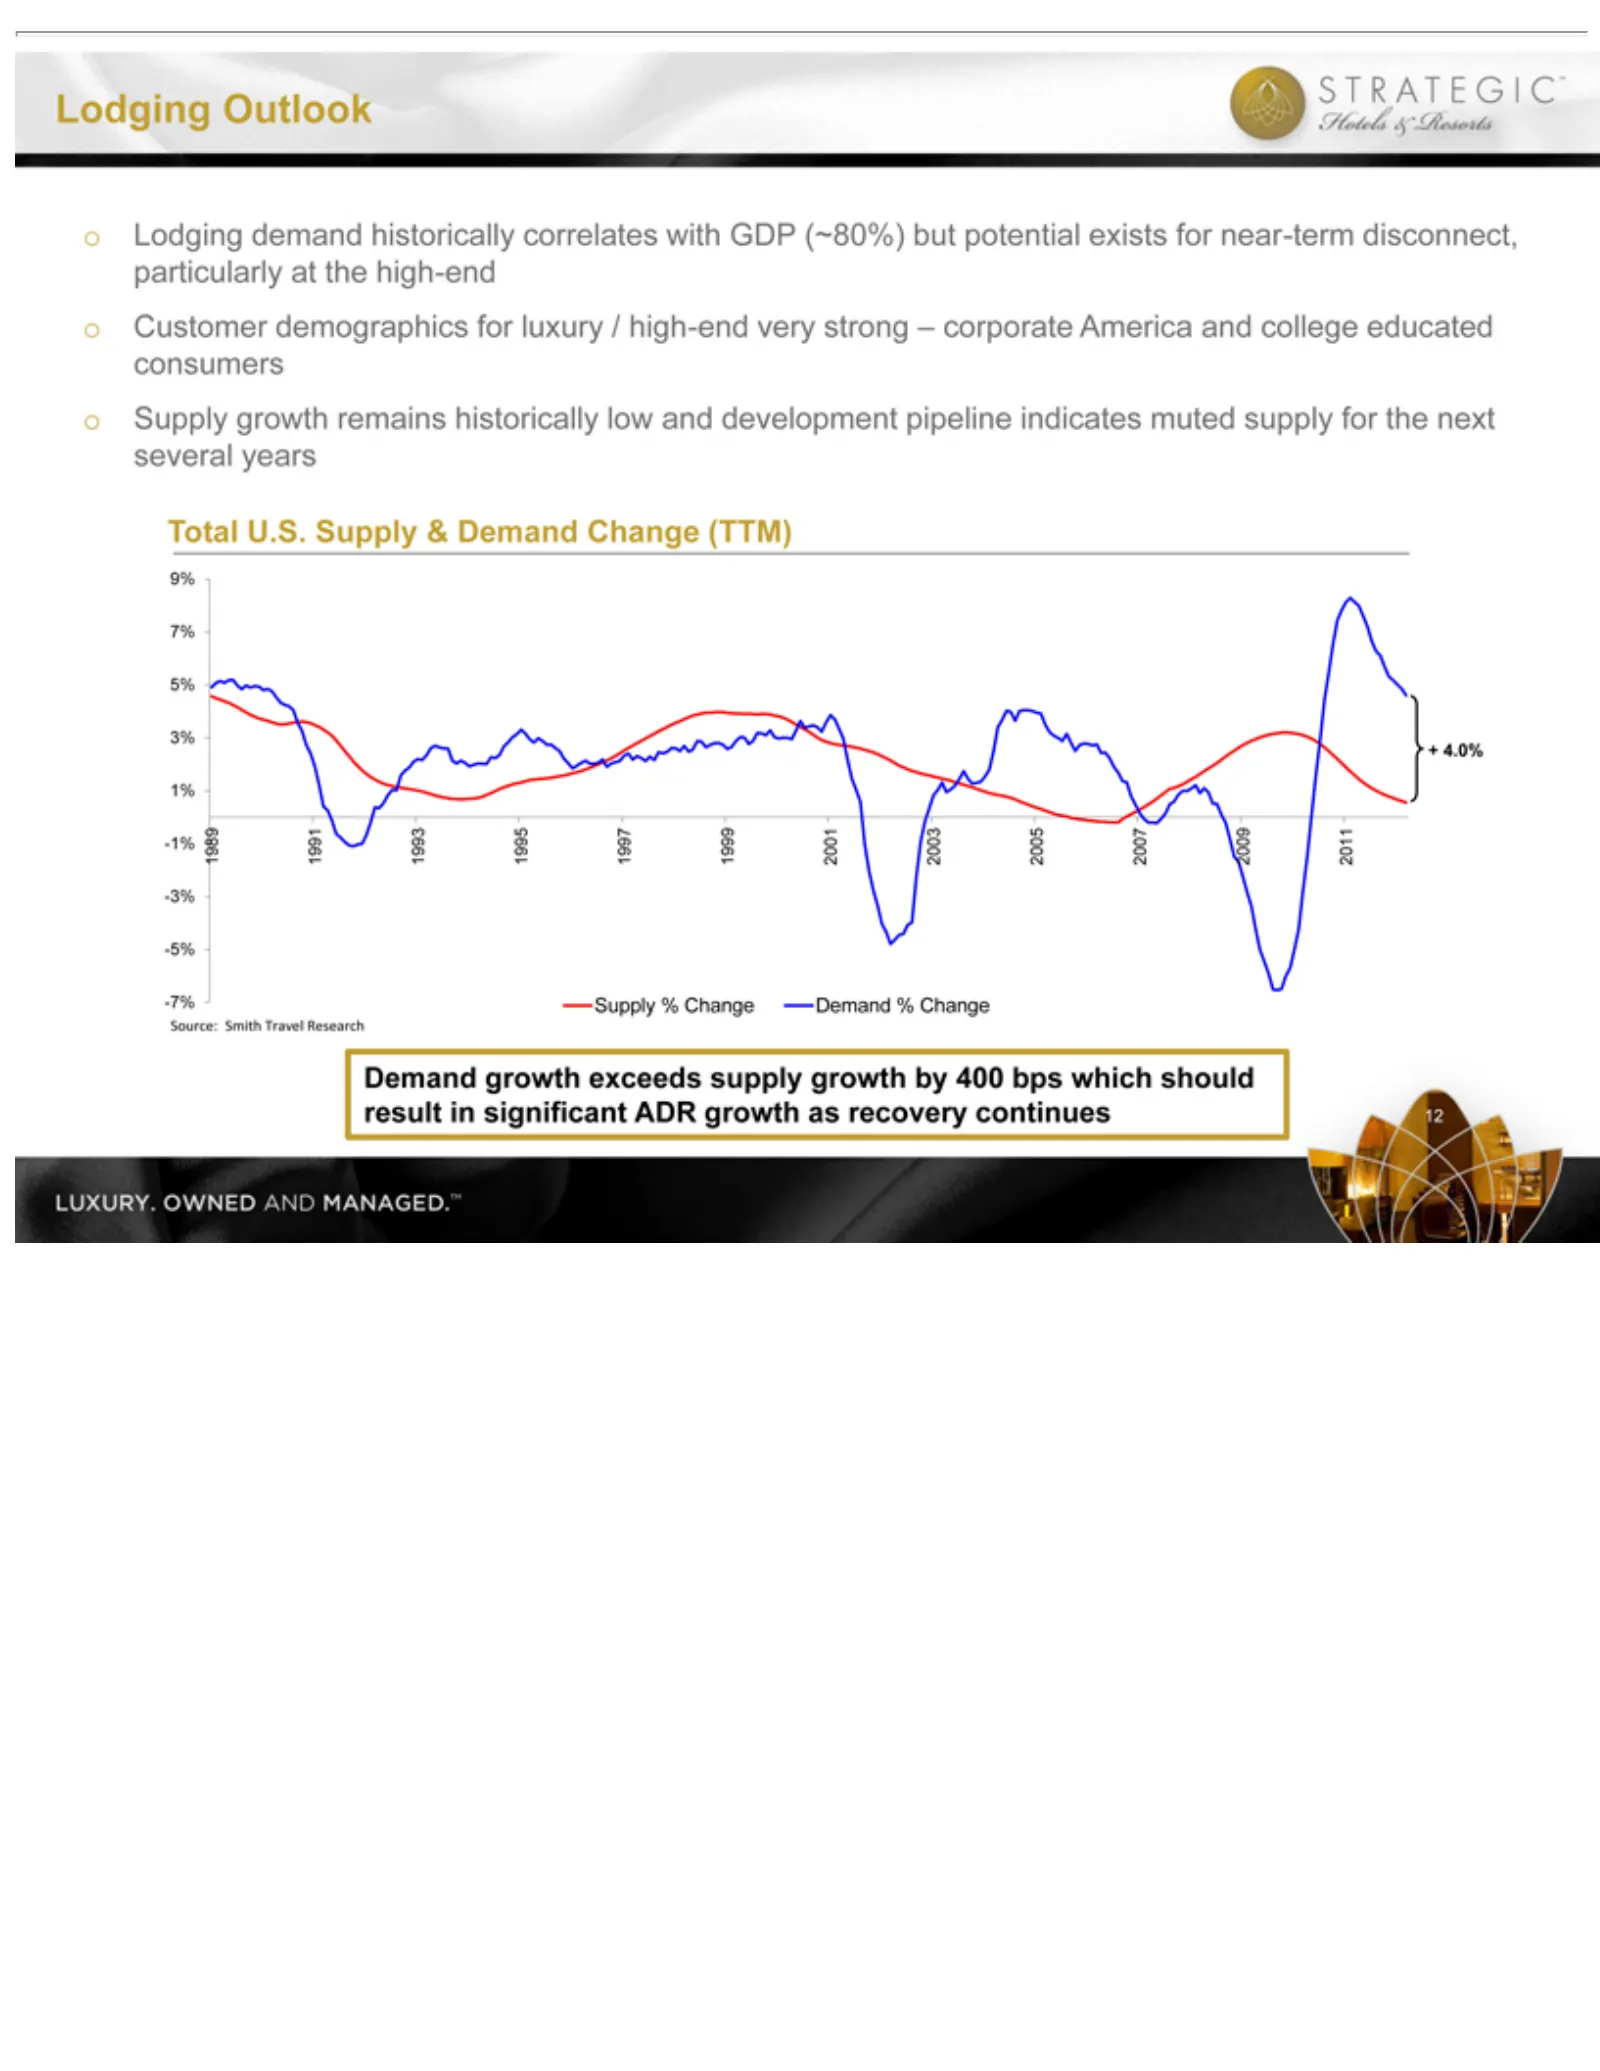
Slide 13: Lodging Supply and Demand Outlook
-7%-5%-3%-1%1%3%5%7%9%198919911993199519971999200120032005200720092011Supply oLodging oCustomer oSupply Total Lodging 12 + 4.0% U.S.growth Outlook demand Supply demographics remains & historically Demand historically for luxury Change correlates /low high-end (TTM) with and development Source: GDP v
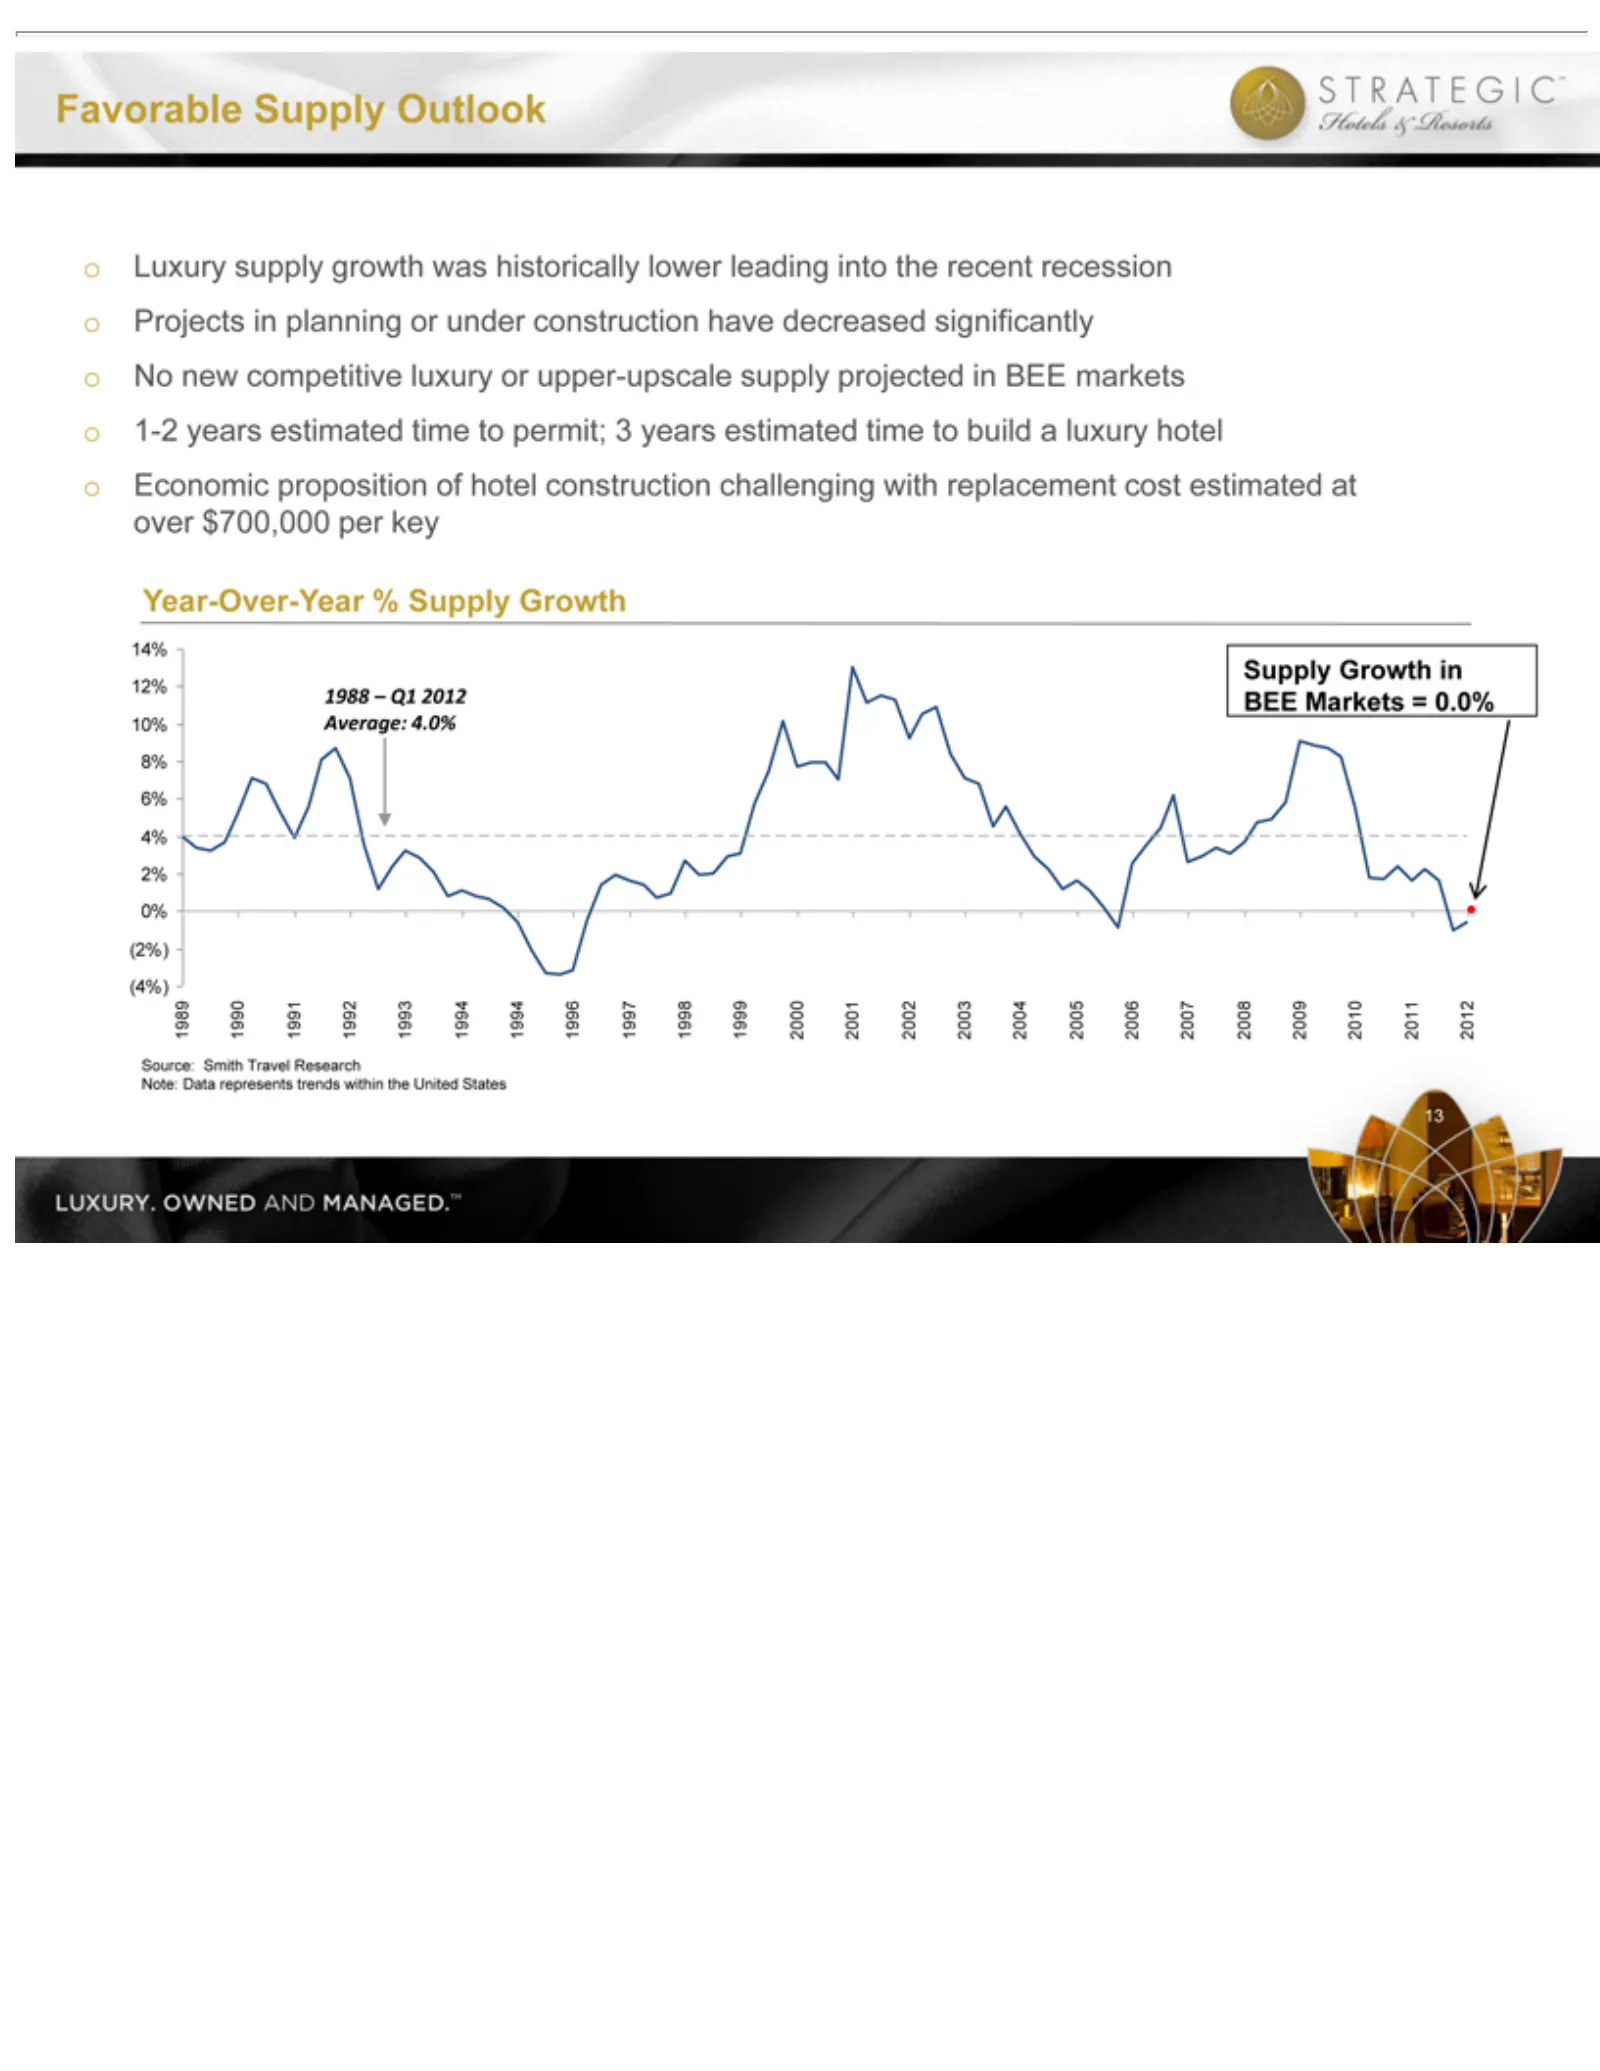
Slide 14: Luxury Supply Growth Favorable
oLuxury oProjects oNo o1-2 oEconomic Favorable 13 1988 (2%)0%2%4%6%8%10%12%14%198919901991199219931994199419961997199819992000200120022003200420052006200720082009201020112012 Source: new years – Q1 supply competitive in Supply estimated 2012 Smith proposition planning growth Average: Travel Outlook
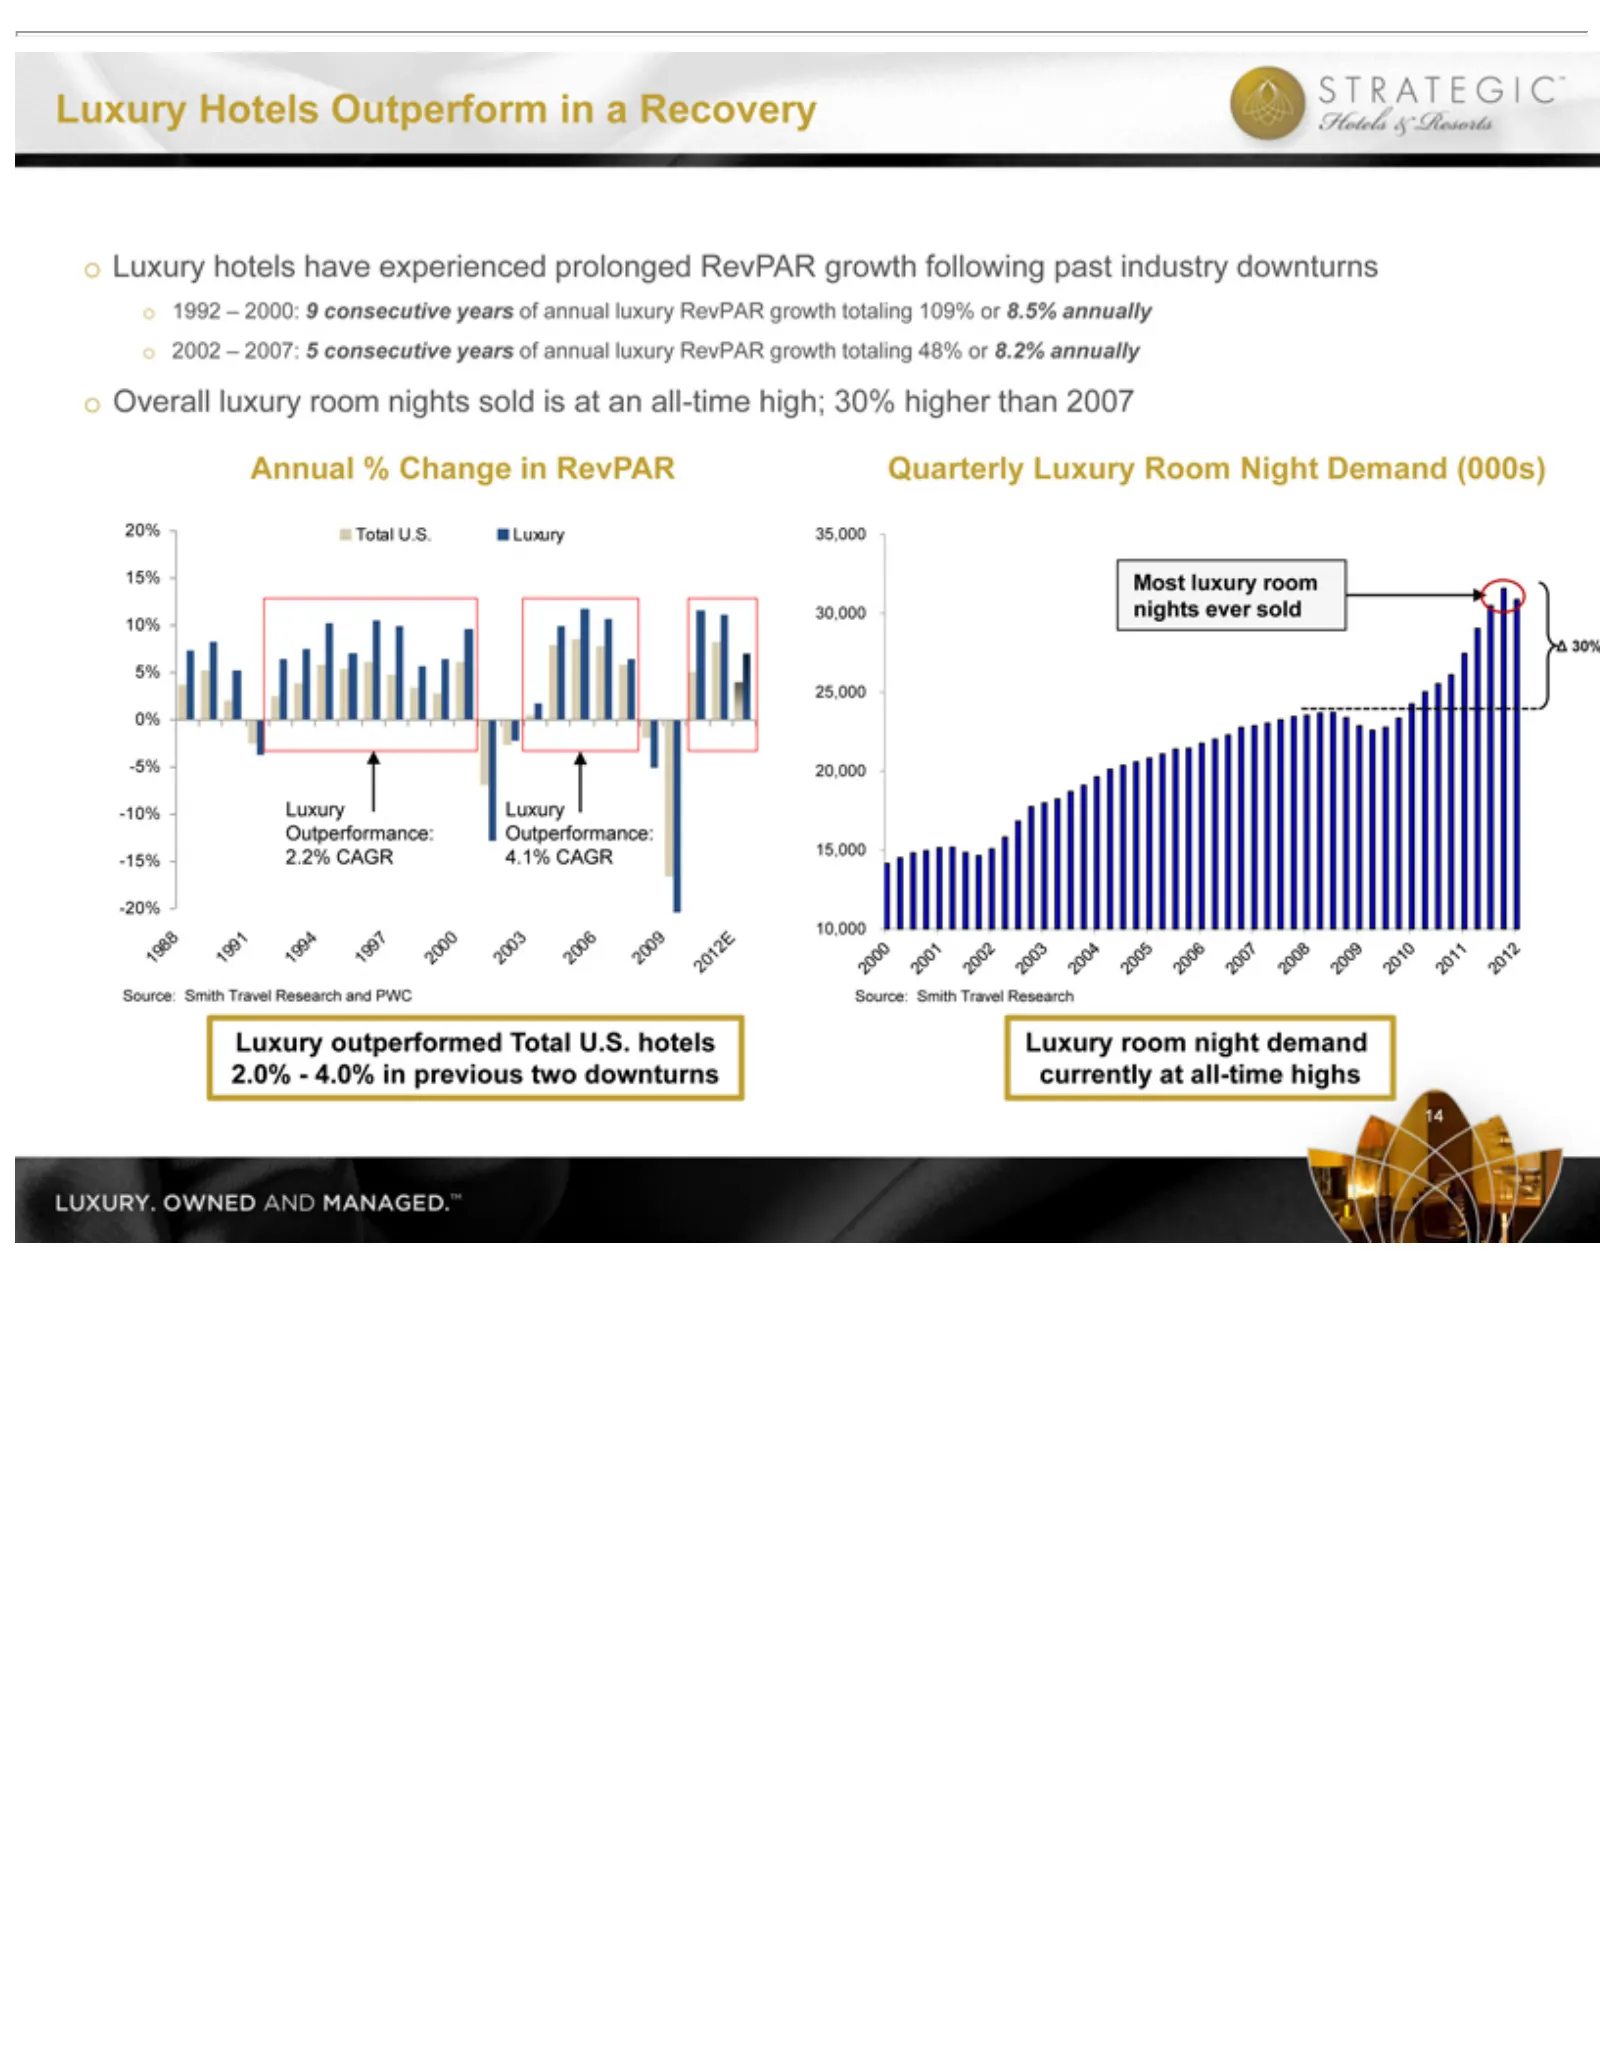
Slide 15: Luxury Outperformance and Demand Recovery
10,00015,00020,00025,00030,00035,00014 Smith 4.1% Outperformance: Quarterly oLuxury o1992 o2002 oOverall Luxury 14 Most Luxury luxury CAGR Travel –room outperformed 2000: 2007: hotels luxury Luxury Hotels room Annual Research night 59have room consecutive Room Outperform nights demand experienced %T
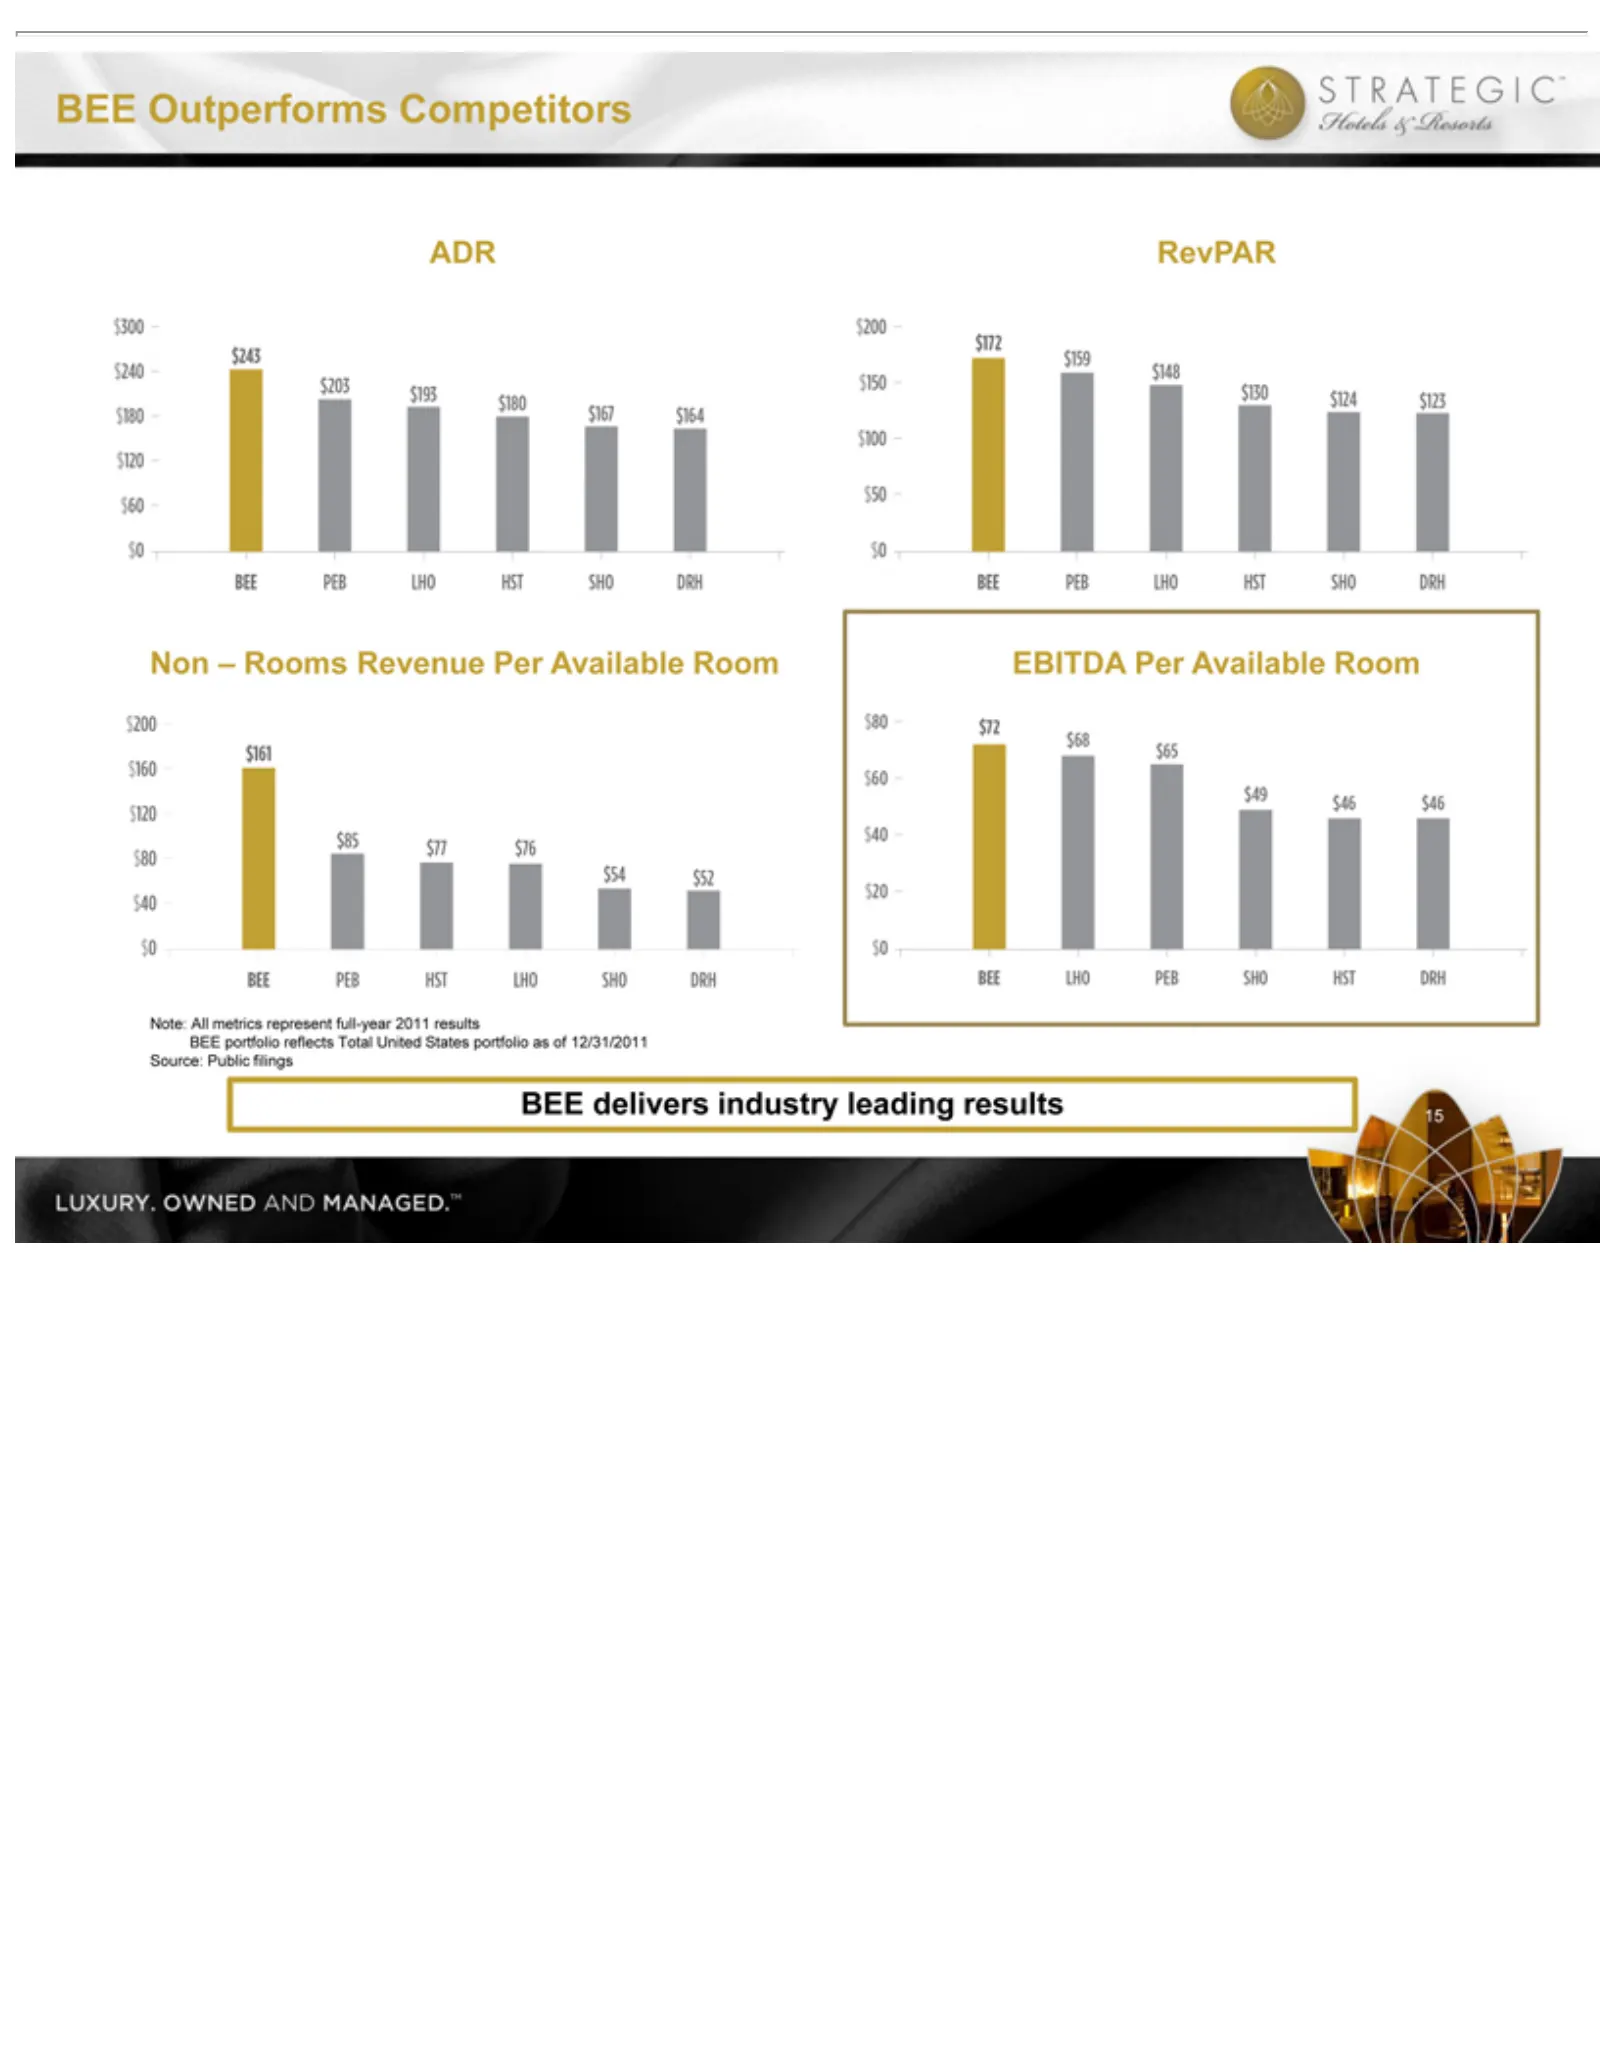
Slide 16: Portfolio Outperforms Industry
EBITDA Non Note: Source: BEE 15 ADR –Outperforms portfolio delivers All Rooms Public RevPAR Per metrics Available industry Revenue reflects filings represent Competitors Total leading Room Per full-year Available United results States 2011 Roomresults portfolio as of 12/31/2011
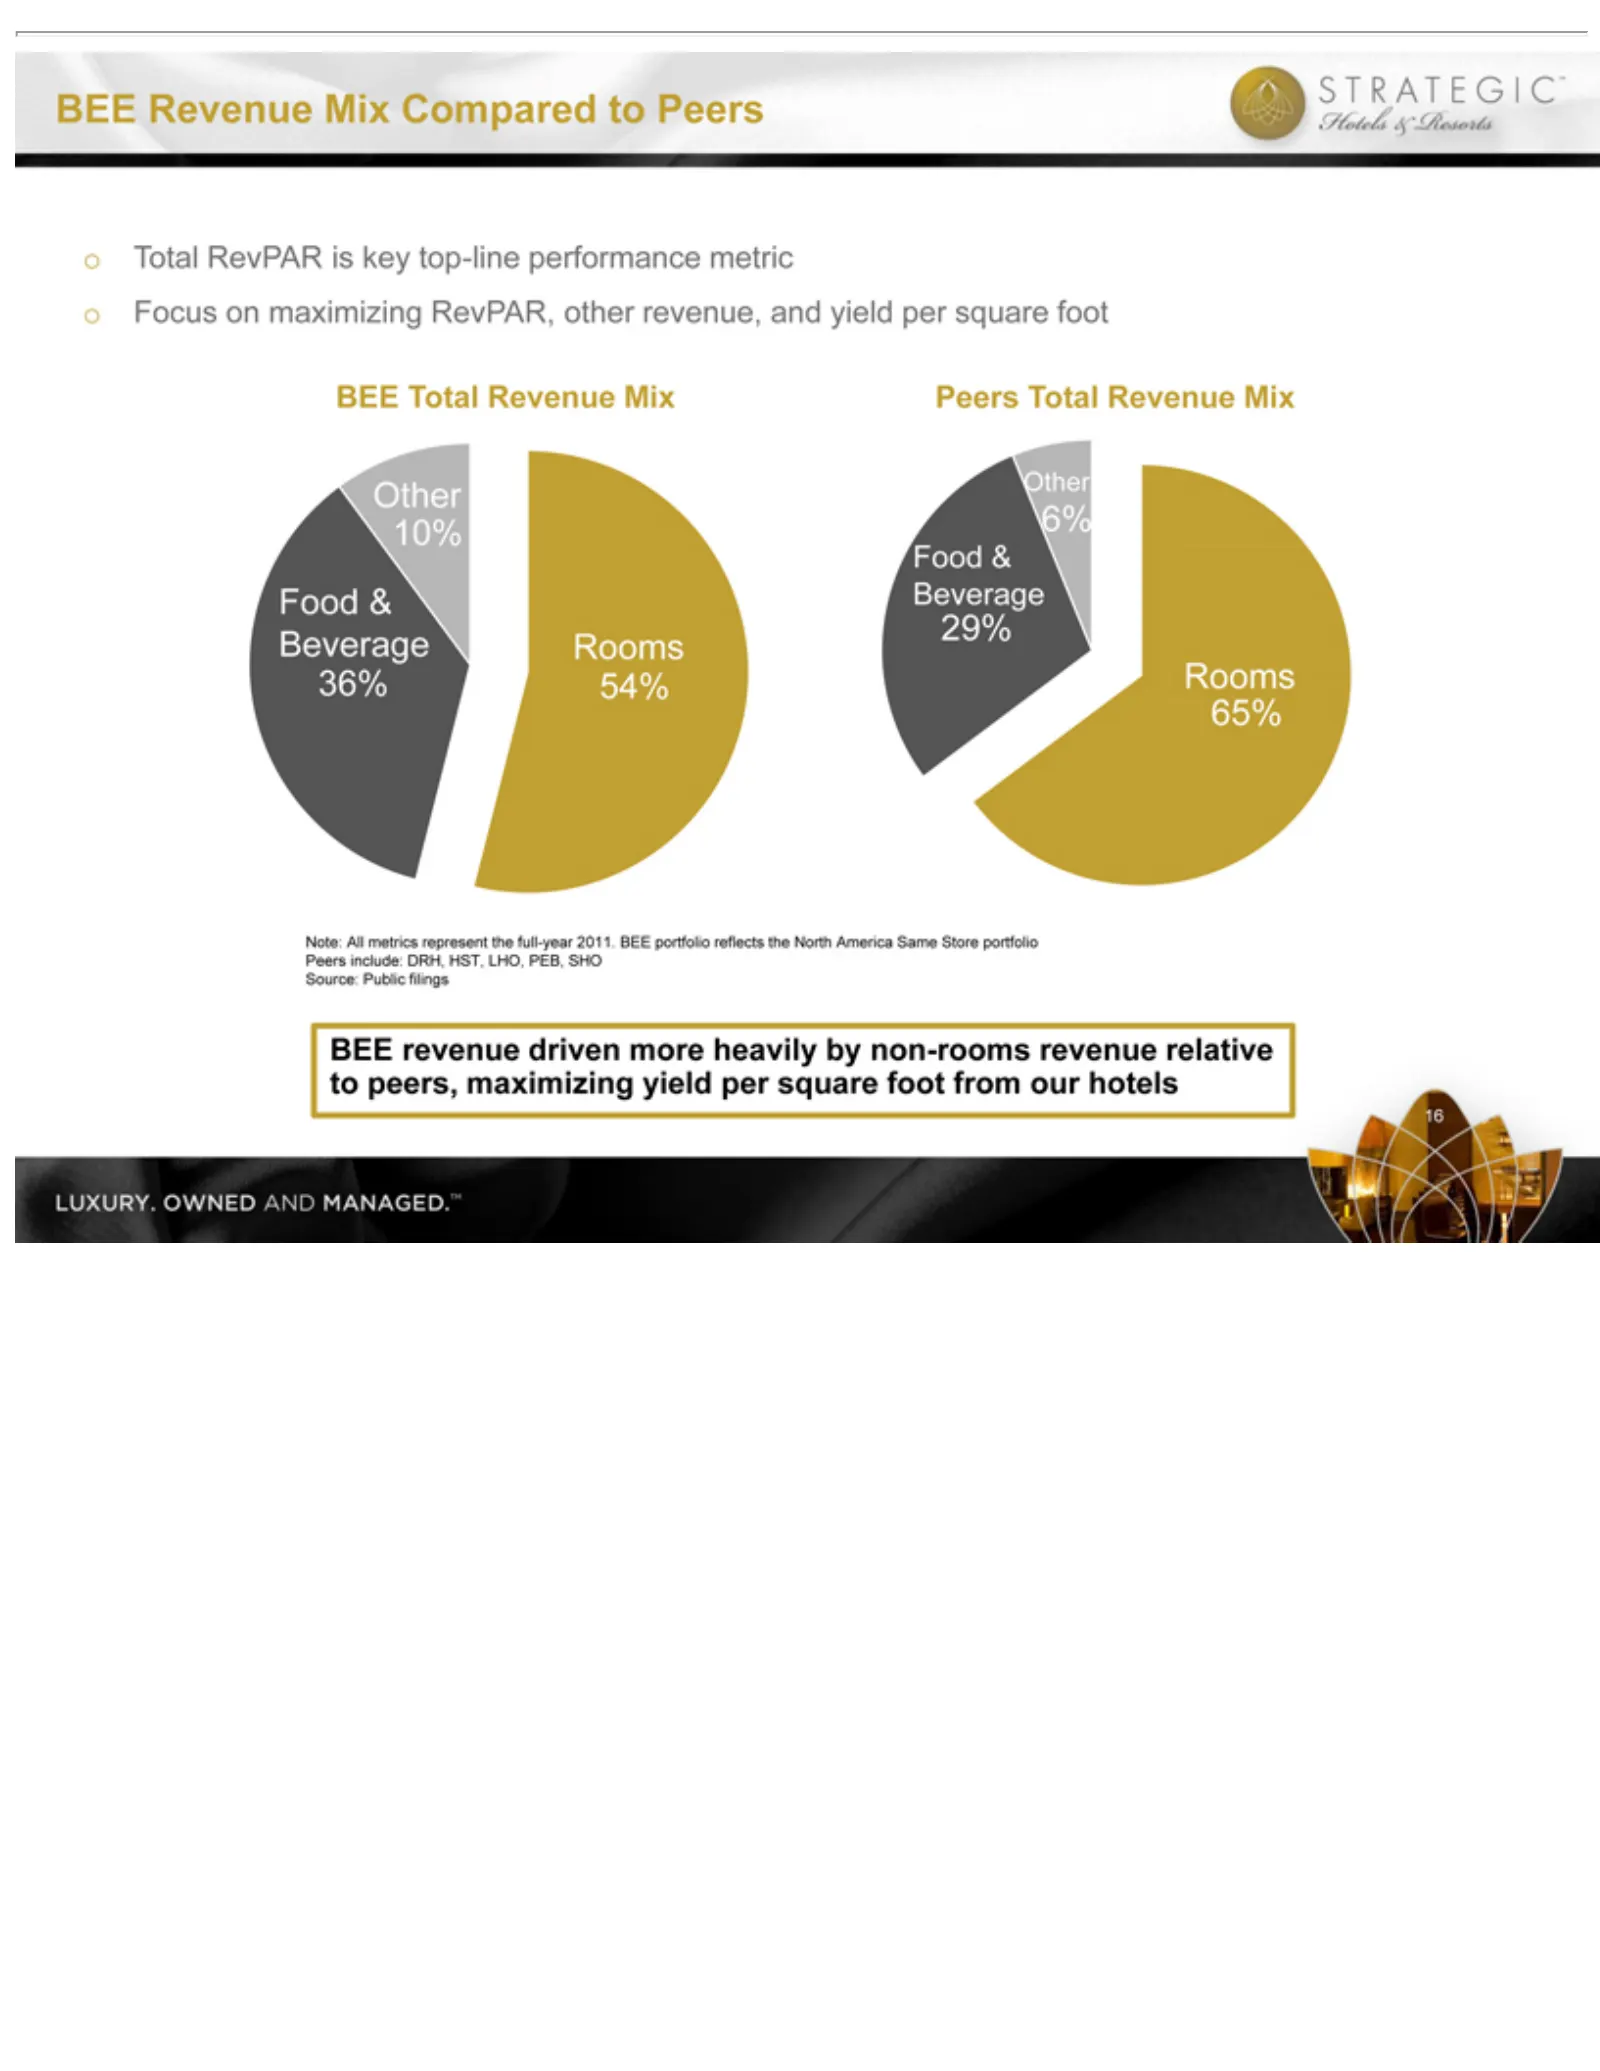
Slide 17: Total Revenue Mix and Focus on Yield
oTotalTotal oFocus Note: Peers Source: BEE 16 Food Other Roomsrevenue Revenue &Total include: All RevPAR on Public Beverage metrics maximizing Revenue Revenue driven DRH, Mix filings isrepresent 65%29%6% key Compared Mix more Mix HST, top-line RevPAR, heavily LHO, theto performance full-year Peers P
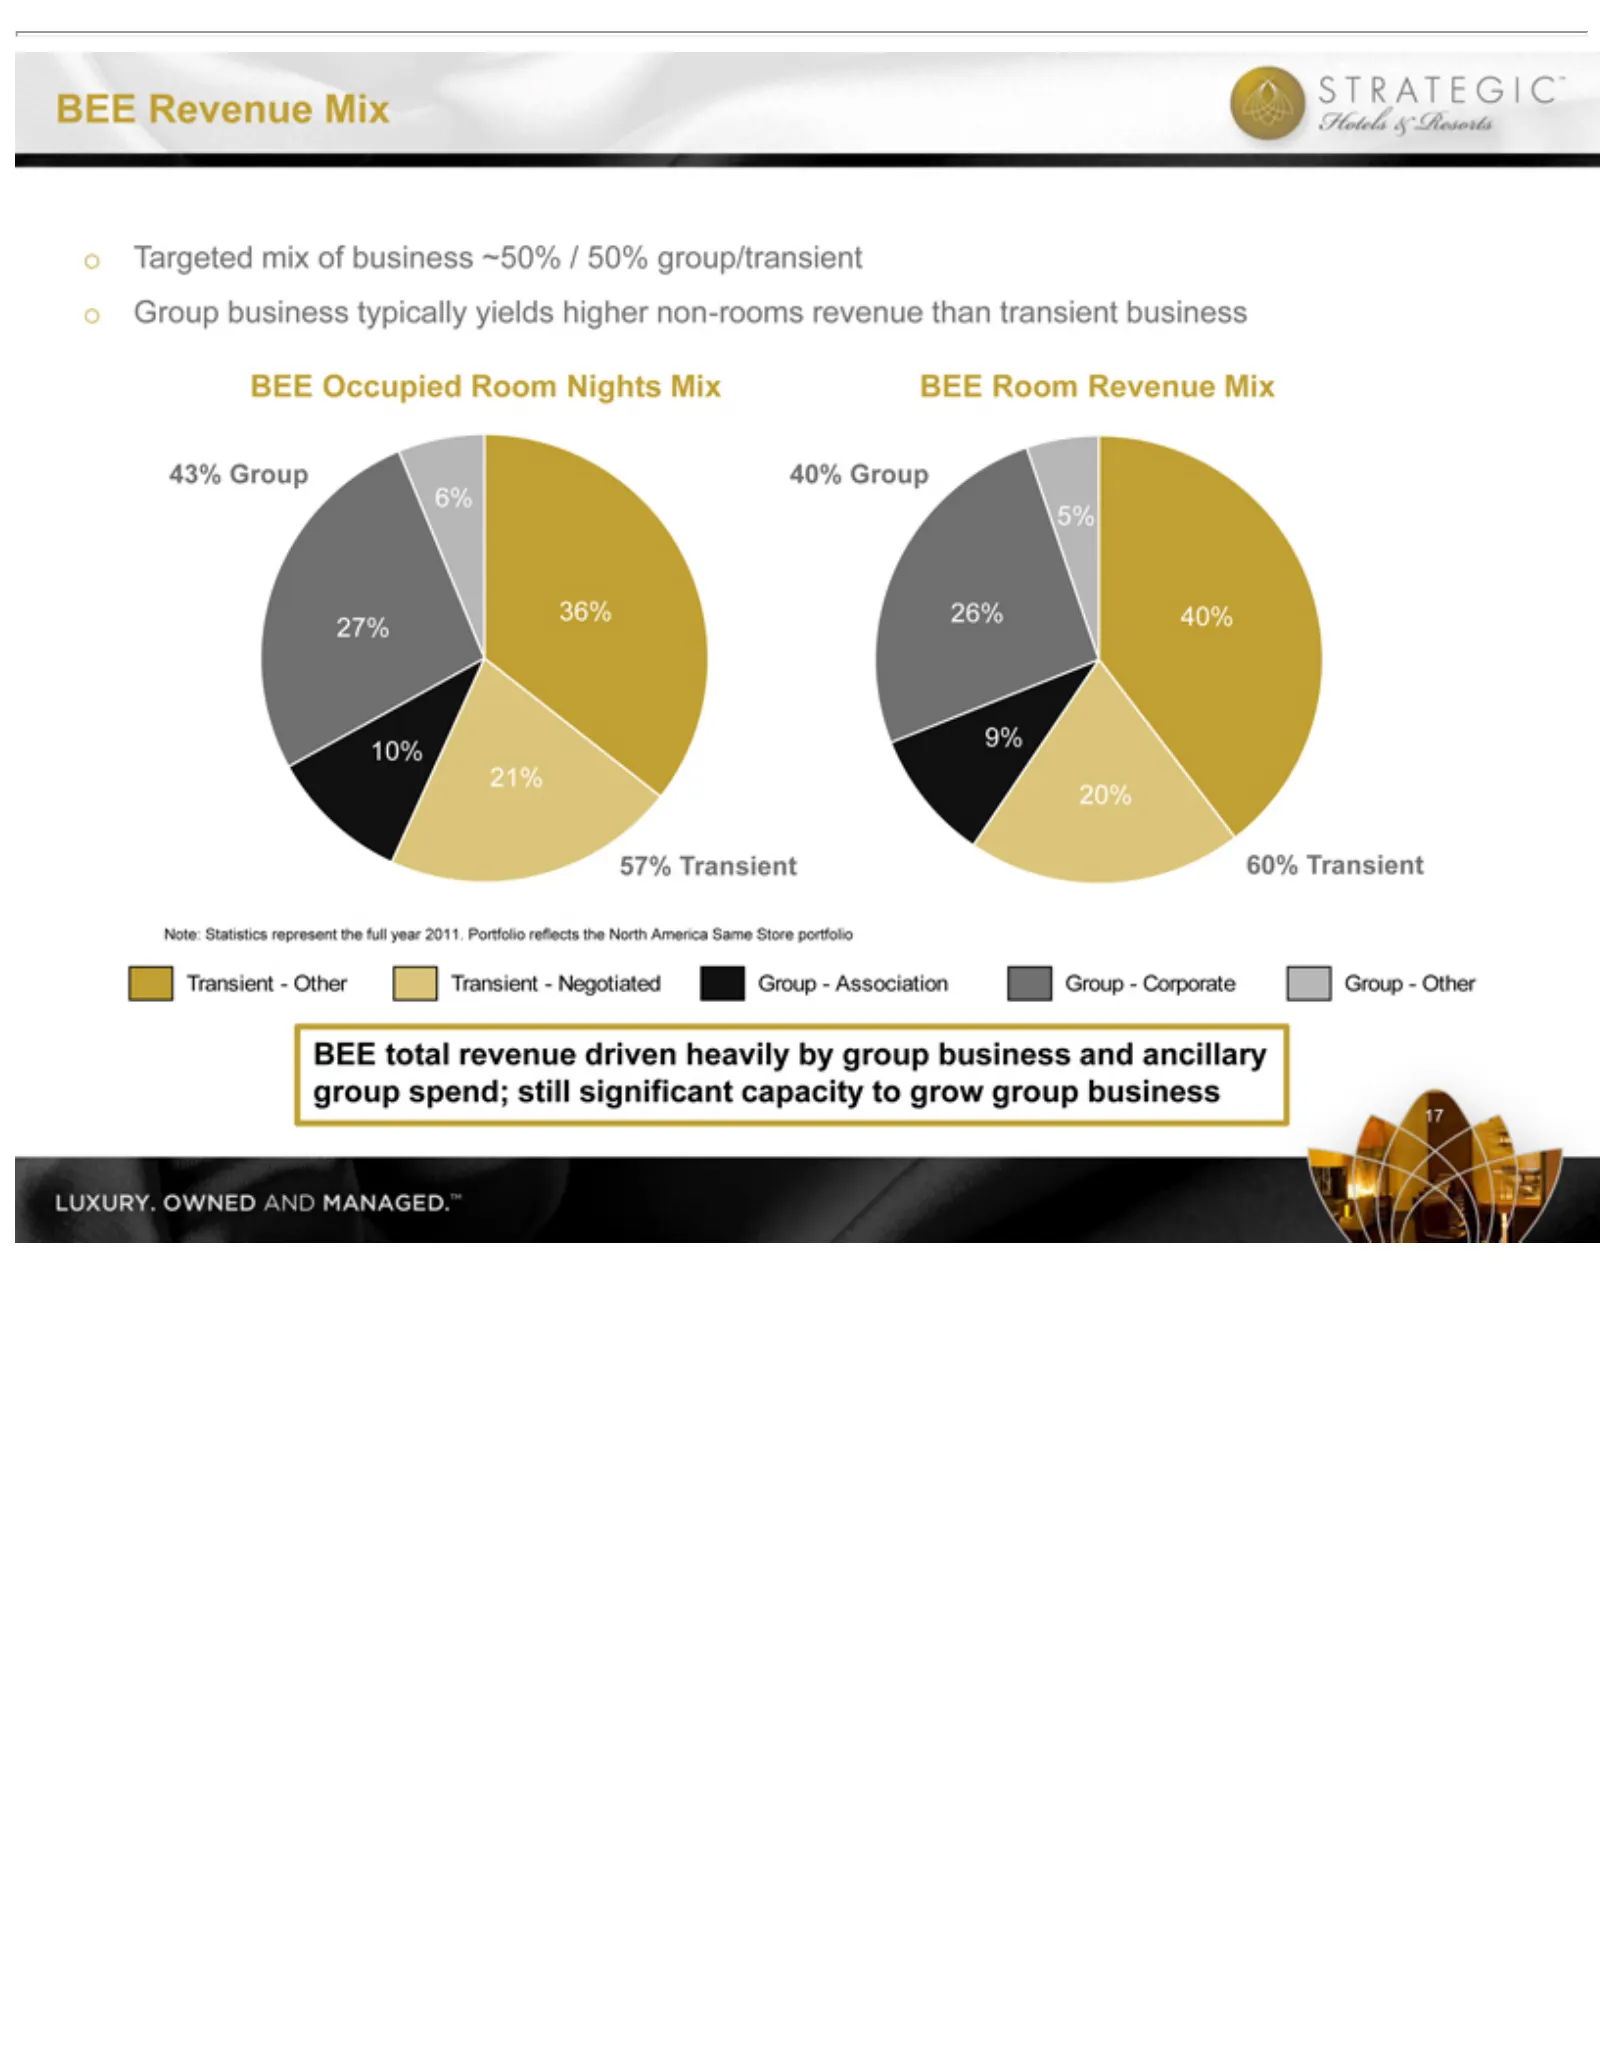
Slide 18: Group and Transient Business Mix
Note: 36%21%10%27%6%40%20%9%26%5%17 oTargeted oGroup 43% 40% 57% 60% BEE 17 BEE Transient Group total Statistics business Revenue revenue mix ofrepresent typically business Mix driven Transient the heavily yields ~50% full–higher year /by Other 50% group 2011. group/transient non-rooms Transient bus
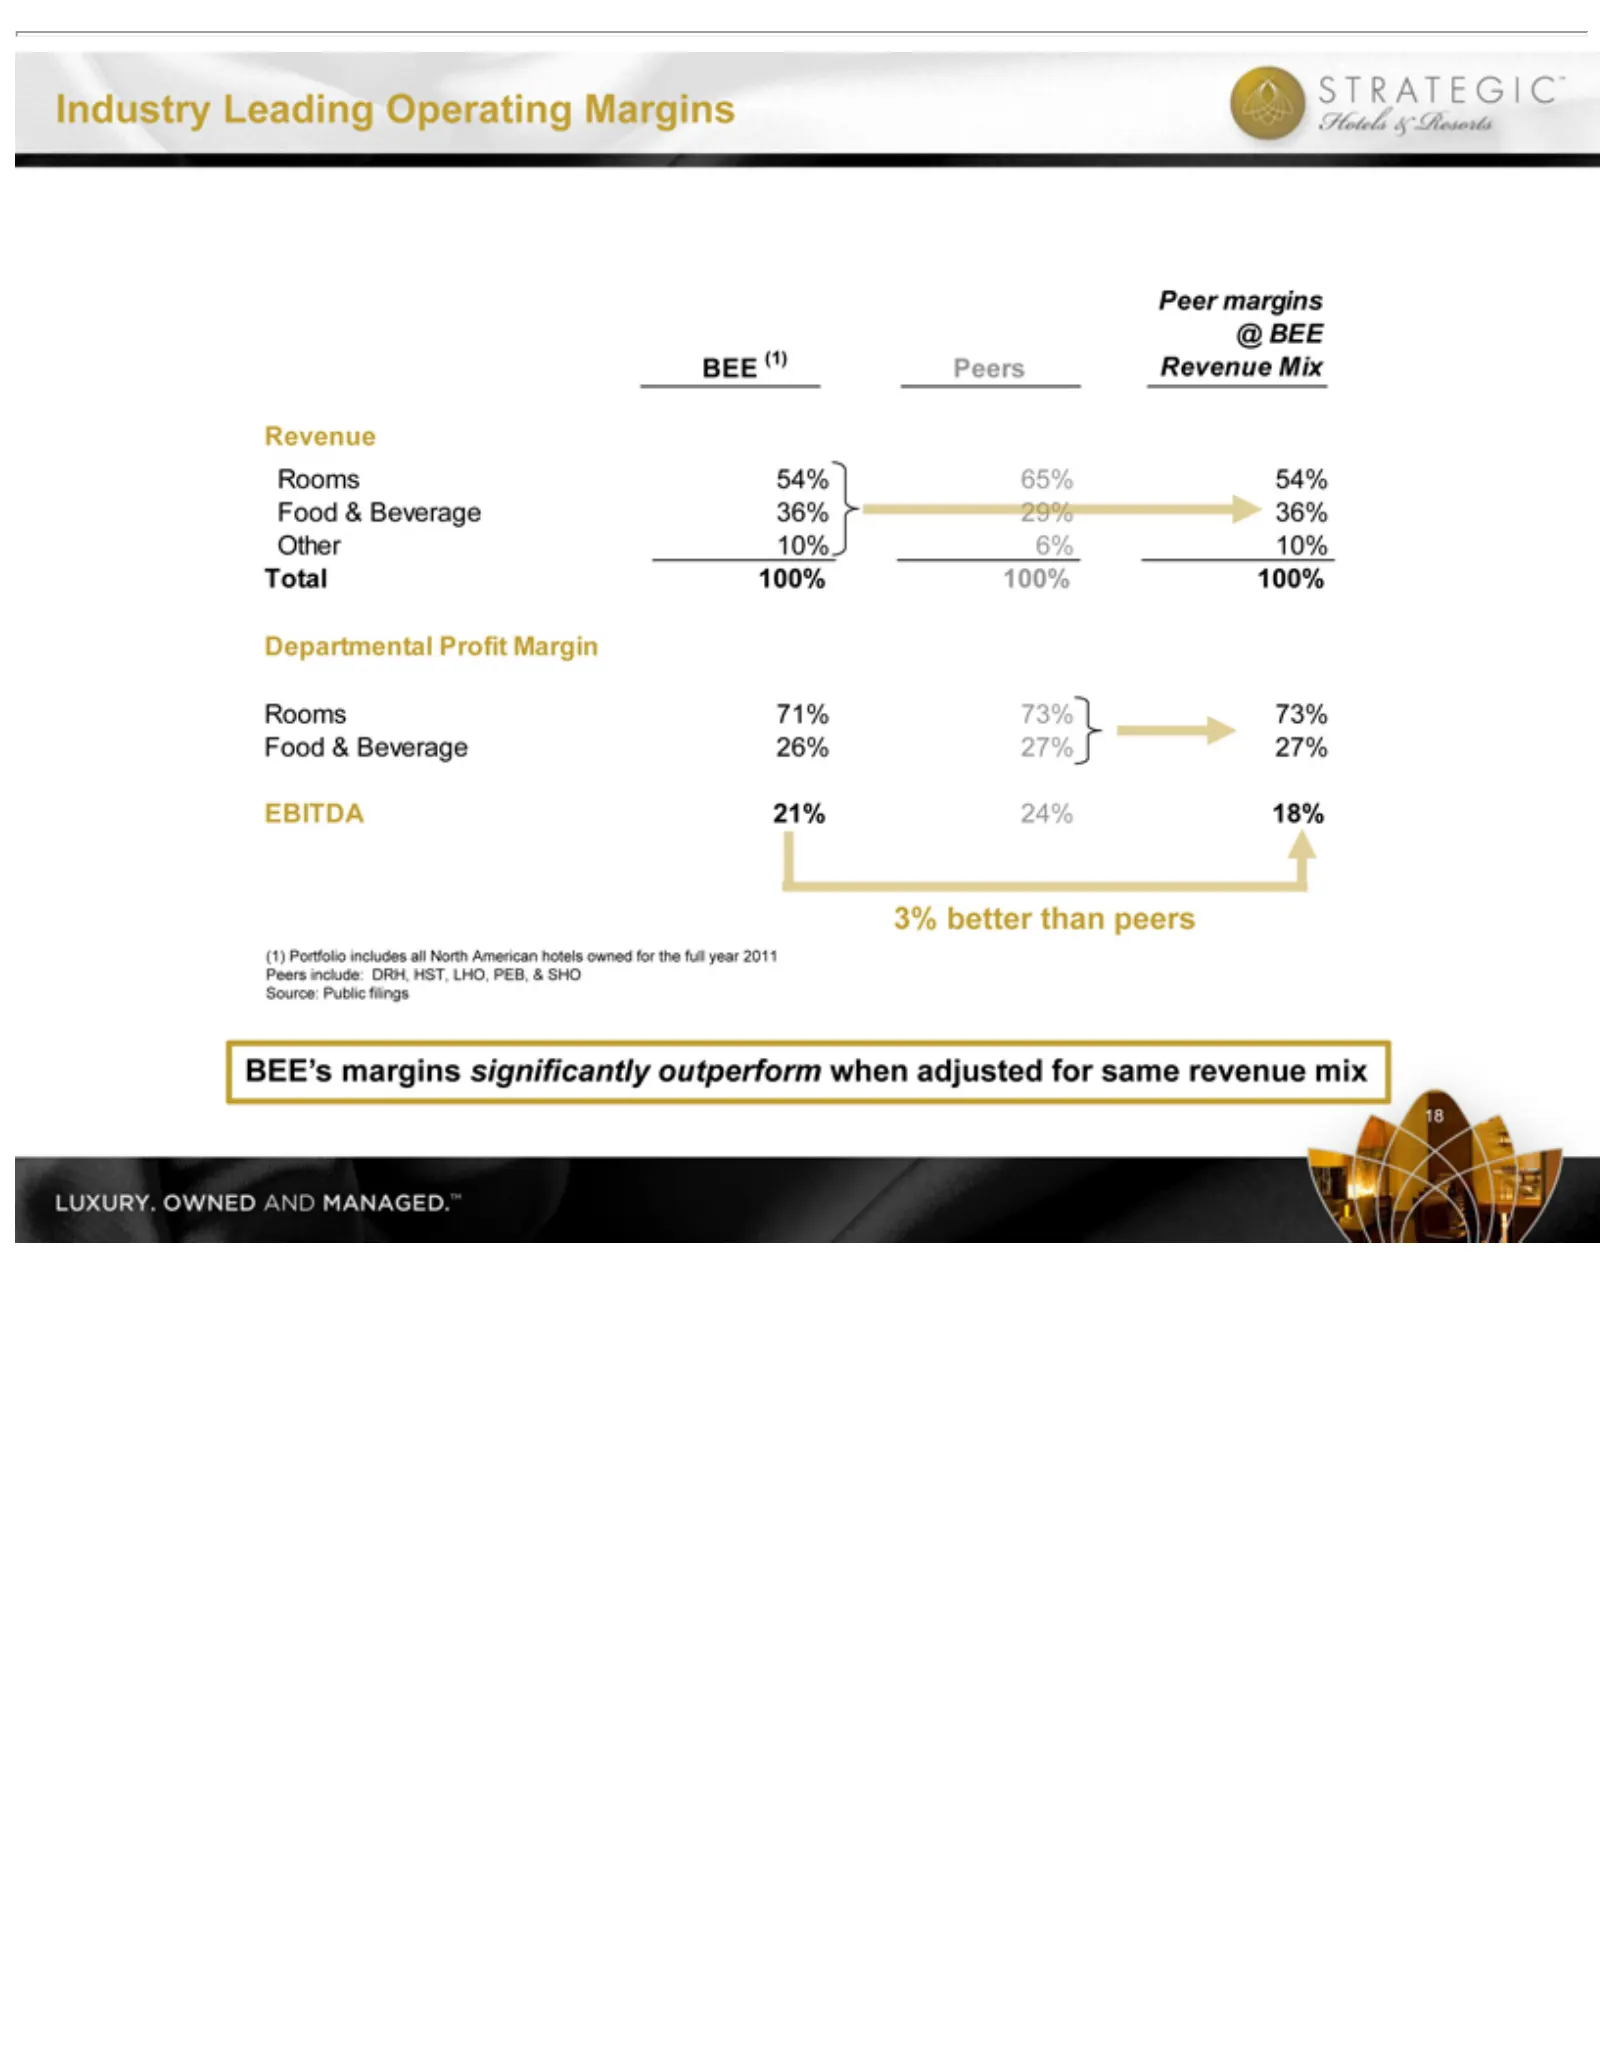
Slide 19: Industry Leading Operating Margins
BEEPortfolio MarginRooms71%73%73%Food (1) Peers Source: BEE’s Industry 18 (1)PeersPeer include: margins Public Leading includes DRH, filings significantly Operating margins HST, all North LHO, @ Margins outperform BEE American PEB, &Revenue Beverage26%27%27%EBITDA21%24%18%18 &when SHO hotels MixReve
Slide 20: Operating Trends
I.BEE’s Unique II.Company III.Industry IV.Operating V.Financial Operating Trends Overview Update Overview Trends Value Proposition
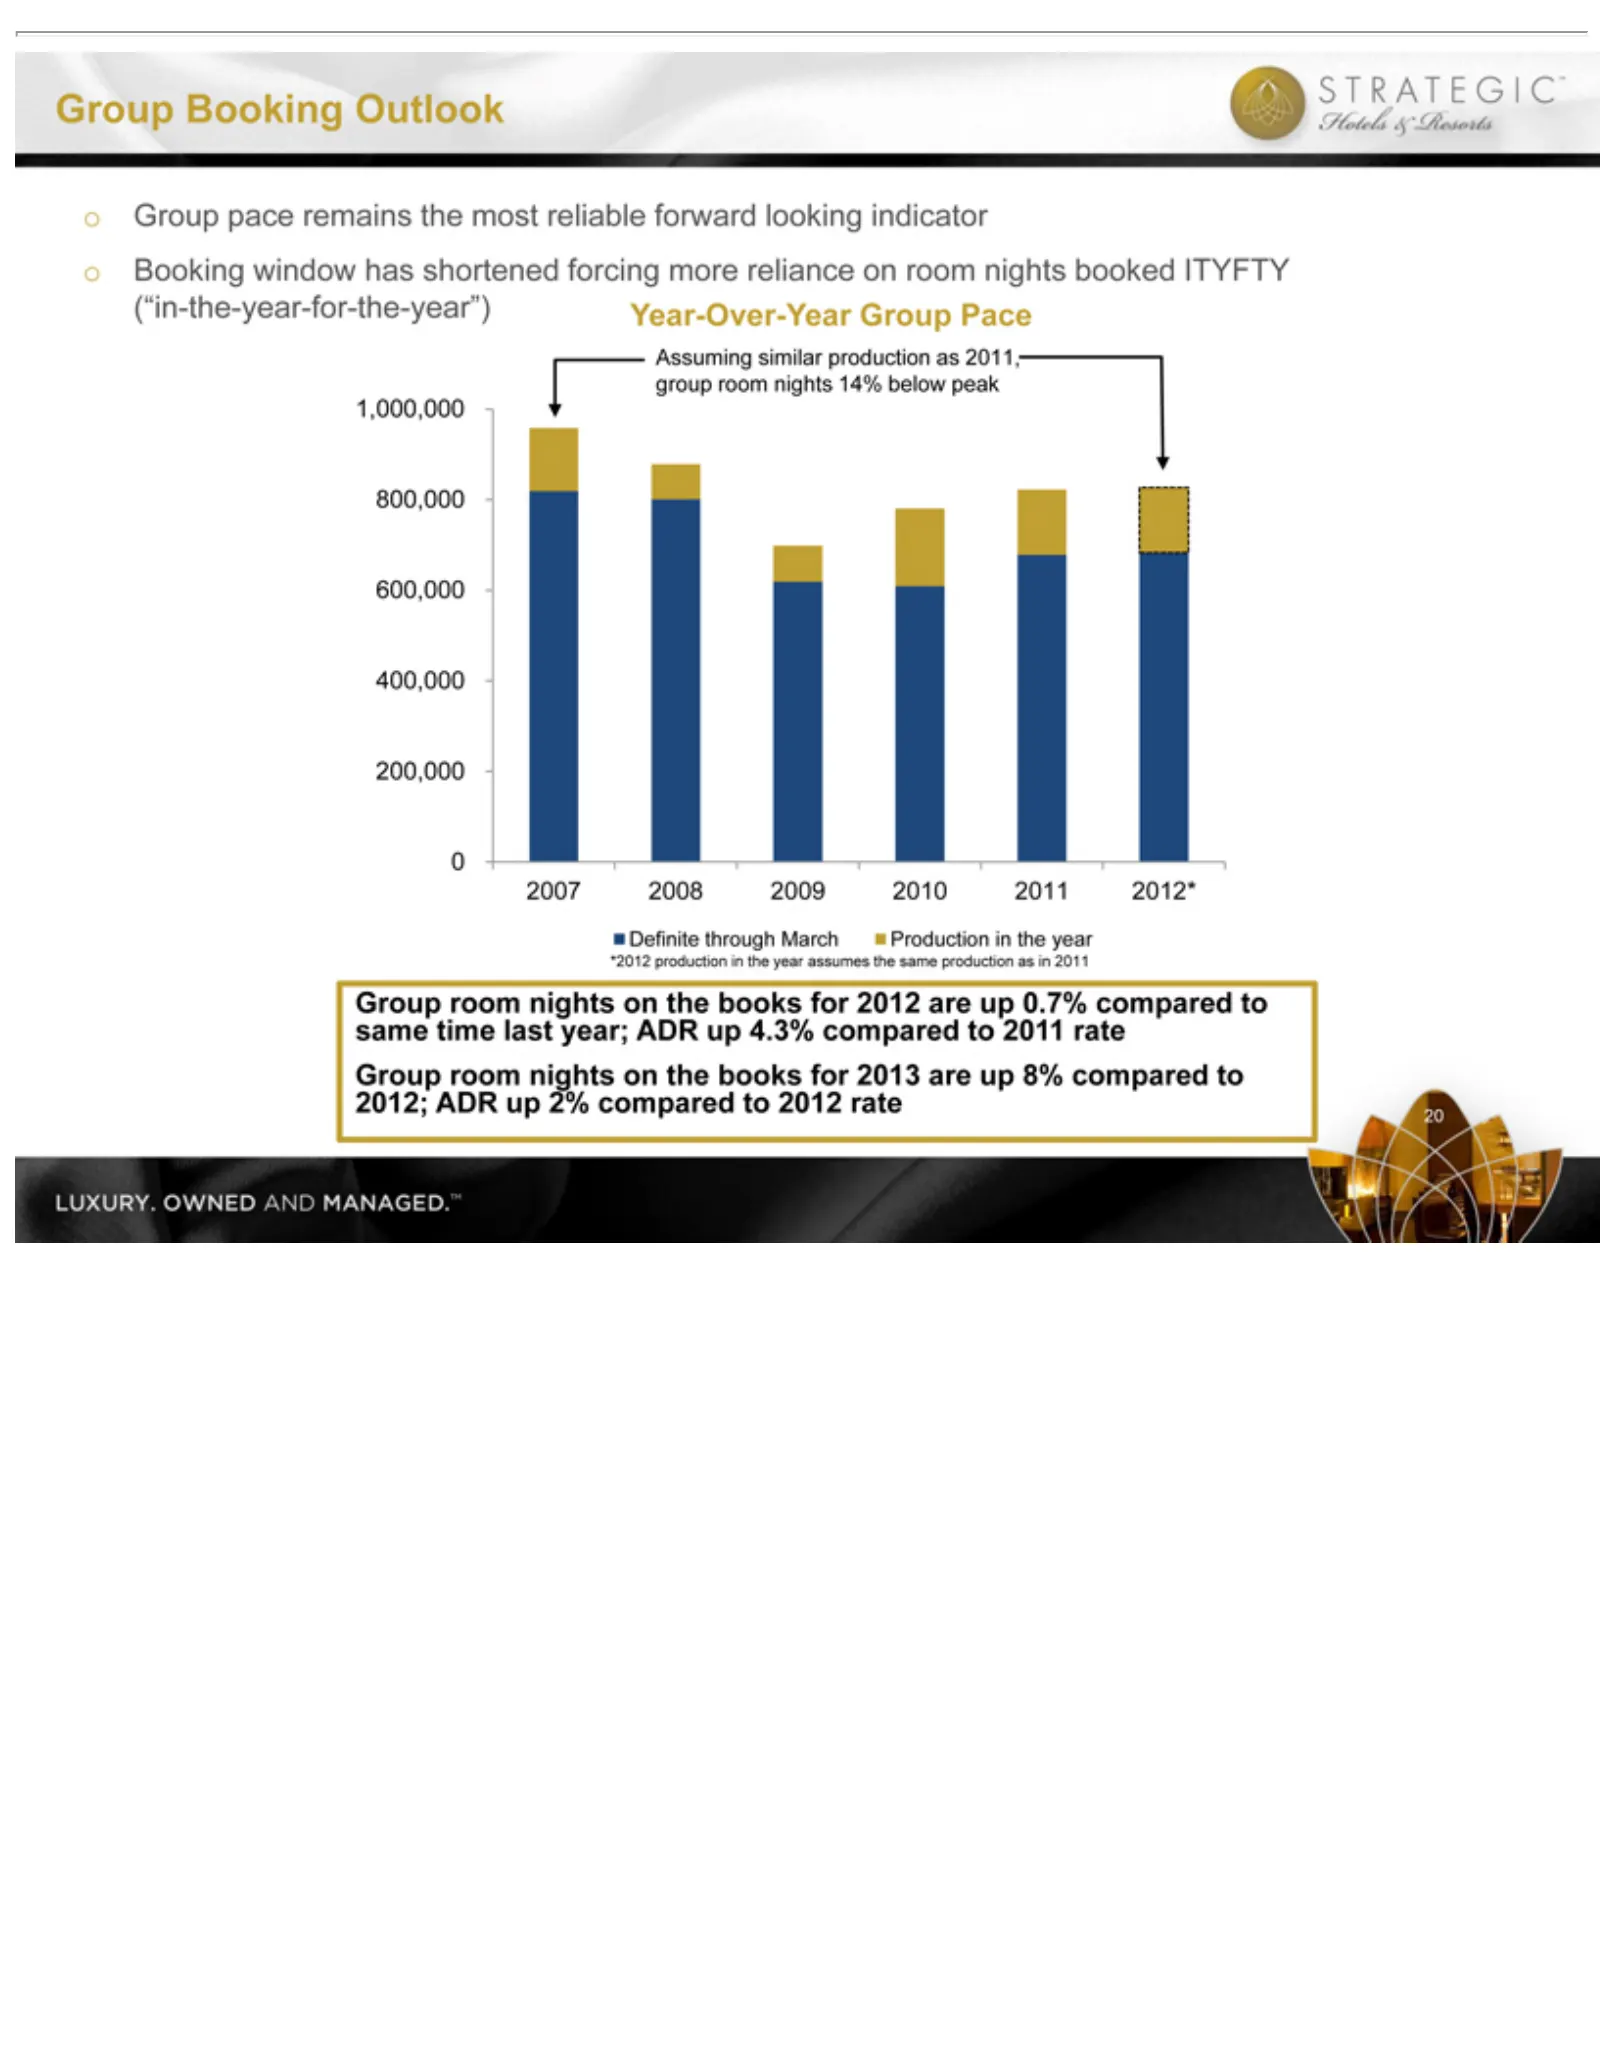
Slide 21: Group Booking Pace Outlook
0200,000400,000600,000800,0001,000,000200720082009201020112012*Definite oGroup oBooking Year-Over-Year Assuming Group 20 room Booking pace window similar nights remains Outlook Group production has onthe the shortened Pace most books asreliable 2011, for forcing 2012 2013 group forward more areroom
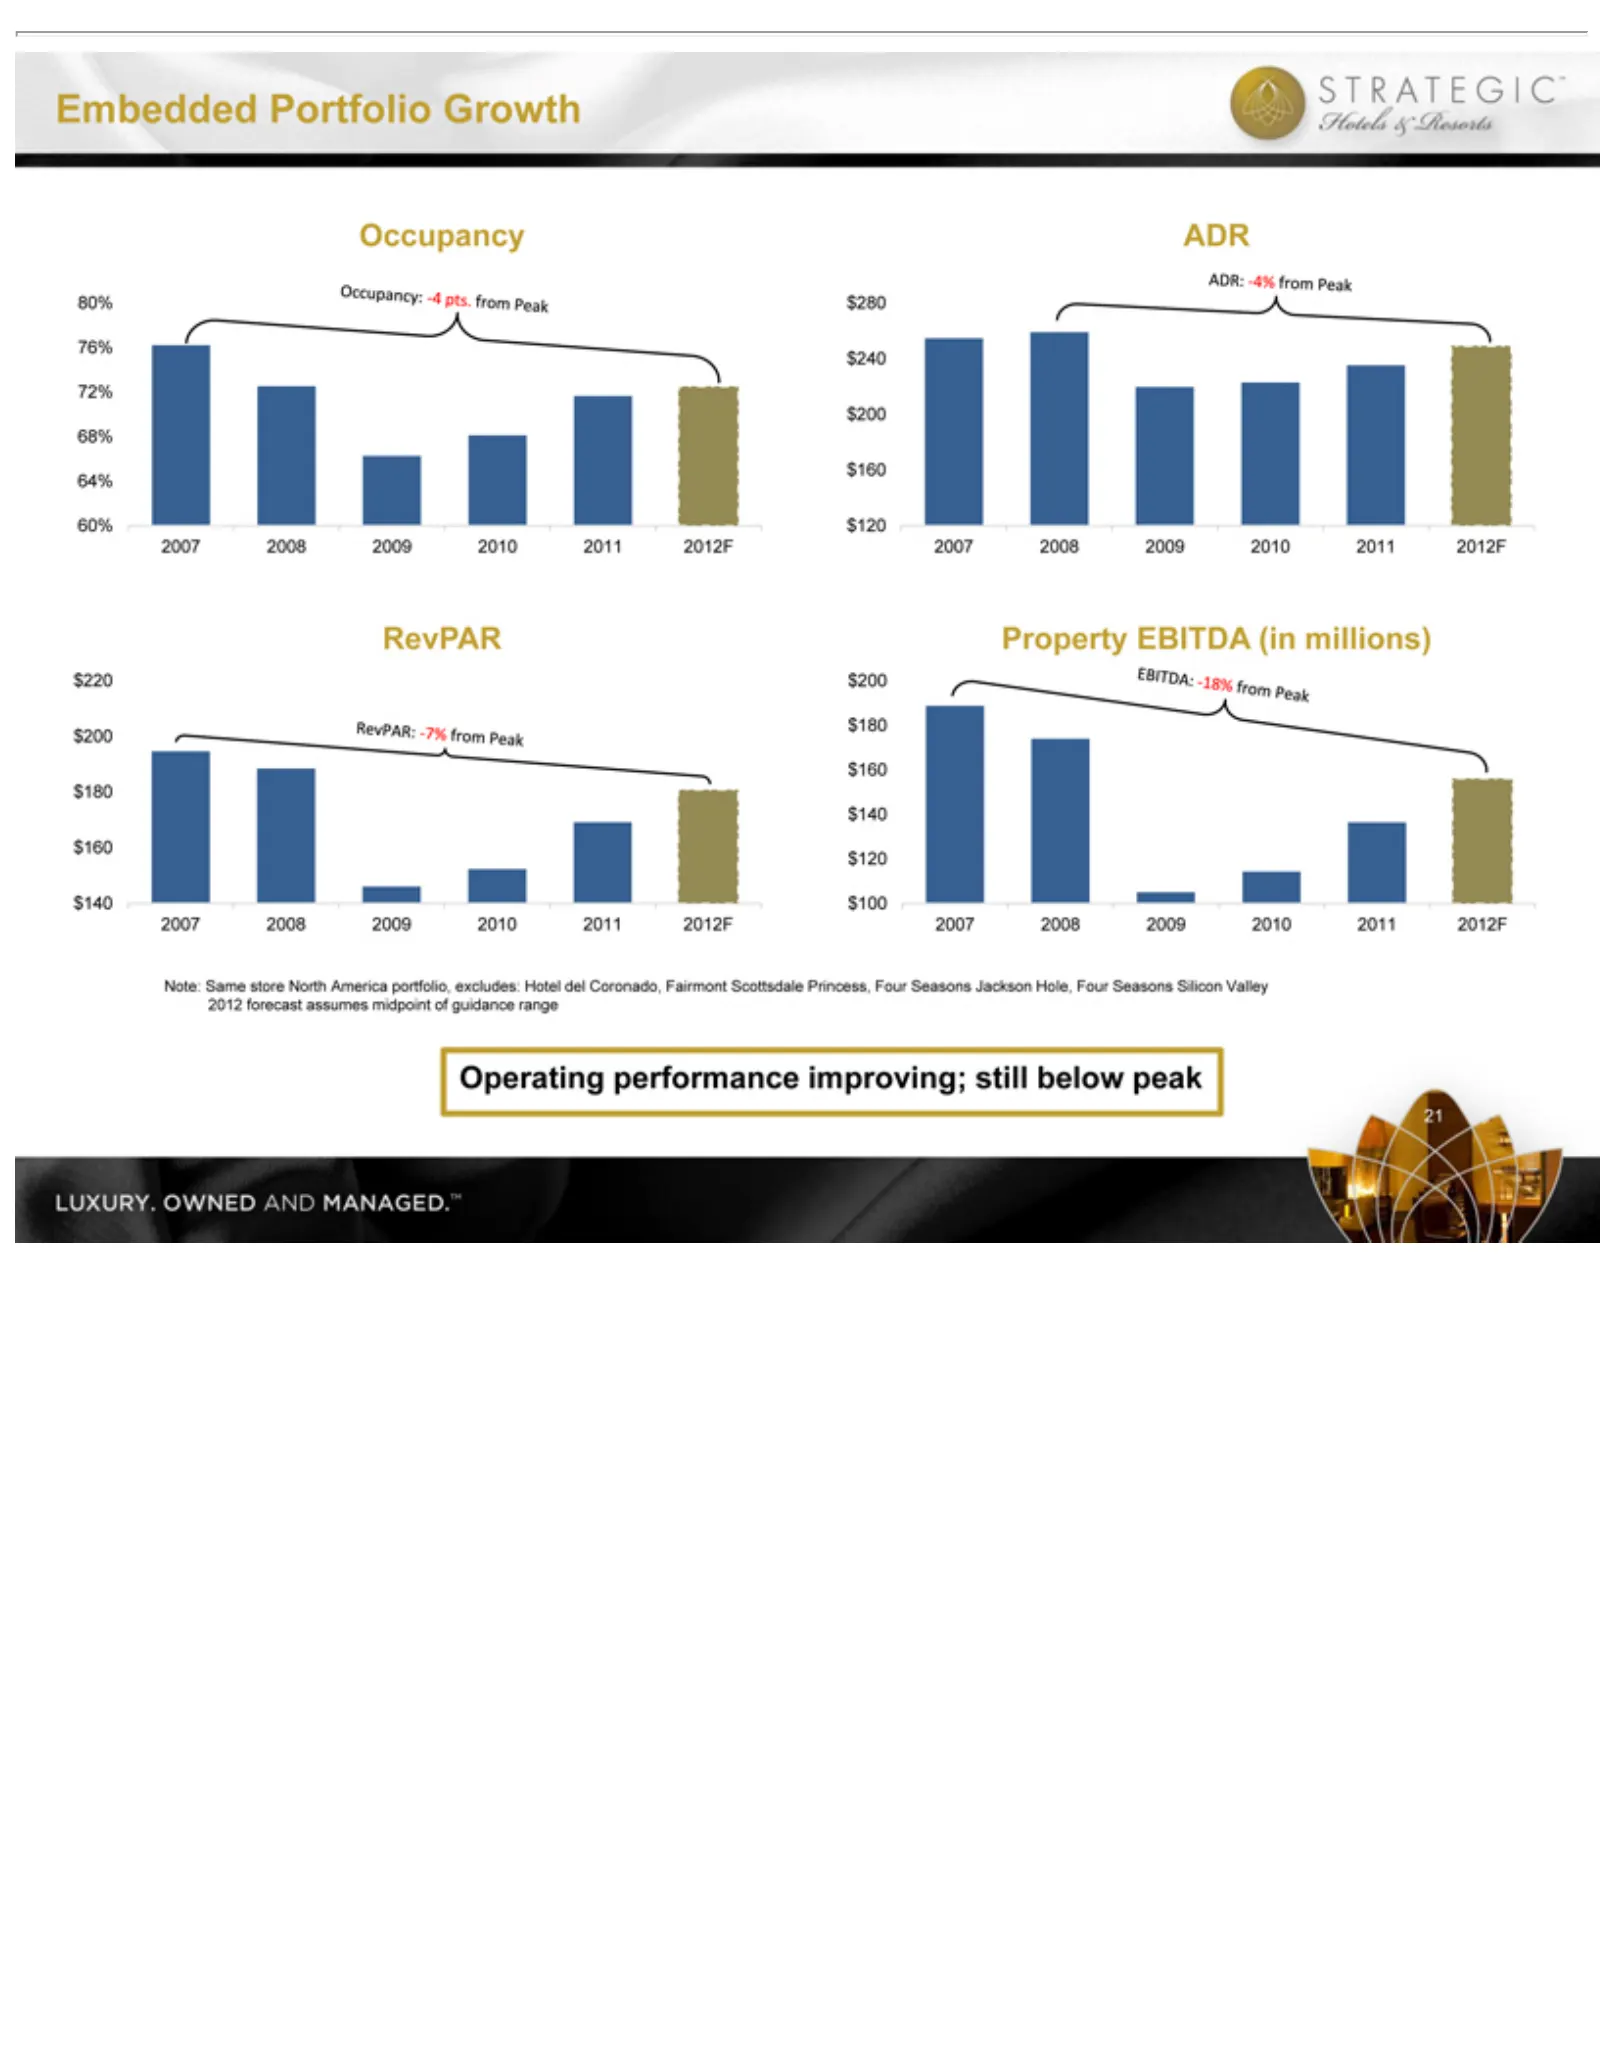
Slide 22: Embedded Growth: Property Performance Improving
FOcc $120$160$200$240$280200720082009201020112012F60%64%68%72%76%80%200720082009201020112012 Re Note: guidance Operating Embedded 21 $100$120$140$160$180$200200720082009201020112012F$140$160$180$200$220200720082009201020112012F vPAR uSame panc range Property performance Portfolio store y ADNorth EBI
Slide 23: Financial Overview
I.BEE’s Unique II.Company III.Industry IV.Operating V.Financial Financial Overview Overview Update Overview Trends Value Proposition
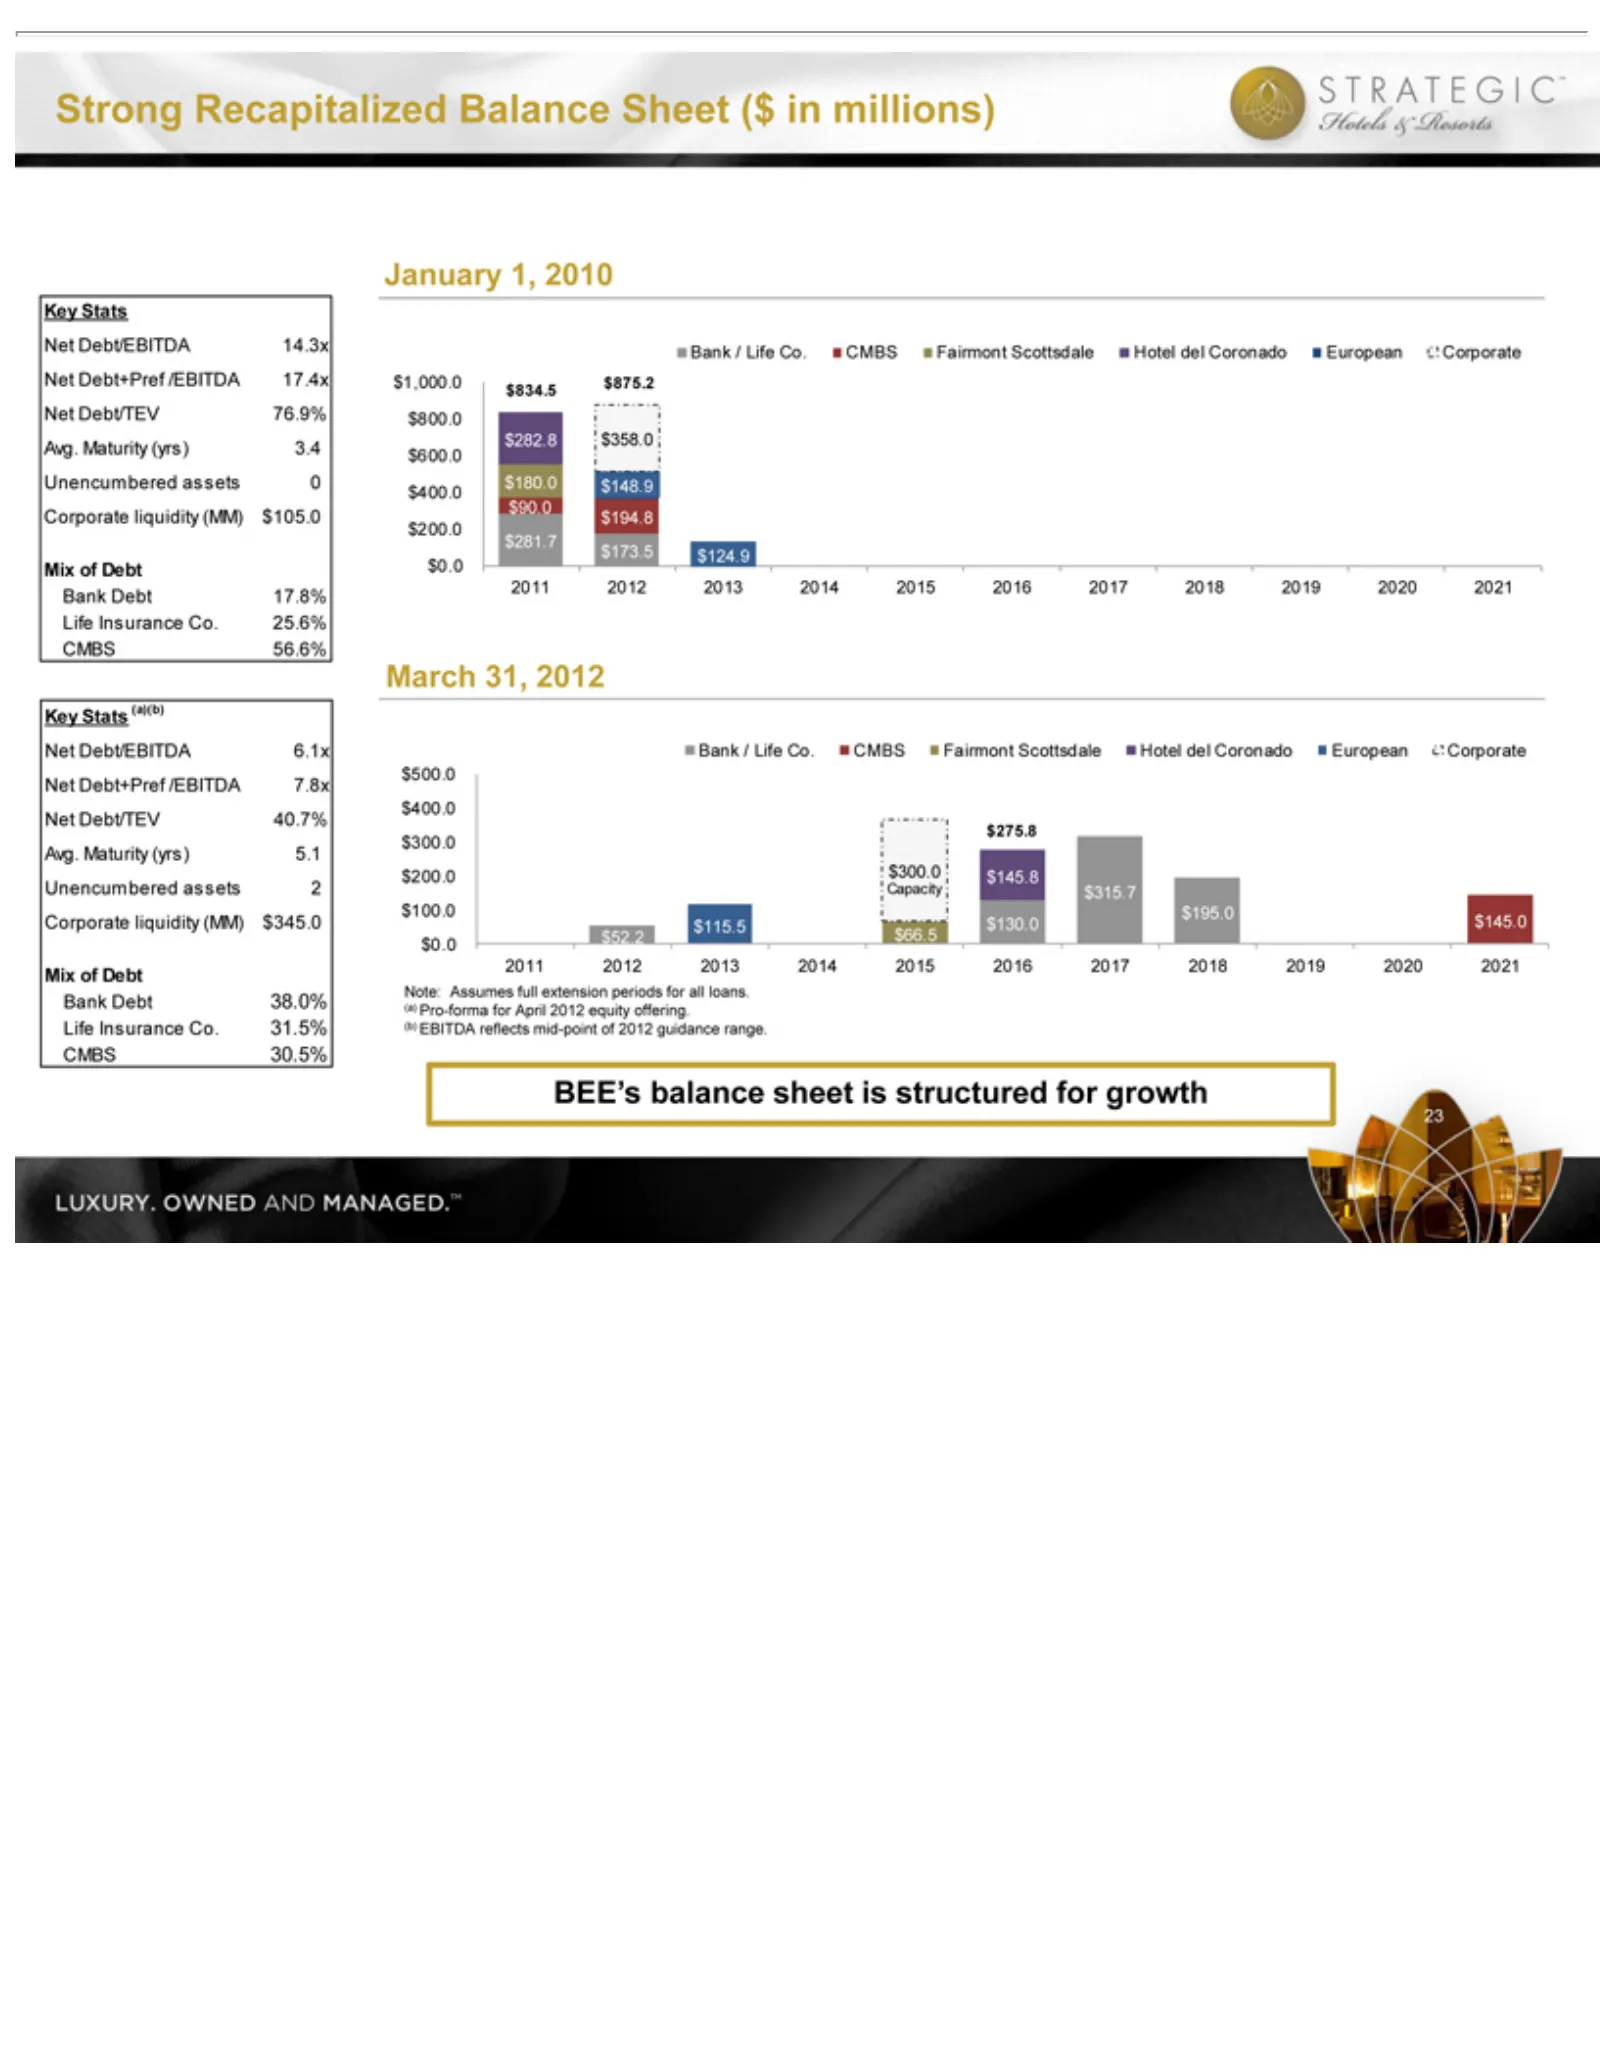
Slide 24: Strong Balance Sheet and Liquidity
January March BEE’s 23 liquidity $0.0$100.0$200.0$300.0$400.0$500.020112012201320142015201620172018201920202021Bank CoronadoEuropeanCorporate$300.0Capacity$275.8$281.7 $0.0$200.0$400.0$600.0$800.0$1,000.020112012201320142015201620172018201920202021Bank Note: (a) (b) Strong Pro-forma EBITDA Assumes b
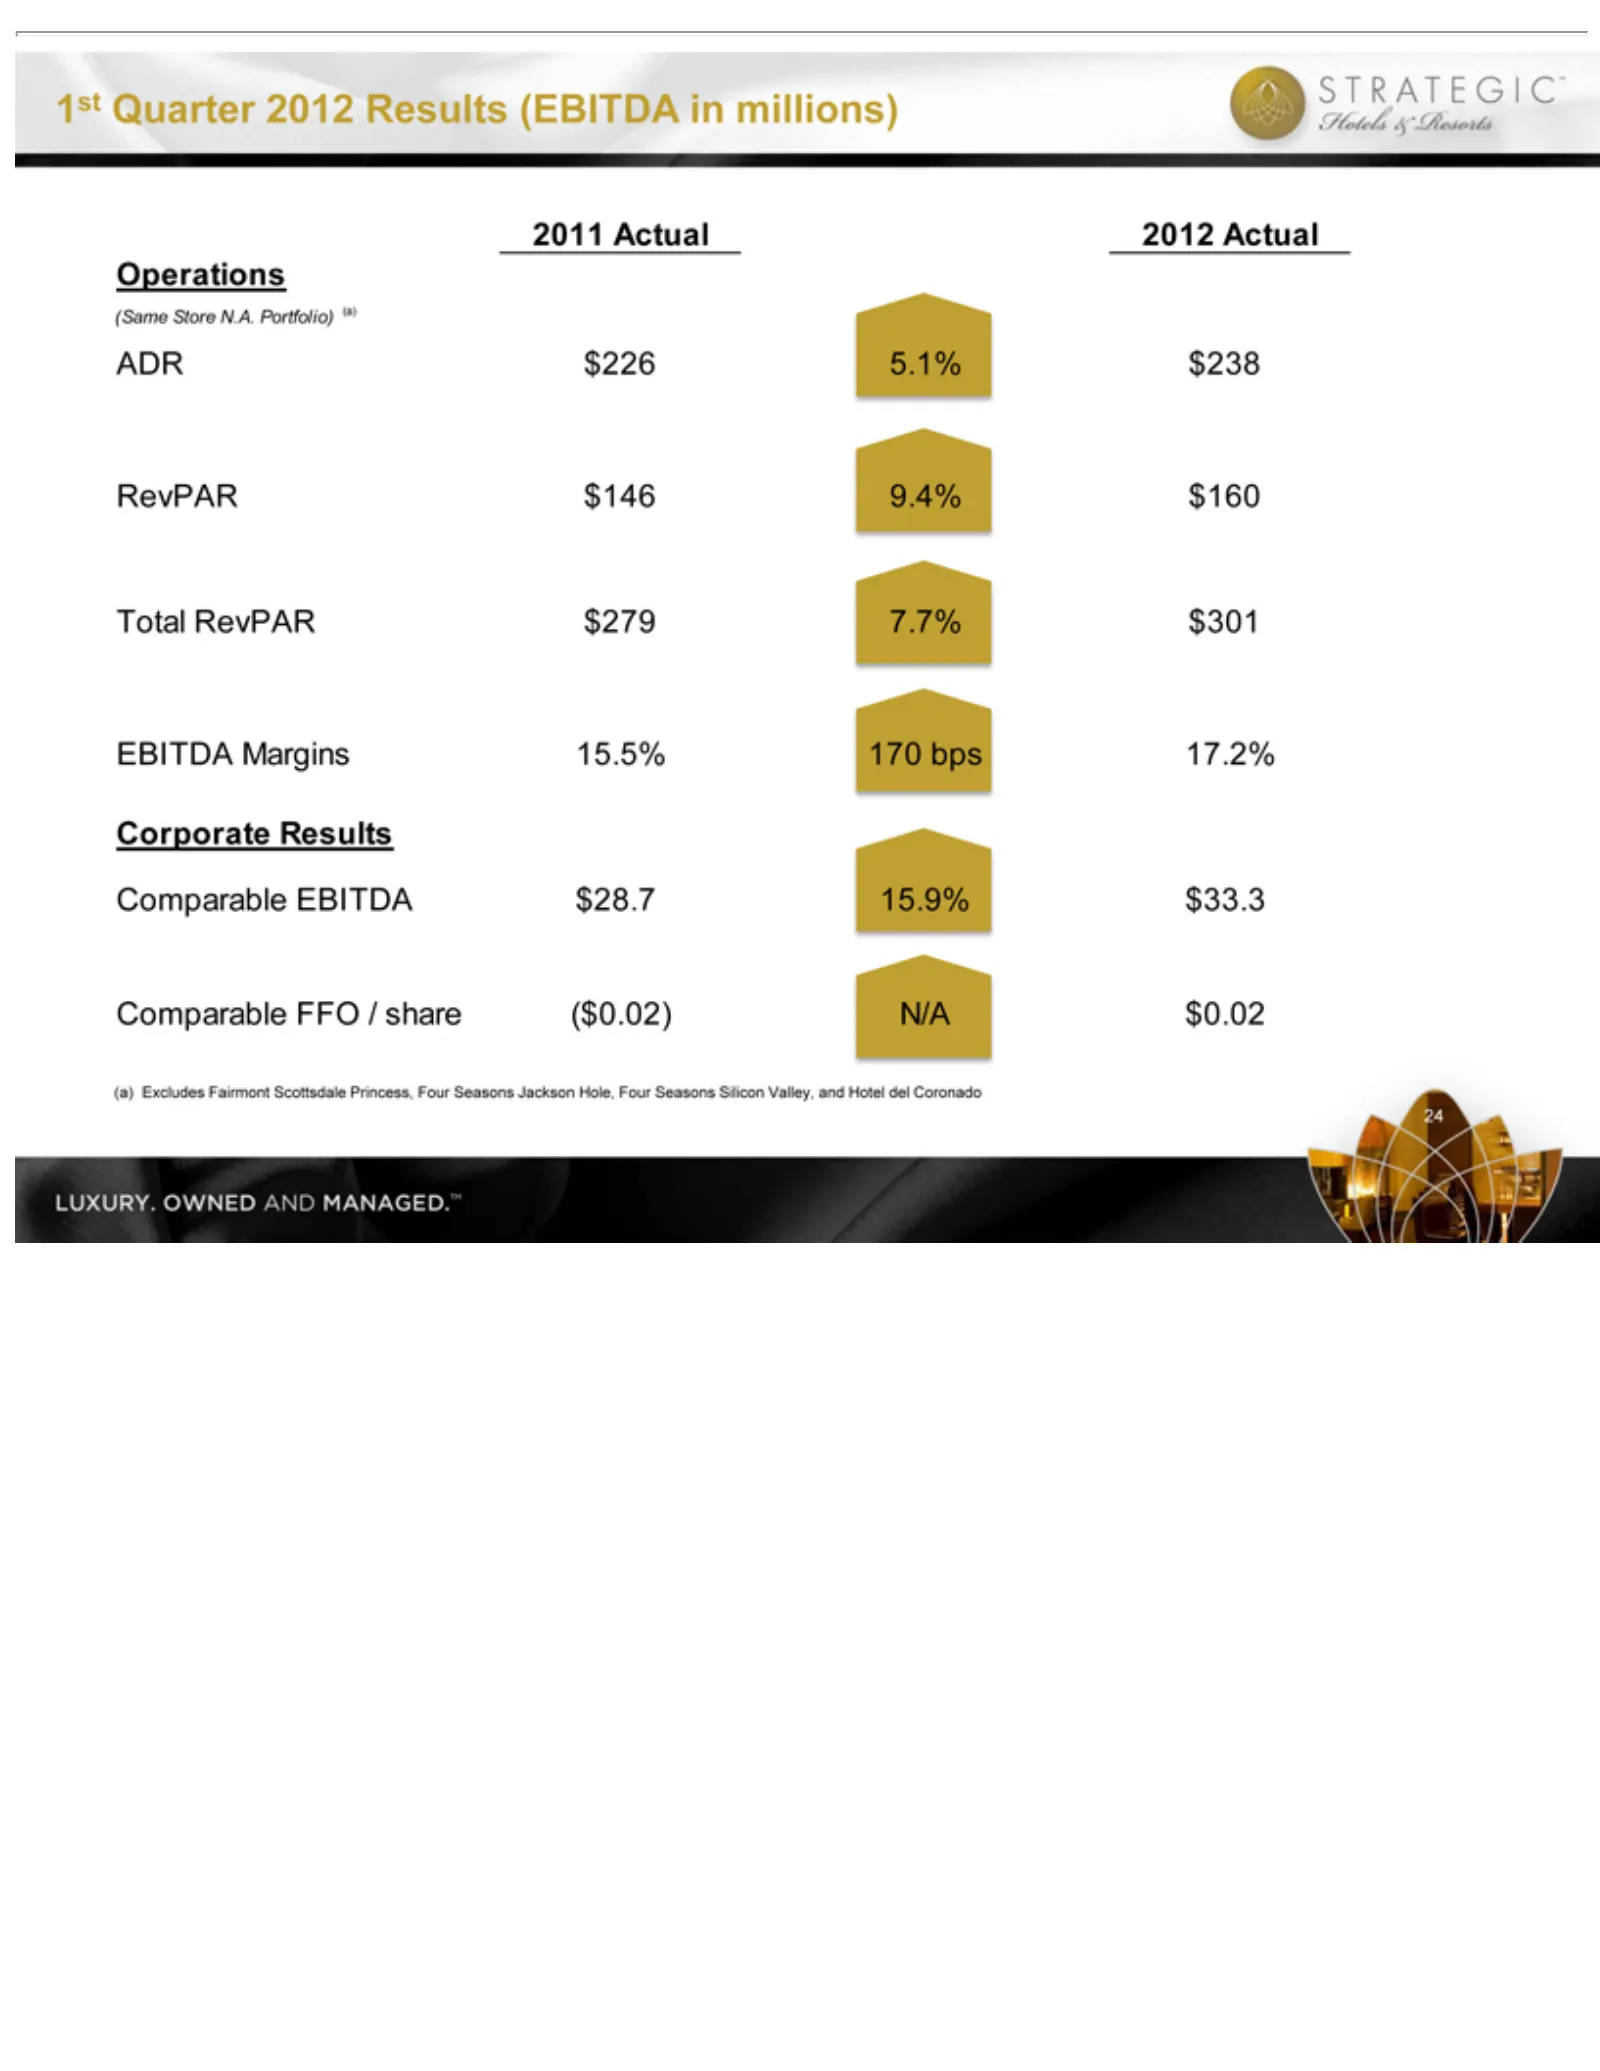
Slide 25: First Quarter 2012 Results
(a) Excludes 1st Margins15.5%170 Quarter 2012 Fairmont Results bps17.2%Corporate Scottsdale (EBITDA Princess, in millions) Results FourComparable 2011 Seasons Actual2012 Jackson EBITDA$28.715.9%$33.3Comparable ActualOperations(Same Hole, Four Seasons Silicon Store Valley, N.A.FFO and Portfolio) /Hot
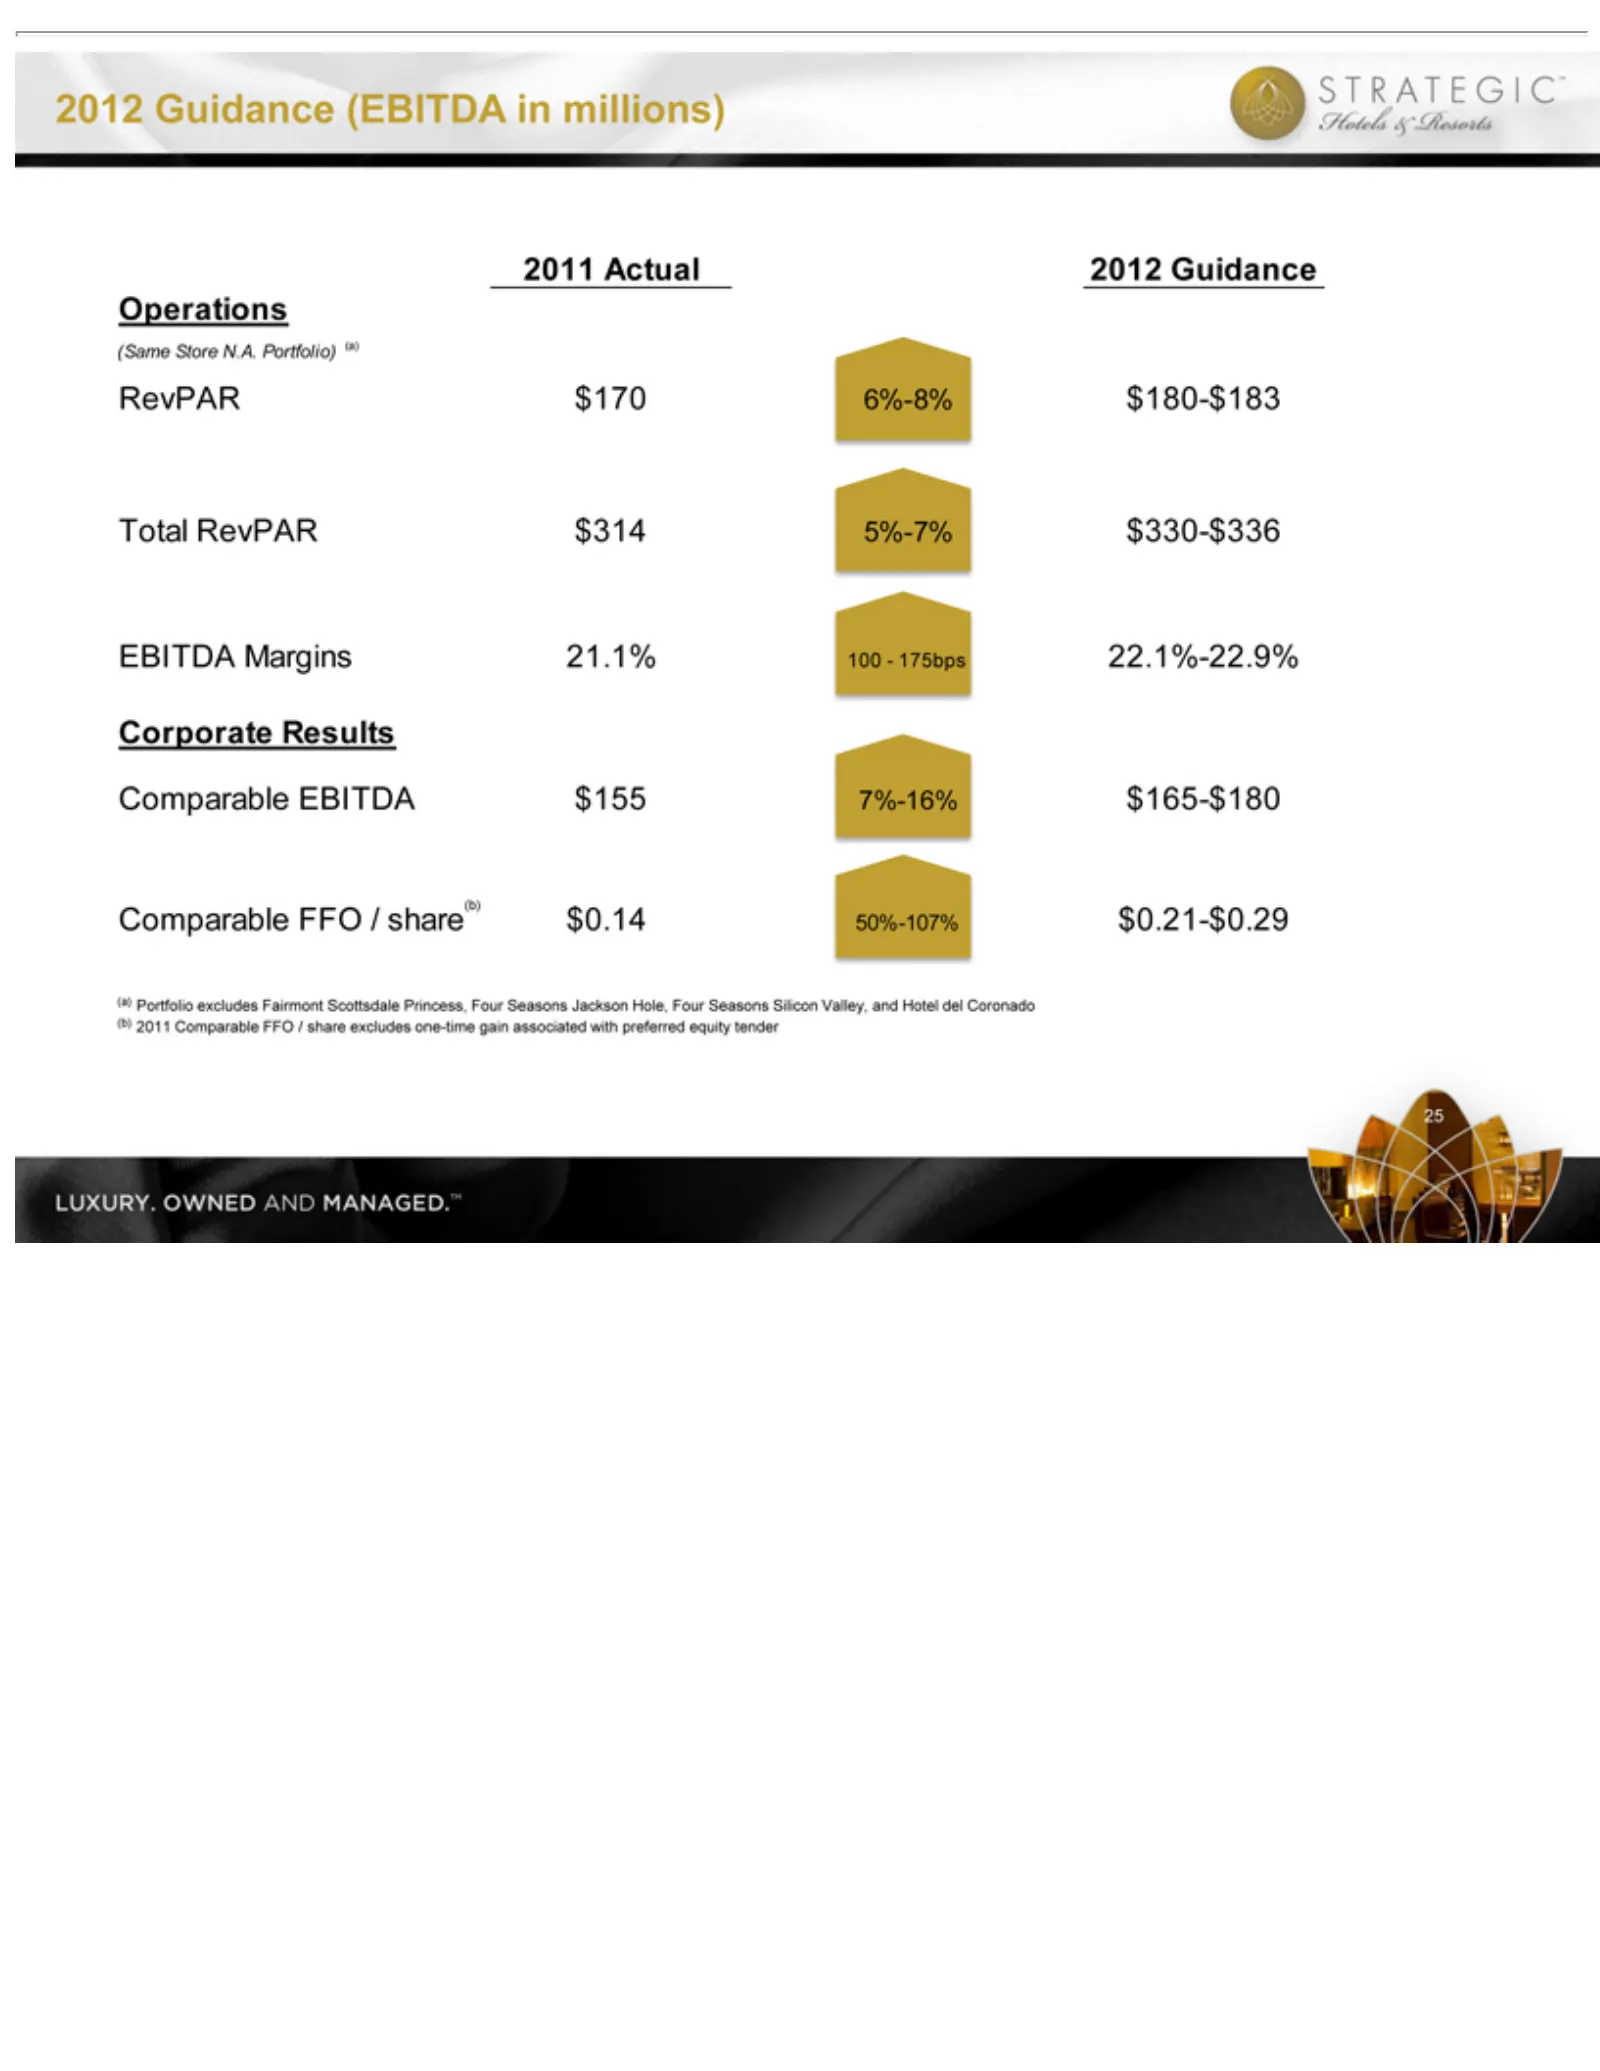
Slide 26: 2012 Guidance
(a) Portfolio (b) 2012 25 Margins21.1%100—175bps22.1%-22.9%Corporate 2011 Guidance Comparable excludes (EBITDA FFO Fairmont in/ share millions) Scottsdale excludes 2011Princess, one-time Actual2012 Four ResultsComparable gain GuidanceOperations(Same Seasons associated Jackson withEBITDA$1557%-16%$16
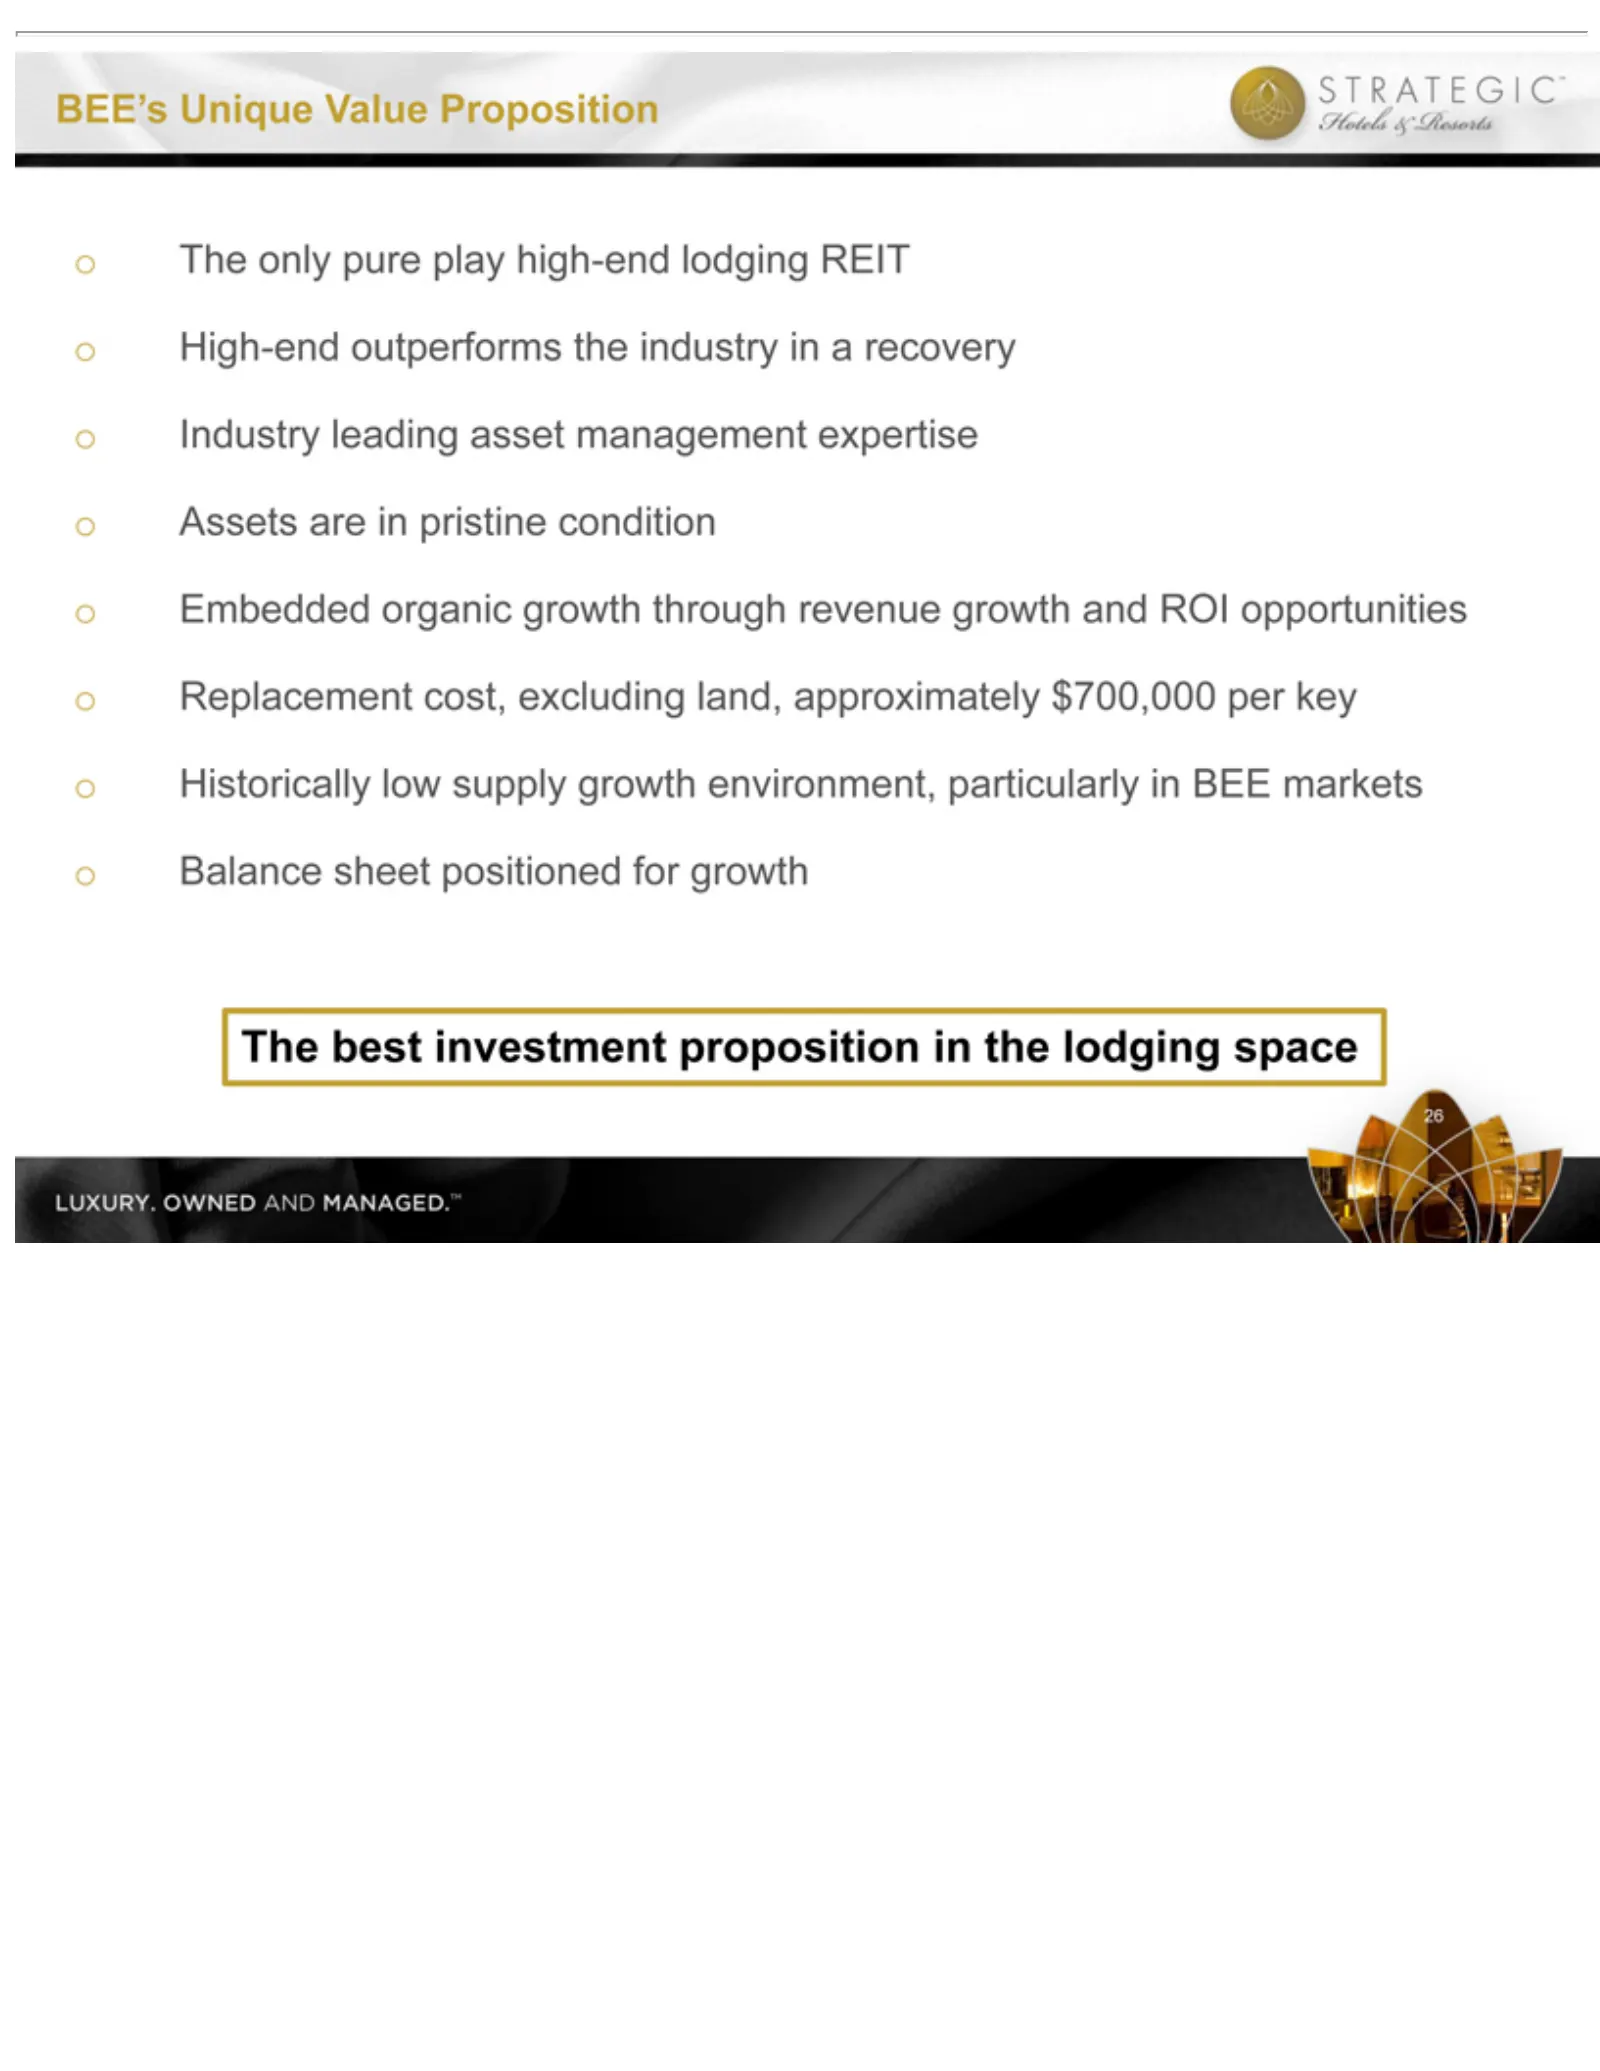
Slide 27: Unique Value Proposition
oThebest oHigh-end oIndustry oAssets oEmbedded oReplacement oHistorically oBalance The BEE’s 26 only Unique are investment sheet leading pure outperforms in organic low pristine cost, Value positioned play supply asset excluding growth proposition high-end Proposition condition management the growth

Slide 28: Disclaimer
Except beliefs, their phrases, Company’s Factors in covenants hotels availability future difficulties risks delays the legislative Additional settlements. recent assurance forward-looking 27 which Disclaimer June Company’s use related terrorist operate Form and for projections, that including 29, of
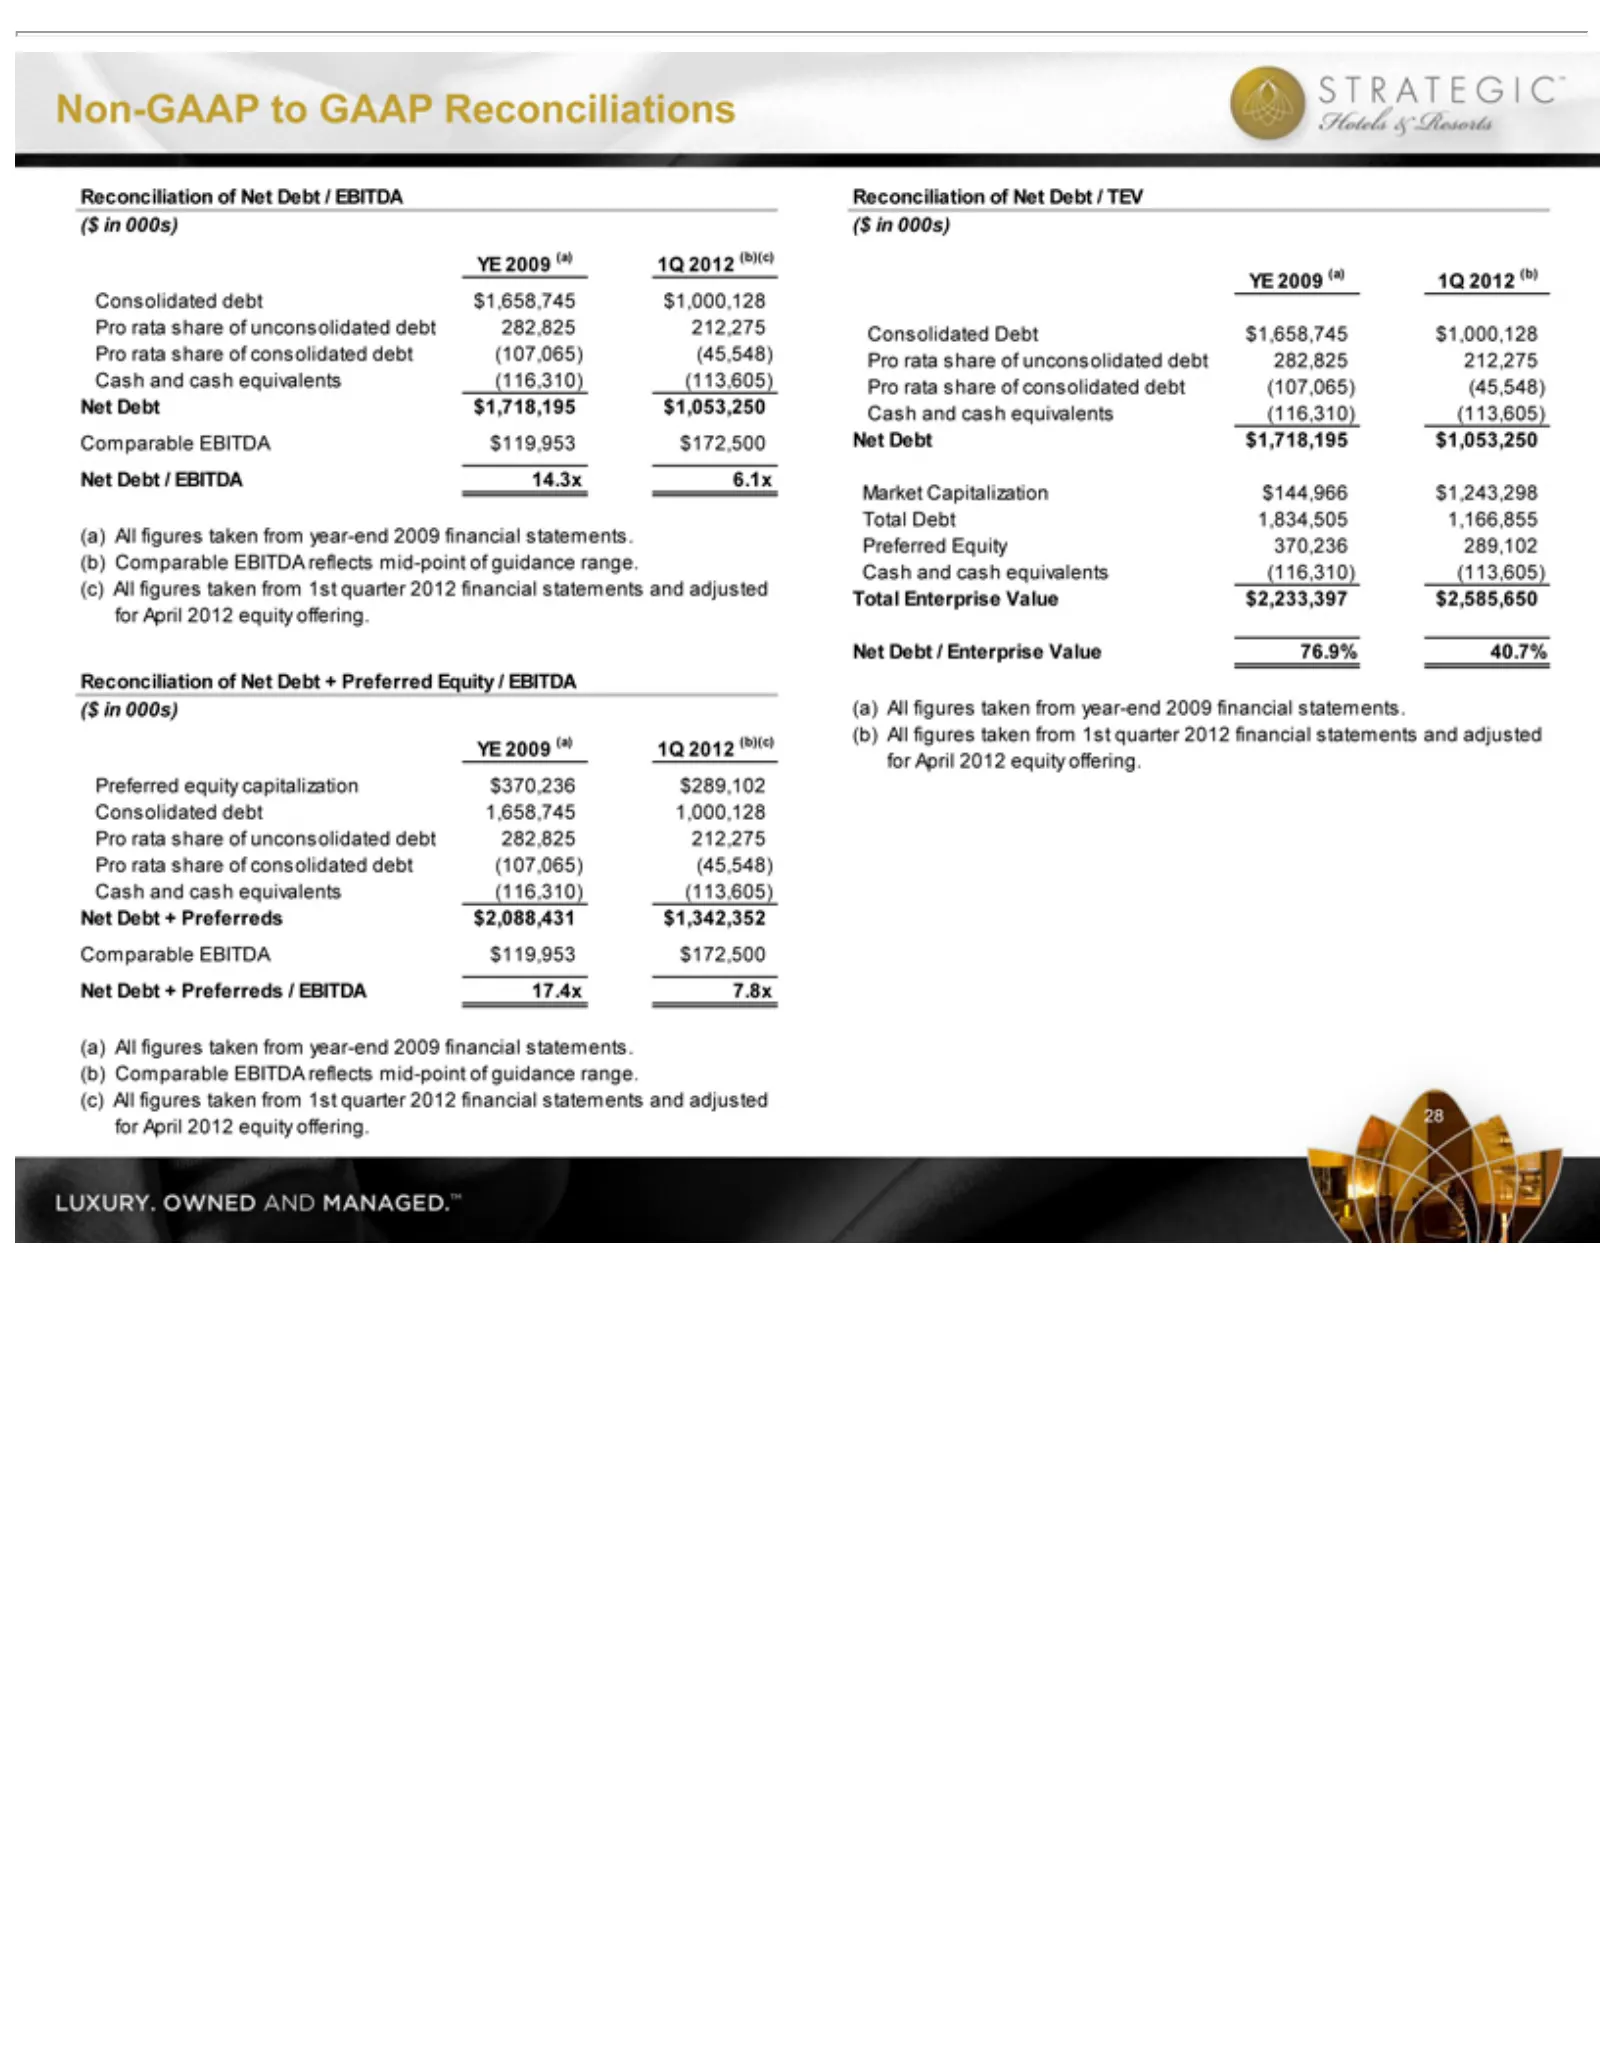
Slide 29: Non-GAAP Financial Reconciliations
Non-GAAP 28 debt282,825212,275Pro Debt financial /Capitalization$144,966$1,243,298 Reconciliation unconsolidated EBITDA$119,953$172,500Net All Enterprise figures / EBITDA14.3x6.1x(a) statements taken Value to GAAP of debt282,825212,275Pro from Net 76.9%40.7%(a) and Debt Reconciliations 1strata adjus
Slide 30: Non-GAAP Reconciliations
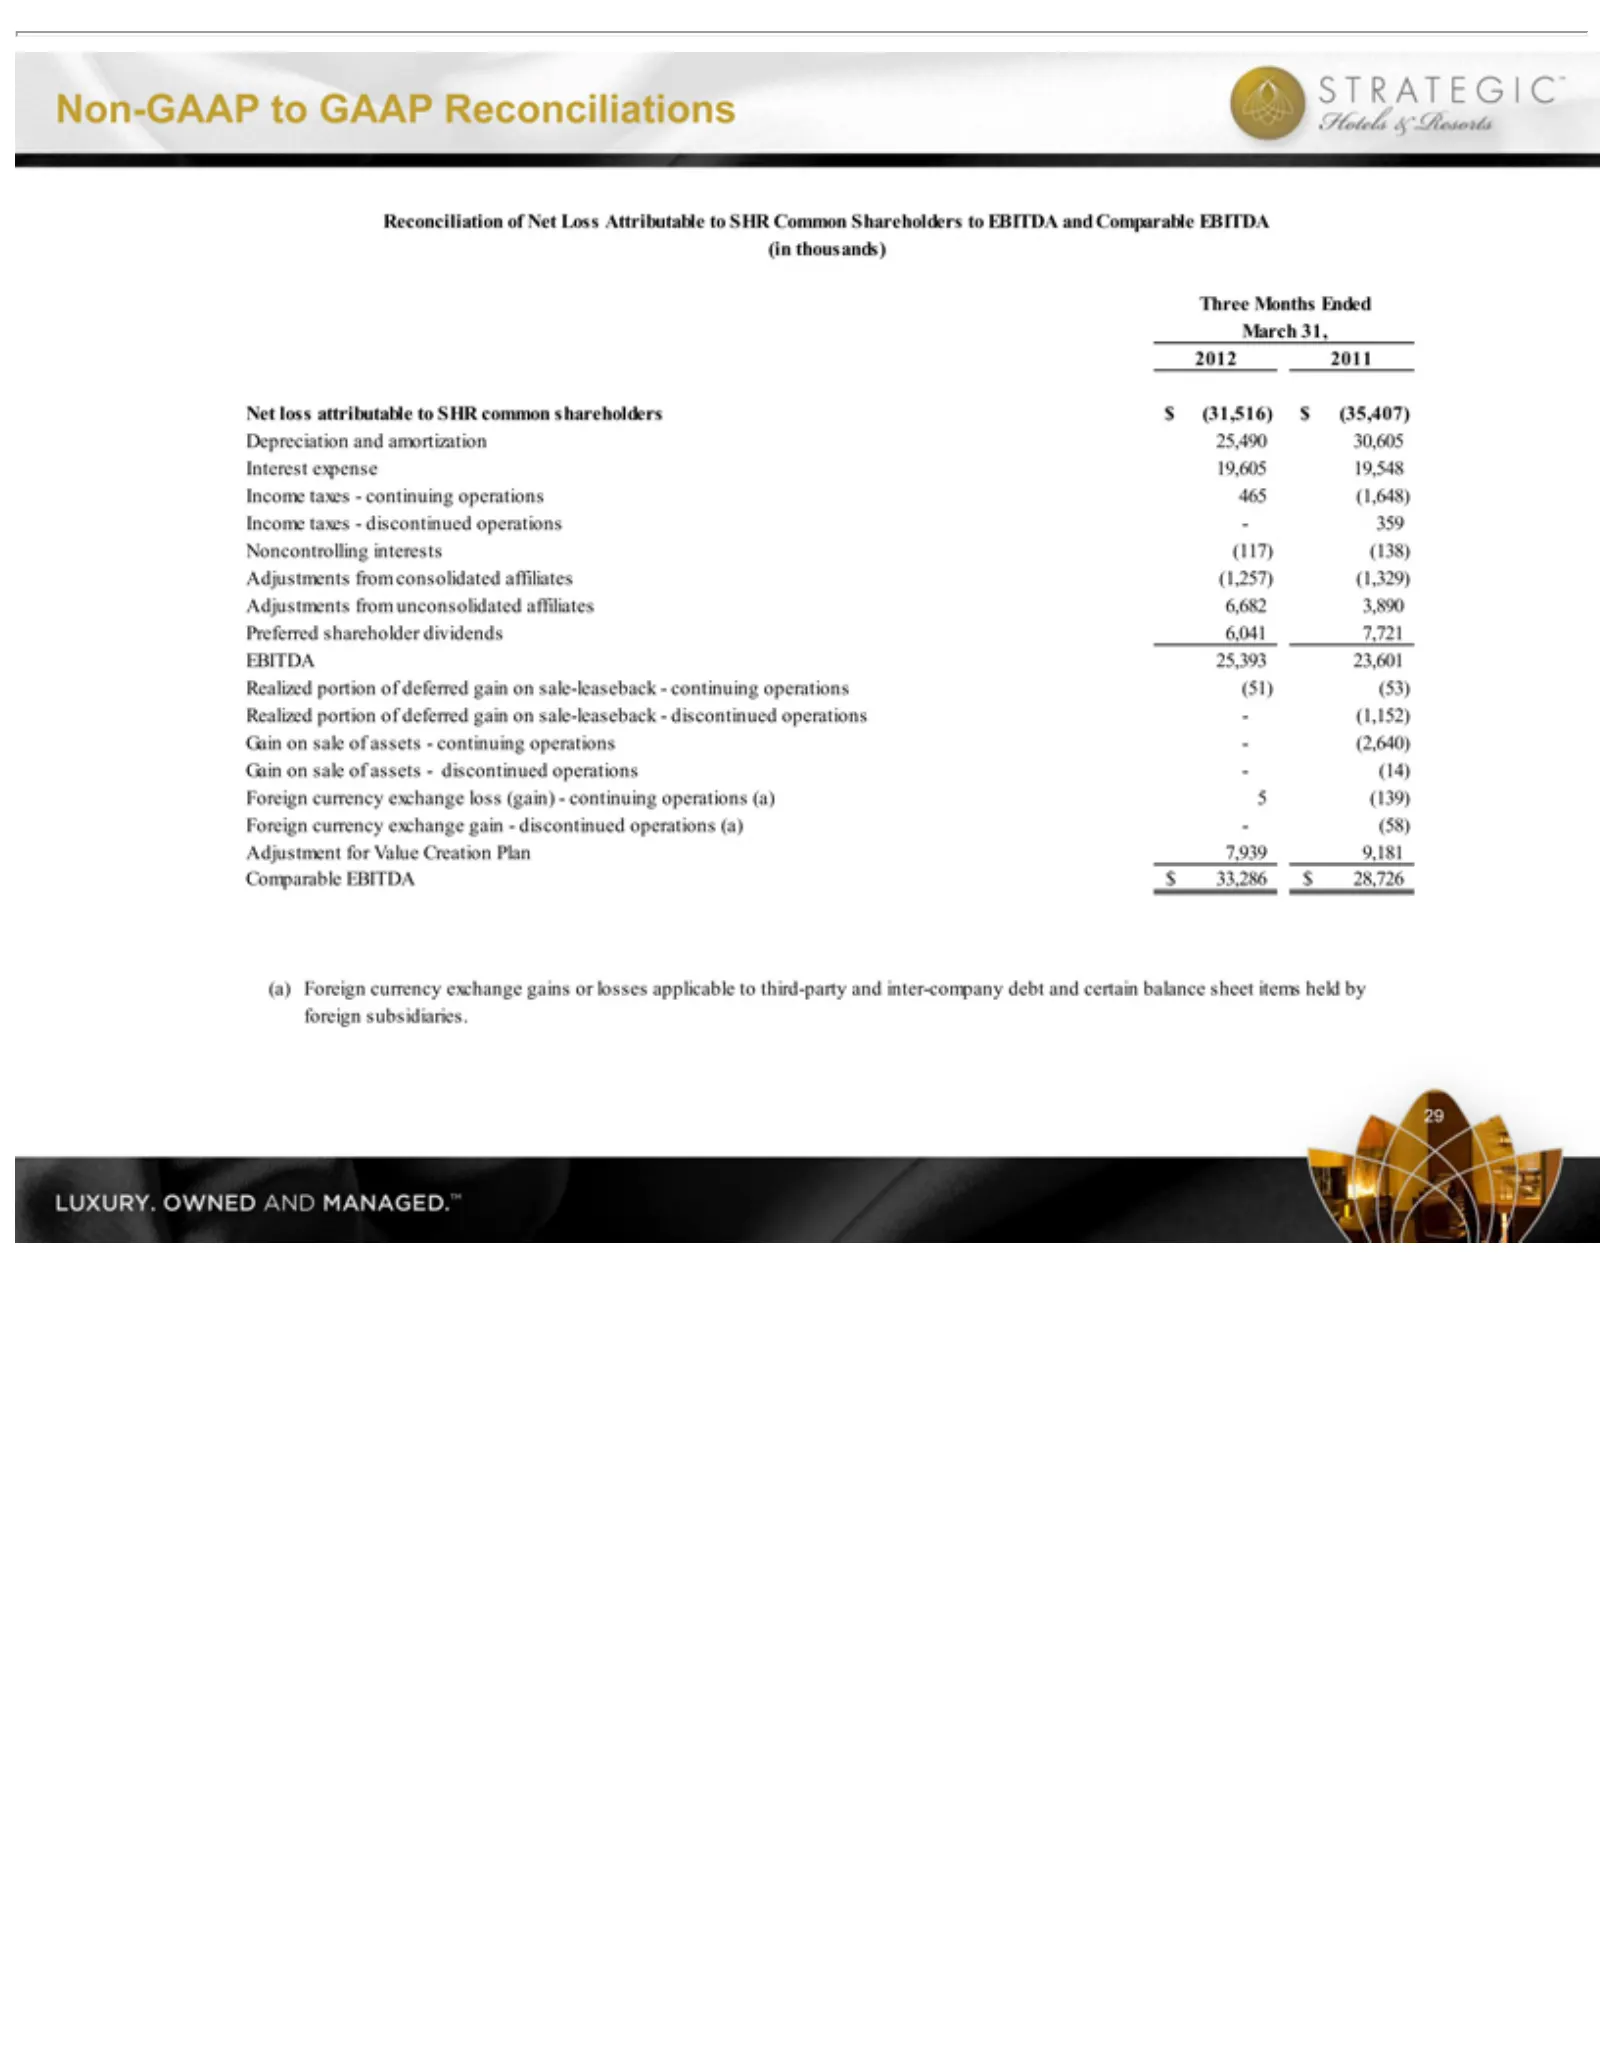
Non-GAAP 29 Income (1,257) continuing discontinued Creation foreign subsidiaries.March (1,329) taxes—continuing Plan7,939 operations(51) tooperations- GAAP Adjustments 9,181 Reconciliations (14) Comparable (53) operations465 31,Reconciliation from Foreign Realized unconsolidated currency 20122011Net
Slide 31: Non-GAAP Reconciliations
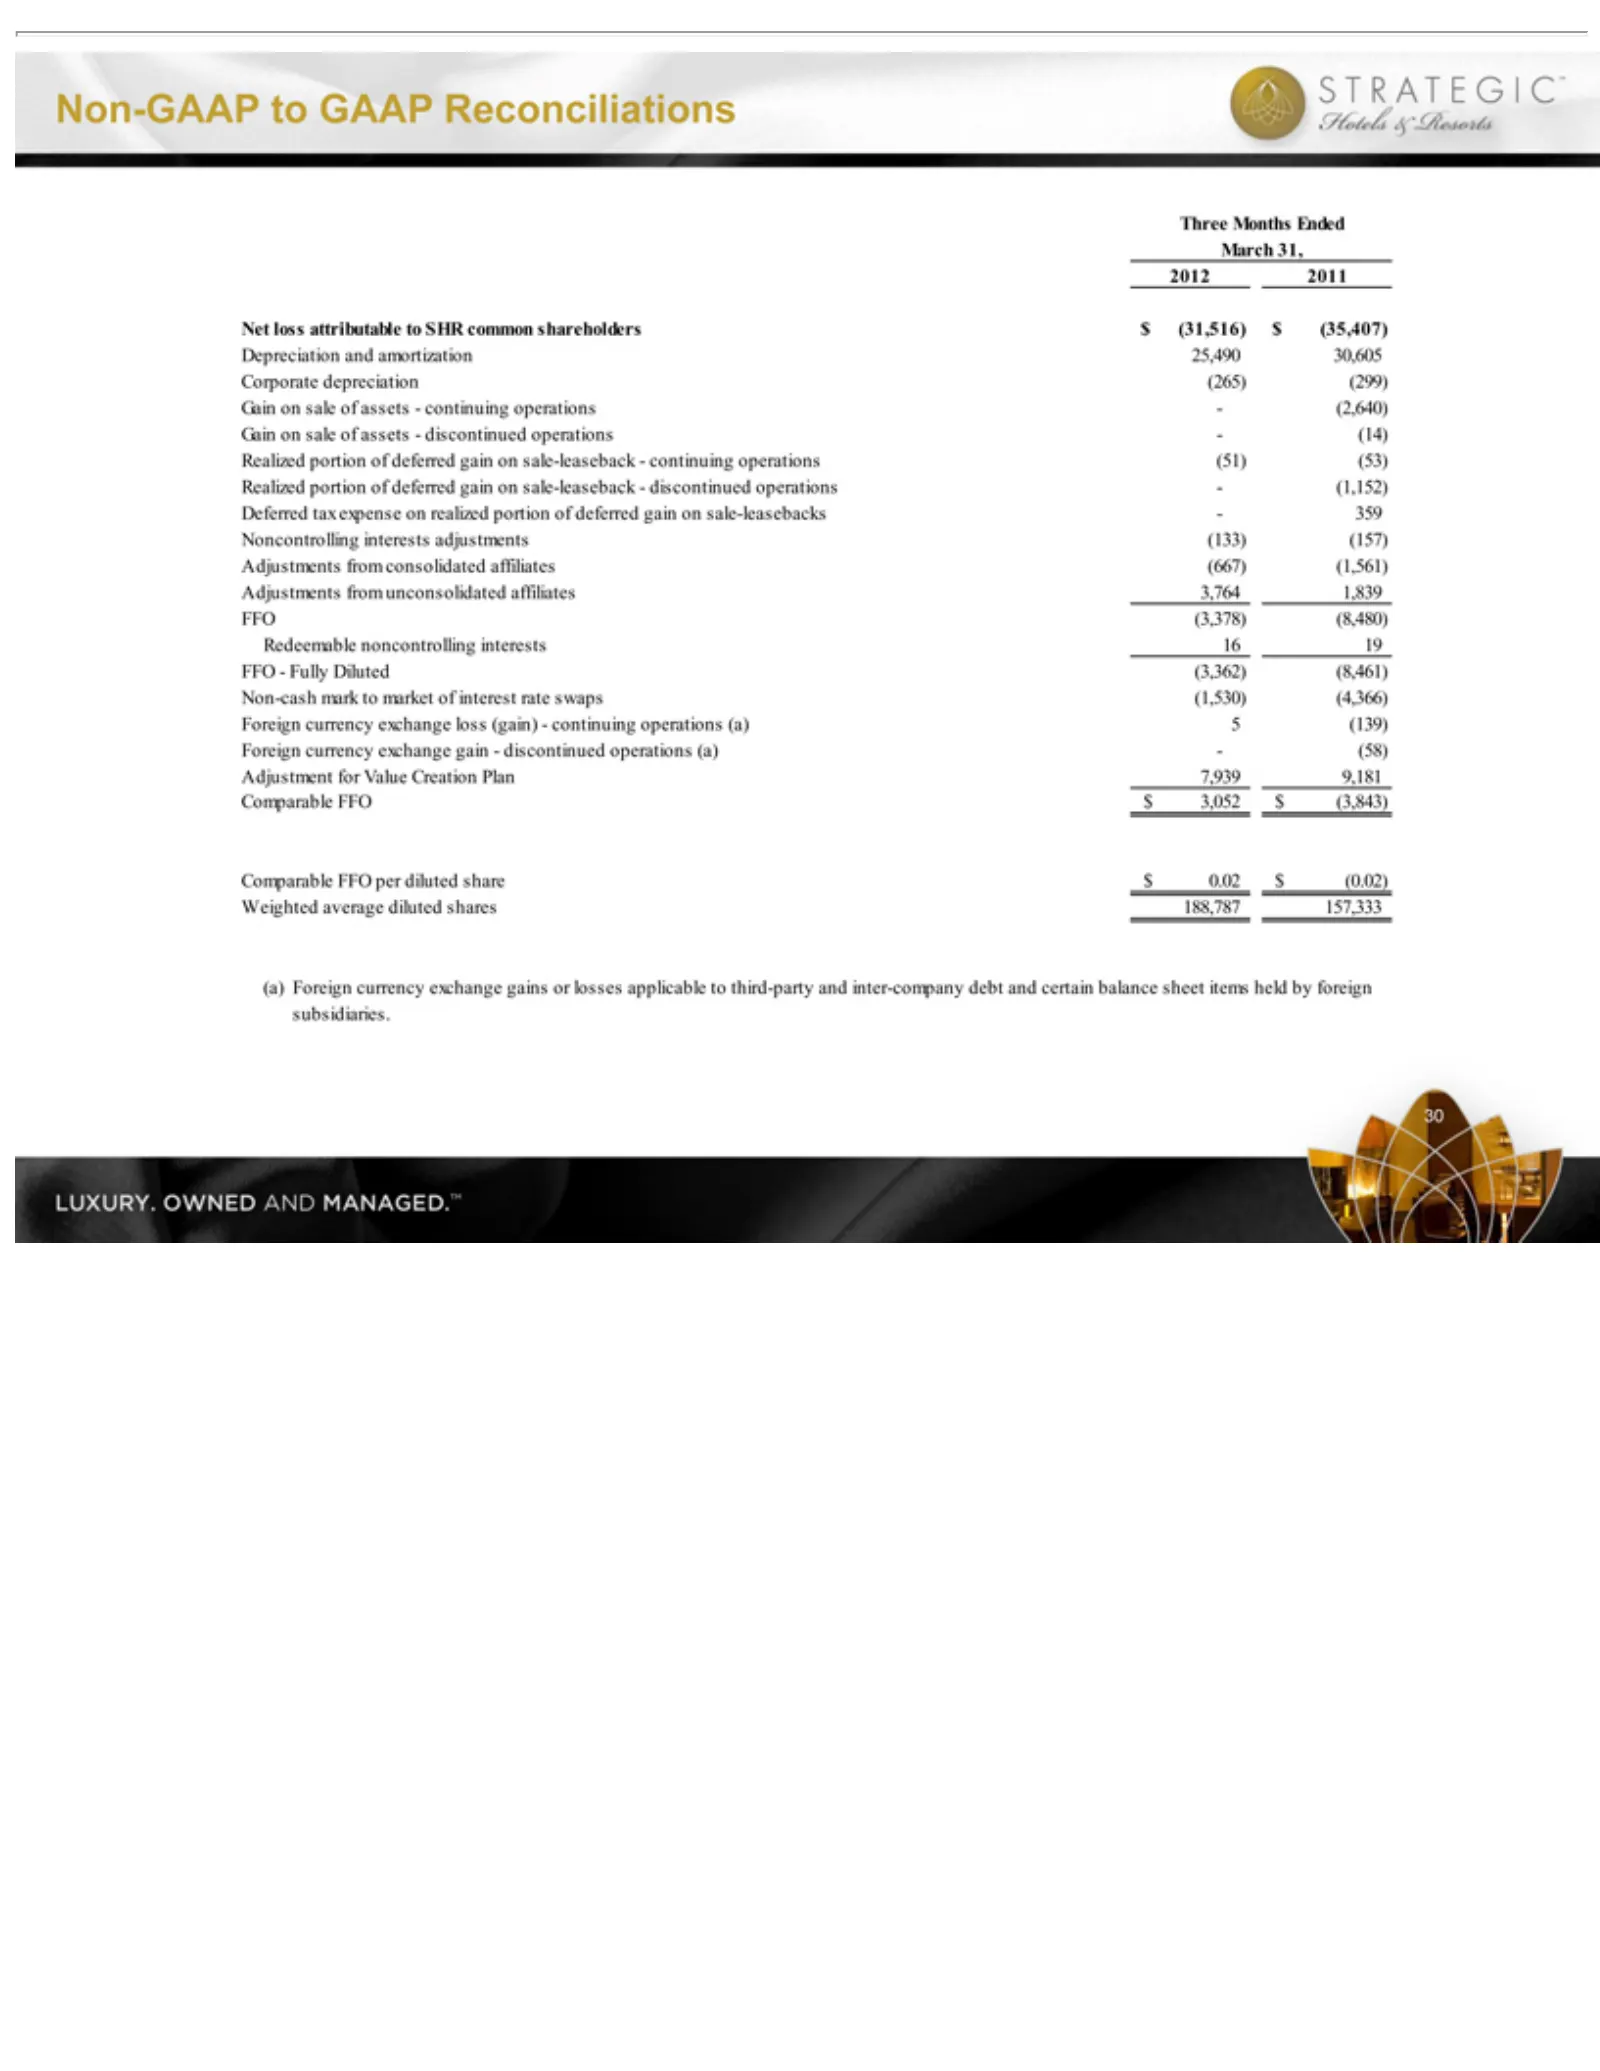
Non-GAAP 30 (299) (53) adjustments(133) FFO—Fully exchange diluted 31,Three Realized Gain shares188,787 Months gain—discontinued on to Diluted(3,362) portion sale GAAP Ended (157) of assets—continuing of Reconciliations 157,333 Adjustments deferred (8,461) operations (a)Foreign gain Non-cash from 20
Slide 32: Non-GAAP Reconciliations
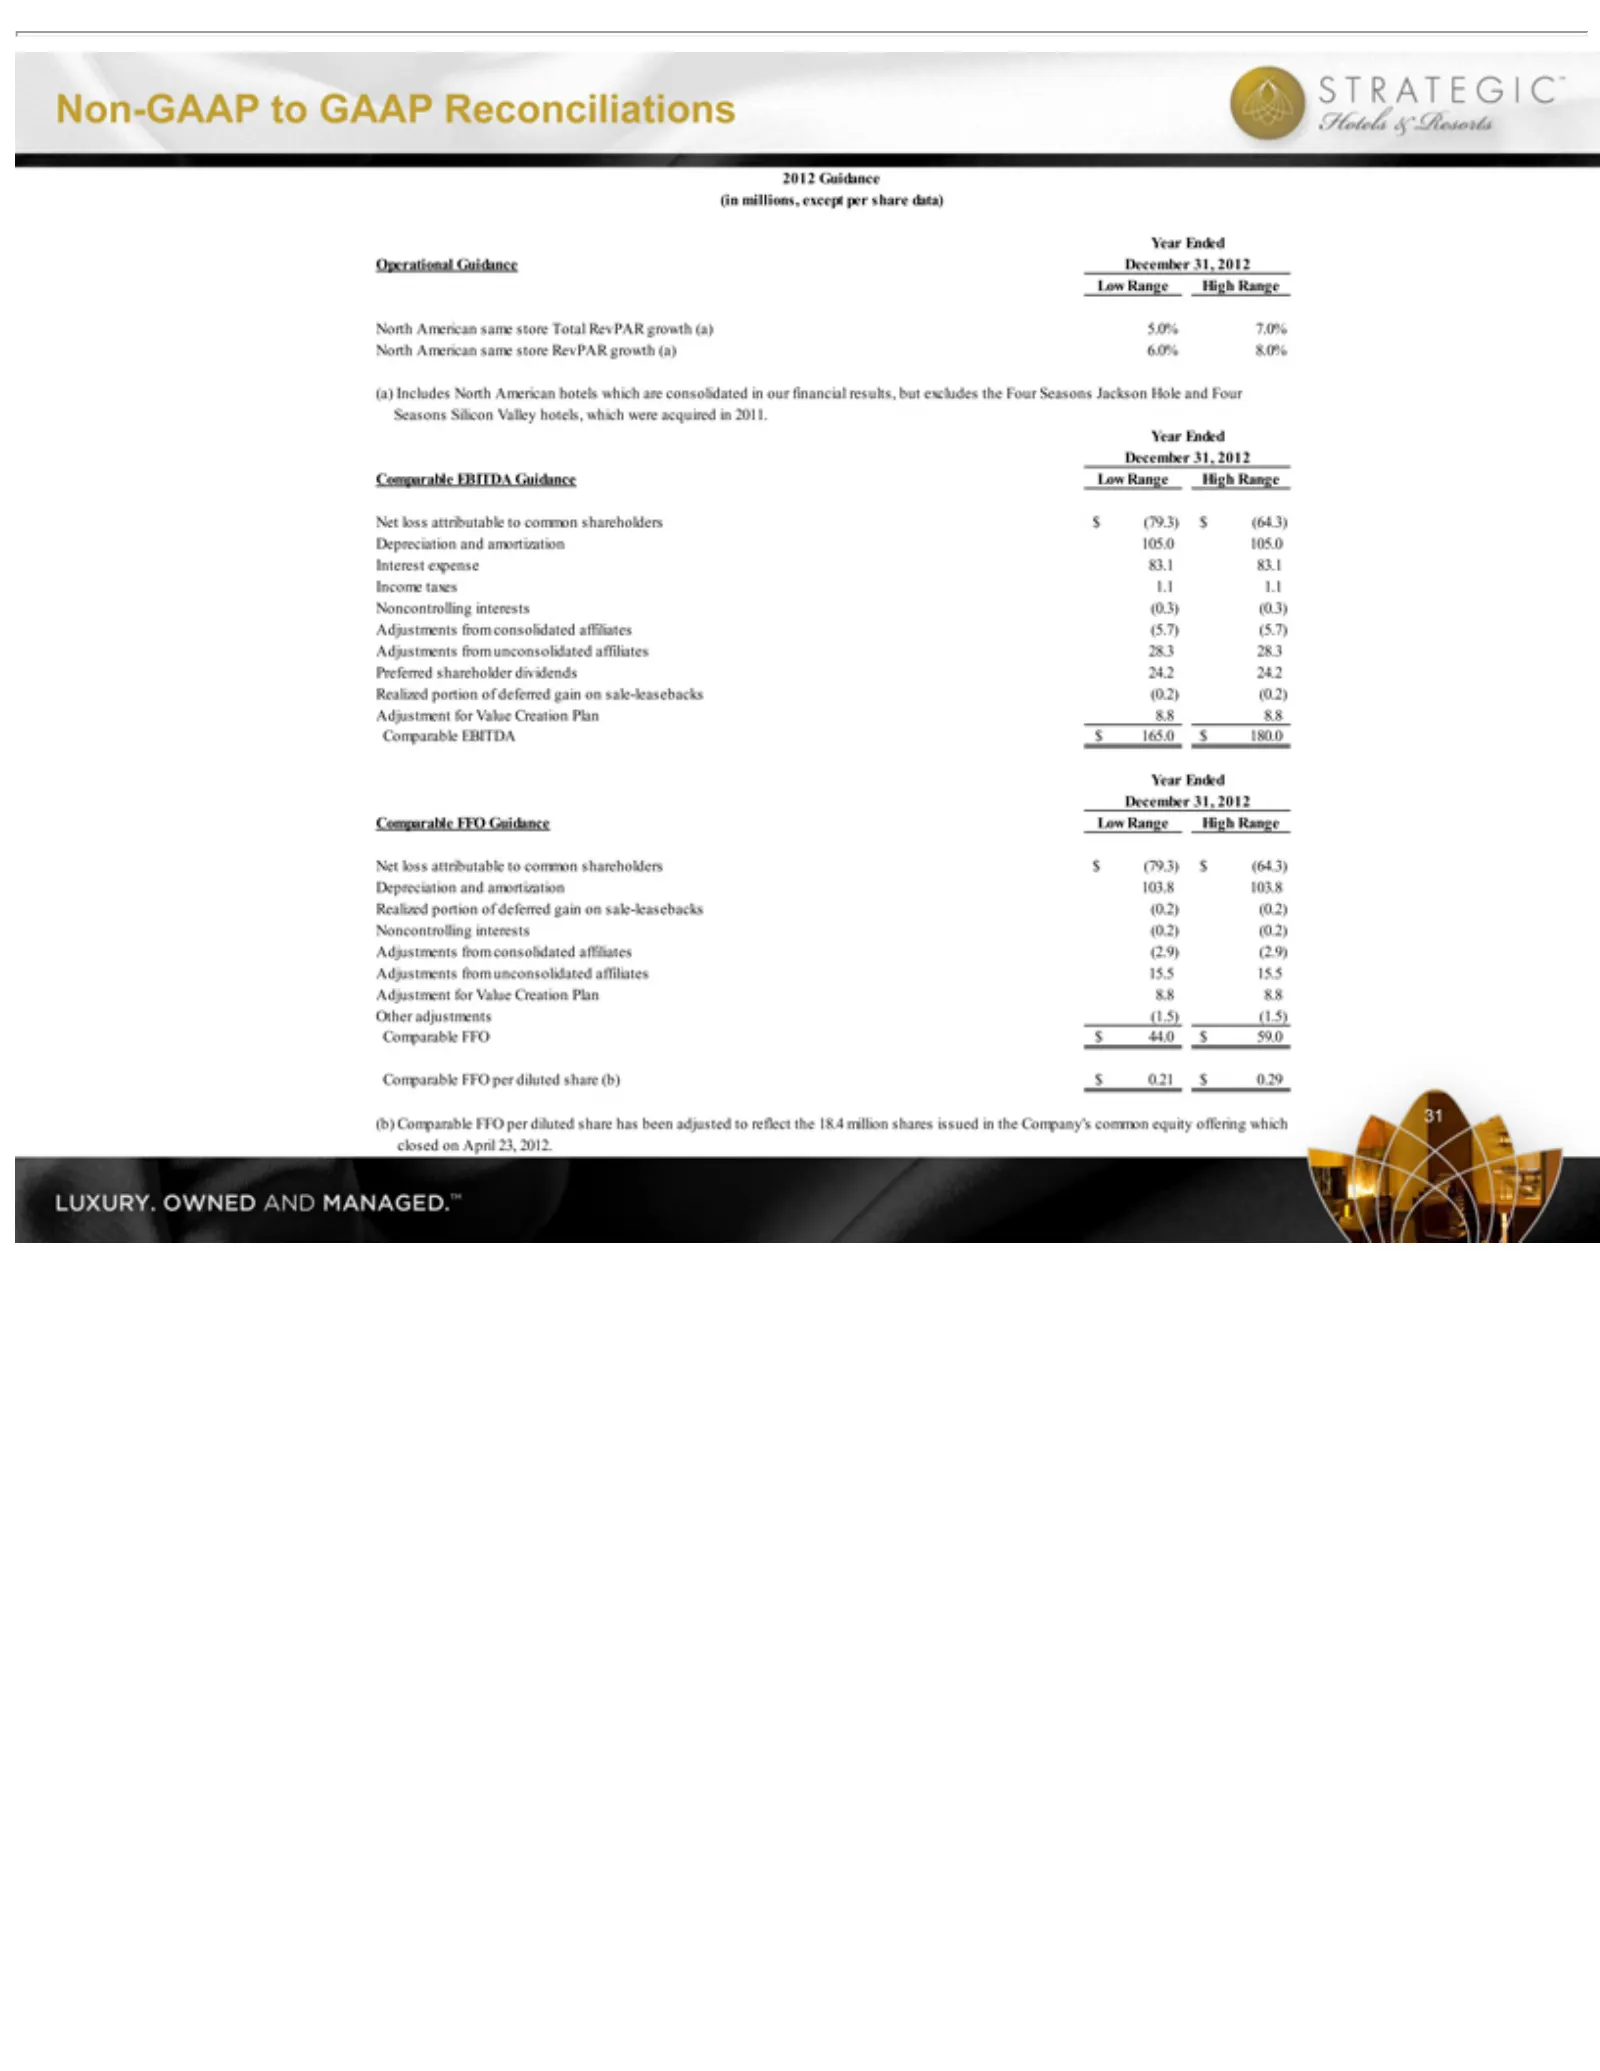
31 Non-GAAP (a)6.0%8.0%(a) acquired 83.1 dividends24.2 RangeHigh Noncontrolling adjustments(1.5) issued EndedDecember Income in in the2011.Comparable RangeNet taxes1.1 Company’s 24.2 to interests(0.2) Includes 31, (1.5) GAAP Realized 2012Year 1.1 loss Comparable common Reconciliations North Noncontr

Slide 33: Thank You
Thank You 32
Source: SEC EDGAR · 8-K filed May 14, 2012
More decks from Strategic Hotels and Resorts Inc
 Investor Presentation (June 2015)43 slides · Jun 1, 2015
 Investor Presentation (February 2015)43 slides · Feb 24, 2015
 Investor Presentation (January 2015)44 slides · Jan 26, 2015
 Investor Presentation (November 2014)50 slides · Nov 5, 2014
 Investor Presentation (October 2014)50 slides · Oct 3, 2014
 Investor Day (September 2014)67 slides · Sep 22, 2014