Capstar Financial Holdings Inc
Capstar Financial — Investor Presentation (February 2019)
45 slides from Capstar Financial's investor presentation, Feb 19, 2019

Slide 1: Investor Presentation February 20-21, 2019
Nasdaq: CSTR Investor Presentation February 20-21, 2019 Claire W. Tucker, President and Chief Executive Officer Rob Anderson, Chief Financial Officer and Chief Administrative Officer Christopher Tietz, Chief Credit Officer
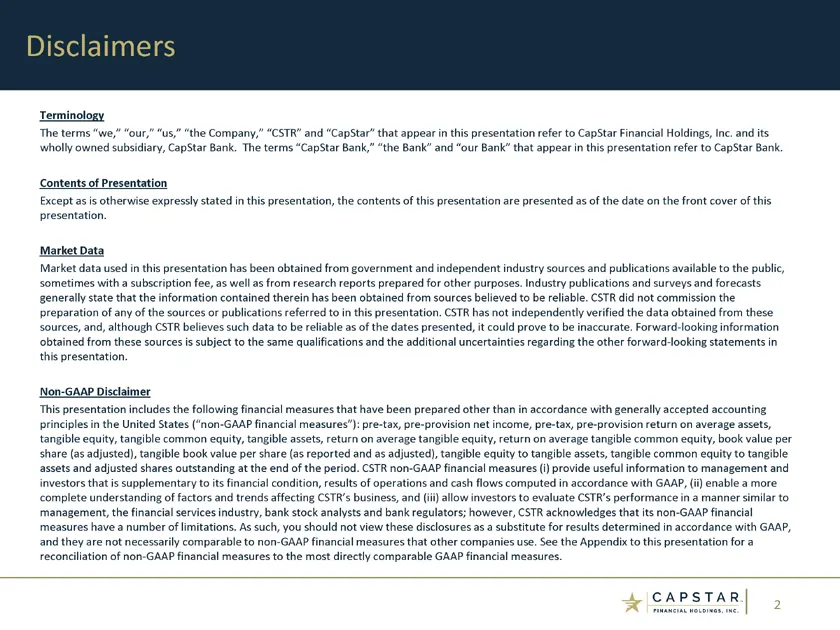
Slide 2: Terminology, Market Data and Non-GAAP Disclaimer
2 Terminology The terms “we,” “our,” “us,” “the Company,” “CSTR” and “CapStar” that appear in this presentation refer to CapStar Financial Holdings, Inc. and its wholly owned subsidiary, CapStar Bank. The terms “CapStar Bank,” “the Bank” and “our Bank” that appear in this presentation refer to CapSt
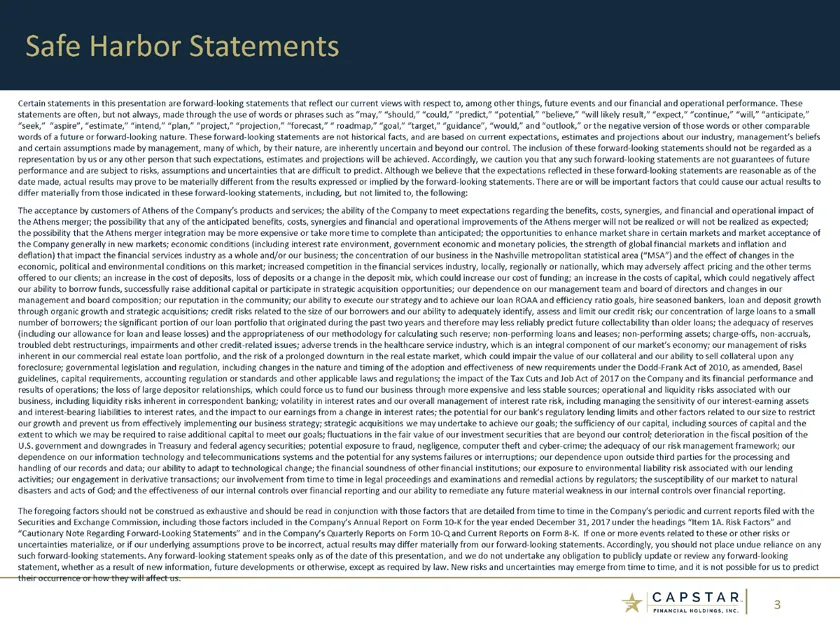
Slide 3: Forward-Looking Statements
3 Certain statements in this presentation are forward-looking statements that reflect our current views with respect to, among other things, future events and our financial and operational performance. These statements are often, but not always, made through the use of words or phrases such as “may,
Slide 4: Table of Contents
4 CapStar Overview and Nashville Athens Merger Update 4Q18 Financials Table of Contents
Slide 5: Table of Contents: CapStar Overview and Nashville
5 CapStar Overview and Nashville Athens Merger Update 4Q18 Financials Table of Contents
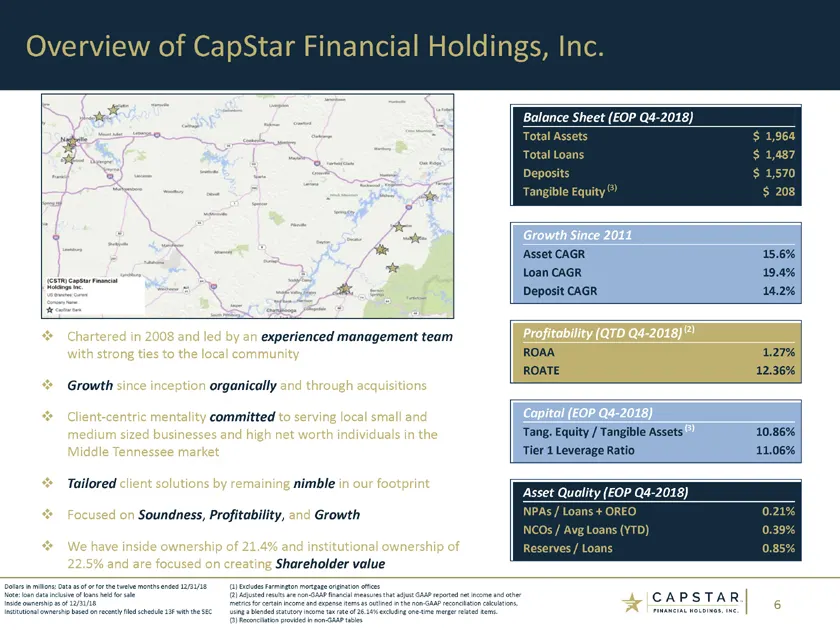
Slide 6: Overview of CapStar Financial Holdings, Inc.
6 Overview of CapStar Financial Holdings, Inc. Chartered in 2008 and led by an experienced management team with strong ties to the local community Growth since inception organically and through acquisitions Client-centric mentality committed to serving local small and medium sized businesses and hig
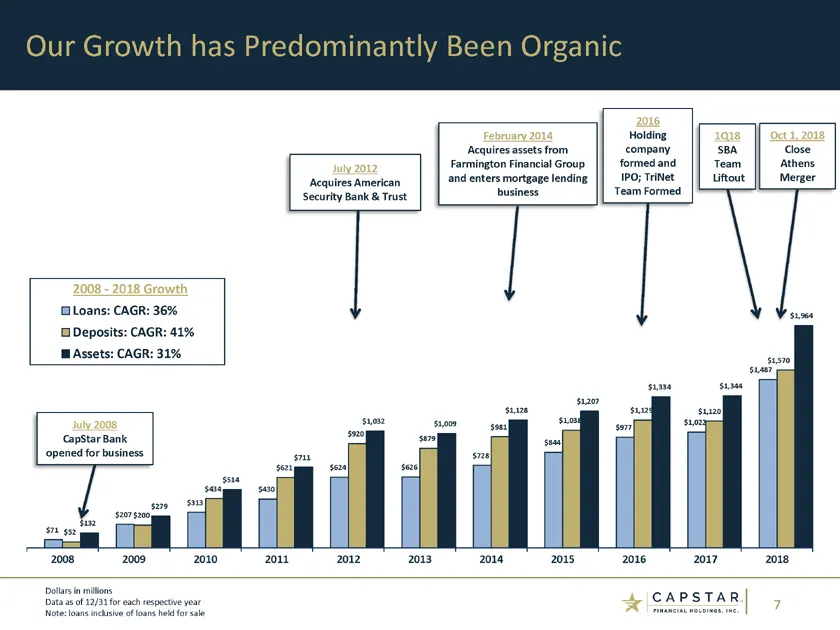
Slide 7: Our Growth has Predominantly Been Organic
7 $71 $207 $313 $430 $624 $626 $728 $844 $977 $1,022 $1,487 $52 $200 $434 $621 $920 $879 $981 $1,038 $1,129 $1,120 $1,570 $132 $279 $514 $711 $1,032 $1,009 $1,128 $1,207 $1,334 $1,344 $1,964 2008 2009 2010 2011 2012 2013 2014 2015 2016 2017 2018 2008—2018 Growth Loans: CAGR: 36% Deposits: CAGR: 41%
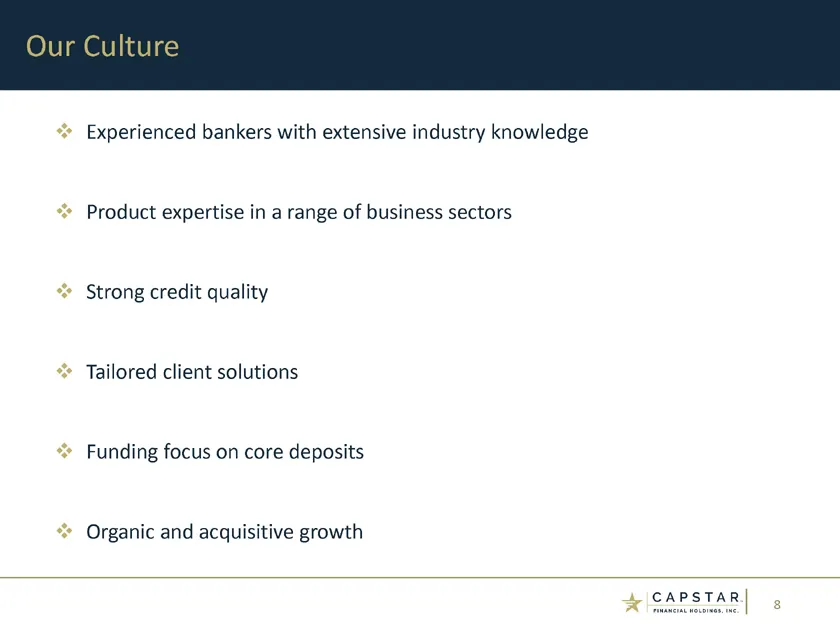
Slide 8: Our Culture
8 Experienced bankers with extensive industry knowledge Product expertise in a range of business sectors Strong credit quality Tailored client solutions Funding focus on core deposits Organic and acquisitive growth Our Culture
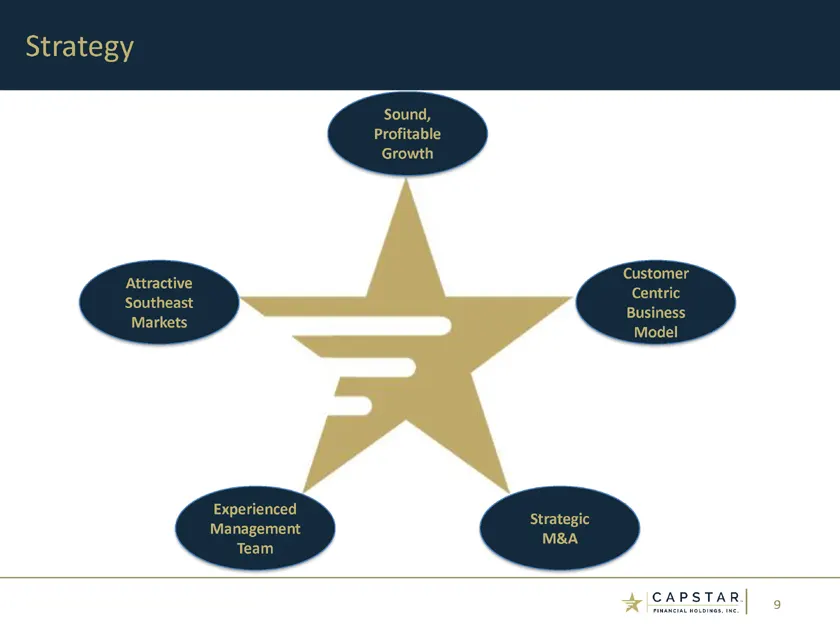
Slide 9: Strategy
9 Strategy Customer Centric Business Model Sound, Profitable Growth Attractive Southeast Markets Experienced Management Team Strategic M&A
Slide 10: Experienced Management Team
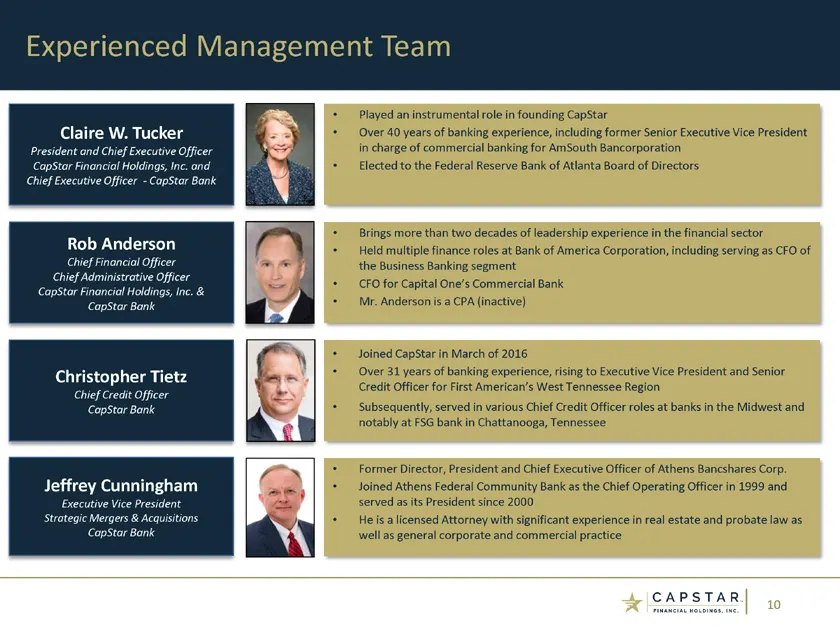
10 Experienced Management Team Claire W. Tucker President and Chief Executive Officer CapStar Financial Holdings, Inc. and Chief Executive Officer—CapStar Bank Played an instrumental role in founding CapStar Over 40 years of banking experience, including former Senior Executive Vice President in cha
Slide 11: Attractive Market of Operation: Nashville MSA
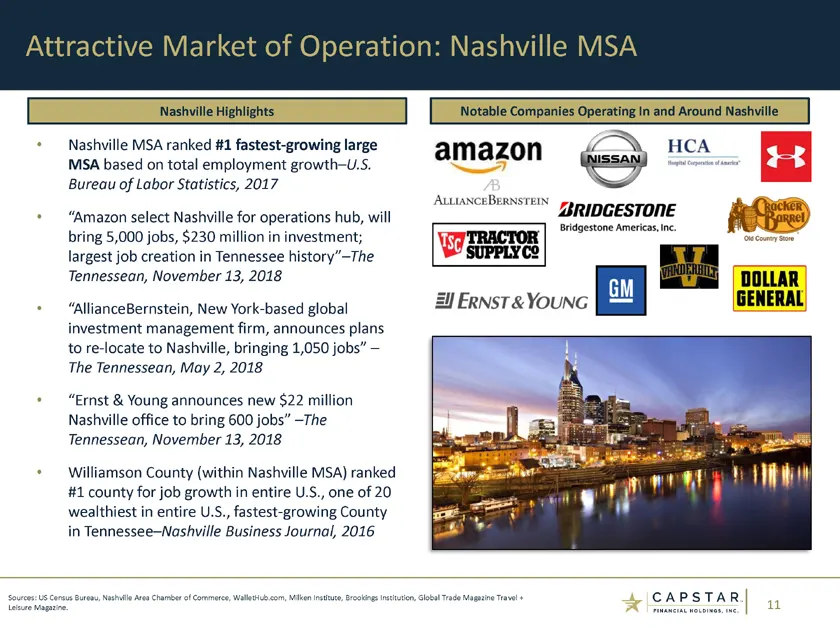
11 Nashville MSA ranked #1 fastest-growing large MSA based on total employment growth U.S. Bureau of Labor Statistics, 2017 “Amazon select Nashville for operations hub, will bring 5,000 jobs, $230 million in investment; largest job creation in Tennessee history” The Tennessean, November 13, 2018 “Al
Slide 12: CapStar recognized by Greenwich Associates
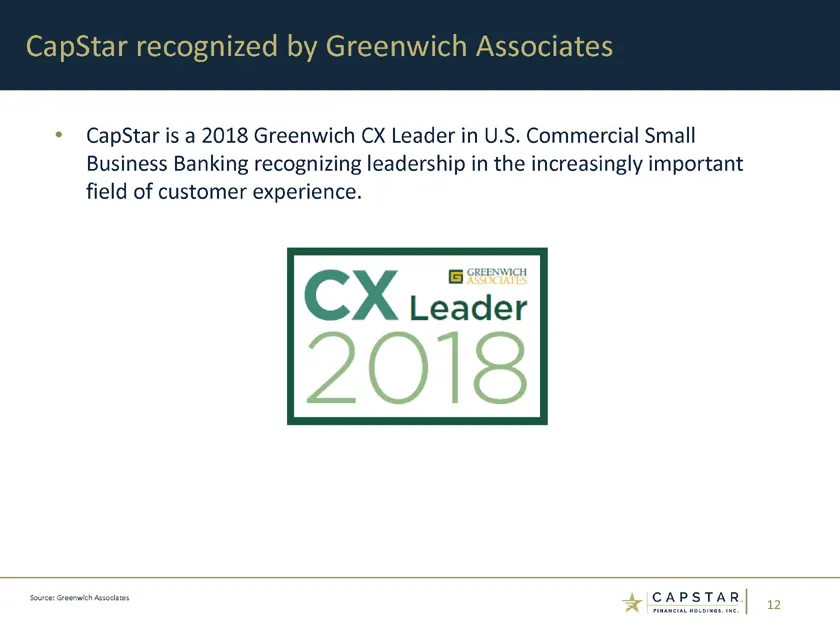
12 CapStar is a 2018 Greenwich CX Leader in U.S. Commercial Small Business Banking recognizing leadership in the increasingly important field of customer experience. CapStar recognized by Greenwich Associates Source: Greenwich Associates
Slide 13: Nashville: Regional, National, and Global Business Hub
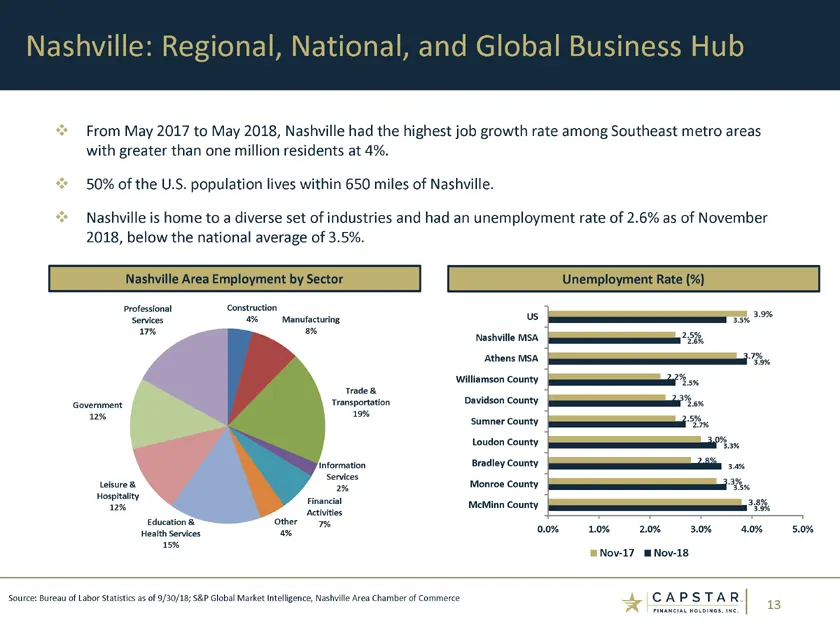
13 From May 2017 to May 2018, Nashville had the highest job growth rate among Southeast metro areas with greater than one million residents at 4%. 50% of the U.S. population lives within 650 miles of Nashville. Nashville is home to a diverse set of industries and had an unemployment rate of 2.6% as
Slide 14: Table of Contents: Athens Merger Update
CapStar Overview and Nashville Athens Merger Update 4Q18 Financials Table of Contents 14
Slide 15: Delivering on Stated M&A Objectives
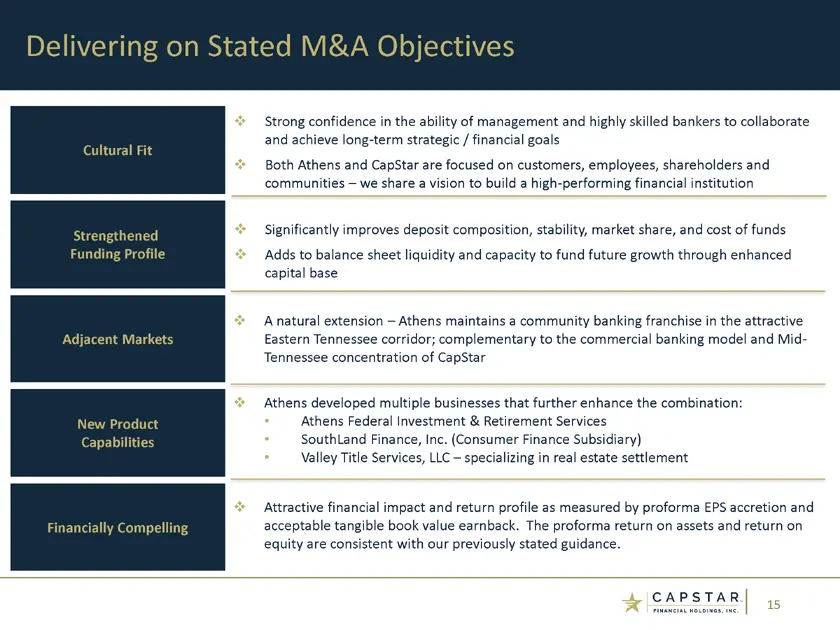
15 Delivering on Stated M&A Objectives Cultural Fit Strengthened Funding Profile Adjacent Markets New Product Capabilities Financially Compelling Strong confidence in the ability of management and highly skilled bankers to collaborate and achieve long-term strategic / financial goals Both Athens and
Slide 16: Athens Merger Update: Key Milestones
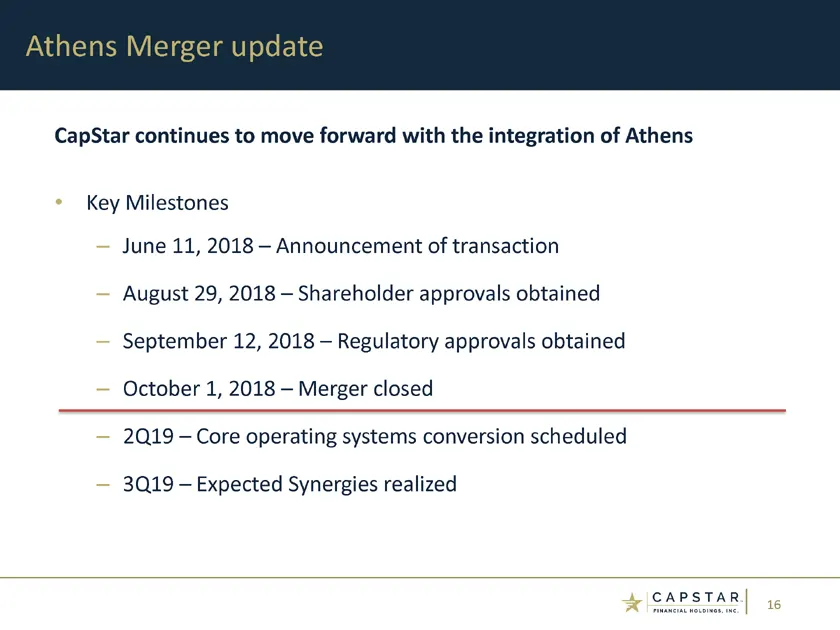
16 CapStar continues to move forward with the integration of Athens Key Milestones June 11, 2018 Announcement of transaction August 29, 2018 Shareholder approvals obtained September 12, 2018 Regulatory approvals obtained October 1, 2018 Merger closed 2Q19 Core operating systems conversion scheduled
Slide 17: Athens Federal Merger Update
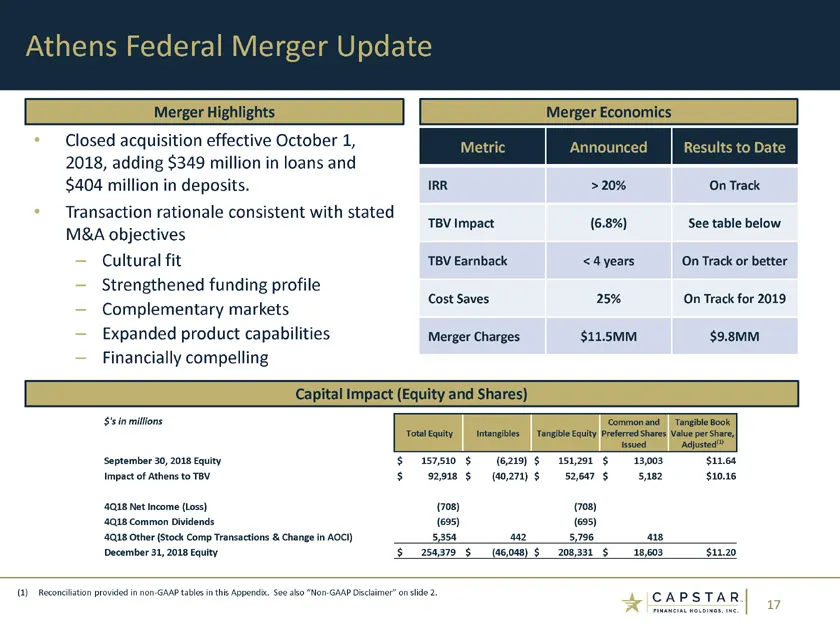
17 Athens Federal Merger Update Closed acquisition effective October 1, 2018, adding $349 million in loans and $404 million in deposits. Transaction rationale consistent with stated M&A objectives Cultural fit Strengthened funding profile Complementary markets Expanded product capabilities Financial
Slide 18: Table of Contents: 4Q18 Financials
18 CapStar Overview and Nashville Athens Merger Update 4Q18 Financials Table of Contents
Slide 19: 4Q18 Highlights
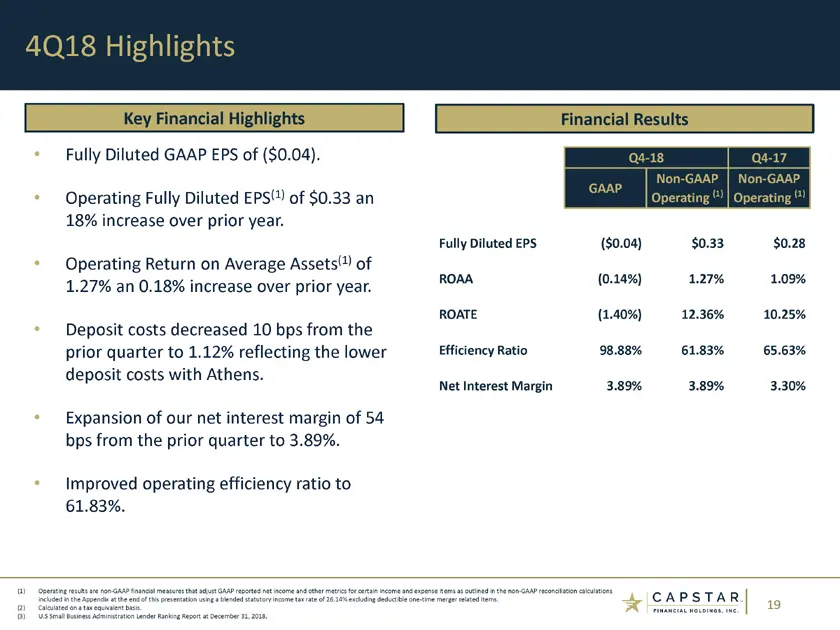
19 Fully Diluted GAAP EPS of ($0.04). Operating Fully Diluted EPS(1) of $0.33 an 18% increase over prior year. Operating Return on Average Assets(1) of 1.27% an 0.18% increase over prior year. Deposit costs decreased 10 bps from the prior quarter to 1.12% reflecting the lower deposit costs with Athe
Slide 20: Loan Growth
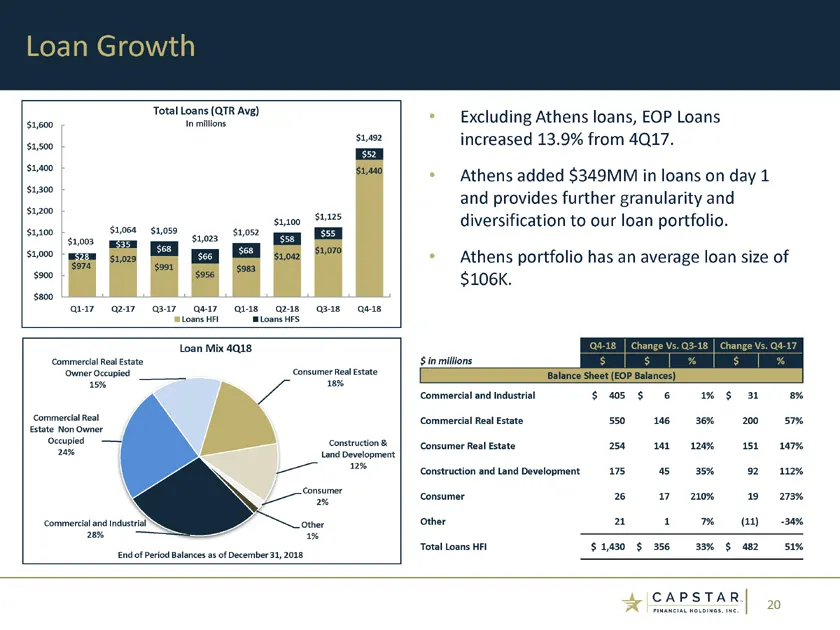
20 Loan Growth Excluding Athens loans, EOP Loans increased 13.9% from 4Q17. Athens added $349MM in loans on day 1 and provides further granularity and diversification to our loan portfolio. Athens portfolio has an average loan size of $106K. $974 $1,029 $991 $956 $983 $1,042 $1,070 $1,440 $28 $35 $6
Slide 21: Credit Quality
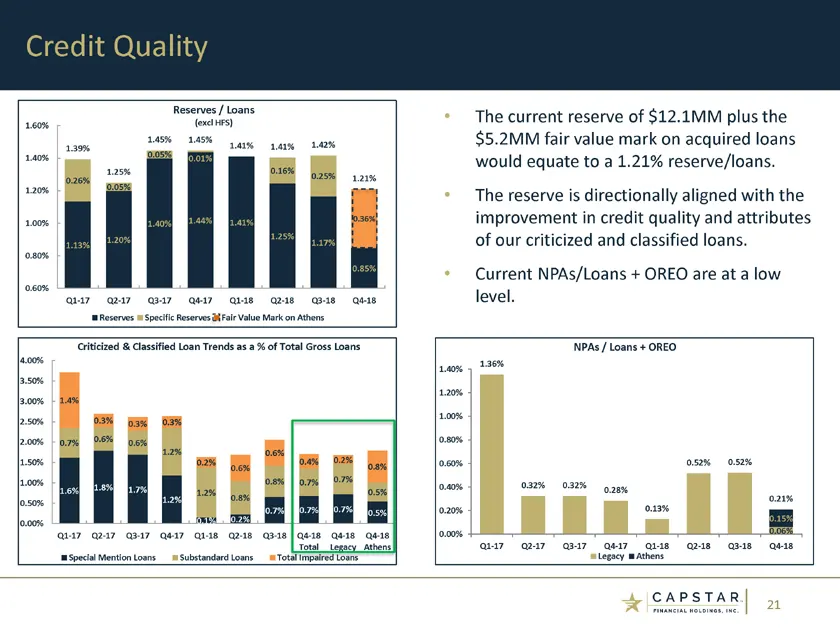
21 1.6% 1.8% 1.7% 1.2% 0.1% 0.2% 0.7% 0.7% 0.7% 0.5% 0.7% 0.6% 0.6% 1.2% 1.2% 0.8% 0.8% 0.7% 0.7% 0.5% 1.4% 0.3% 0.3% 0.3% 0.2% 0.6% 0.6% 0.4% 0.2% 0.8% 0.00% 0.50% 1.00% 1.50% 2.00% 2.50% 3.00% 3.50% 4.00% Q1-17 Q2-17 Q3-17 Q4-17 Q1-18 Q2-18 Q3-18 Q4-18 Total Q4-18 Legacy Q4-18 Athens Criticized &
Slide 22: Loan Yields
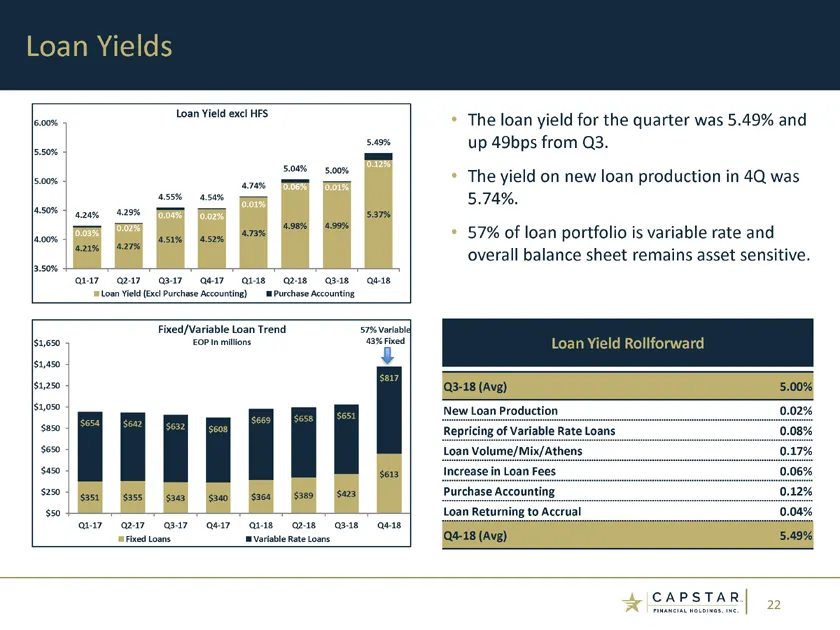
22 4.21% 4.27% 4.51% 4.52% 4.73% 4.98% 4.99% 5.37% 0.03% 0.02% 0.04% 0.02% 0.01% 0.06% 0.01% 0.12% 4.24% 4.29% 4.55% 4.54% 4.74% 5.04% 5.00% 5.49% 3.50% 4.00% 4.50% 5.00% 5.50% 6.00% Q1-17 Q2-17 Q3-17 Q4-17 Q1-18 Q2-18 Q3-18 Q4-18 Loan Yield excl HFS Loan Yield (Excl Purchase Accounting) Purchase Ac
Slide 23: Deposit Composition
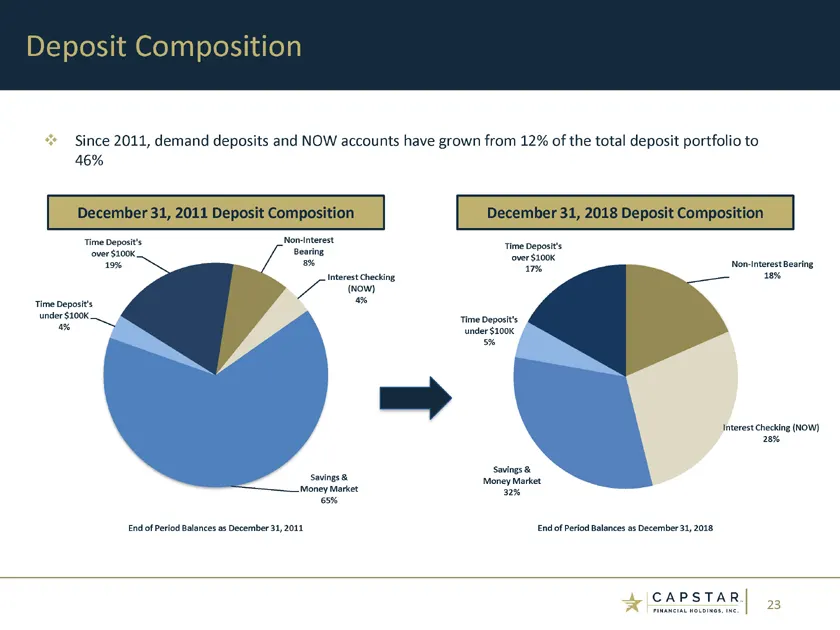
23 December 31, 2011 Deposit Composition Deposit Composition December 31, 2018 Deposit Composition Since 2011, demand deposits and NOW accounts have grown from 12% of the total deposit portfolio to 46% Non-Interest Bearing 8% Interest Checking (NOW) 4% Savings & Money Market 65% Time Deposit’s under
Slide 24: Deposit Growth and Costs
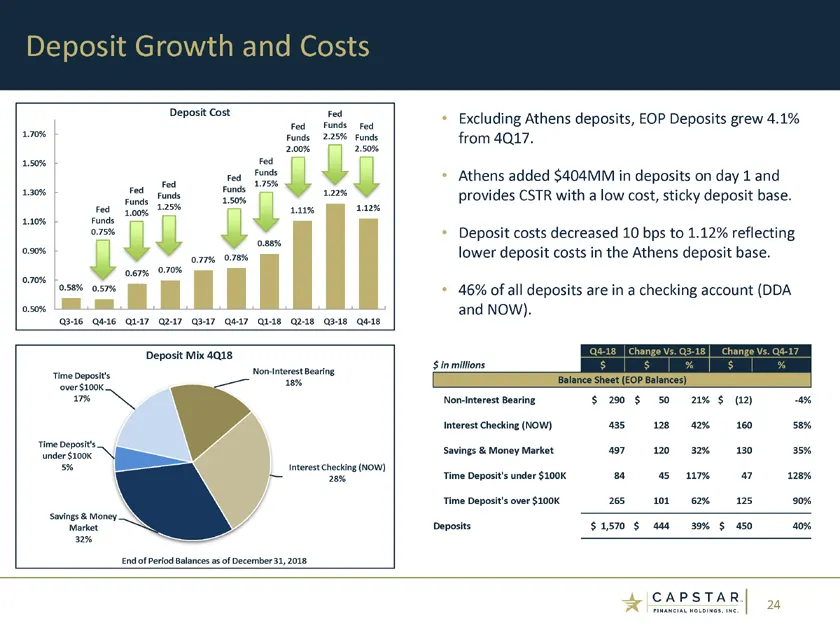
END 24 Deposit Growth and Costs Excluding Athens deposits, EOP Deposits grew 4.1% from 4Q17. Athens added $404MM in deposits on day 1 and provides CSTR with a low cost, sticky deposit base. Deposit costs decreased 10 bps to 1.12% reflecting lower deposit costs in the Athens deposit base. 46% of all
Slide 25: Net Interest Margin
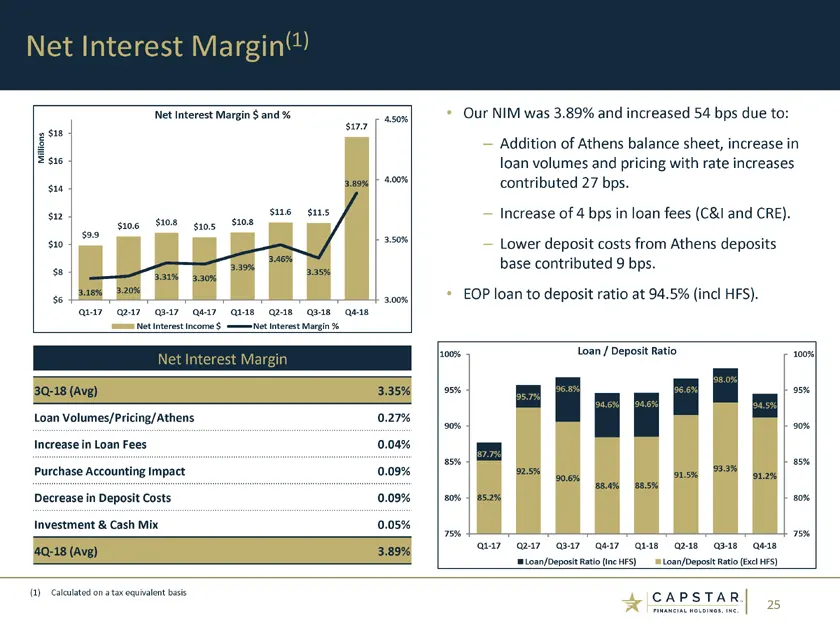
25 Net Interest Margin(1) Our NIM was 3.89% and increased 54 bps due to: Addition of Athens balance sheet, increase in loan volumes and pricing with rate increases contributed 27 bps. Increase of 4 bps in loan fees (C&I and CRE). Lower deposit costs from Athens deposits base contributed 9 bps. EOP l
Slide 26: Non-Interest Income
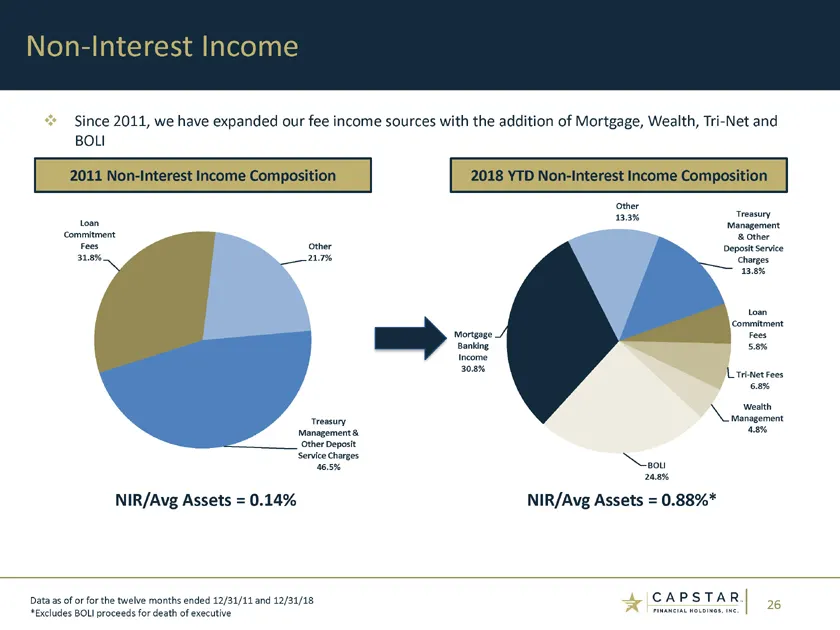
26 Non-Interest Income 2011 Non-Interest Income Composition 2018 YTD Non-Interest Income Composition Since 2011, we have expanded our fee income sources with the addition of Mortgage, Wealth, Tri-Net and BOLI Data as of or for the twelve months ended 12/31/11 and 12/31/18 *Excludes BOLI proceeds for
Slide 27: Capital
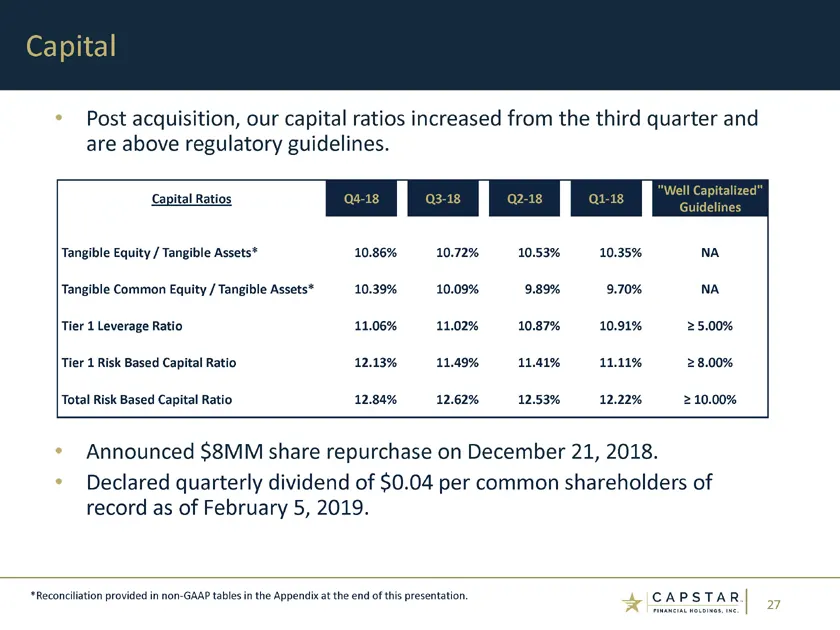
27 Post acquisition, our capital ratios increased from the third quarter and are above regulatory guidelines. Announced $8MM share repurchase on December 21, 2018. Declared quarterly dividend of $0.04 per common shareholders of record as of February 5, 2019. Capital *Reconciliation provided in non-G
Slide 28: 2019 Guidance
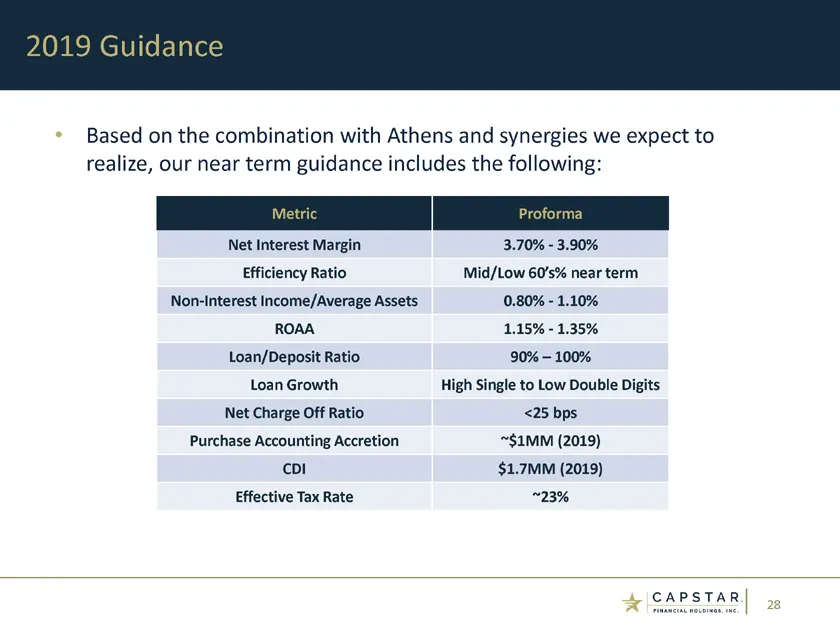
28 Based on the combination with Athens and synergies we expect to realize, our near term guidance includes the following: 2019 Guidance Metric Proforma Net Interest Margin 3.70% - 3.90% Efficiency Ratio Mid/Low 60’s% near term Non-Interest Income/Average Assets 0.80% - 1.10% ROAA 1.15% - 1.35% Loan
Slide 29: Key Takeaways
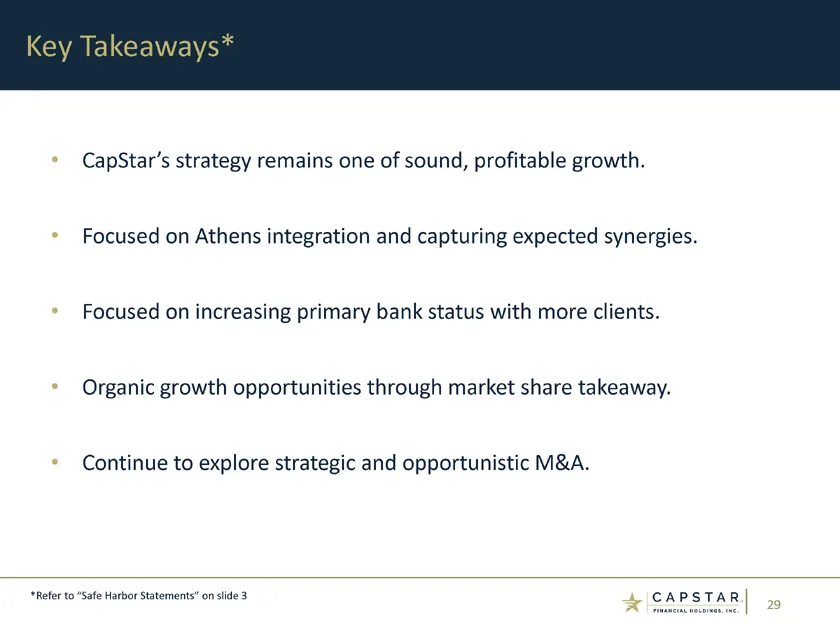
29 CapStar’s strategy remains one of sound, profitable growth. Focused on Athens integration and capturing expected synergies. Focused on increasing primary bank status with more clients. Organic growth opportunities through market share takeaway. Continue to explore strategic and opportunistic M&A.
Slide 30: Contact Information
30 CapStar Financial Holdings, Inc. 1201 Demonbreun Street, Suite 700 Nashville, TN 37203 Mail: P.O. Box 305065 Nashville, TN 37230-5065 (615) 732-6400 Telephone www.capstarbank.com (615) 732-6455 Email: [email protected] Contact Information Investor Relations Executive Leadership Claire W. Tucker
Slide 31: Appendix: Non-GAAP Tables
31 Appendix: Non-GAAP Tables
Slide 32: Historical Financials: Statement of Income
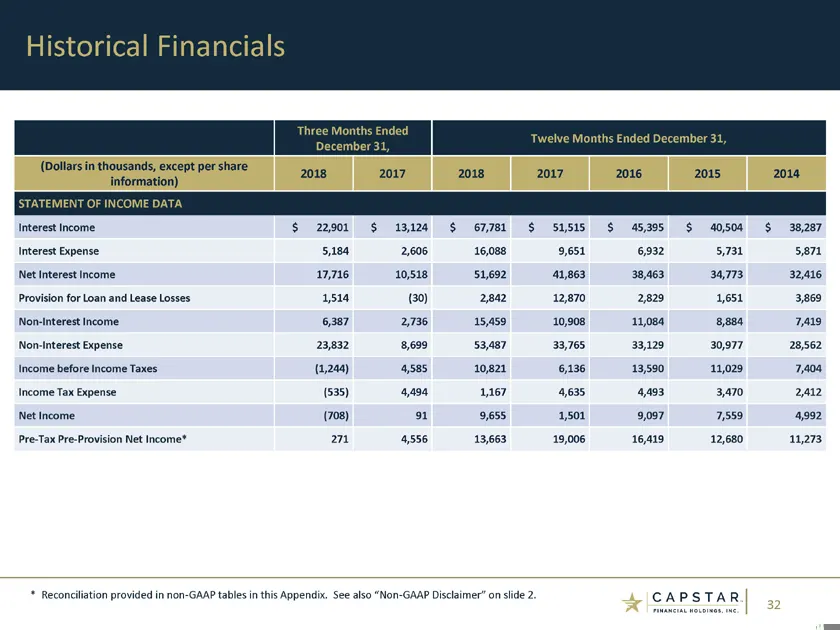
32 Historical Financials * Reconciliation provided in non-GAAP tables in this Appendix. See also “Non-GAAP Disclaimer” on slide 2. Three Months Ended December 31, Twelve Months Ended December 31, (Dollars in thousands, except per share information) 2018 2017 2018 2017 2016 2015 2014 STATEMENT OF INC
Slide 33: Historical Financials: Balance Sheet
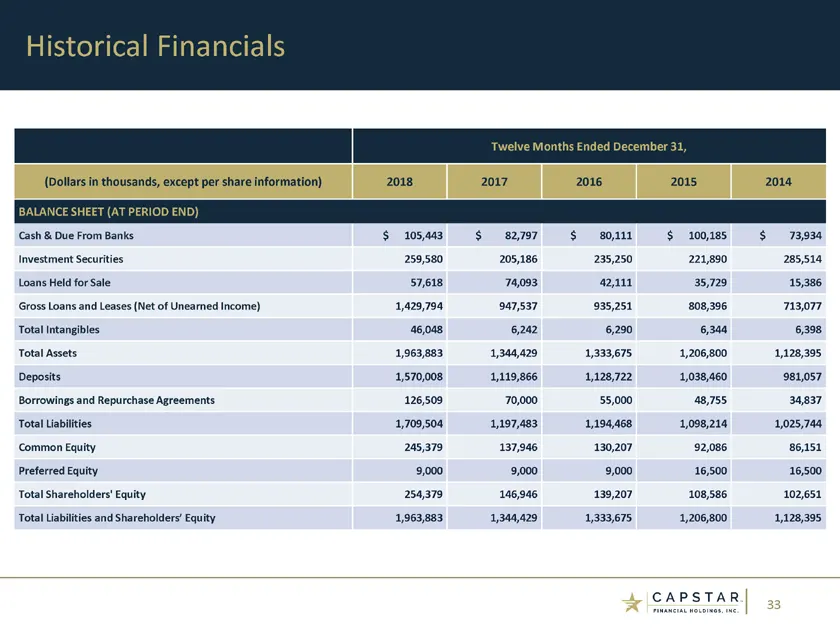
33 Historical Financials Twelve Months Ended December 31, (Dollars in thousands, except per share information) 2018 2017 2016 2015 2014 BALANCE SHEET (AT PERIOD END) Cash & Due From Banks $ 105,443 $ 82,797 $ 80,111 $ 100,185 $ 73,934 Investment Securities 259,580 205,186 235,250 221,890 285,514 Loa
Slide 34: Historical Financials: Performance Ratios
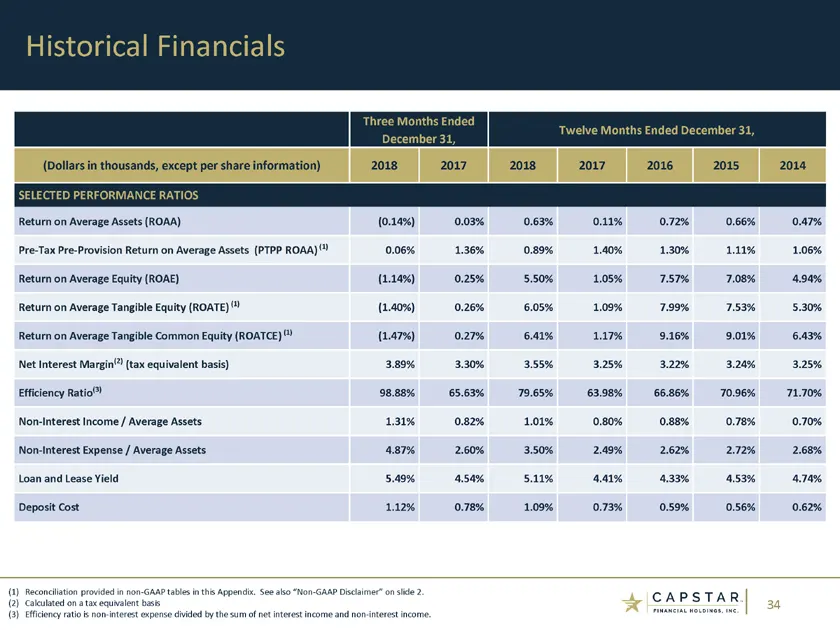
34 Historical Financials (1) Reconciliation provided in non-GAAP tables in this Appendix. See also “Non-GAAP Disclaimer” on slide 2. (2) Calculated on a tax equivalent basis (3) Efficiency ratio is non-interest expense divided by the sum of net interest income and non-interest income. Three Months E
Slide 35: Historical Financials: Per Share and Capital Ratios
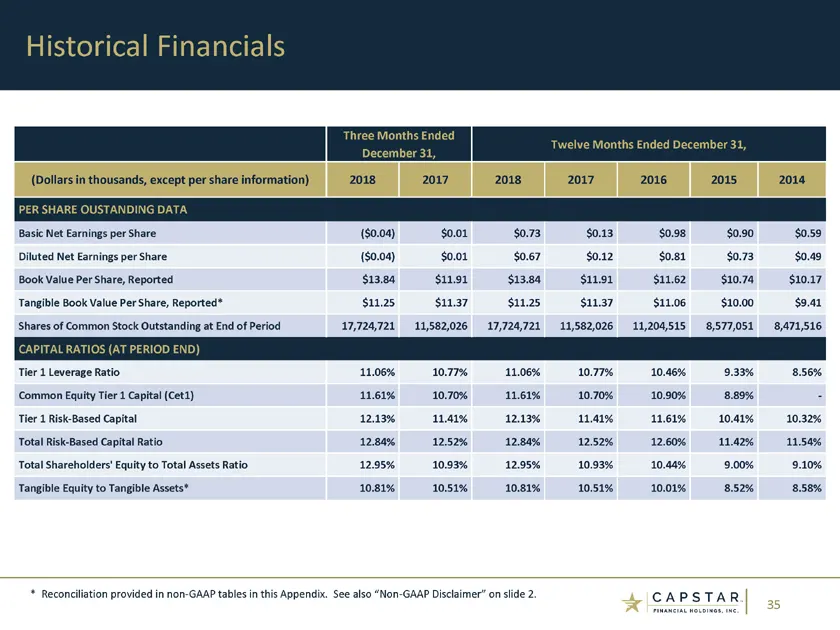
35 Historical Financials * Reconciliation provided in non-GAAP tables in this Appendix. See also “Non-GAAP Disclaimer” on slide 2. Three Months Ended Twelve Months Ended December 31, December 31, (Dollars in thousands, except per share information) 2018 2017 2018 2017 2016 2015 2014 PER SHARE OUSTAN
Slide 36: Historical Financials: Asset Quality
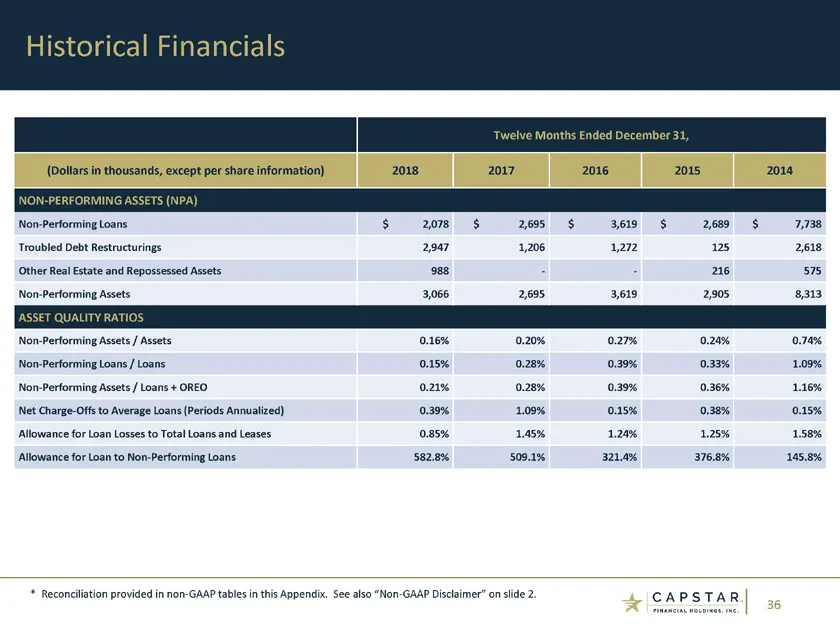
36 Historical Financials Twelve Months Ended December 31, (Dollars in thousands, except per share information) 2018 2017 2016 2015 2014 NON-PERFORMING ASSETS (NPA) Non-Performing Loans $ 2,078 $ 2,695 $ 3,619 $ 2,689 $ 7,738 Troubled Debt Restructurings 2,947 1,206 1,272 125 2,618 Other Real Estate
Slide 37: Historical Financials: Loan and Deposit Composition
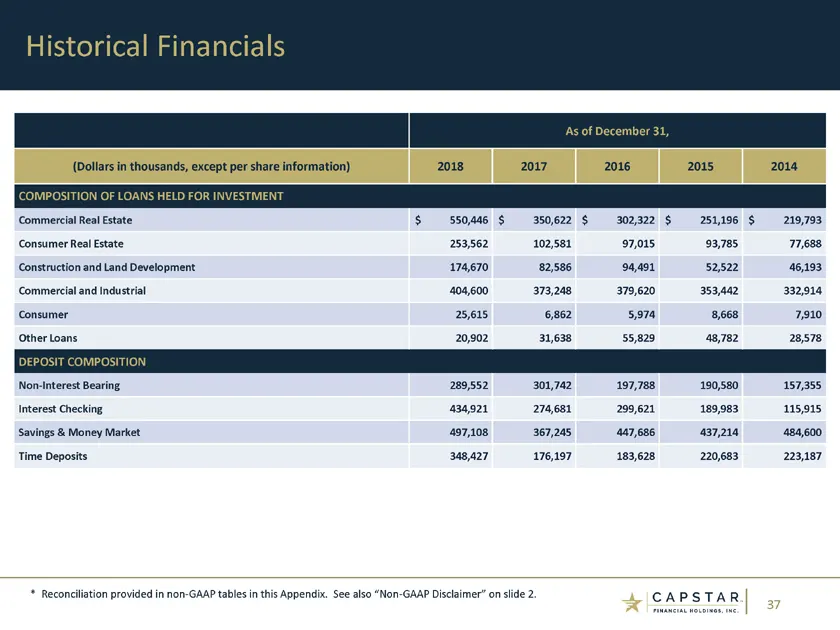
37 Historical Financials As of December 31, (Dollars in thousands, except per share information) 2018 2017 2016 2015 2014 COMPOSITION OF LOANS HELD FOR INVESTMENT Commercial Real Estate $ 550,446 $ 350,622 $ 302,322 $ 251,196 $ 219,793 Consumer Real Estate 253,562 102,581 97,015 93,785 77,688 Constr
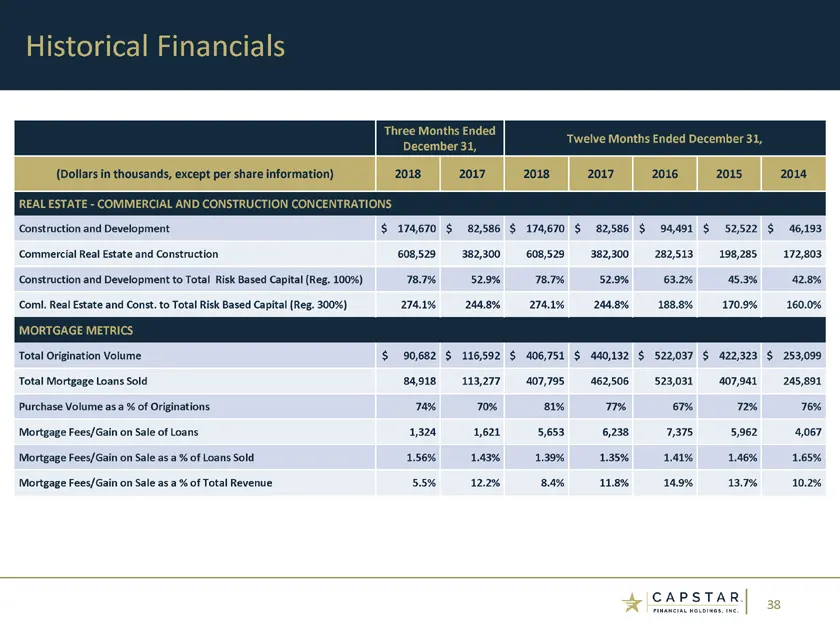
Slide 38: Historical Financials: Concentrations and Mortgage Metrics
38 Historical Financials Three Months Ended Twelve Months Ended December 31, December 31, (Dollars in thousands, except per share information) 2018 2017 2018 2017 2016 2015 2014 REAL ESTATE—COMMERCIAL AND CONSTRUCTION CONCENTRATIONS Construction and Development $ 174,670 $ 82,586 $ 174,670 $ 82,586
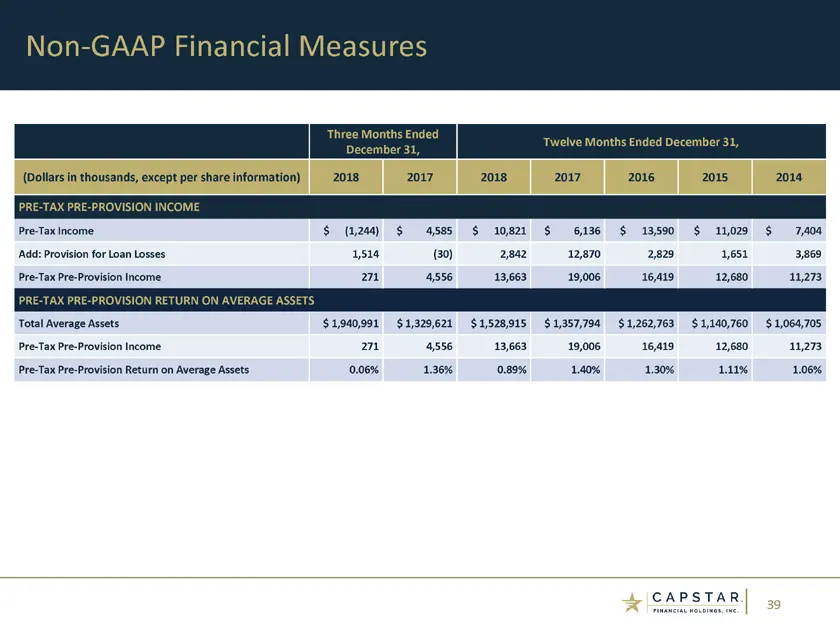
Slide 39: Pre-Tax Pre-Provision Income
39 Three Months Ended December 31, Twelve Months Ended December 31, (Dollars in thousands, except per share information) 2018 2017 2018 2017 2016 2015 2014 PRE-TAX PRE-PROVISION INCOME Pre-Tax Income $ (1,244) $ 4,585 $ 10,821 $ 6,136 $ 13,590 $ 11,029 $ 7,404 Add: Provision for Loan Losses 1,514 (3
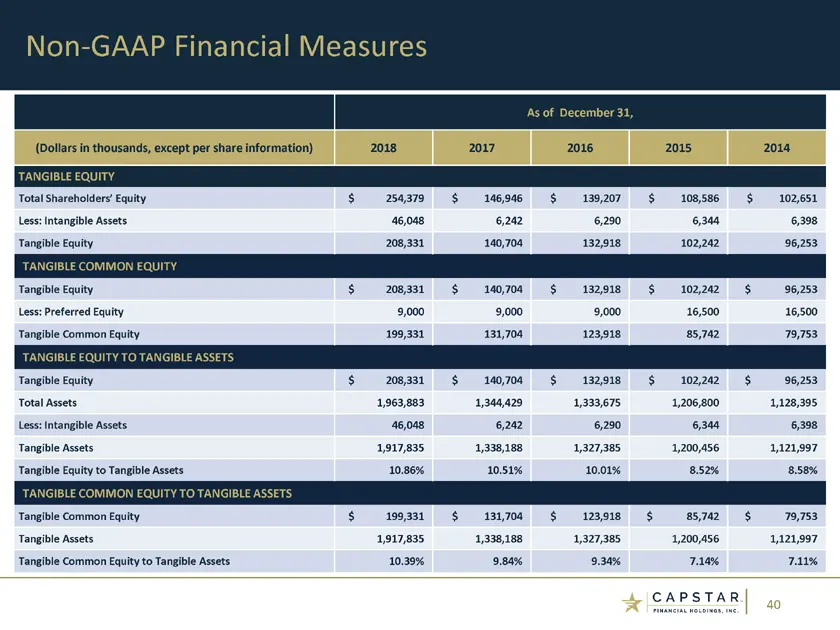
Slide 40: Tangible Equity Reconciliation
40 As of December 31, (Dollars in thousands, except per share information) 2018 2017 2016 2015 2014 TANGIBLE EQUITY Total Shareholders’ Equity $ 254,379 $ 146,946 $ 139,207 $ 108,586 $ 102,651 Less: Intangible Assets 46,048 6,242 6,290 6,344 6,398 Tangible Equity 208,331 140,704 132,918 102,242 96,2
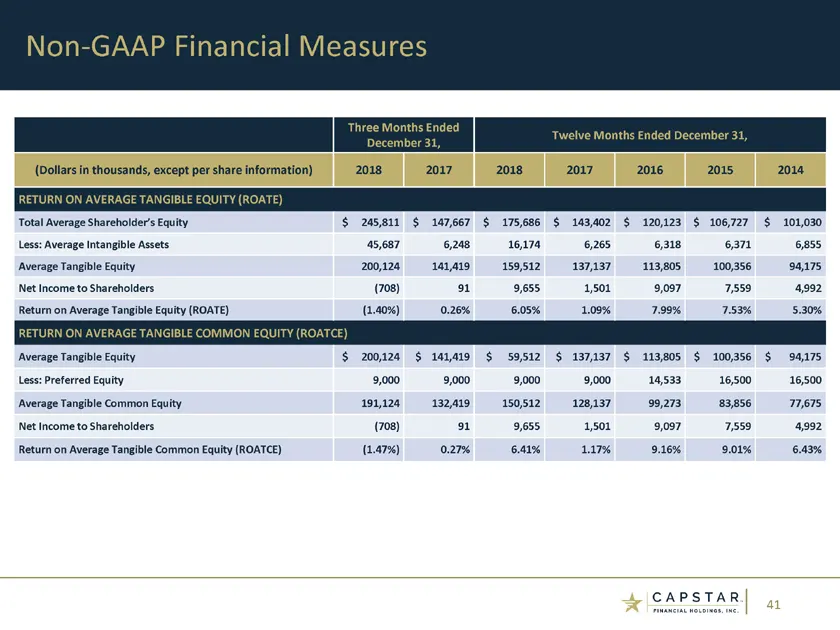
Slide 41: Return on Average Tangible Equity
41 Three Months Ended December 31, Twelve Months Ended December 31, (Dollars in thousands, except per share information) 2018 2017 2018 2017 2016 2015 2014 RETURN ON AVERAGE TANGIBLE EQUITY (ROATE) Total Average Shareholder’s Equity $ 245,811 $ 147,667 $ 175,686 $ 143,402 $ 120,123 $ 106,727 $ 101,0
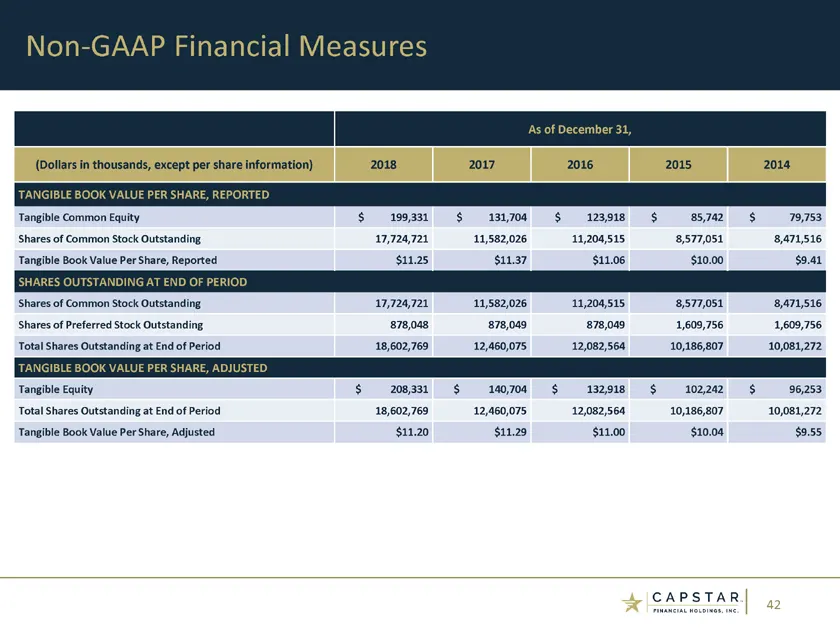
Slide 42: Tangible Book Value Per Share
42 As of December 31, (Dollars in thousands, except per share information) 2018 2017 2016 2015 2014 TANGIBLE BOOK VALUE PER SHARE, REPORTED Tangible Common Equity $ 199,331 $ 131,704 $ 123,918 $ 85,742 $ 79,753 Shares of Common Stock Outstanding 17,724,721 11,582,026 11,204,515 8,577,051 8,471,516 T
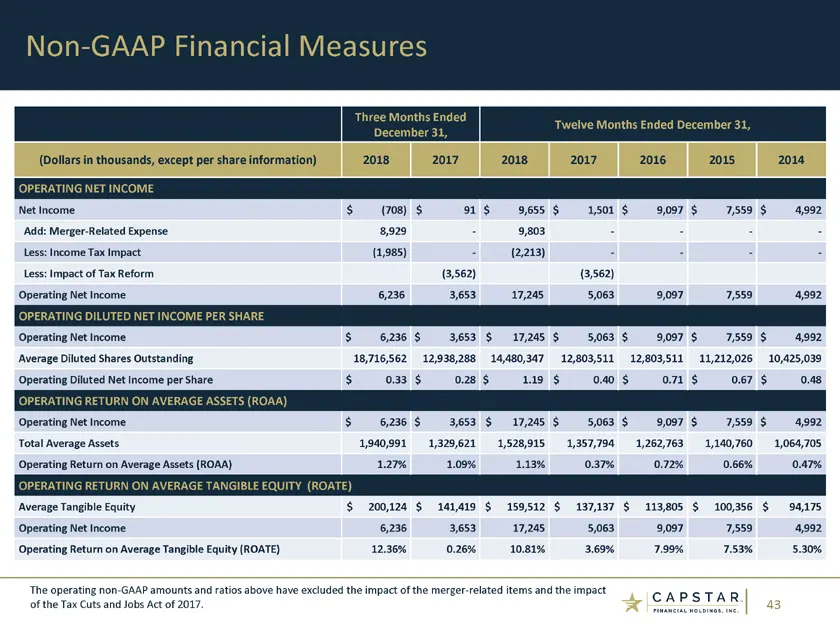
Slide 43: Operating Net Income Reconciliation
43 Three Months Ended December 31, Twelve Months Ended December 31, (Dollars in thousands, except per share information) 2018 2017 2018 2017 2016 2015 2014 OPERATING NET INCOME Net Income $ (708) $ 91 $ 9,655 $ 1,501 $ 9,097 $ 7,559 $ 4,992 Add: Merger-Related Expense 8,929—9,803 — — Less: Income Ta
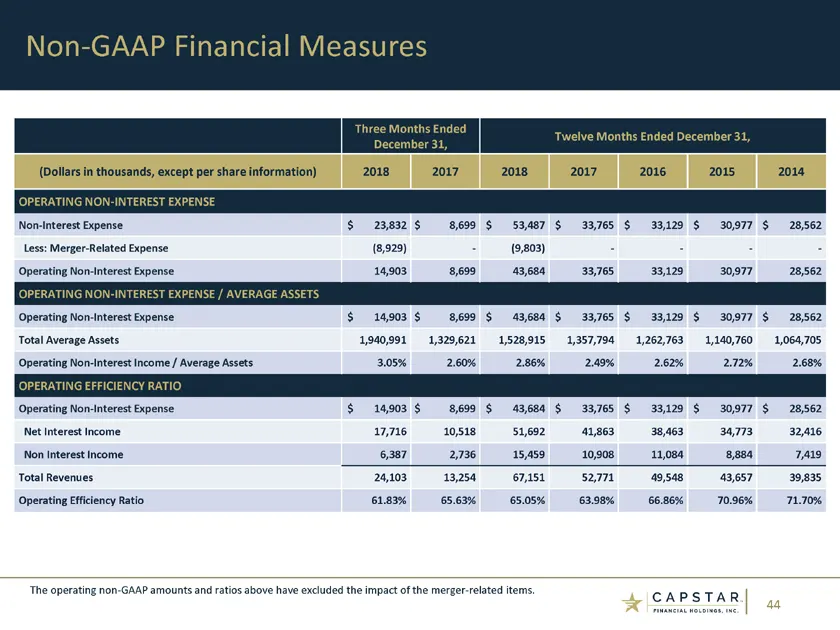
Slide 44: Operating Non-Interest Expense and Efficiency Ratio
44 Three Months Ended December 31, Twelve Months Ended December 31, (Dollars in thousands, except per share information) 2018 2017 2018 2017 2016 2015 2014 OPERATING NON-INTEREST EXPENSE Non-Interest Expense $ 23,832 $ 8,699 $ 53,487 $ 33,765 $ 33,129 $ 30,977 $ 28,562 Less: Merger-Related Expense (

Slide 45: CapStar Financial Holdings, Inc.
cAps T A RTM FINANCIAL HOLDINGS, INC.
Source: SEC EDGAR · 8-K filed Feb 19, 2019
More decks from Capstar Financial Holdings Inc
 Q4 2023 Earnings Presentation6 slides · Jan 23, 2024
 Merger or Acquisition (October 2023)16 slides · Oct 26, 2023
 Q2 2023 Earnings Presentation22 slides · Jul 21, 2023
 Q1 2023 Earnings Presentation32 slides · Apr 21, 2023
 Q4 2022 Earnings Presentation27 slides · Jan 20, 2023
 Investor Presentation (December 2022)31 slides · Dec 13, 2022