Capstar Financial Holdings Inc
Capstar Financial — Q4 2022 Earnings Presentation
27 slides from Capstar Financial's earnings presentation, Jan 20, 2023
Slide 1: Fourth Quarter 2022 Earnings Call
Fourth Quarter 2022 Earnings Call January 20, 2023
Slide 2: Forward-Looking Statements
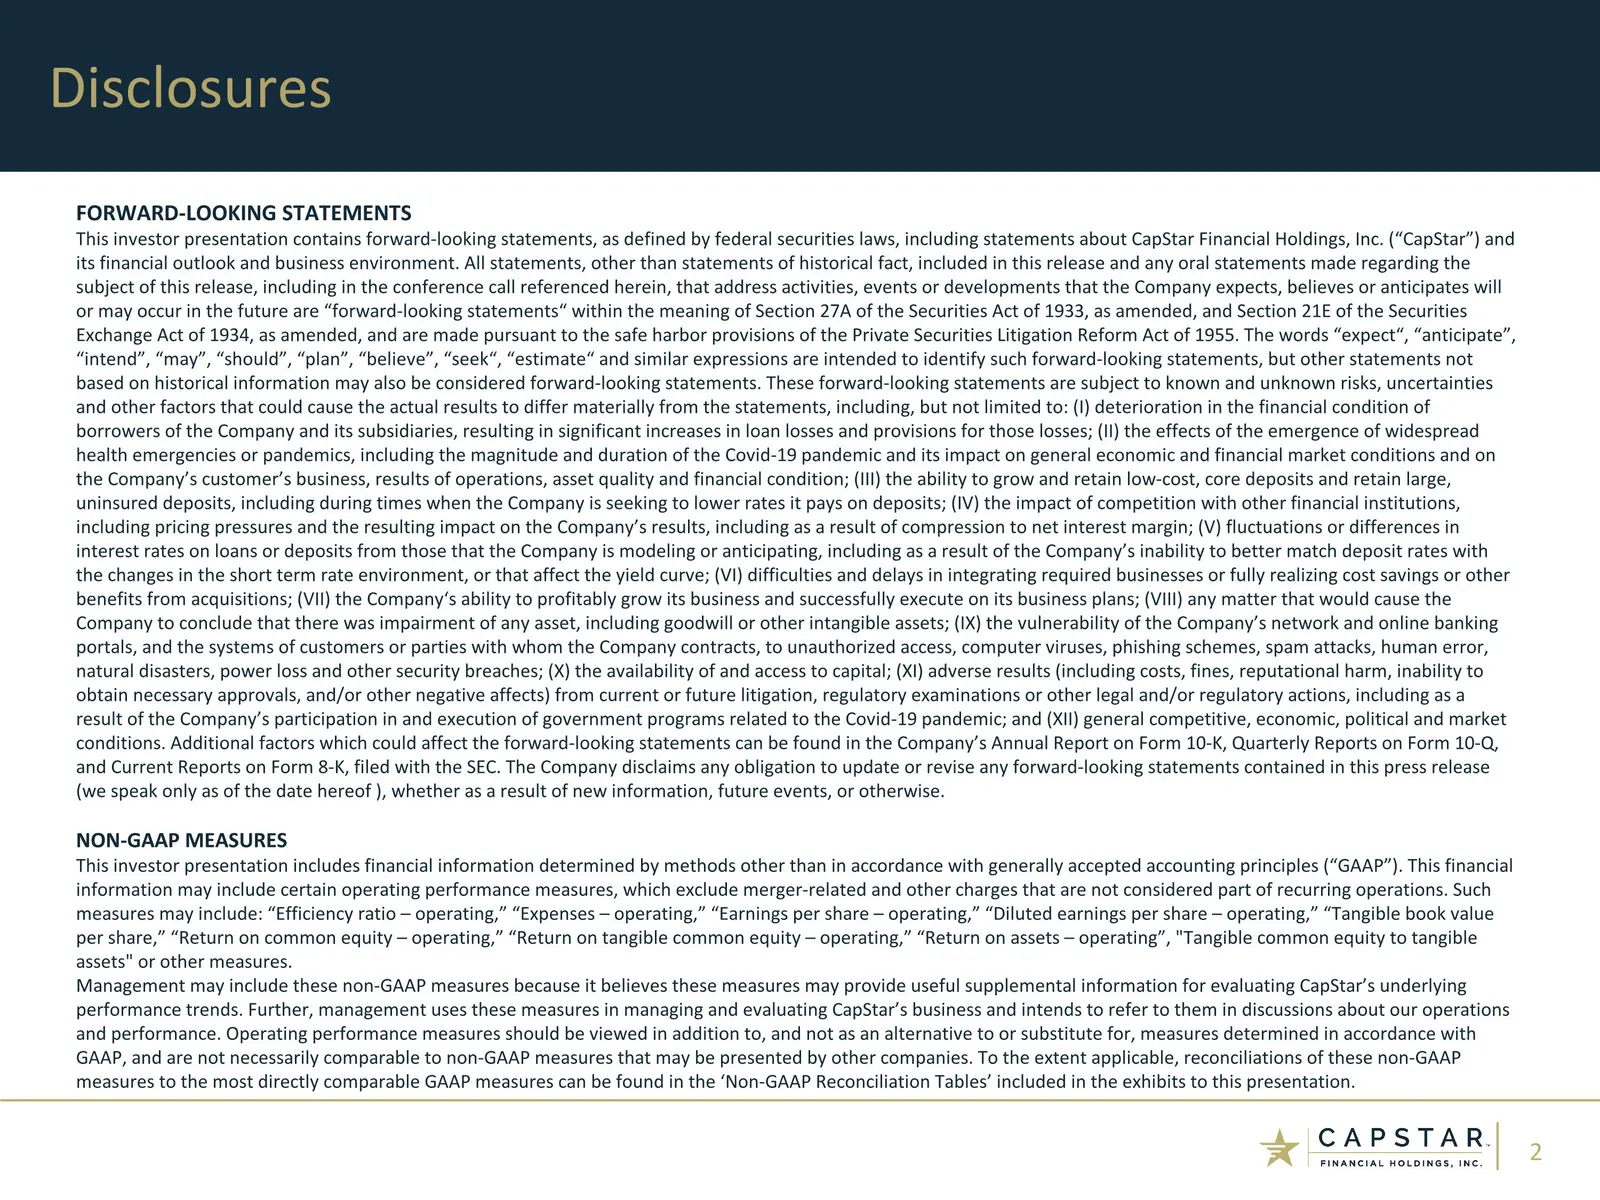
FORWARD-LOOKING STATEMENTS This investor presentation contains forward-looking statements, as defined by federal securities laws, including statements about CapStar Financial Holdings, Inc. (“CapStar”) and its financial outlook and business environment. All statements, other than statements of histo
Slide 3: Highlights
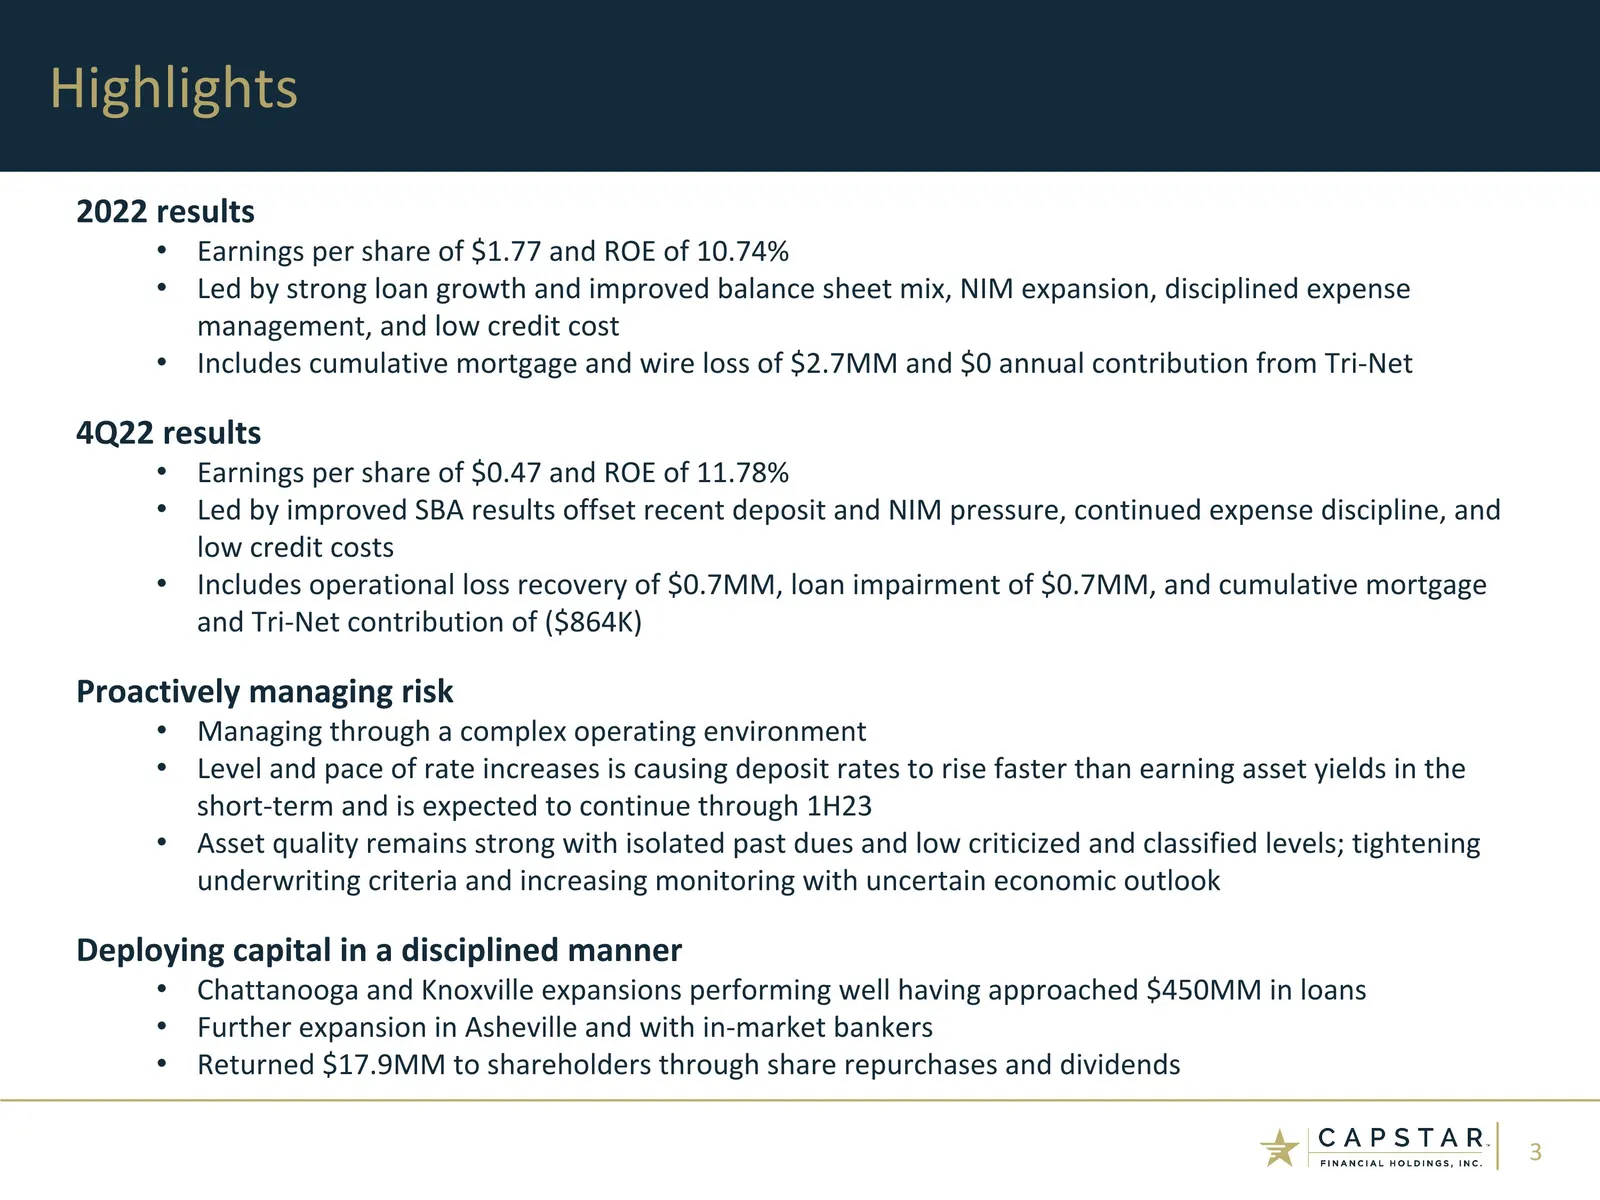
2022 results Earnings per share of $1.77 and ROE of 10.74% Led by strong loan growth and improved balance sheet mix, NIM expansion, disciplined expense management, and low credit cost Includes cumulative mortgage and wire loss of $2.7MM and $0 annual contribution from Tri-Net 4Q22 results Earnings p
Slide 4: 4Q22 Financial Results
4Q22 Financial Results CAPSTAR, 4 FINANCIAL HOLDINGS, INC.
Slide 5: Financial Results
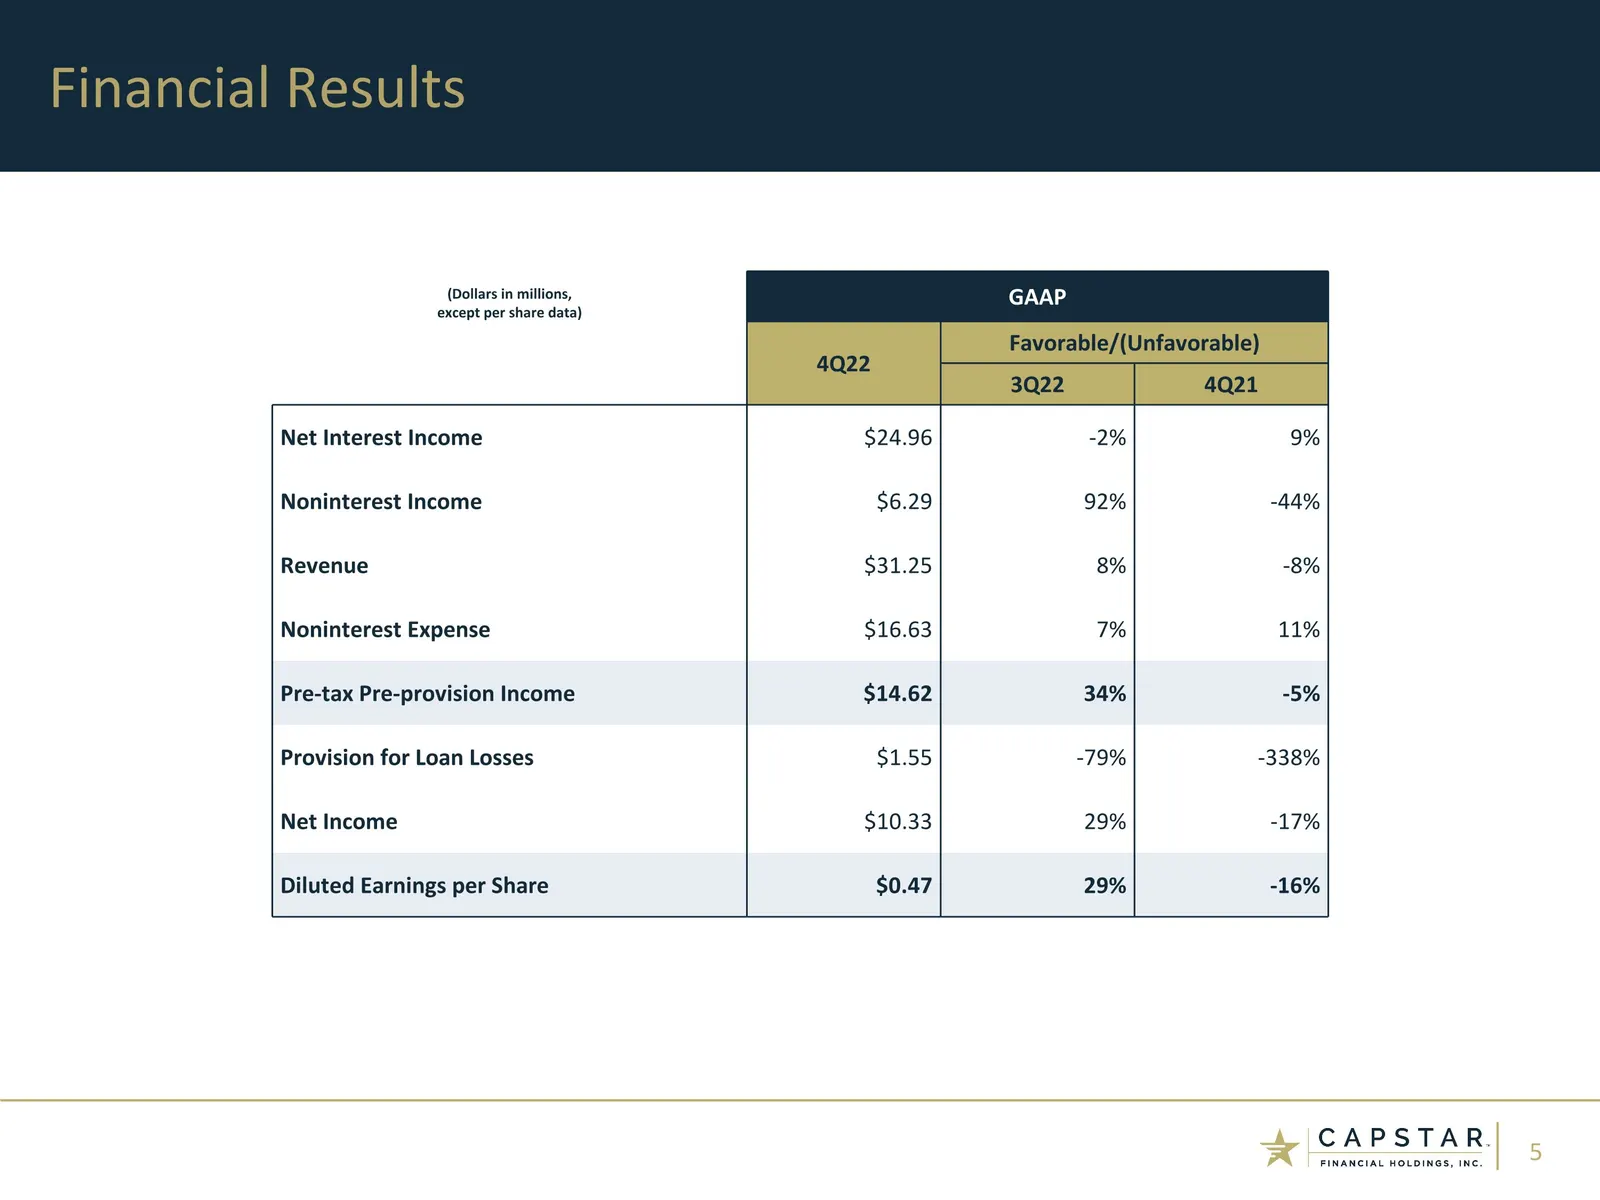
Financial Results (Dollars in millions, except per share data) GAAP 4Q22 Favorable/(Unfavorable) 3Q22 4Q21 Net Interest Income $24.96 -2% 9% Noninterest Income $6.29 92% -44% Revenue $31.25 8% -8% Noninterest Expense $16.63 7% 11% Pre-tax Pre-provision Income $14.62 34% -5% Provision for Loan Losses
Slide 6: Key Performance Indicators
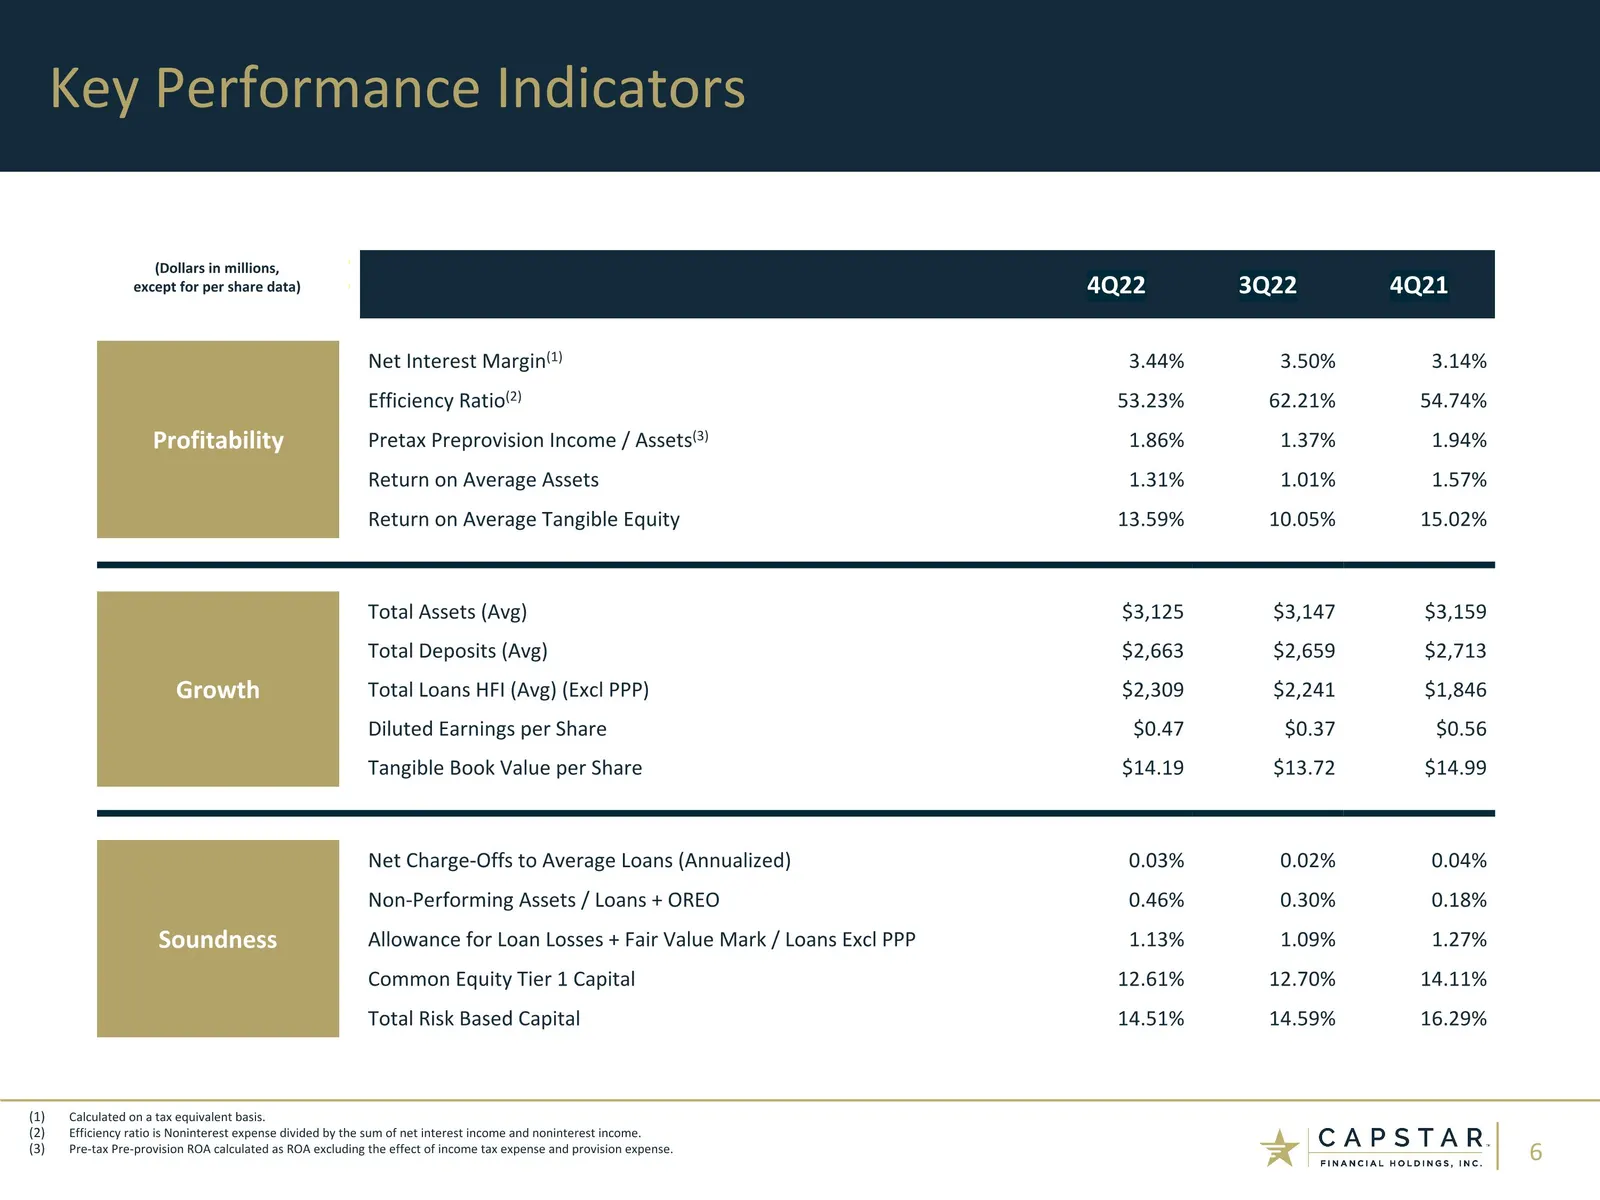
4Q22 3Q22 4Q21 Profitability Net Interest Margin(1) 3.44% 3.50% 3.14% Efficiency Ratio(2) 53.23% 62.21% 54.74% Pretax Preprovision Income / Assets(3) 1.86% 1.37% 1.94% Return on Average Assets 1.31% 1.01% 1.57% Return on Average Tangible Equity 13.59% 10.05% 15.02% Growth Total Assets (Avg) $3,125 $
Slide 7: Net Interest Income / Margin
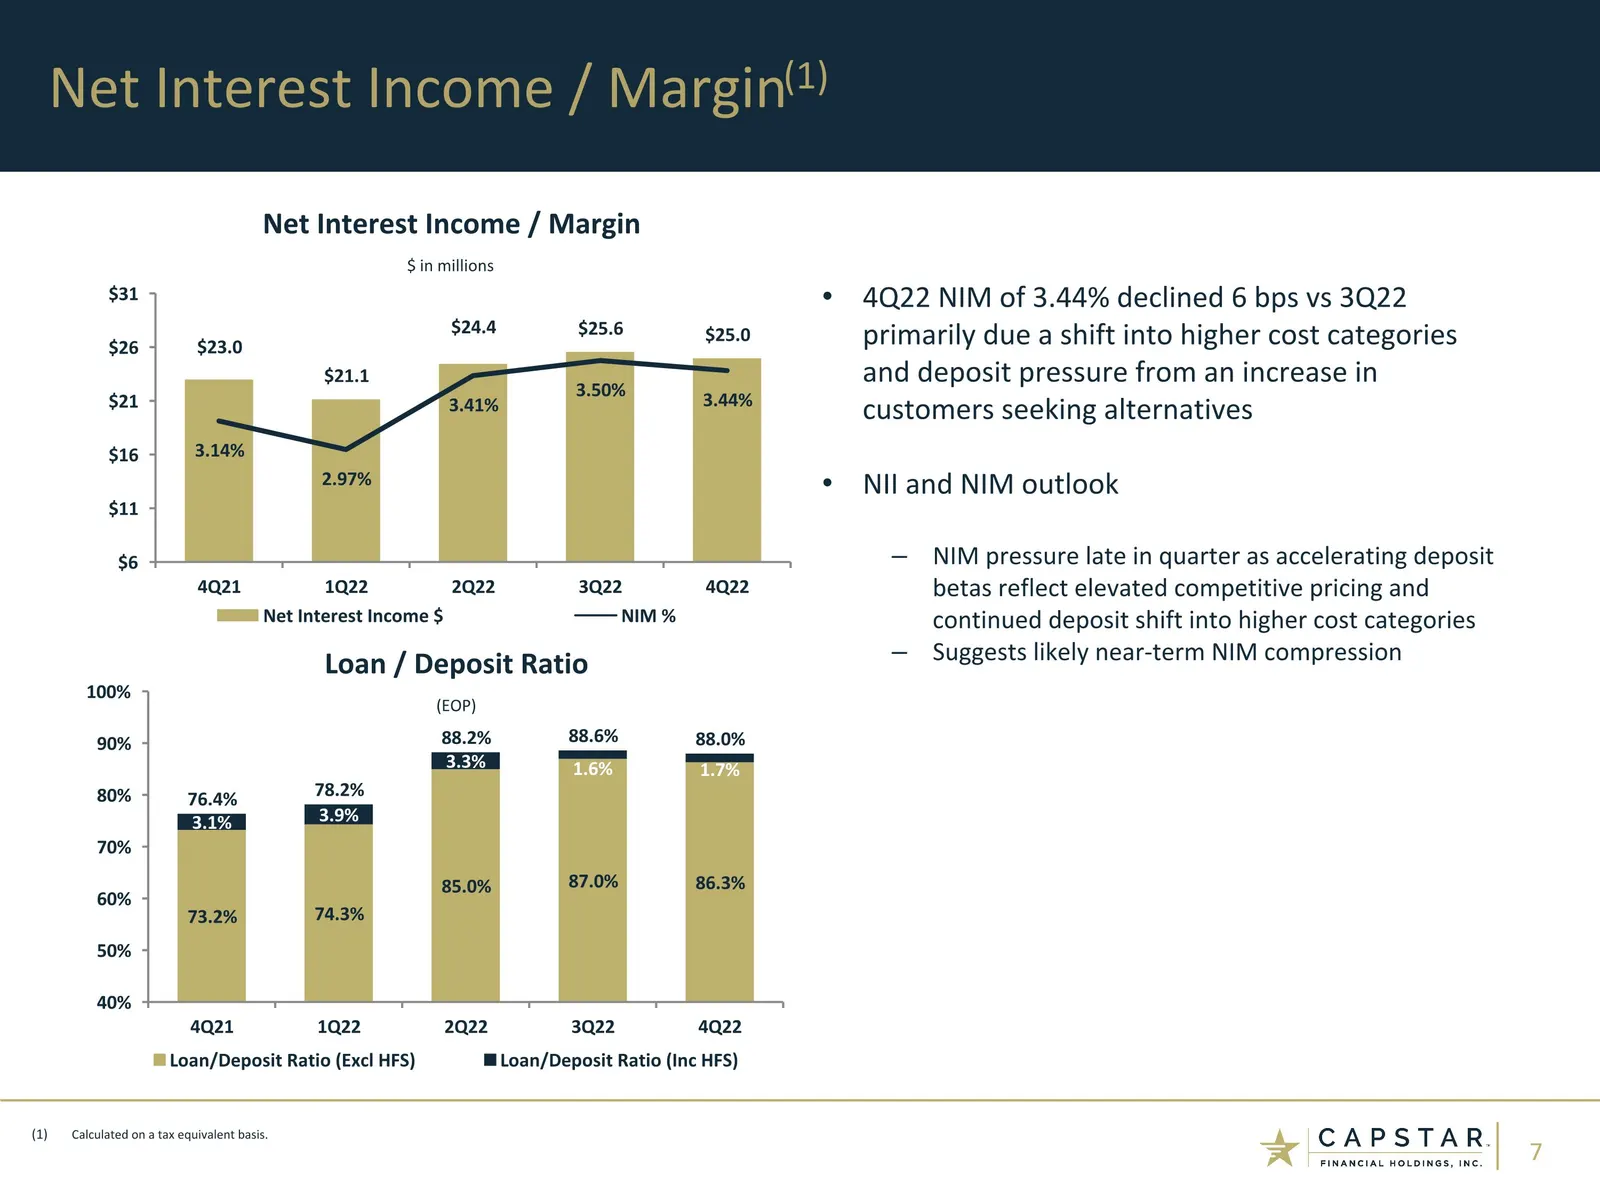
Net Interest Income / Margin(1) Calculated on a tax equivalent basis. 4Q22 NIM of 3.44% declined 6 bps vs 3Q22 primarily due a shift into higher cost categories and deposit pressure from an increase in customers seeking alternatives NII and NIM outlook NIM pressure late in quarter as accelerating de
Slide 8: Deposit Growth and Costs
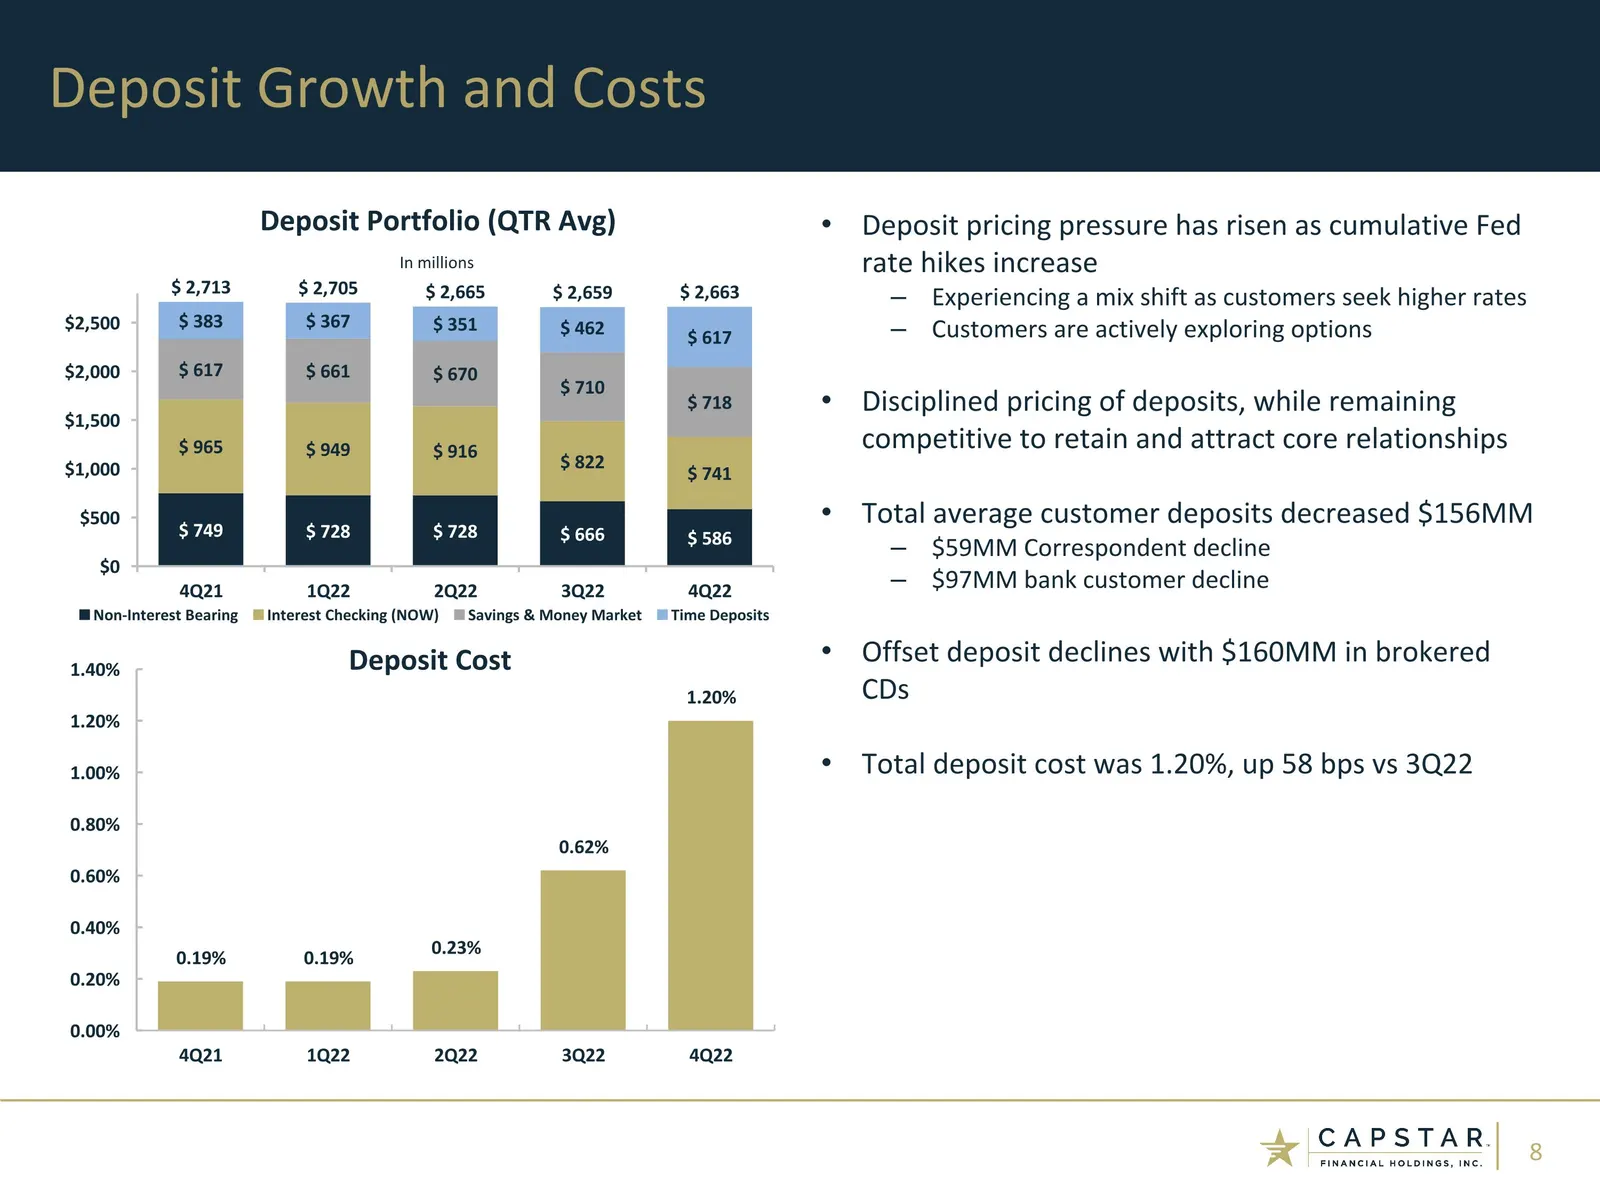
Deposit Growth and Costs Deposit pricing pressure has risen as cumulative Fed rate hikes increase Experiencing a mix shift as customers seek higher rates Customers are actively exploring options Disciplined pricing of deposits, while remaining competitive to retain and attract core relationships Tot
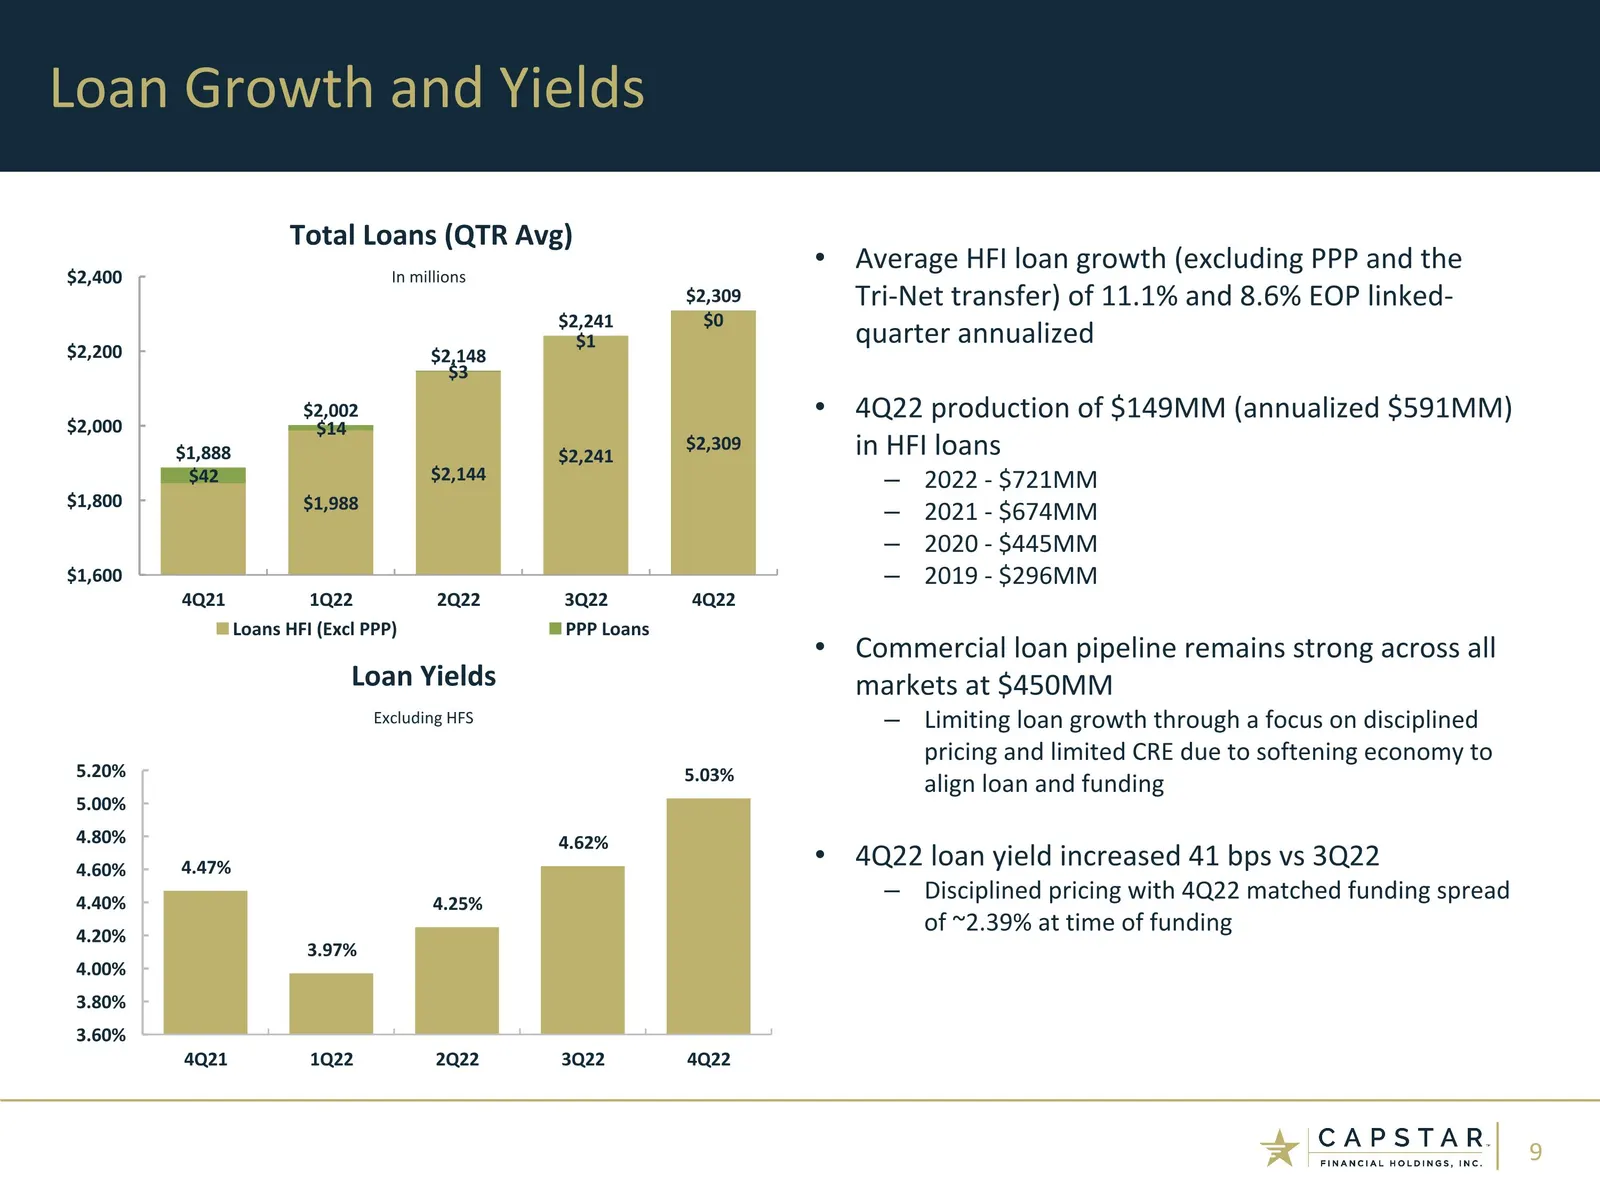
Slide 9: Loan Growth and Yields
Loan Growth and Yields Average HFI loan growth (excluding PPP and the Tri-Net transfer) of 11.1% and 8.6% EOP linked-quarter annualized 4Q22 production of $149MM (annualized $591MM) in HFI loans 2022 - $721MM 2021 - $674MM 2020 - $445MM 2019 - $296MM Commercial loan pipeline remains strong across al
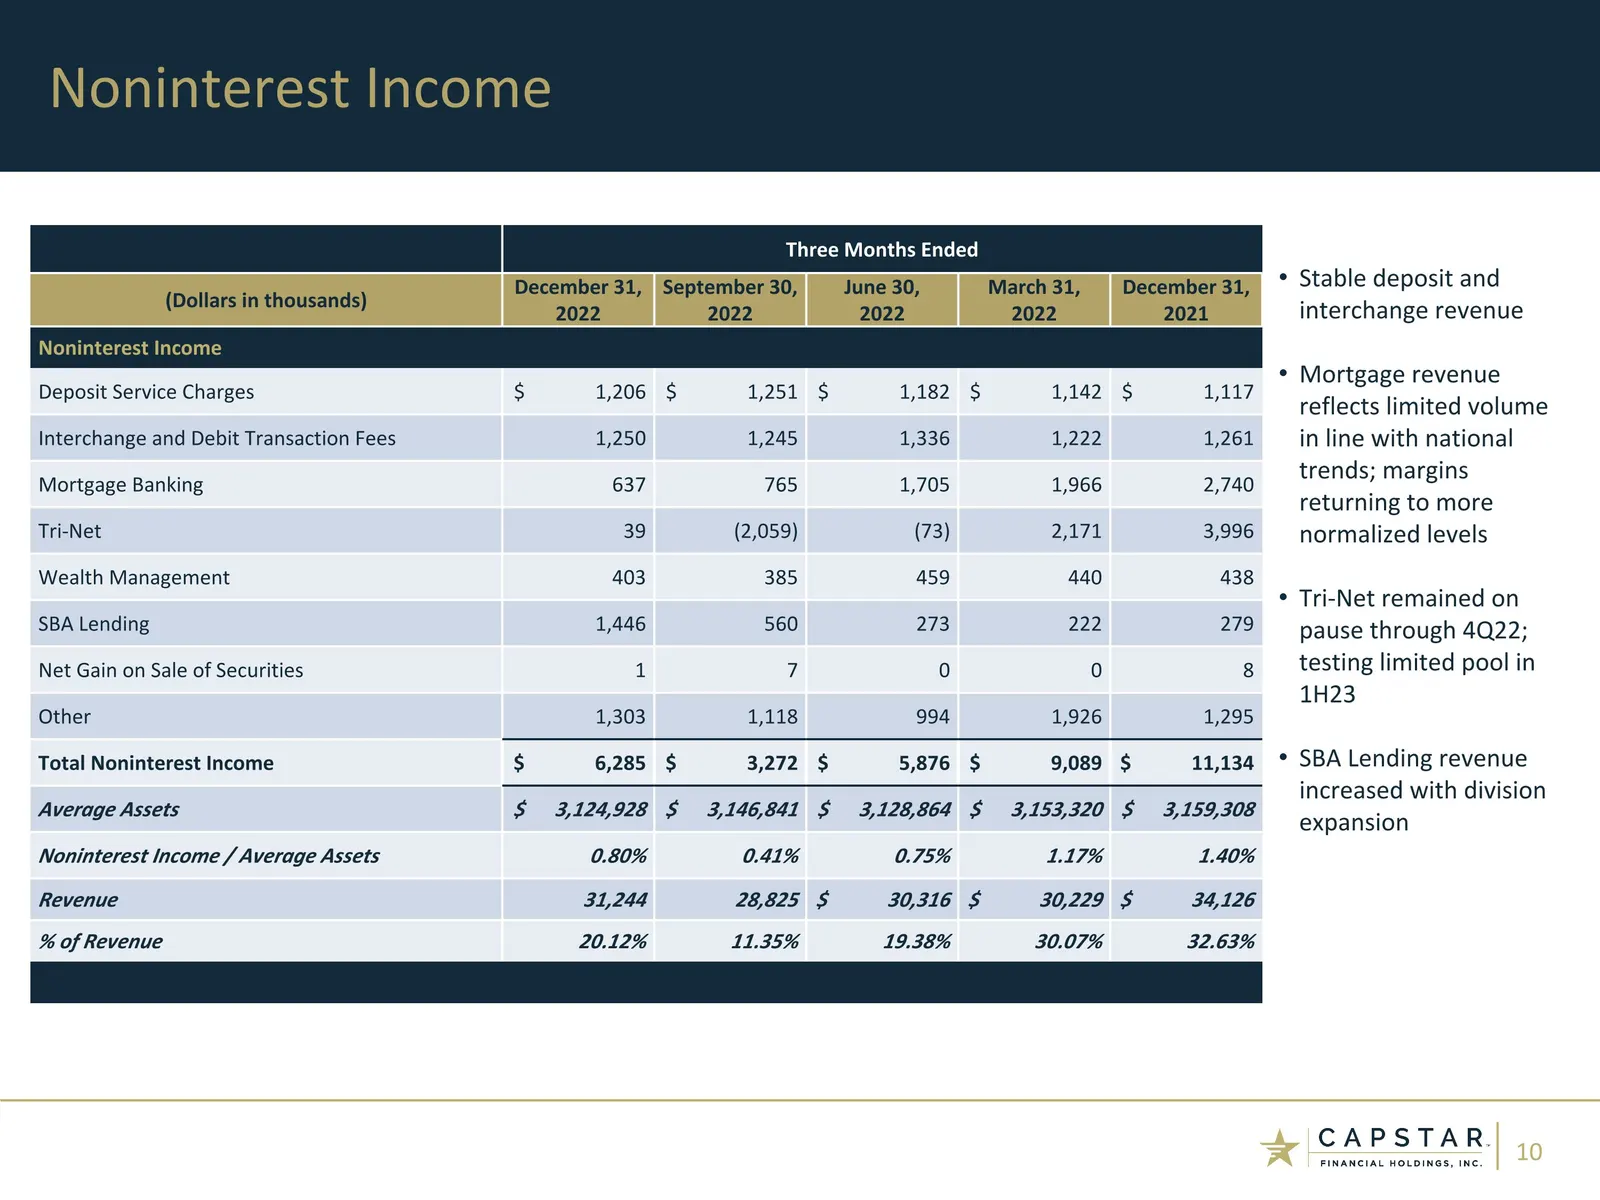
Slide 10: Noninterest Income
Noninterest Income Three Months Ended (Dollars in thousands) December 31, 2022 September 30, 2022 June 30, 2022 March 31, 2022 December 31, 2021 Noninterest Income Deposit Service Charges $ 1,206 $ 1,251 $ 1,182 $ 1,142 $ 1,117 Interchange and Debit Transaction Fees 1,250 1,245 1,336 1,222 1,261 Mor
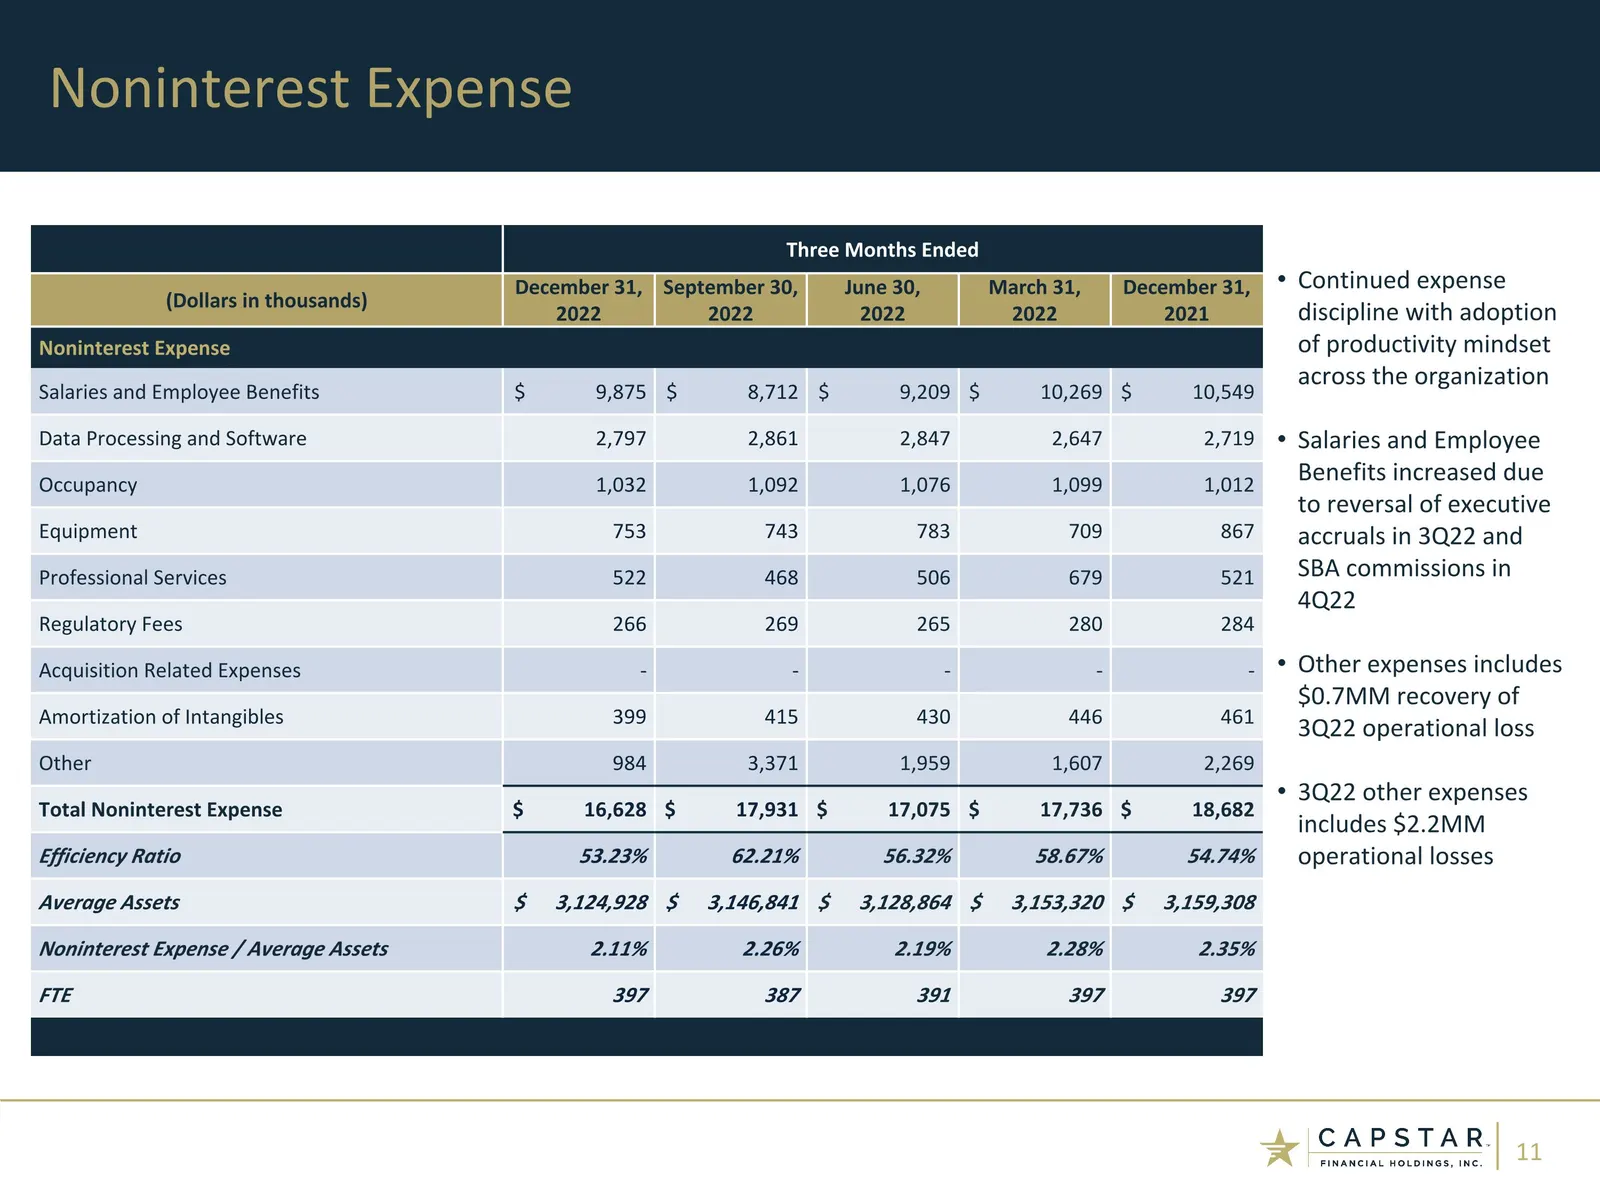
Slide 11: Noninterest Expense
Noninterest Expense Three Months Ended (Dollars in thousands) December 31, 2022 September 30, 2022 June 30, 2022 March 31, 2022 December 31, 2021 Noninterest Expense Salaries and Employee Benefits $ 9,875 $ 8,712 $ 9,209 $ 10,269 $ 10,549 Data Processing and Software 2,797 2,861 2,847 2,647 2,719 Oc
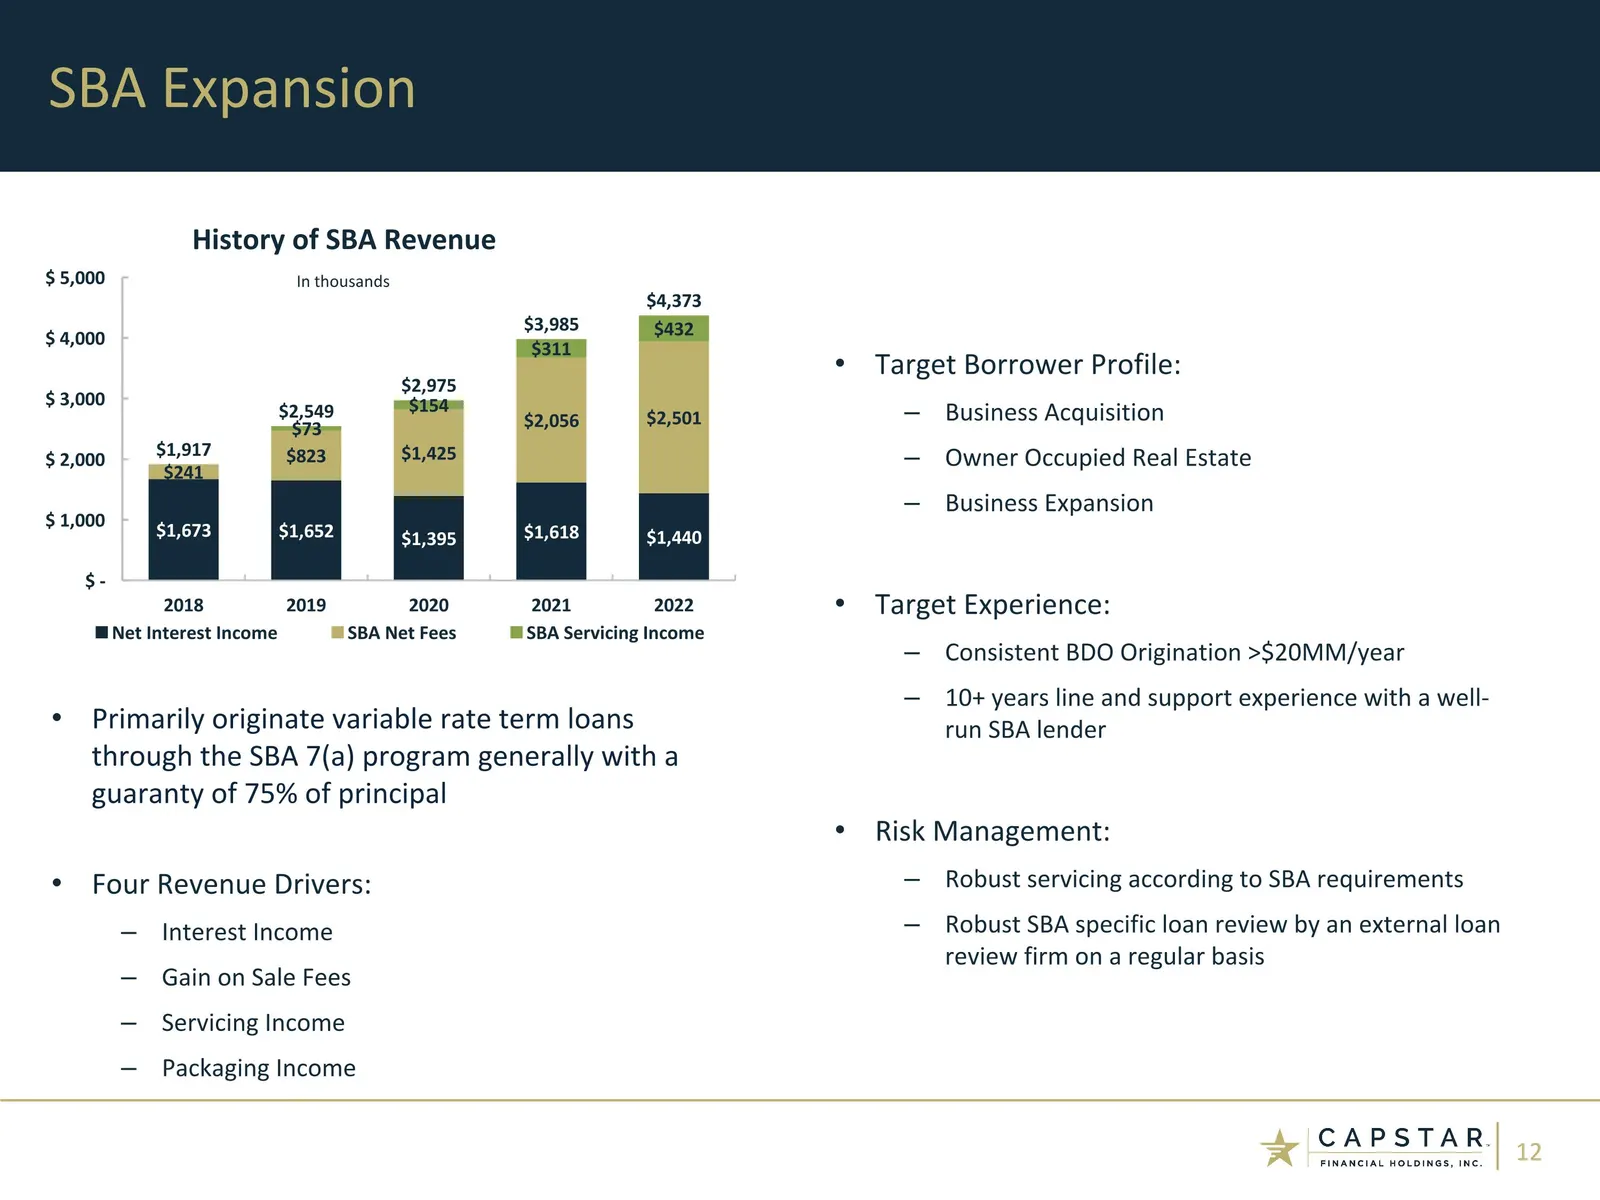
Slide 12: SBA Expansion
SBA Expansion Target Borrower Profile: Business Acquisition Owner Occupied Real Estate Business Expansion Target Experience: Consistent BDO Origination >$20MM/year 10+ years line and support experience with a well-run SBA lender Risk Management: Robust servicing according to SBA requirements Robust
Slide 13: Risk Management
Risk Management CAPSTAR| 45 FINANCIAL HOLDINGS, INC.
Slide 14: Loan Portfolio Performance
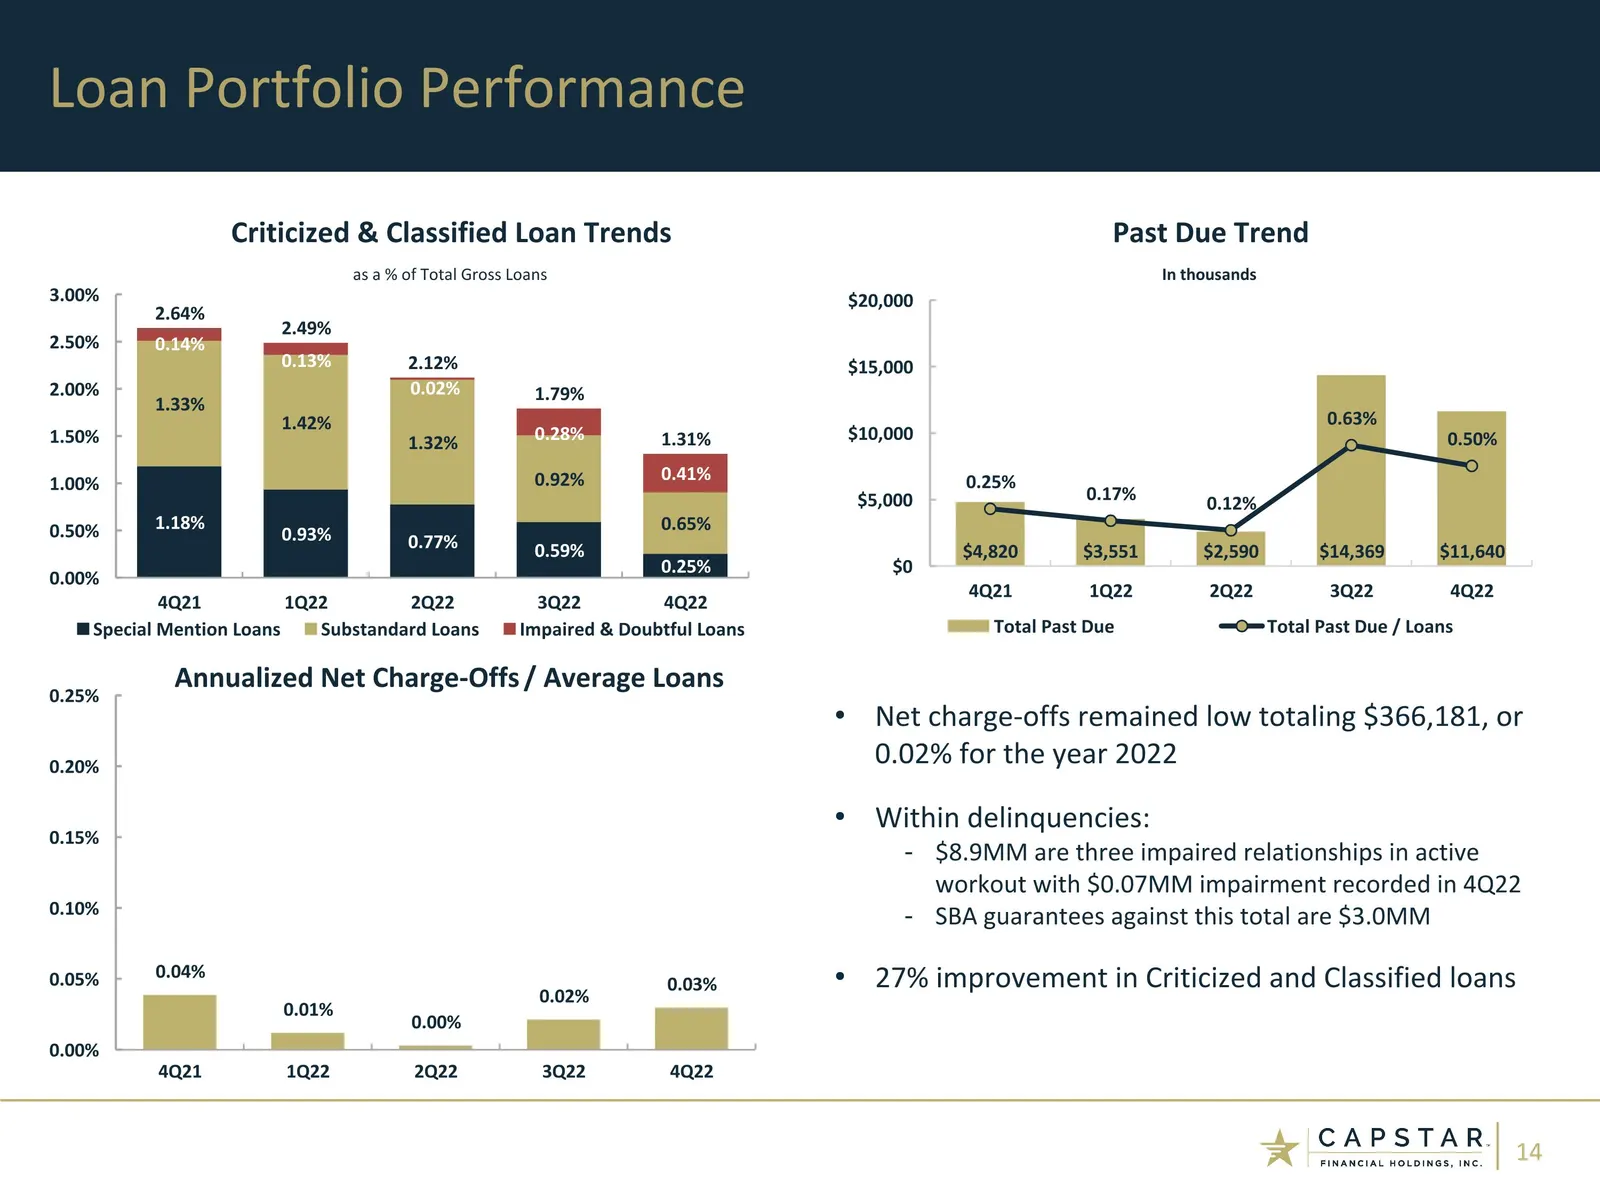
Loan Portfolio Performance (1) Net charge-offs remained low totaling $366,181, or 0.02% for the year 2022 Within delinquencies: $8.9MM are three impaired relationships in active workout with $0.07MM impairment recorded in 4Q22 SBA guarantees against this total are $3.0MM 27% improvement in Criticize
Slide 15: Allowance for Loan Losses
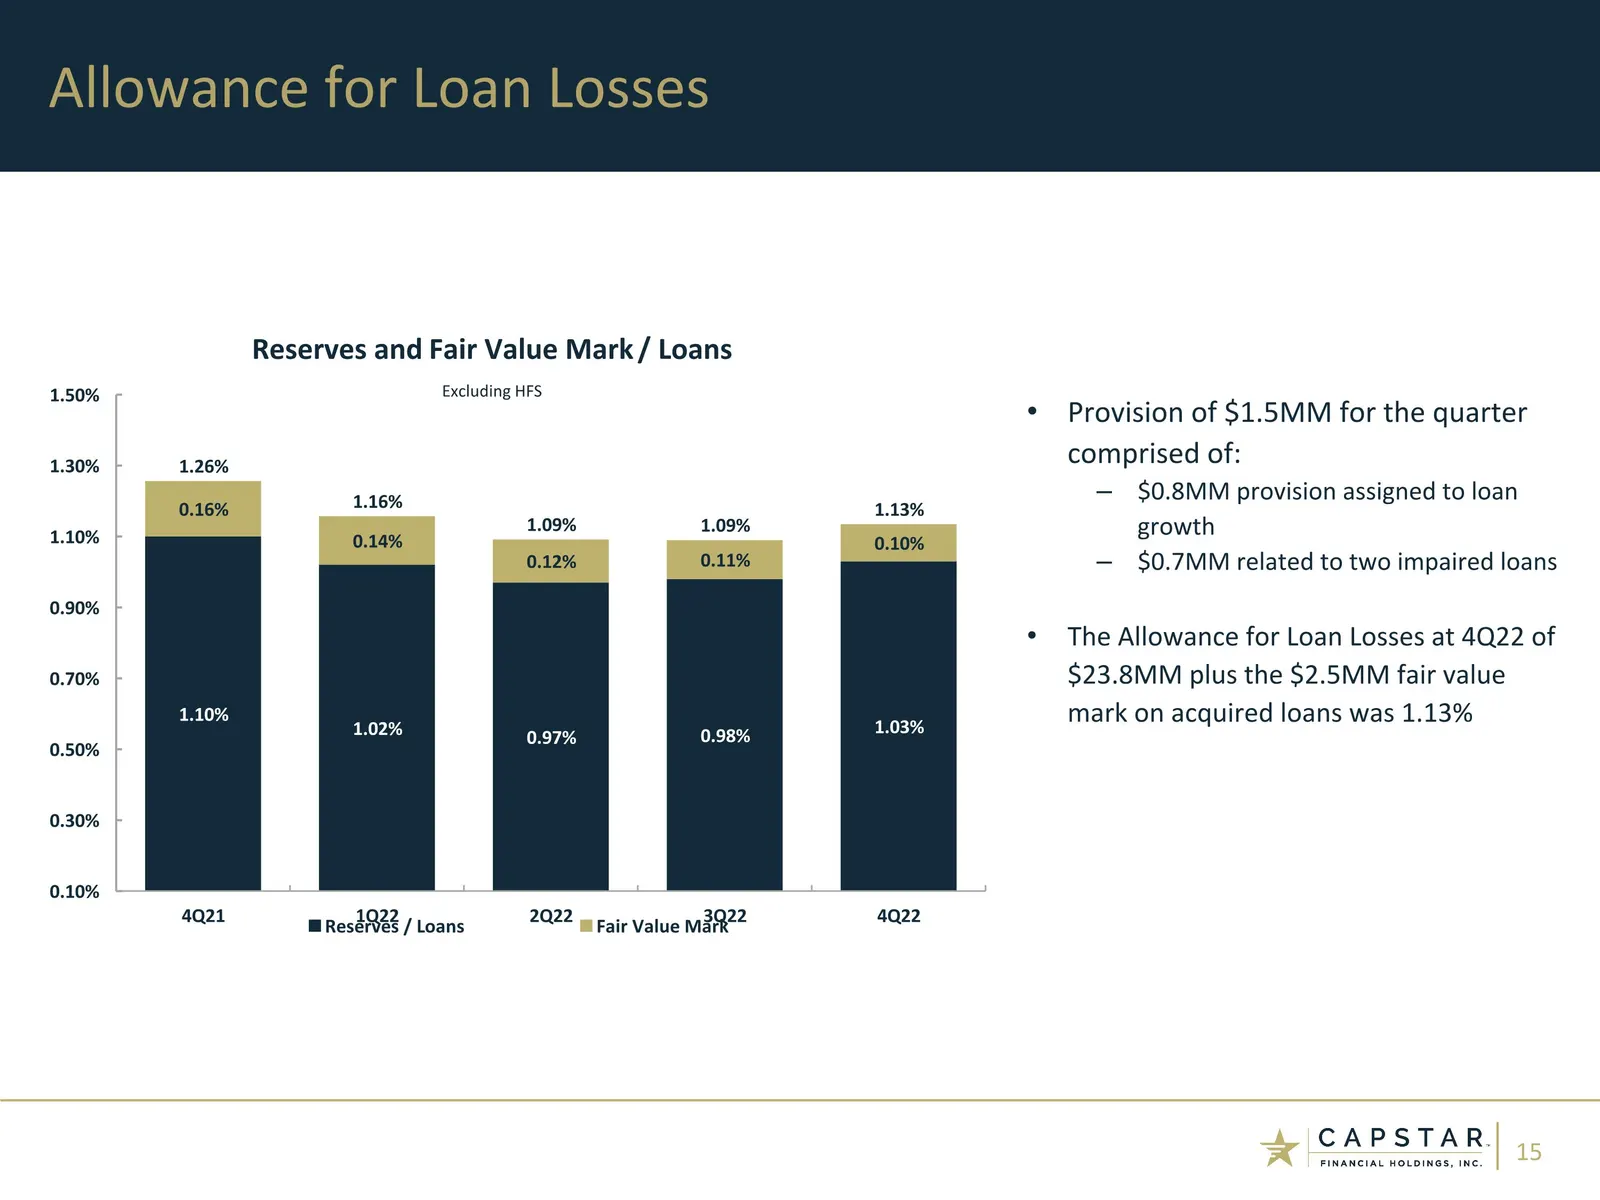
Allowance for Loan Losses Provision of $1.5MM for the quarter comprised of: $0.8MM provision assigned to loan growth $0.7MM related to two impaired loans The Allowance for Loan Losses at 4Q22 of $23.8MM plus the $2.5MM fair value mark on acquired loans was 1.13%
Slide 16: Profitability & Capital Management
Profitability & Capital Management
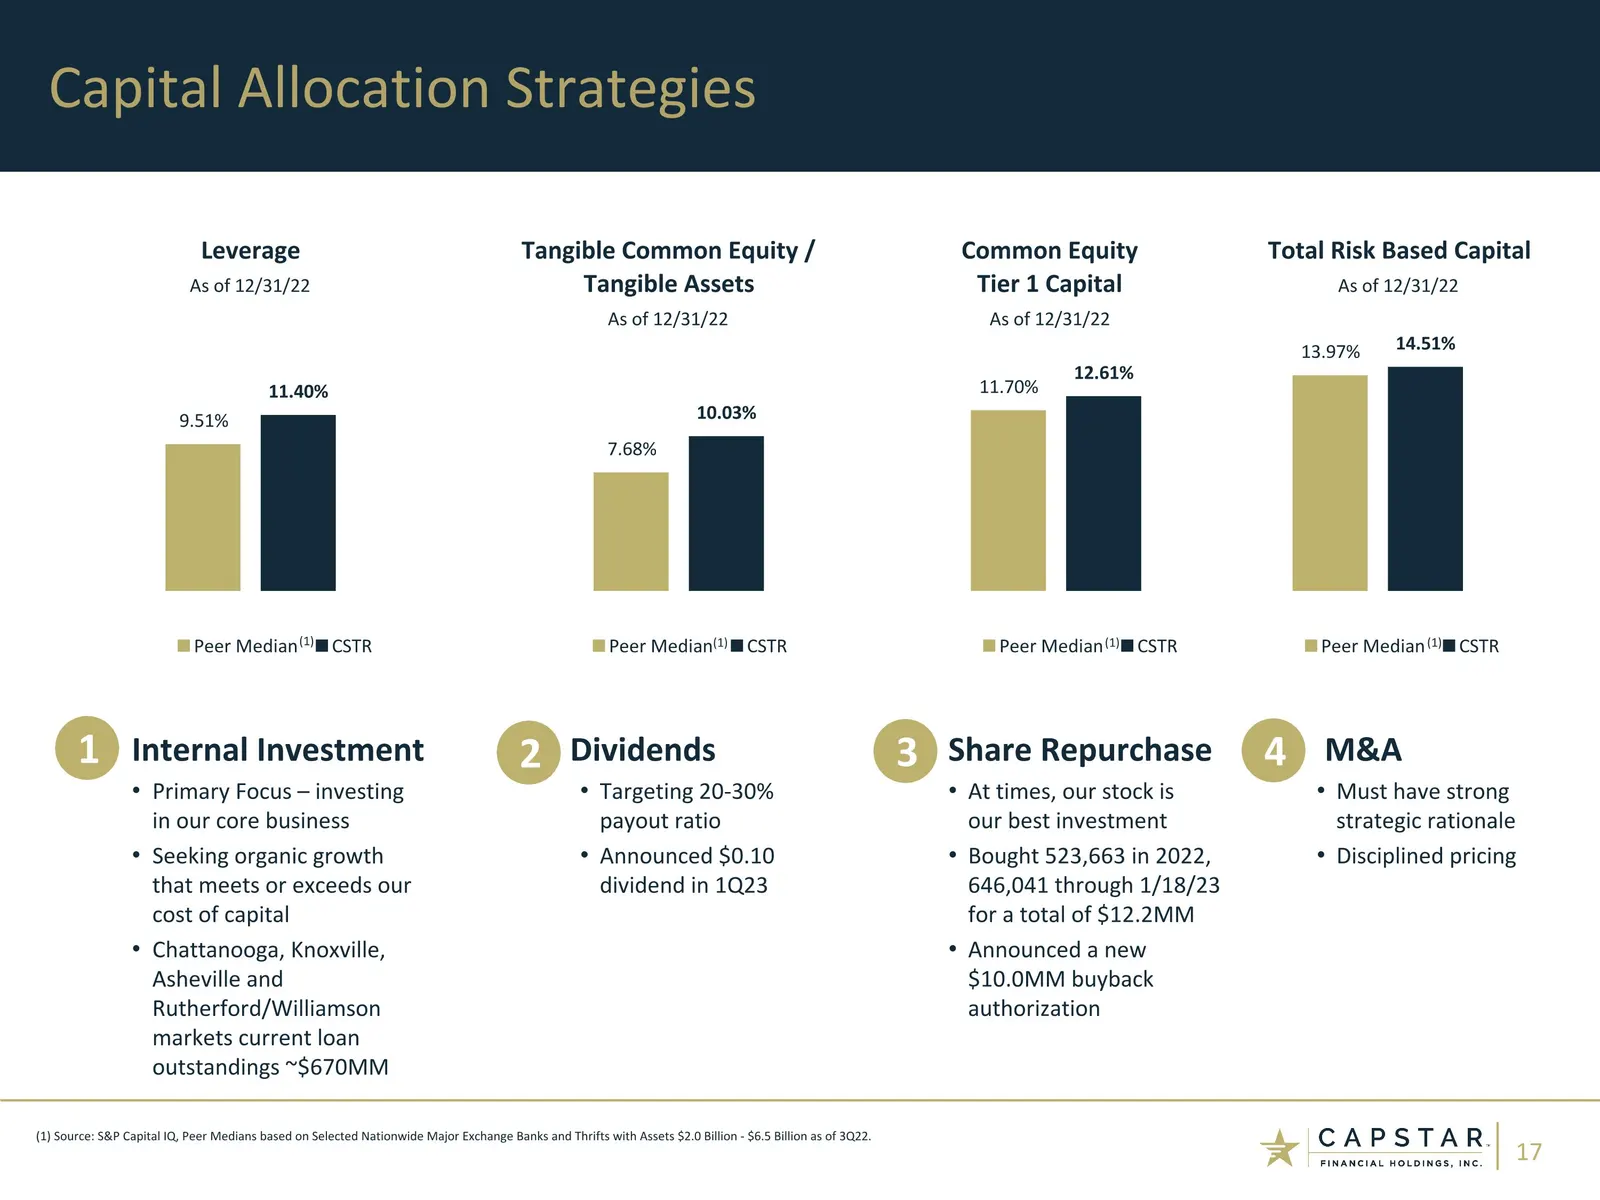
Slide 17: Capital Allocation Strategies
Internal Investment Primary Focus – investing in our core business Seeking organic growth that meets or exceeds our cost of capital Chattanooga, Knoxville, Asheville and Rutherford/Williamson markets current loan outstandings ~$670MM Dividends Targeting 20-30% payout ratio Announced $0.10 dividend i
Slide 18: Looking Forward
Looking Forward CAPSTAR| js FINANCIAL HOLDINGS, INC.
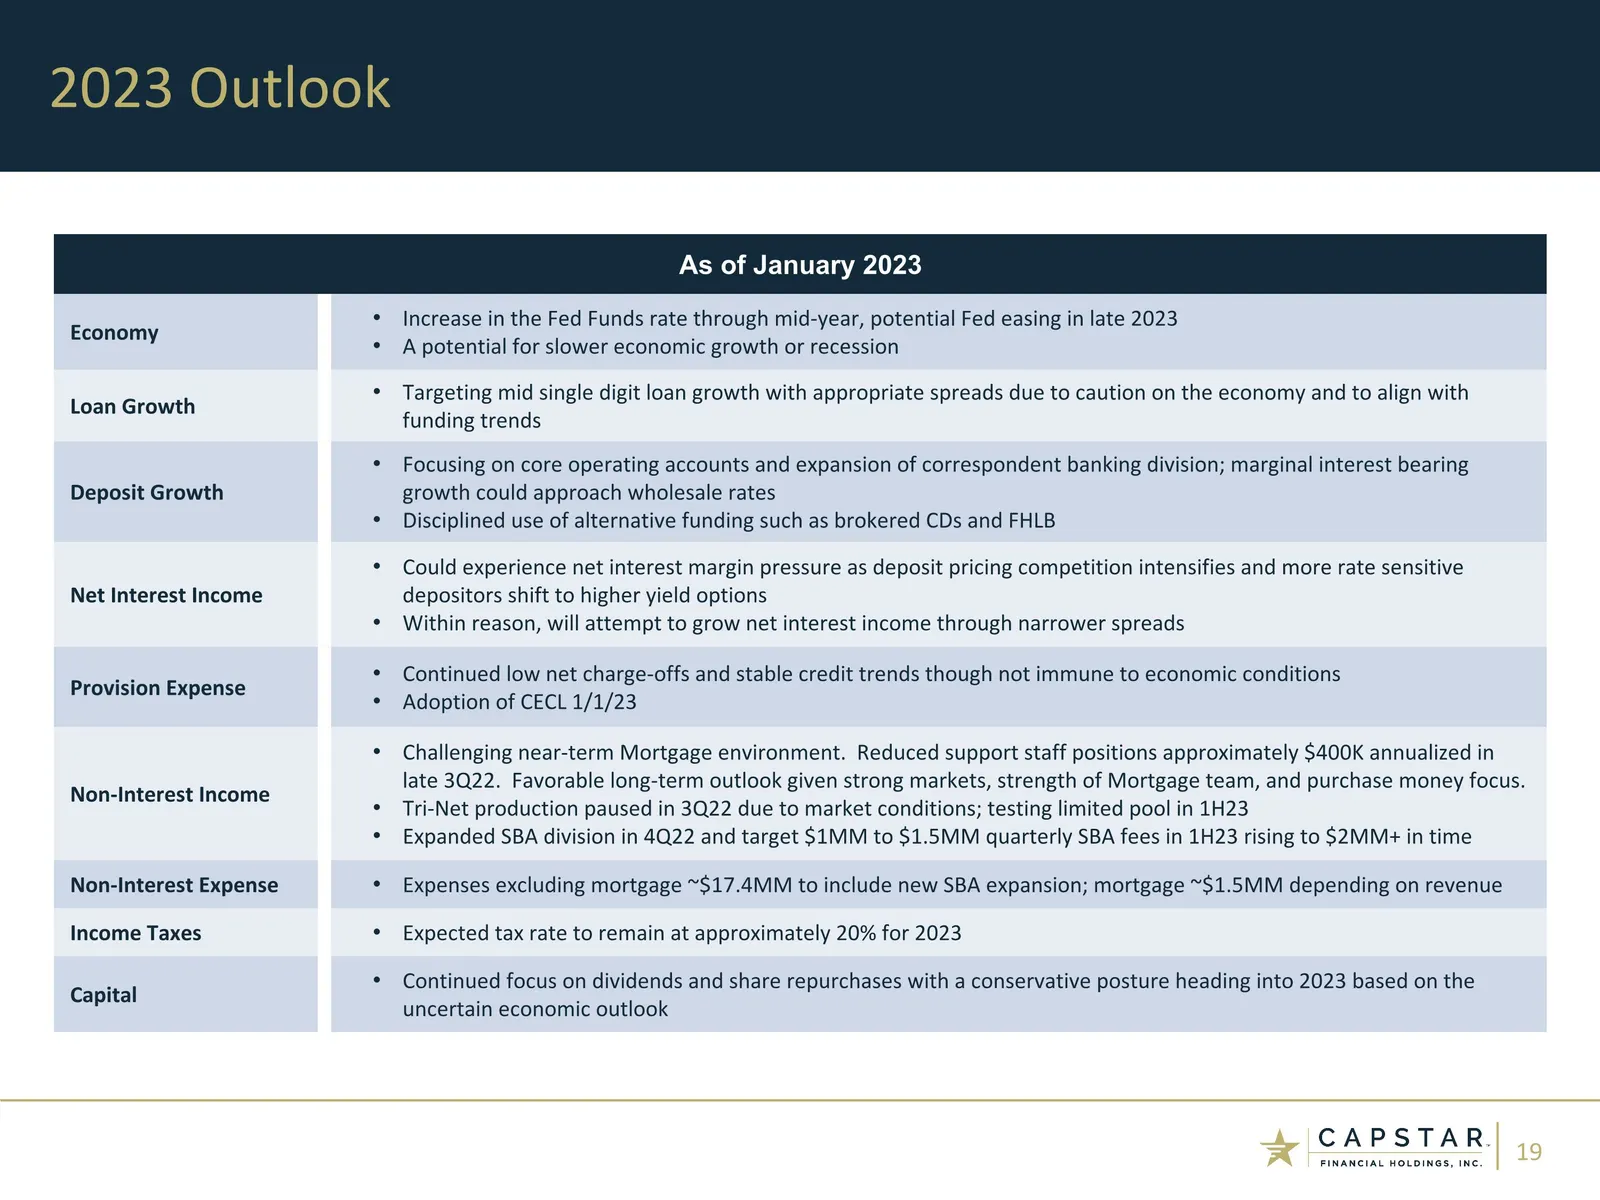
Slide 19: 2023 Outlook
$16.3MM conservative - 2022 budget is $16.2 quarterly 2023 Outlook As of January 2023 Economy Increase in the Fed Funds rate through mid-year, potential Fed easing in late 2023 A potential for slower economic growth or recession Loan Growth Targeting mid single digit loan growth with appropriate spr
Slide 20: Appendix: Other Financial Results and Non-GAAP Reconciliations
Appendix: Other Financial Results and Non-GAAP Reconciliations
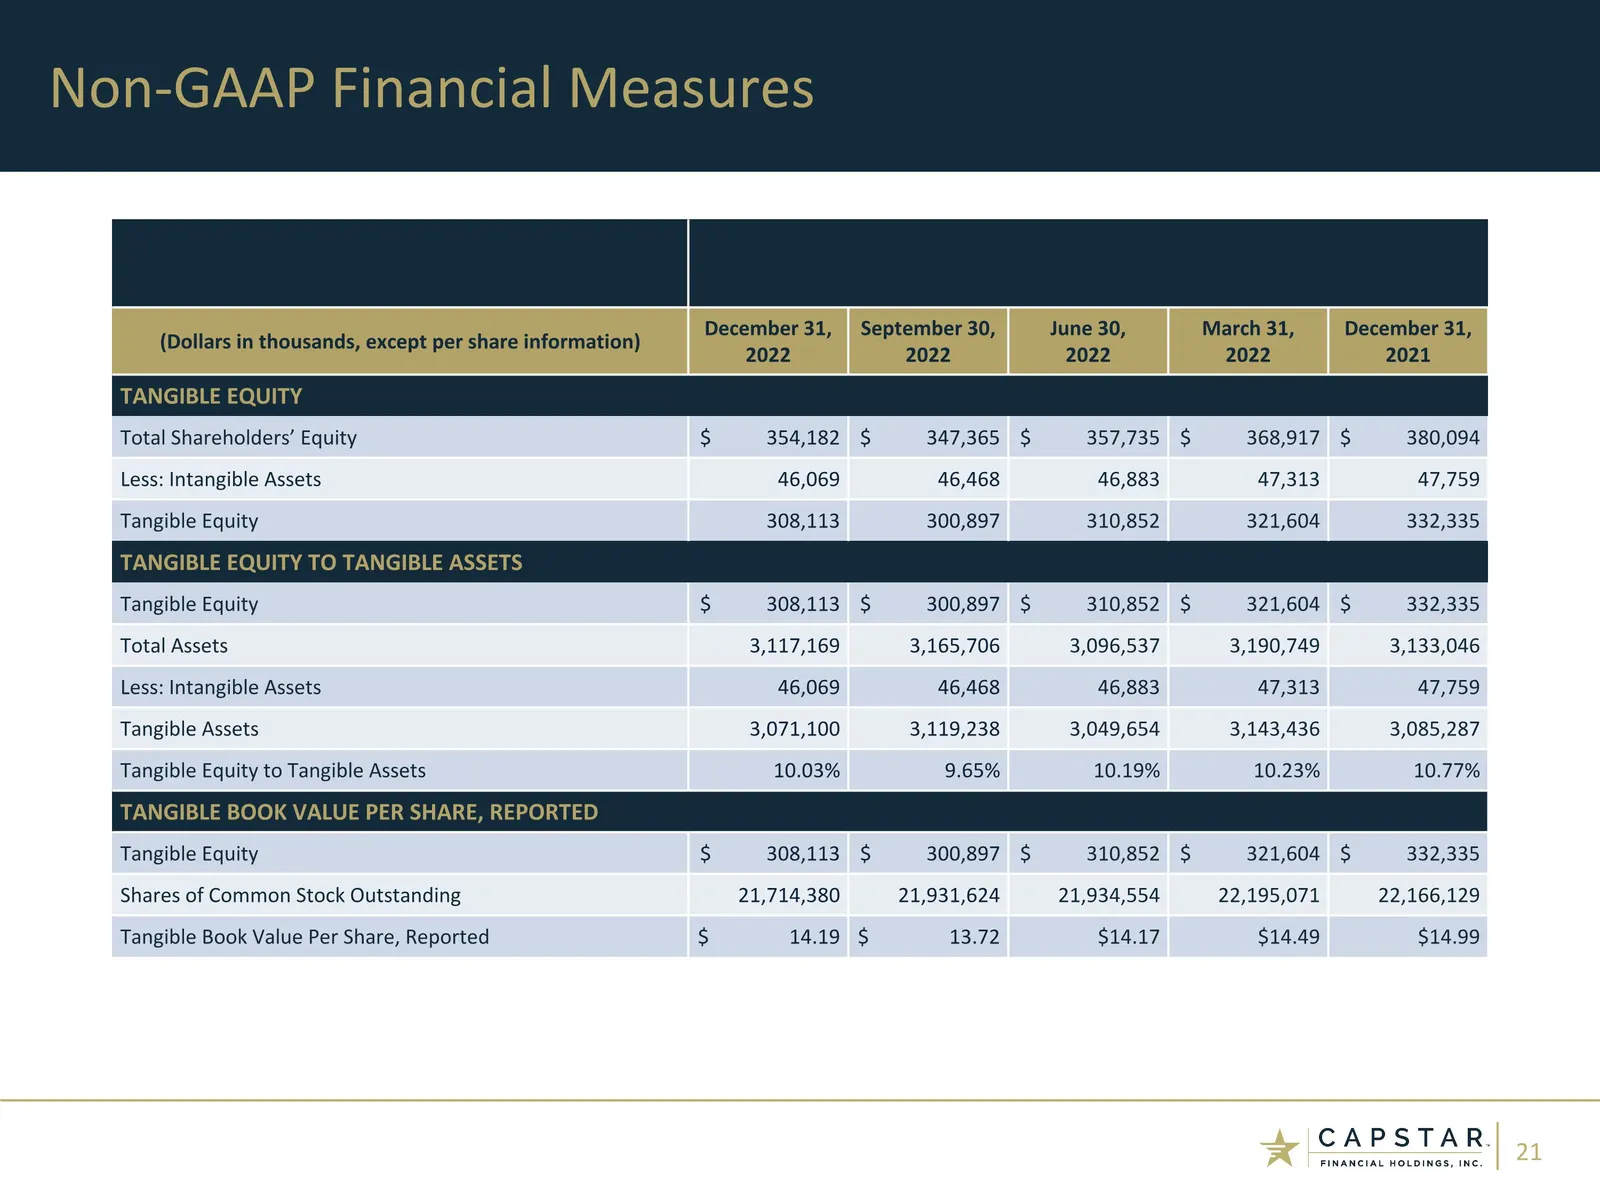
Slide 21: Tangible Equity and Tangible Book Value Reconciliation
(Dollars in thousands, except per share information) December 31, 2022 September 30, 2022 June 30, 2022 March 31, 2022 December 31, 2021 TANGIBLE EQUITY Total Shareholders’ Equity $ 354,182 $ 347,365 $ 357,735 $ 368,917 $ 380,094 Less: Intangible Assets 46,069 46,468 46,883 47,313 47,759 Tangible Eq
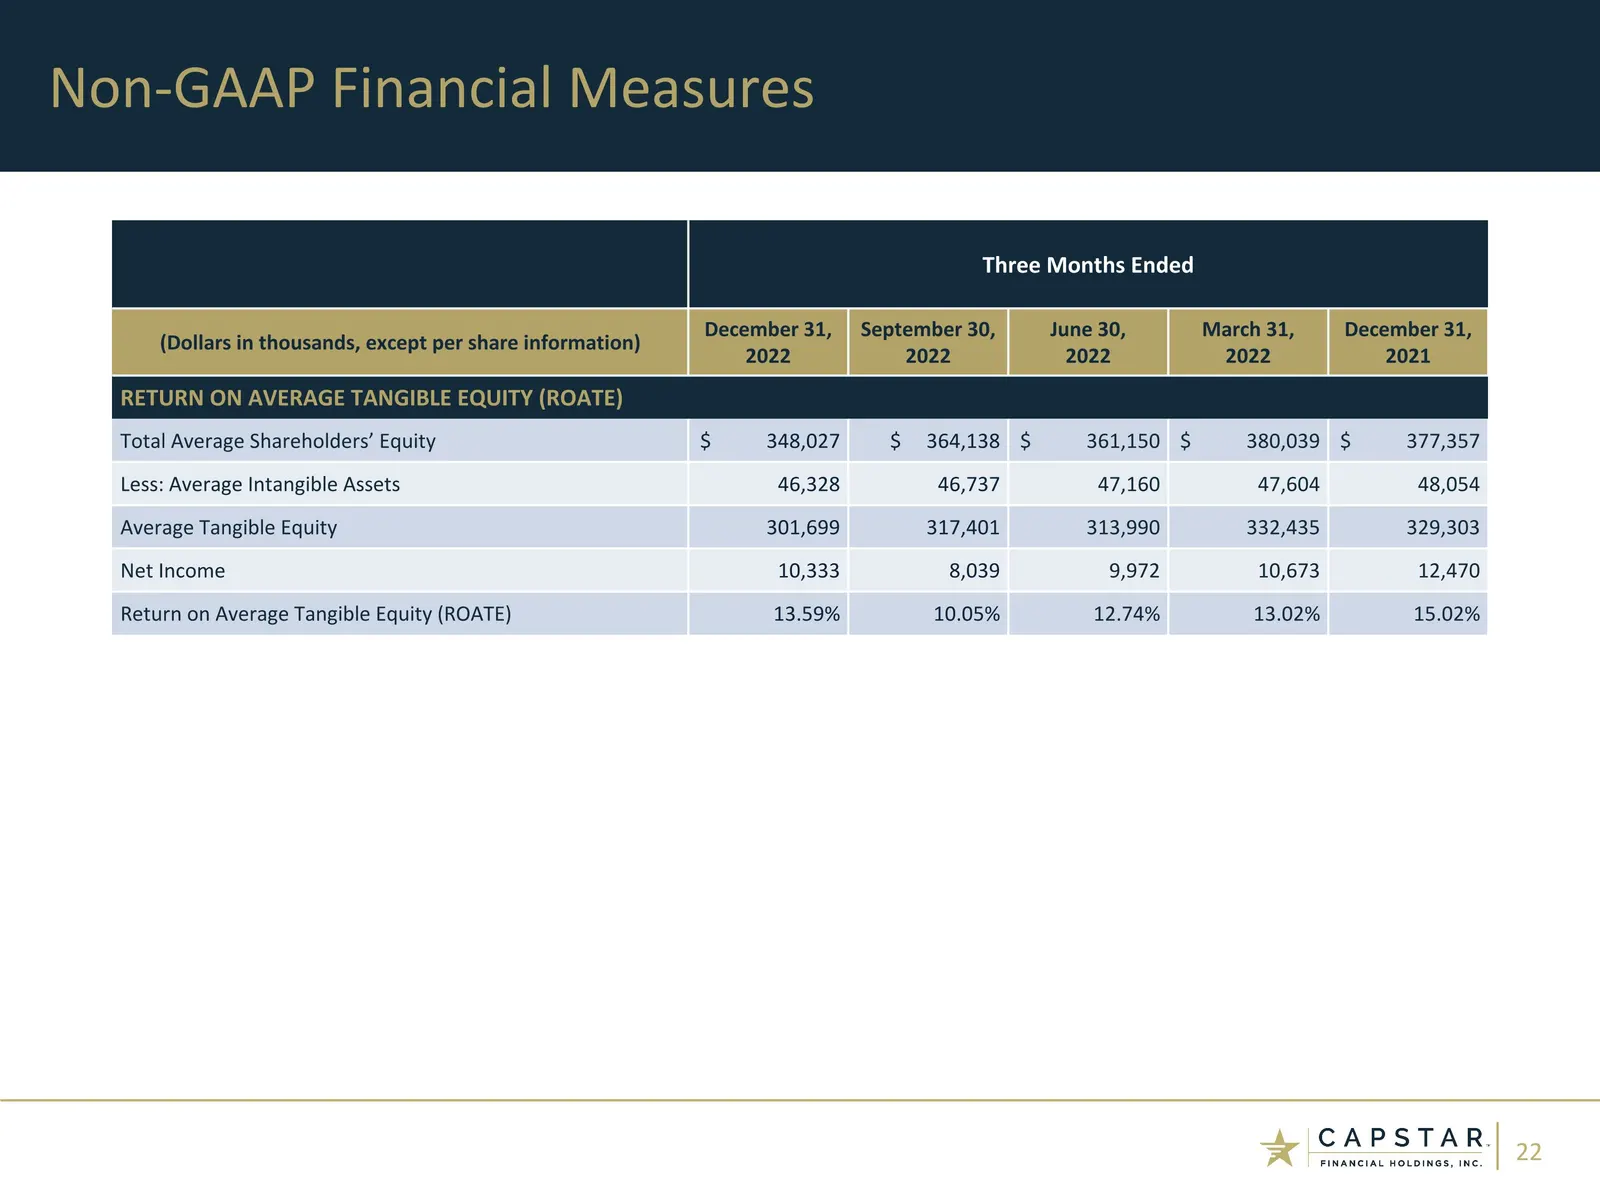
Slide 22: Return on Average Tangible Equity
Three Months Ended (Dollars in thousands, except per share information) December 31, 2022 September 30, 2022 June 30, 2022 March 31, 2022 December 31, 2021 RETURN ON AVERAGE TANGIBLE EQUITY (ROATE) Total Average Shareholders’ Equity $ 348,027 $ 364,138 $ 361,150 $ 380,039 $ 377,357 Less: Average Int
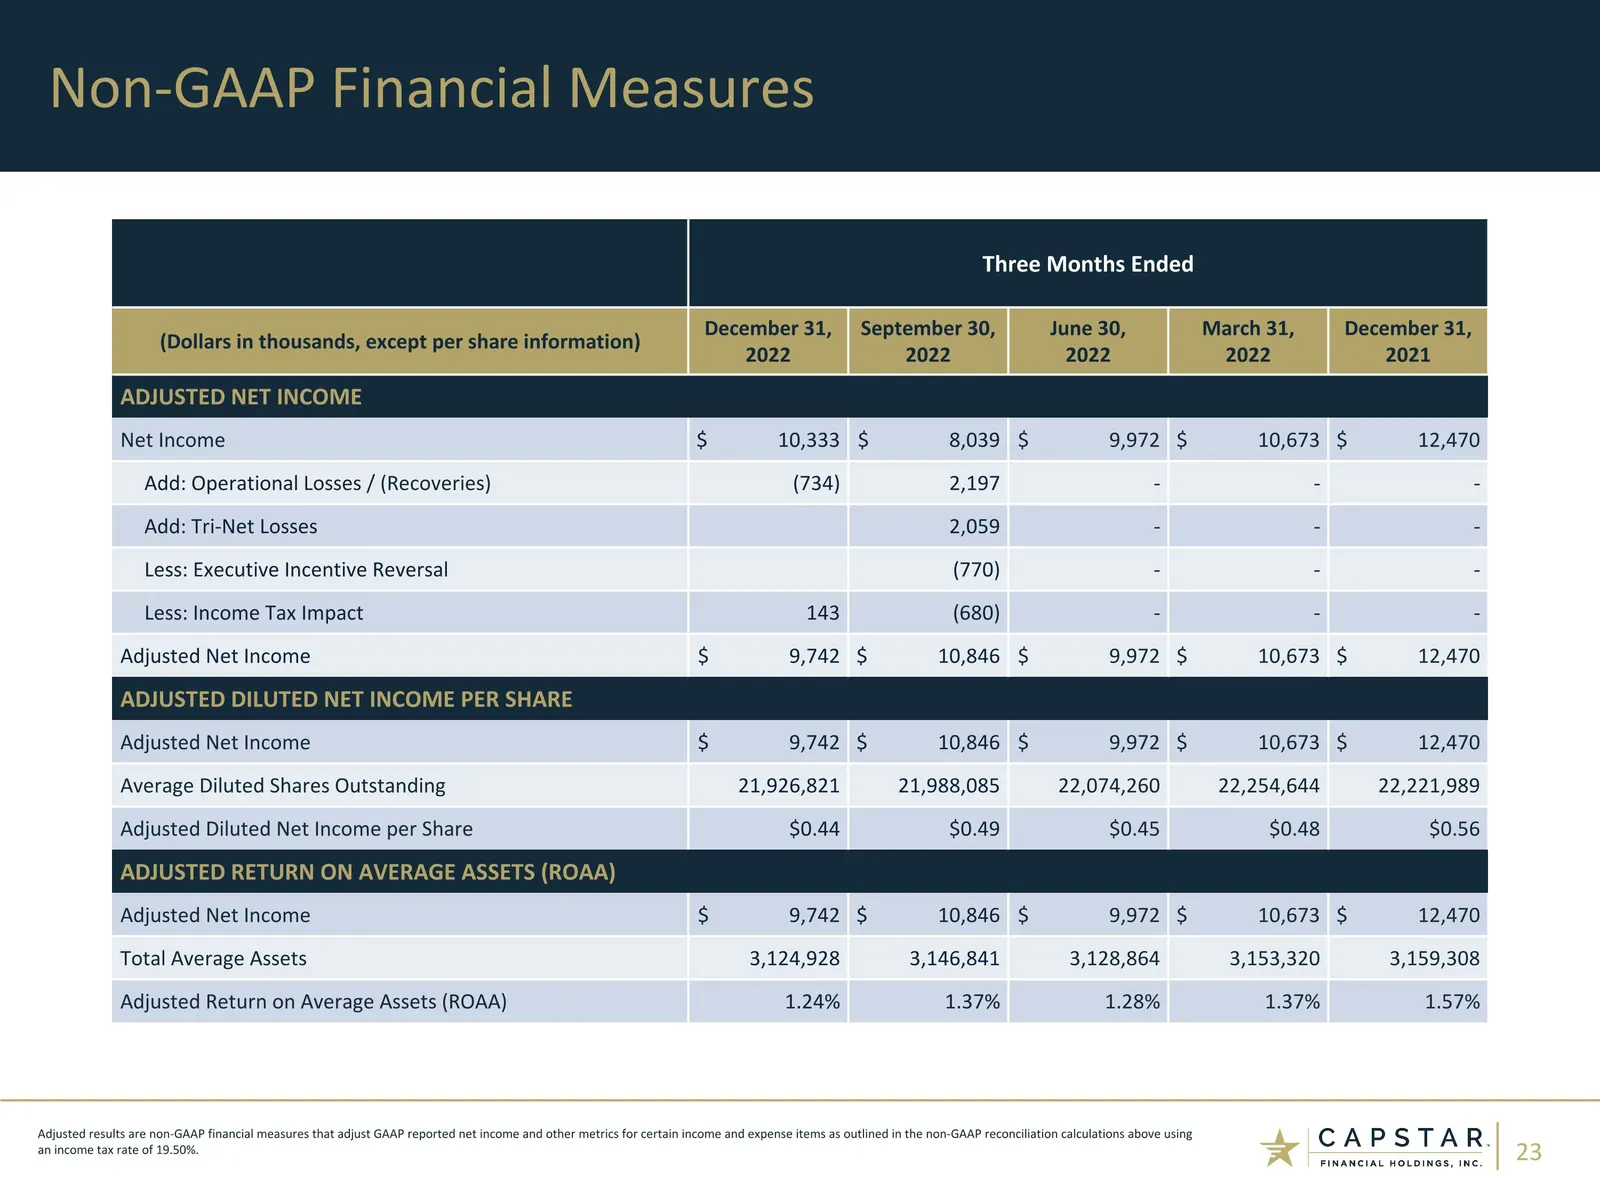
Slide 23: Adjusted Net Income Reconciliation
Three Months Ended (Dollars in thousands, except per share information) December 31, 2022 September 30, 2022 June 30, 2022 March 31, 2022 December 31, 2021 ADJUSTED NET INCOME Net Income $ 10,333 $ 8,039 $ 9,972 $ 10,673 $ 12,470 Add: Operational Losses / (Recoveries) (734) 2,197 - - - Add: Tri-Net
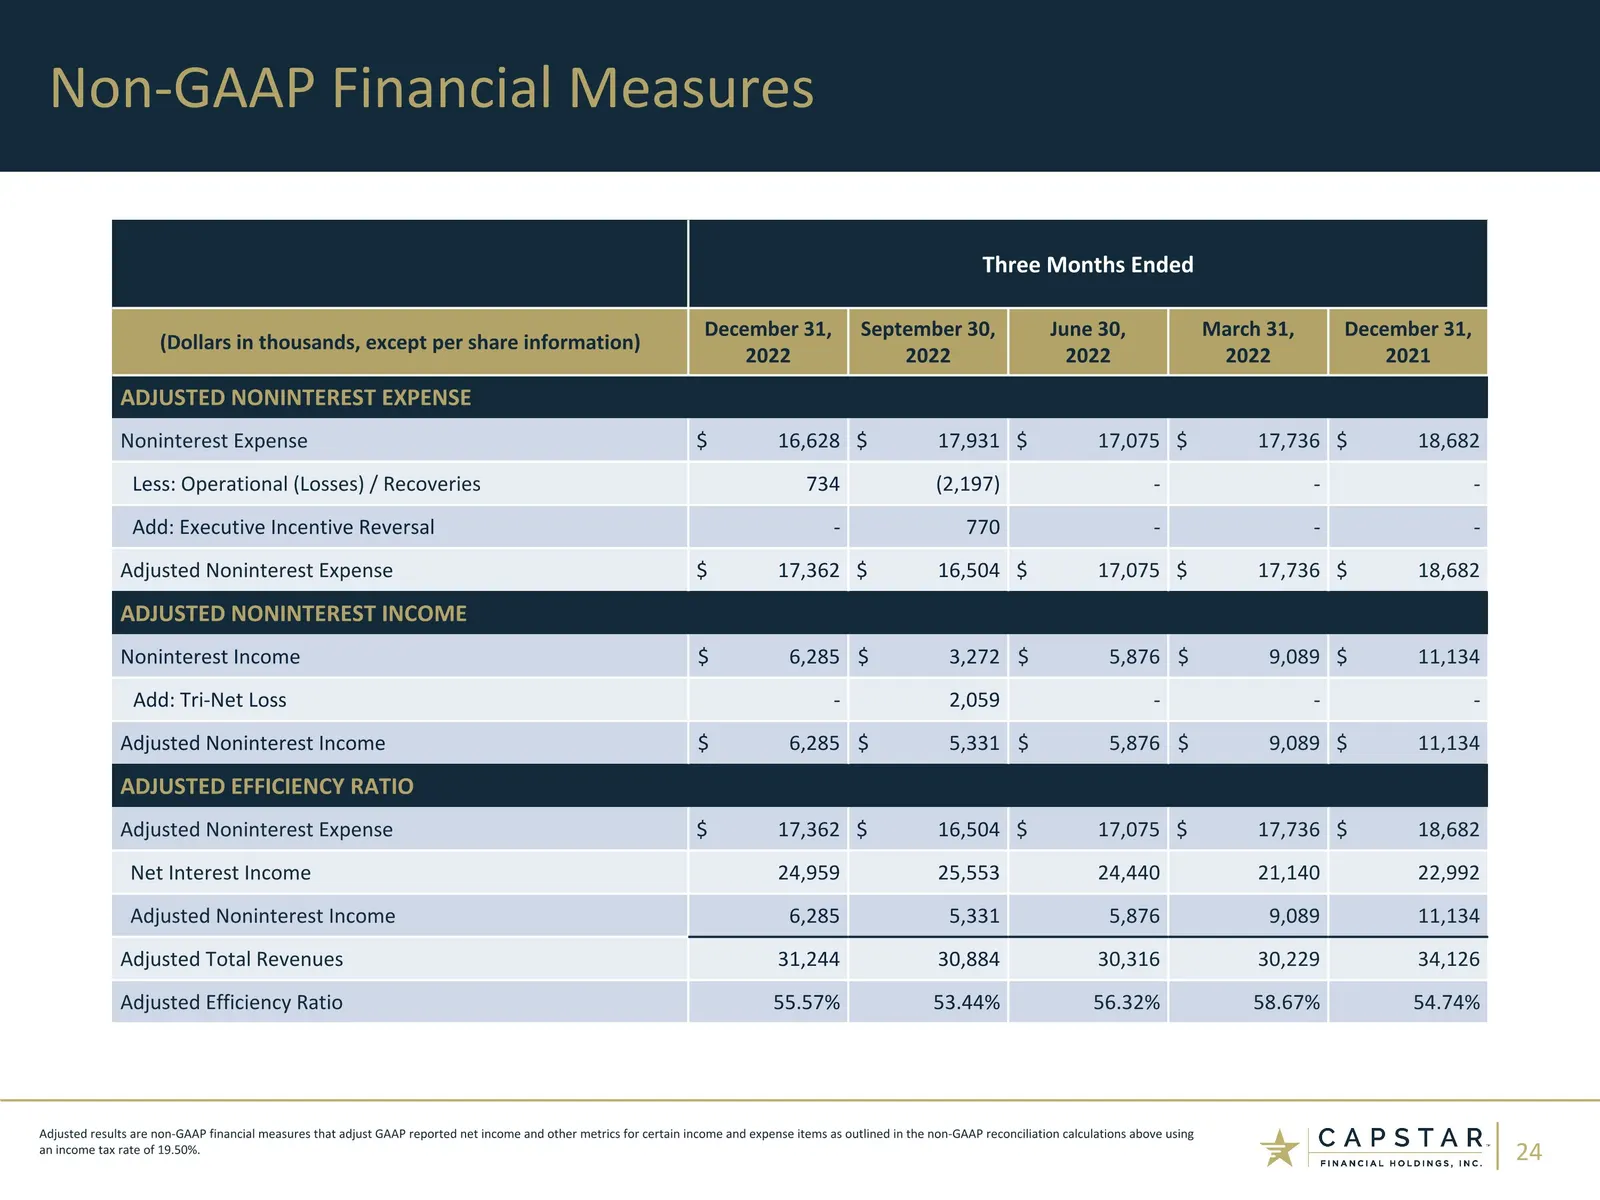
Slide 24: Adjusted Noninterest Expense and Efficiency Ratio
Three Months Ended (Dollars in thousands, except per share information) December 31, 2022 September 30, 2022 June 30, 2022 March 31, 2022 December 31, 2021 ADJUSTED NONINTEREST EXPENSE Noninterest Expense $ 16,628 $ 17,931 $ 17,075 $ 17,736 $ 18,682 Less: Operational (Losses) / Recoveries 734 (2,197
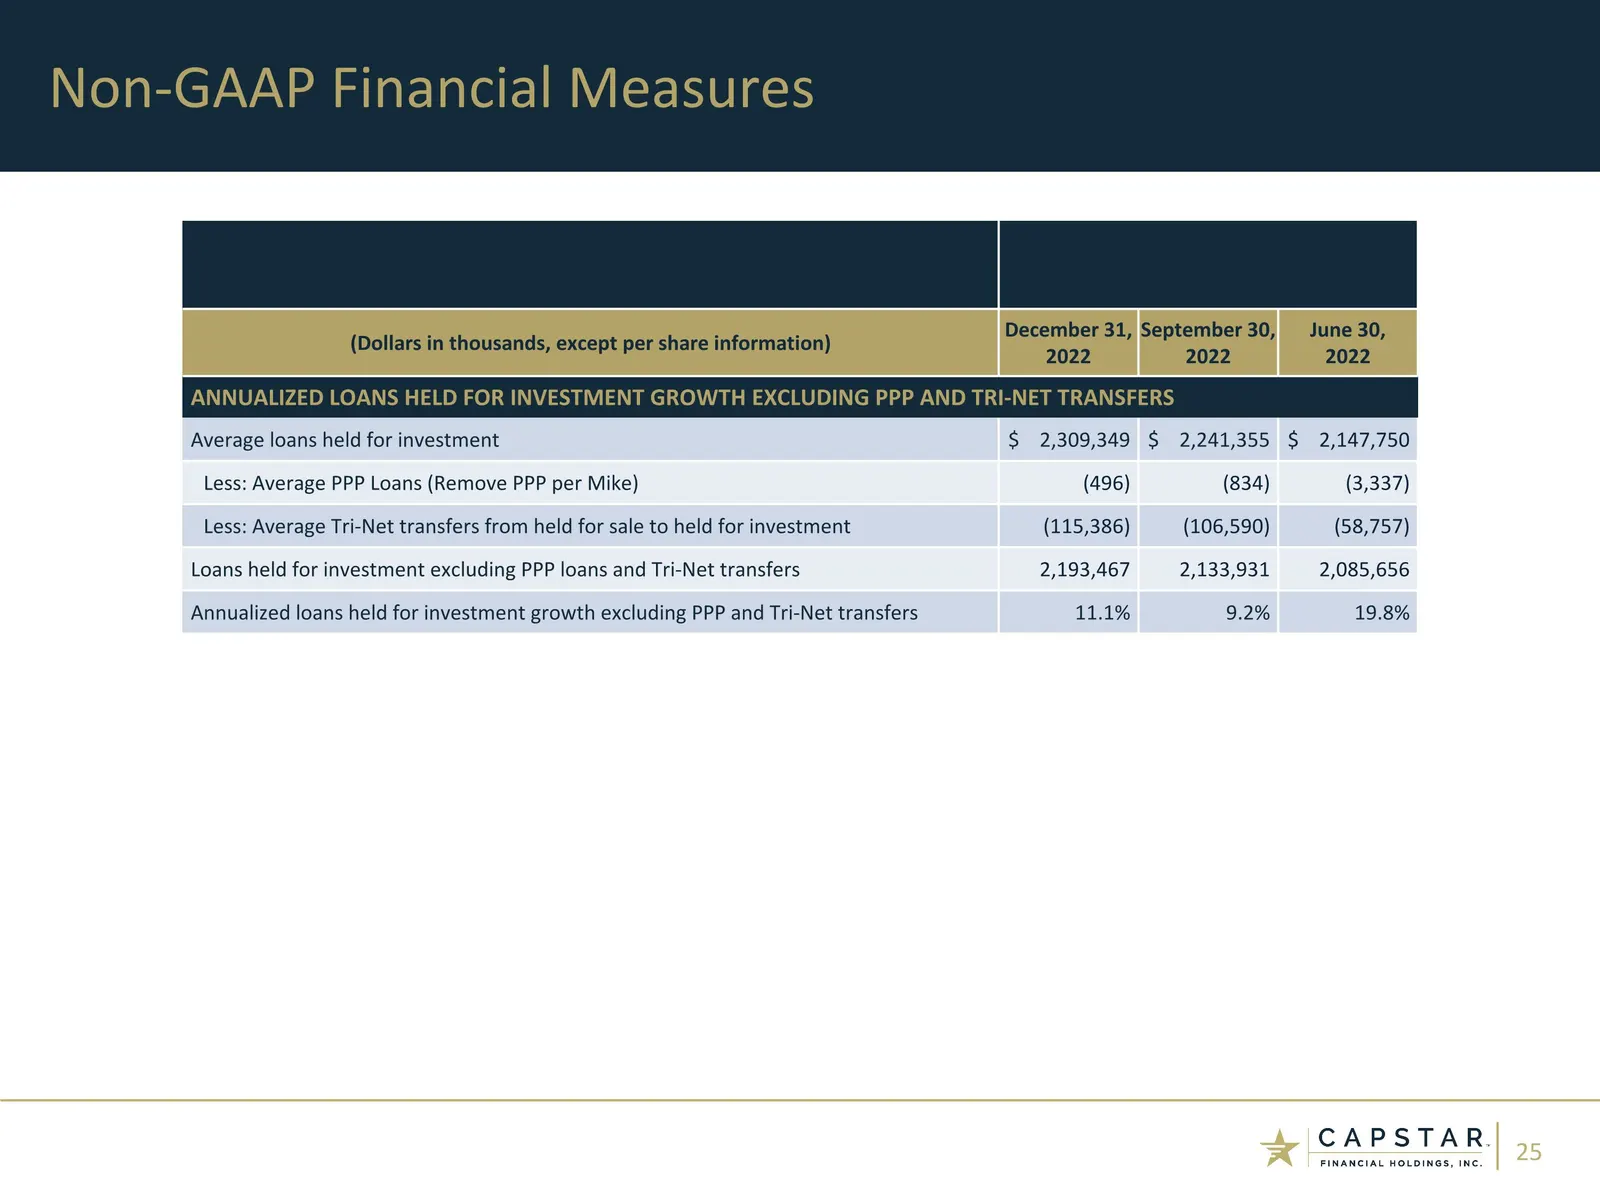
Slide 25: Annualized Loan Growth Excluding PPP and Tri-Net
(Dollars in thousands, except per share information) December 31, 2022 September 30, 2022 June 30, 2022 ANNUALIZED LOANS HELD FOR INVESTMENT GROWTH EXCLUDING PPP AND TRI-NET TRANSFERS Average loans held for investment $ 2,309,349 $ 2,241,355 $ 2,147,750 Less: Average PPP Loans (Remove PPP per Mike)
Slide 26: Contact Information
CapStar Financial Holdings, Inc. 1201 Demonbreun Street, Suite 700 Nashville, TN 37203 Mail: P.O. Box 305065 Nashville, TN 37230-5065 (615) 732-6400 Telephone www.capstarbank.com (615) 732-6455 Email: [email protected] Contact Information Investor Relations Executive Leadership Mike Fowler Chief Fi

Slide 27: = pee INS
= pee INS | FINANCIAL HOLDINGS, INC.
Source: SEC EDGAR · 8-K filed Jan 20, 2023
More decks from Capstar Financial Holdings Inc
 Q4 2023 Earnings Presentation6 slides · Jan 23, 2024
 Merger or Acquisition (October 2023)16 slides · Oct 26, 2023
 Q2 2023 Earnings Presentation22 slides · Jul 21, 2023
 Q1 2023 Earnings Presentation32 slides · Apr 21, 2023
 Investor Presentation (December 2022)31 slides · Dec 13, 2022
 Investor Presentation (November 2022)32 slides · Nov 3, 2022