ACS, Actividades de Construccion y Servicios SA · BME:ACS
ACS, Actividades de Construccion y Servicios SA — Investor Day (April 2024)
146 slides from ACS, Actividades de Construccion y Servicios SA's investor day presentation, Apr 17, 2024
Slide 1: Capital Markets Day
Capital Markets Day 17 April 2024 th 1
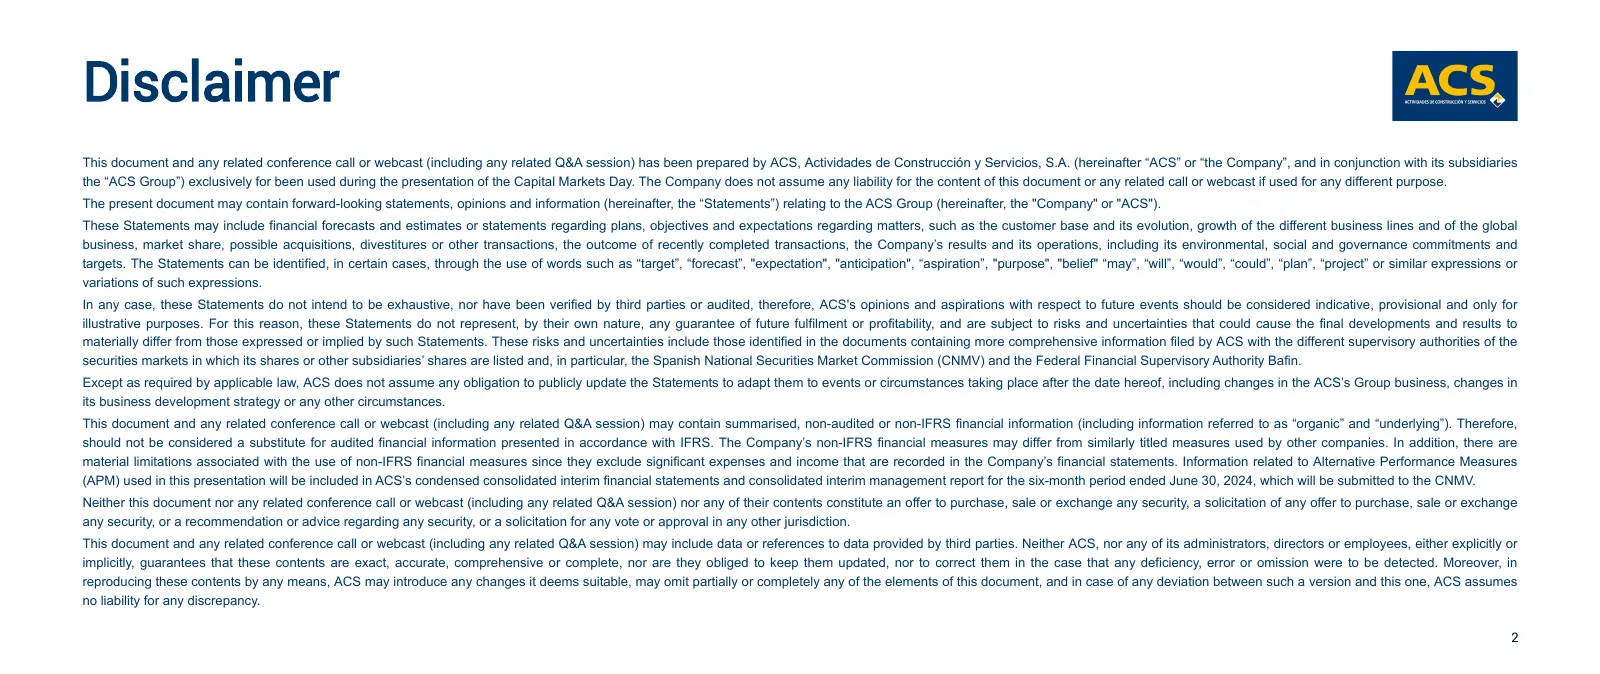
Slide 2: Disclaimer
Disclaimer This document and any related conference call or webcast (including any related Q&A session) has been prepared by ACS, Actividades de Construcción y Servicios, S.A. (hereinafter “ACS” or “the Company”, and in conjunction with its subsidiaries the “ACS Group”) exclusively for been used dur
Slide 3: Capital Markets Day: Introduction and Strategy
Capital Markets Day Introduction and Strategy 17th April 2024 1
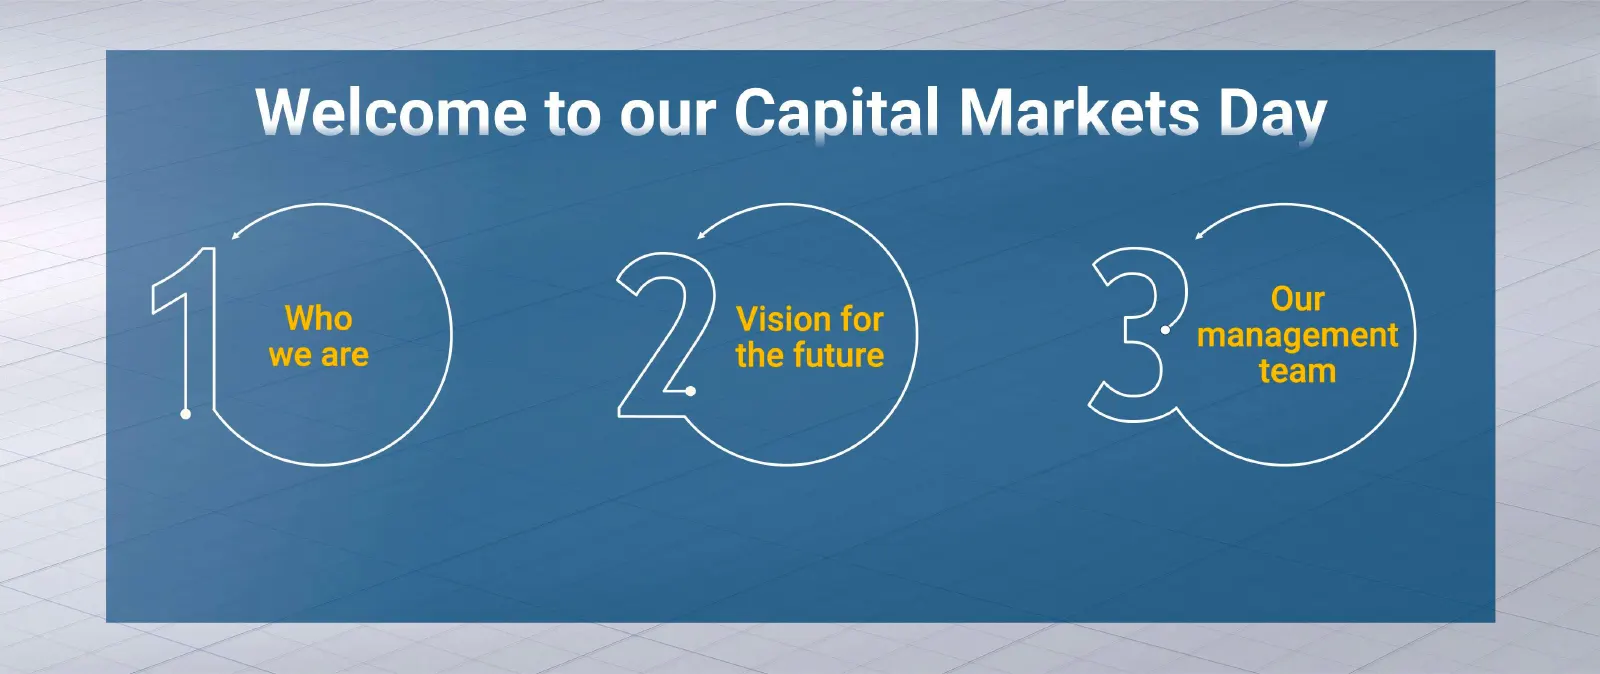
Slide 4: Welcome to our Capital Markets Day
Welcome to our Capital Markets Day
Slide 5: Welcome to our Capital Markets Day
Welcome to our Capital Markets Day
Slide 6: ACS Group is a leading engineering, construction and infrastructure management player
ACS Group is a leading engineering, construction and infrastructure management player _ A a i a oe
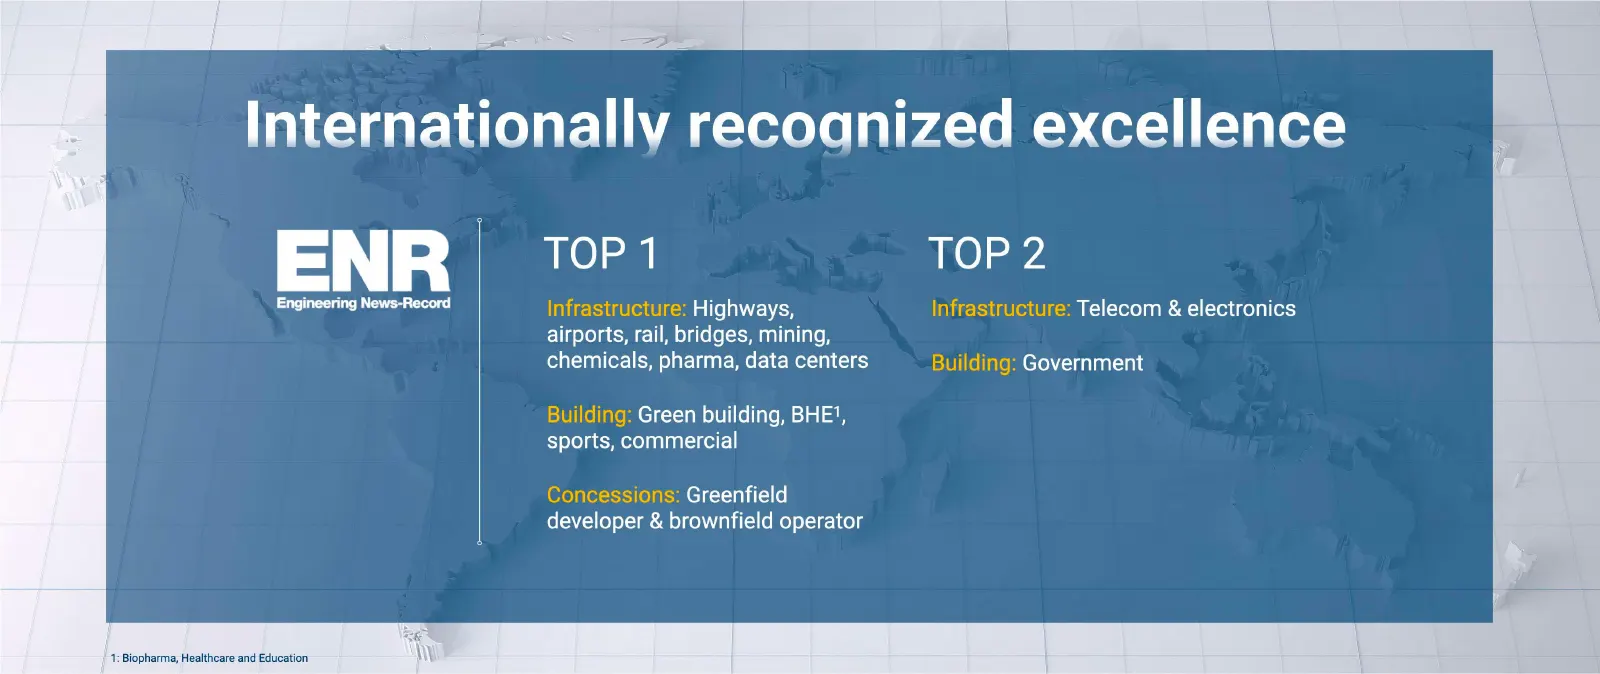
Slide 7: Internationally recognized excellence
teen =x Internationally recoanized excellence ENR TOP 1 TOP 2 Engineering News-Record Highways, airports, rail, bridges, mining, chemicals, pharma, data centers Telecom & electronics Government Green building, BHE’, sports, commercial Greenfield developer & brownfield operator
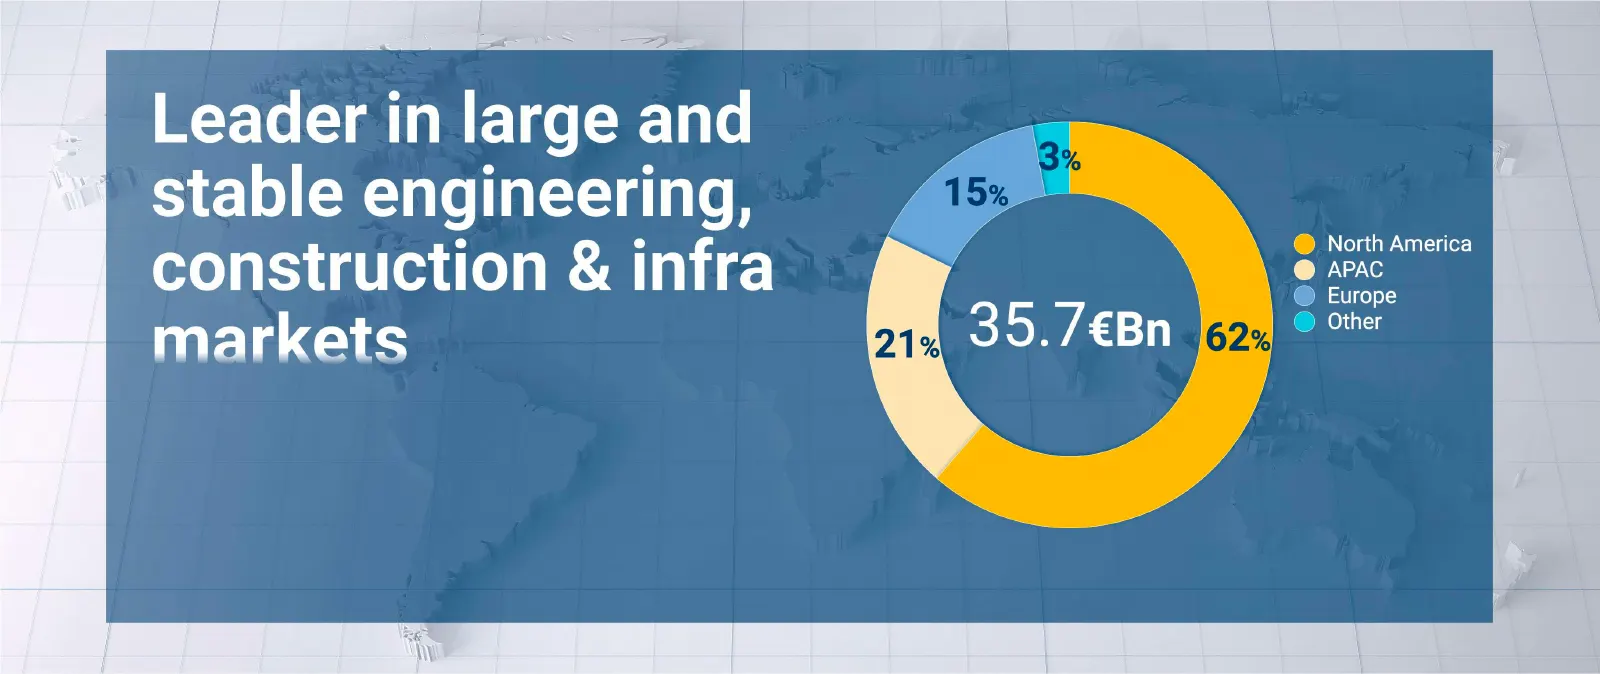
Slide 8: Leader in large and stable engineering, construction & infra markets
: Se. Leader in large and stable engineering, | construction & infra | he 35.7€Bn @ other ON markets 21
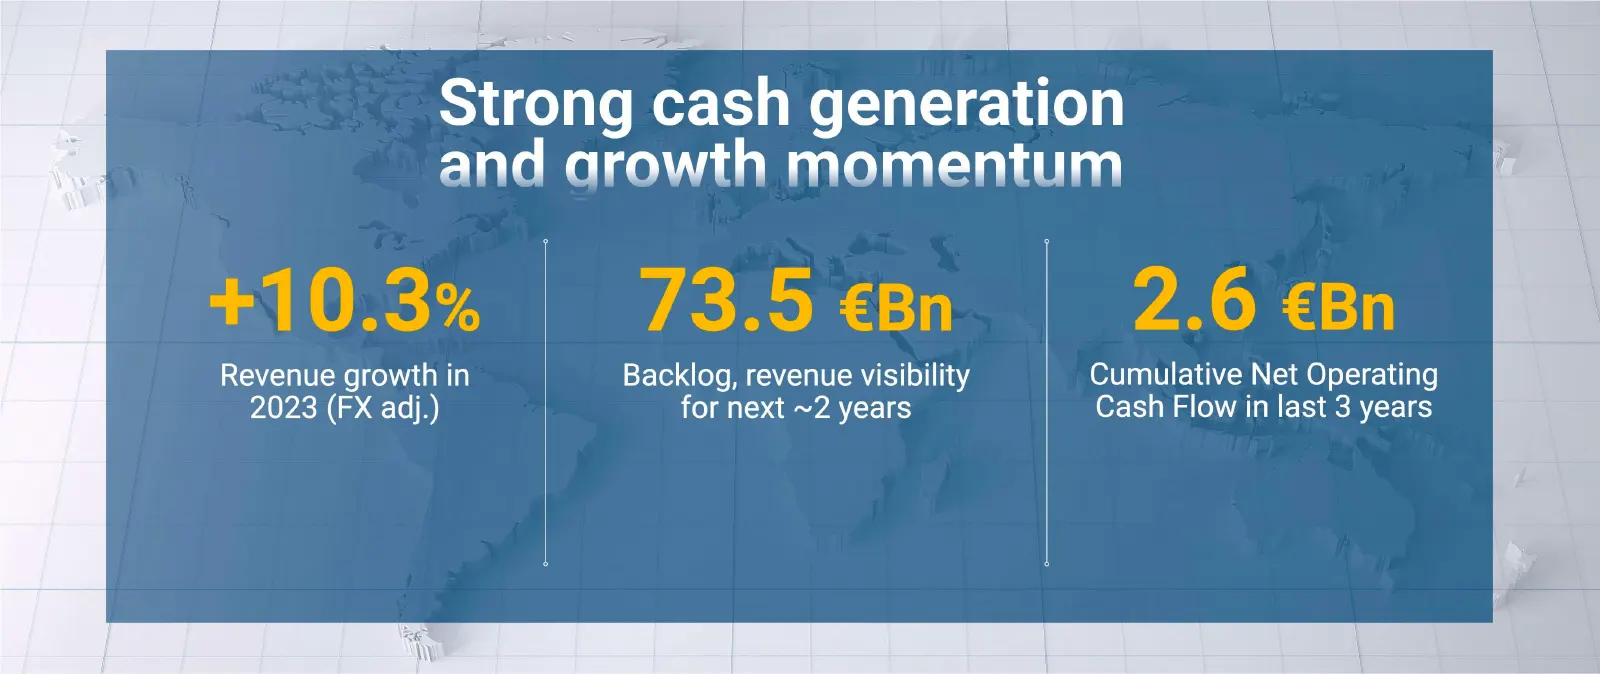
Slide 9: Revenue growth in 2023 and strong cash generation
Revenue growth in 2023 (FX adj.) Fa | Strong cash generation and growth momentum Backlog, revenue visibility for next ~2 years Cumulative Net Operating Cash Flow in last 3 years
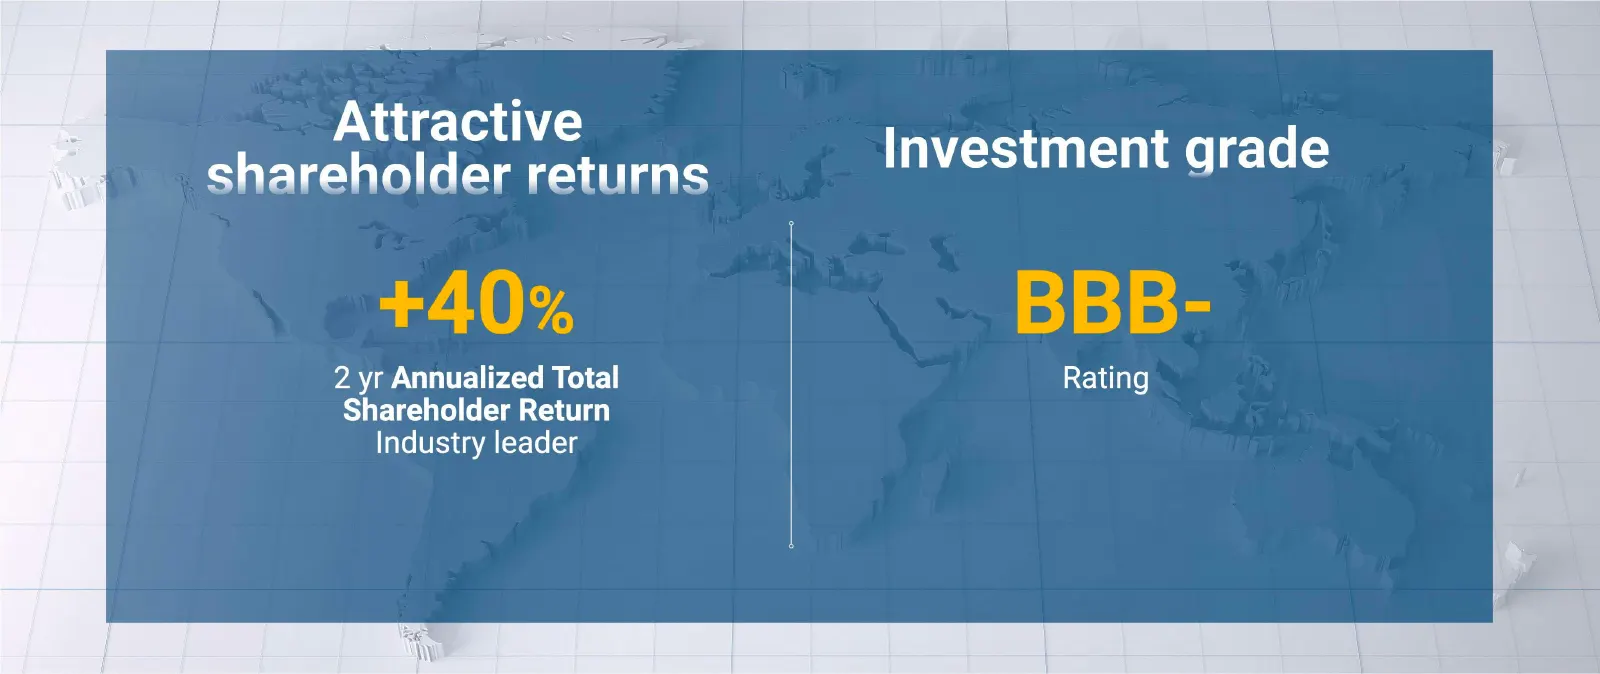
Slide 10: Attractive shareholder returns
Attractive shareholder returns 2 yr Annualized Total Shareholder Return Industry leader Investment grade Rating
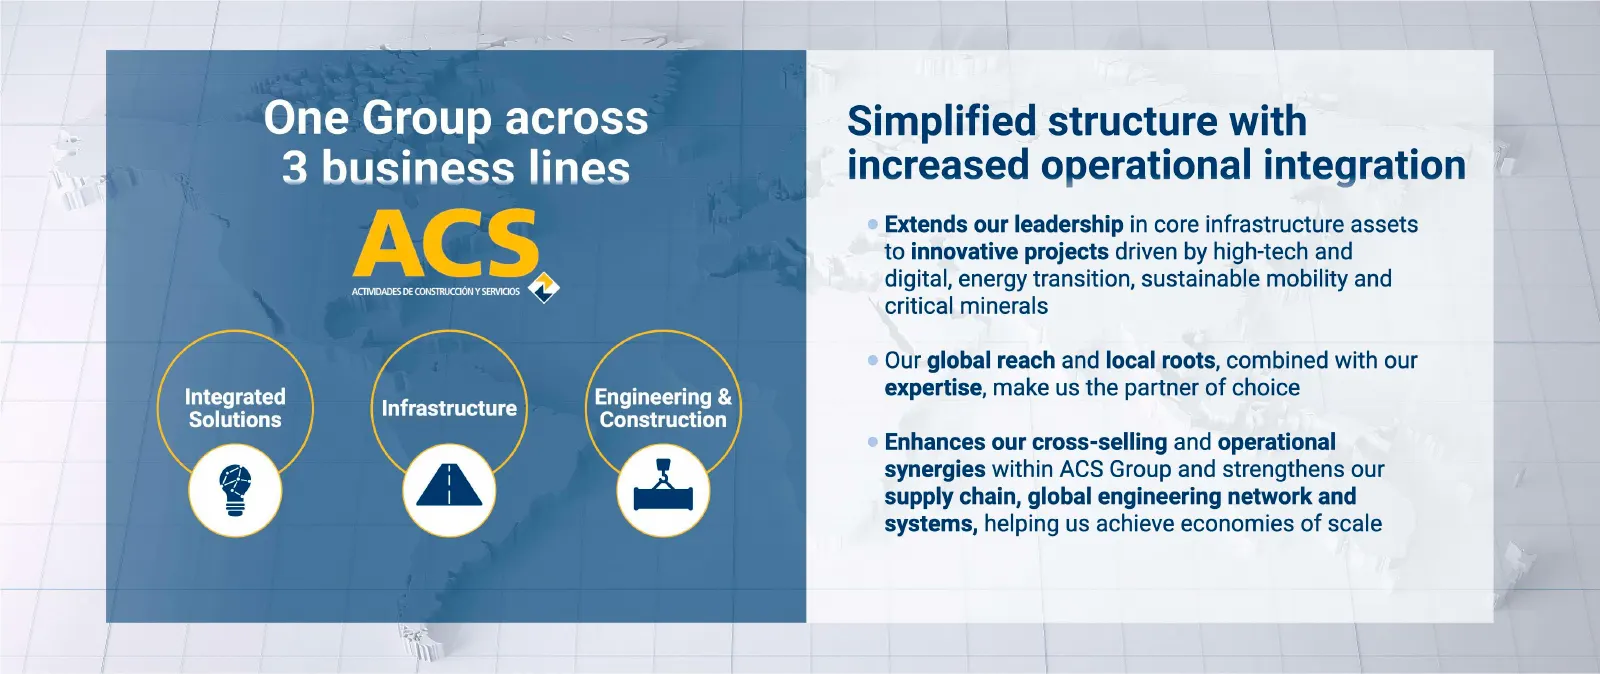
Slide 11: One Group across business lines
One Group across 3 business lines ACS, ACTIMADES DE ceusmcaonyscns OD Engineering & Infrastructure Constieugn Integrated Solutions Simplified structure with increased operational integration Extends our leadership in core infrastructure assets to innovative projects driven by high-tech and digital,
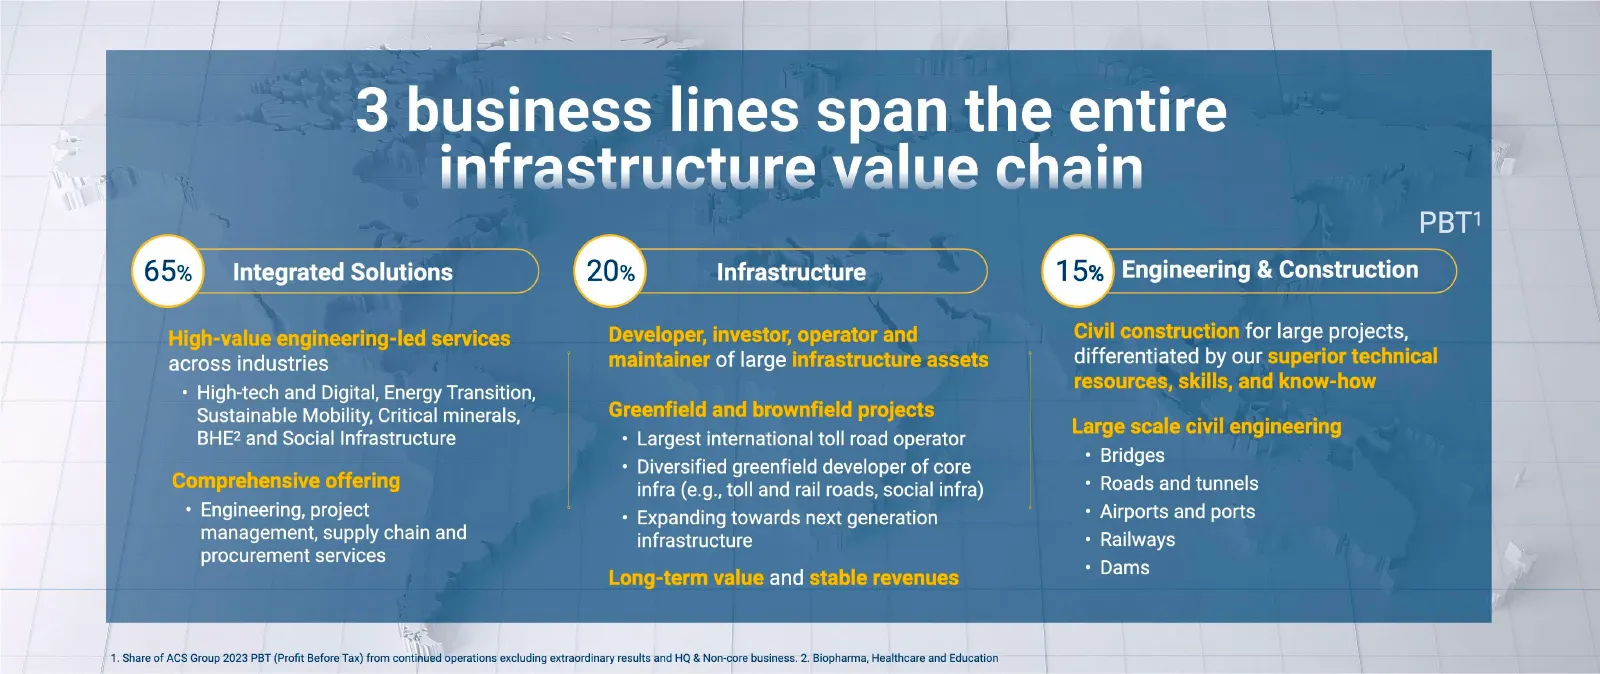
Slide 12: Business lines span the entire infrastructure value chain
3 business lines span the entire infrastructure value chain © Integrated Solutions across industries (20%) Infrastructure of large + High-tech and Digital, Energy Transition, Sustainable Mobility, Critical minerals, BHE? and Social Infrastructure + Engineering, project management, supply chain and p
Slide 13: One fully integrated group with leading local teams and brands
One fully integrated group with leadina local teams and brands Integrated Solutions Infrastructure Engineering & Construction Sabertis IRIDIUM FLATIRON Turner 3: CIMIC EX HOcHTIEF ¢'PACIFIC HOCHTIEF PARTNERSHIPS
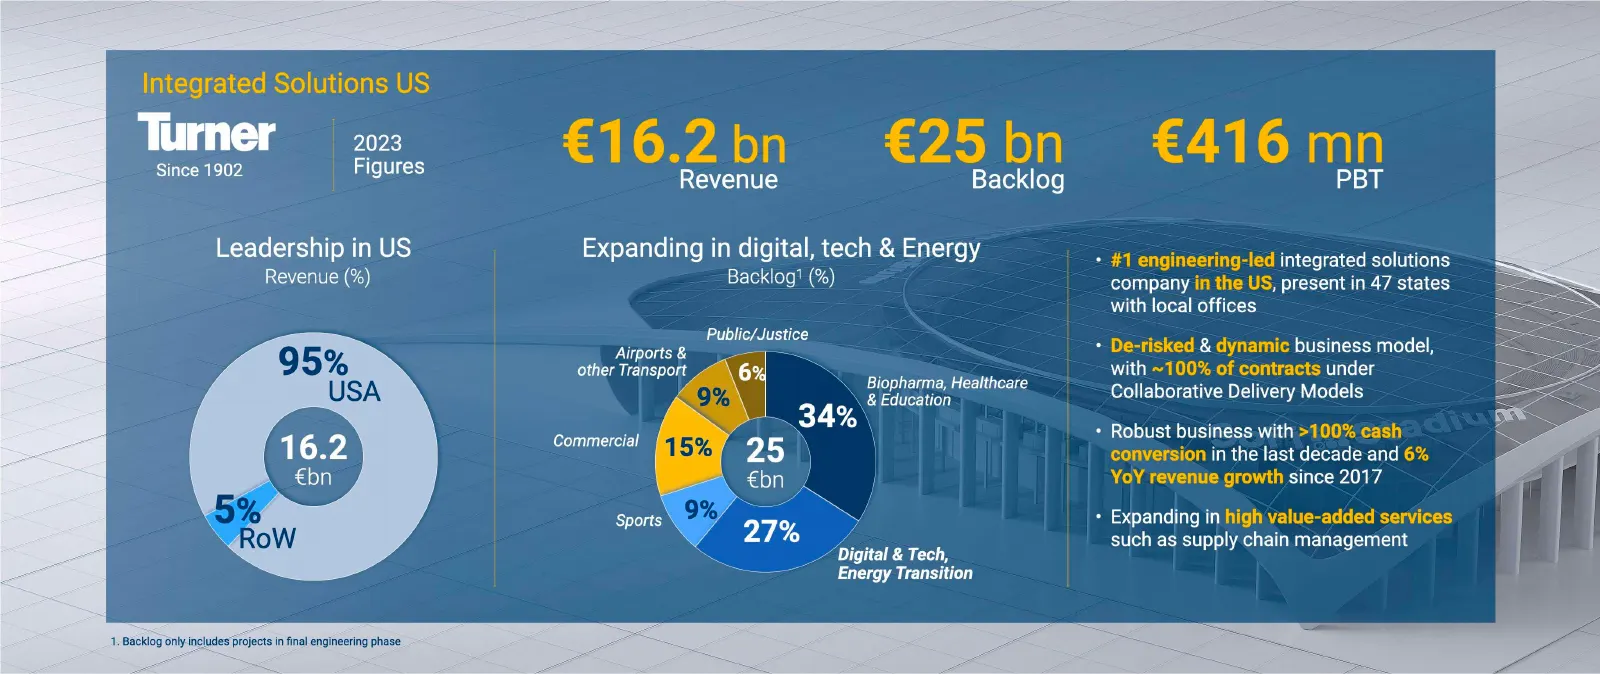
Slide 14: Turner 2023 Figures
Turner 2023 Since 1902 Figures Leadership in US Revenue (%) 1. Backlog only includes projects in final engineering phase Revenue Backlog Expanding in digital, tech & Energy Backlog! (%) Public/Justice ~\— Biopharma, Healthcare \ & Education Airports & _— other Transport Gi a > 34% \ » Commercial 25
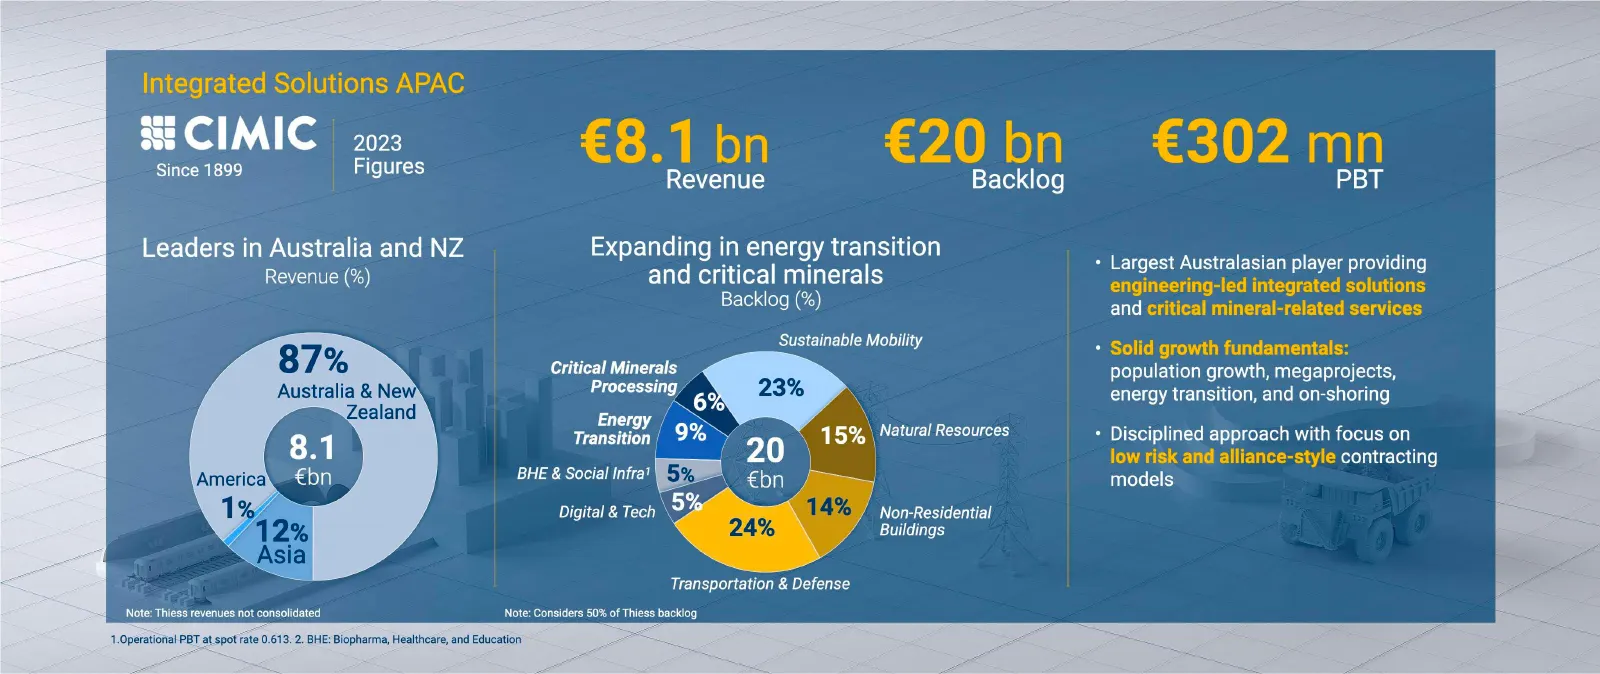
Slide 15: CIMIC 2023 Figures
SECIMIC 20: Since 1899 Figures Revenue Backlog PBT Leaders in Australia and NZ Expanding in energy transition mieten on pire providing Revenue (%) and critical minerals : u Backlog (%) antl Sustainable Mobility 7s o Critical Minerals population growth, megaprojects, Australia & New’ Processin; energ
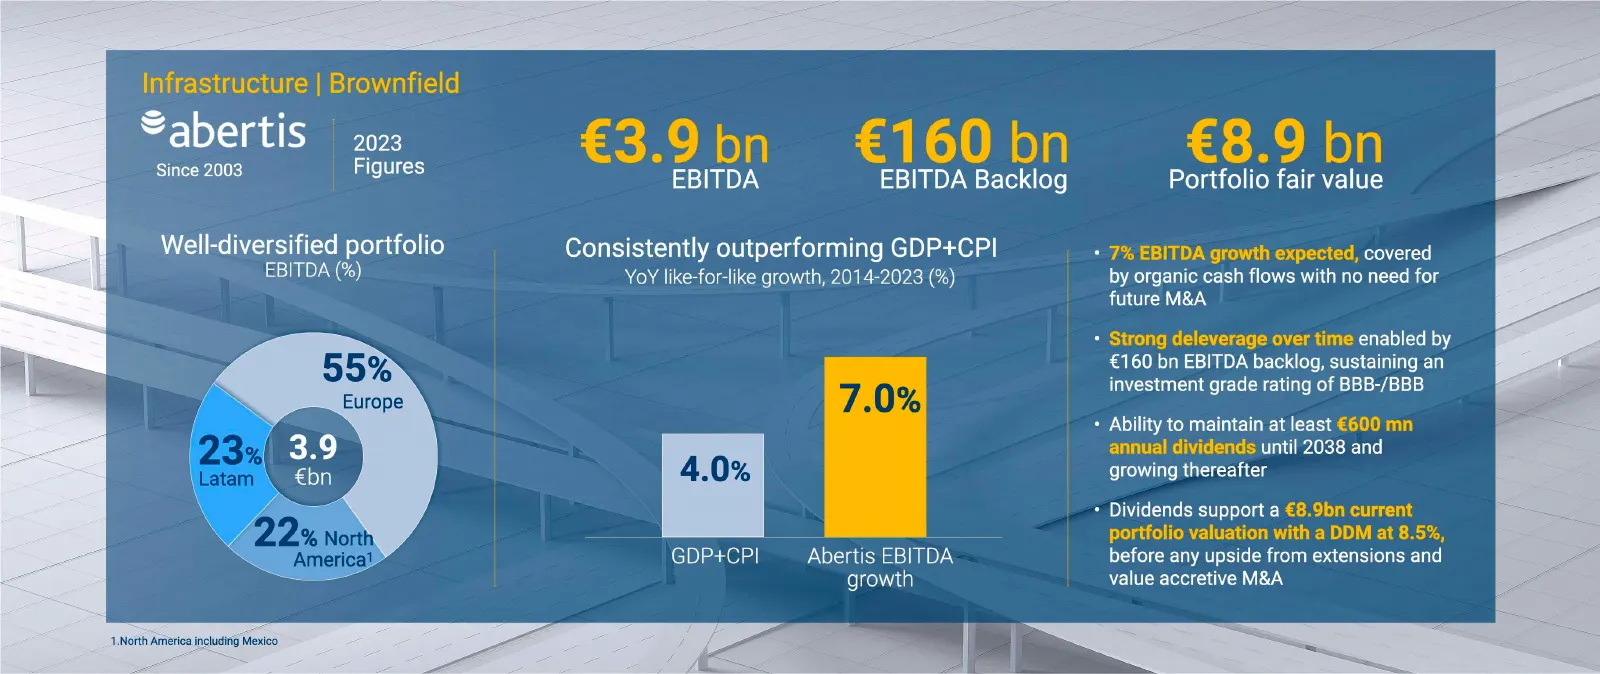
Slide 16: Abertis 2023 Figures
Zabertis 203 Since 2003 Figures Well-diversified portfolio EBITDA (%) 55% Europe 3x( Latam 22% North America! ‘North America including Mexico EBITDA EBITDA Backlog Portfolio fair value Consistently outperforming GDP+CPI . aavered YoY like-for-like growth, 2014-2023 (%) by organic cash flows with no
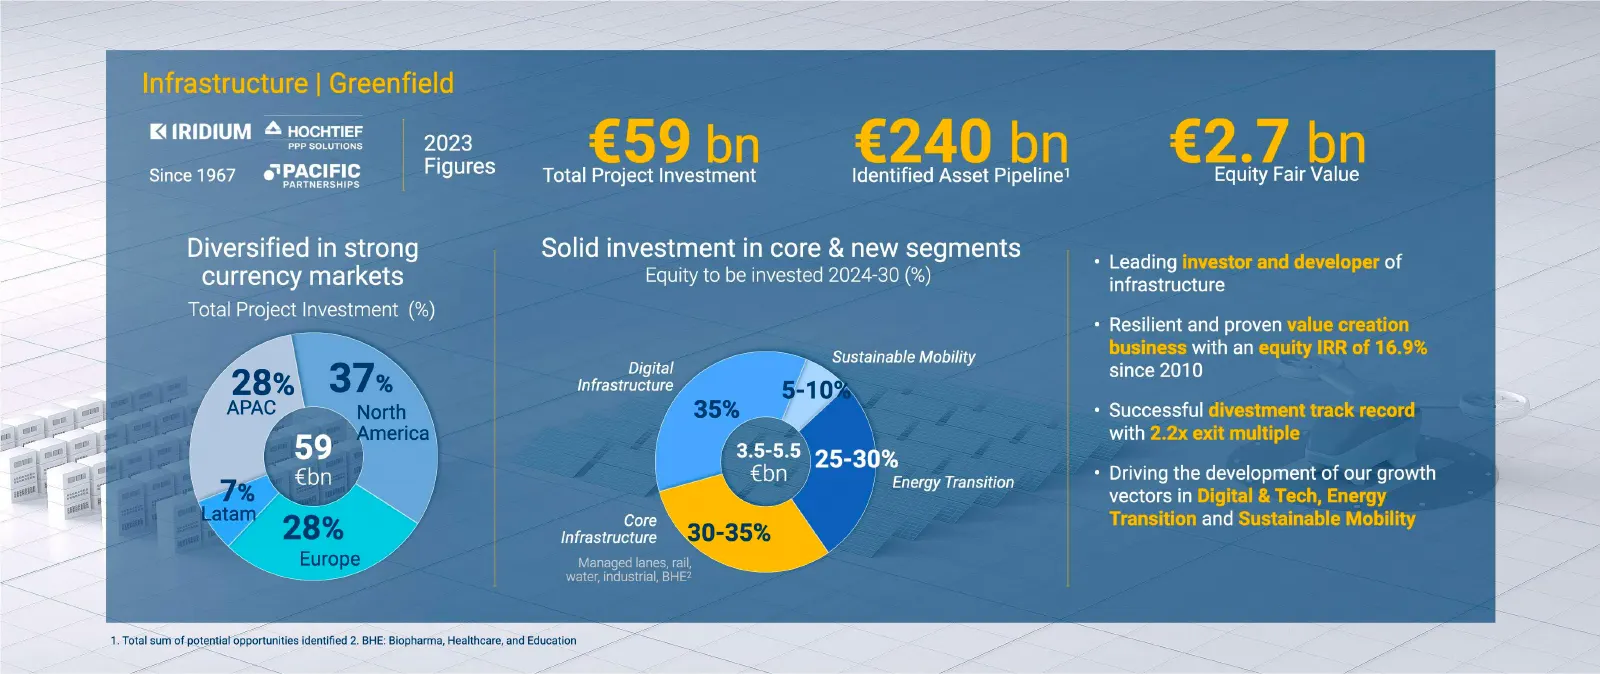
Slide 17: Infrastructure Greenfield 2023 Figures
Infrastructure | Greenfield K(IRIDIUM 4 HocHTIEF PPP SOLUTIONS @' PACIFIC PARTNERSHIPS) 2023 Since 1967 Figures Diversified in strong currency markets Total Project Investment (%) 28% APAC ces | 59 | €bn J €59 bn Total Project Investment €240 bn Identified Asset Pipeline’ Solid investment in core &
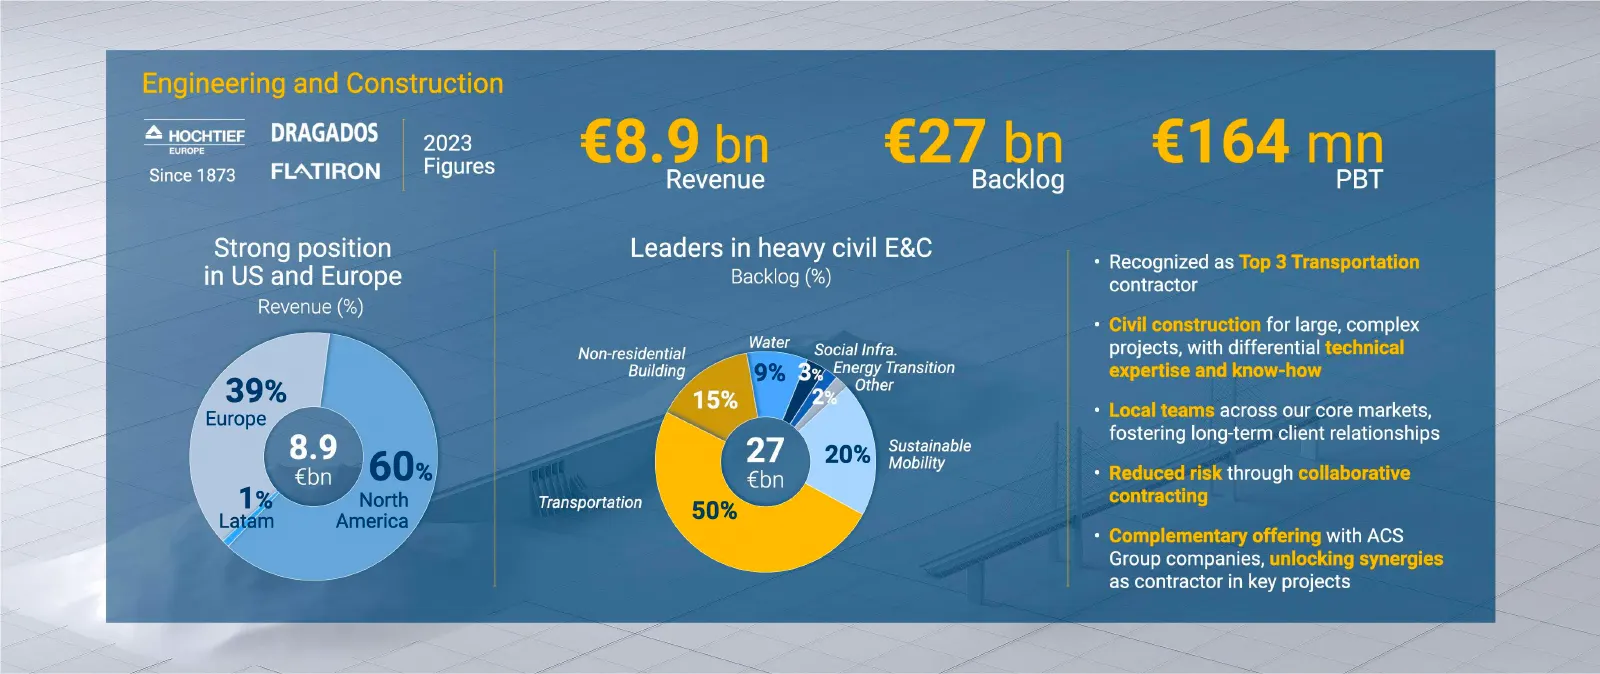
Slide 18: Engineering & Construction 2023 Figures
4 HocHmiEr DRAGADOS = 4993 since 1873 FLATIRON — Figures Revenue Strong position in US and Europe Revenue (%) Leaders in heavy civil E&C Backlog (%) Non-residential Water Social Infra. Building 15% Transportation Backlog + Recognized as contractor . ‘on for large, complex projects, with differential
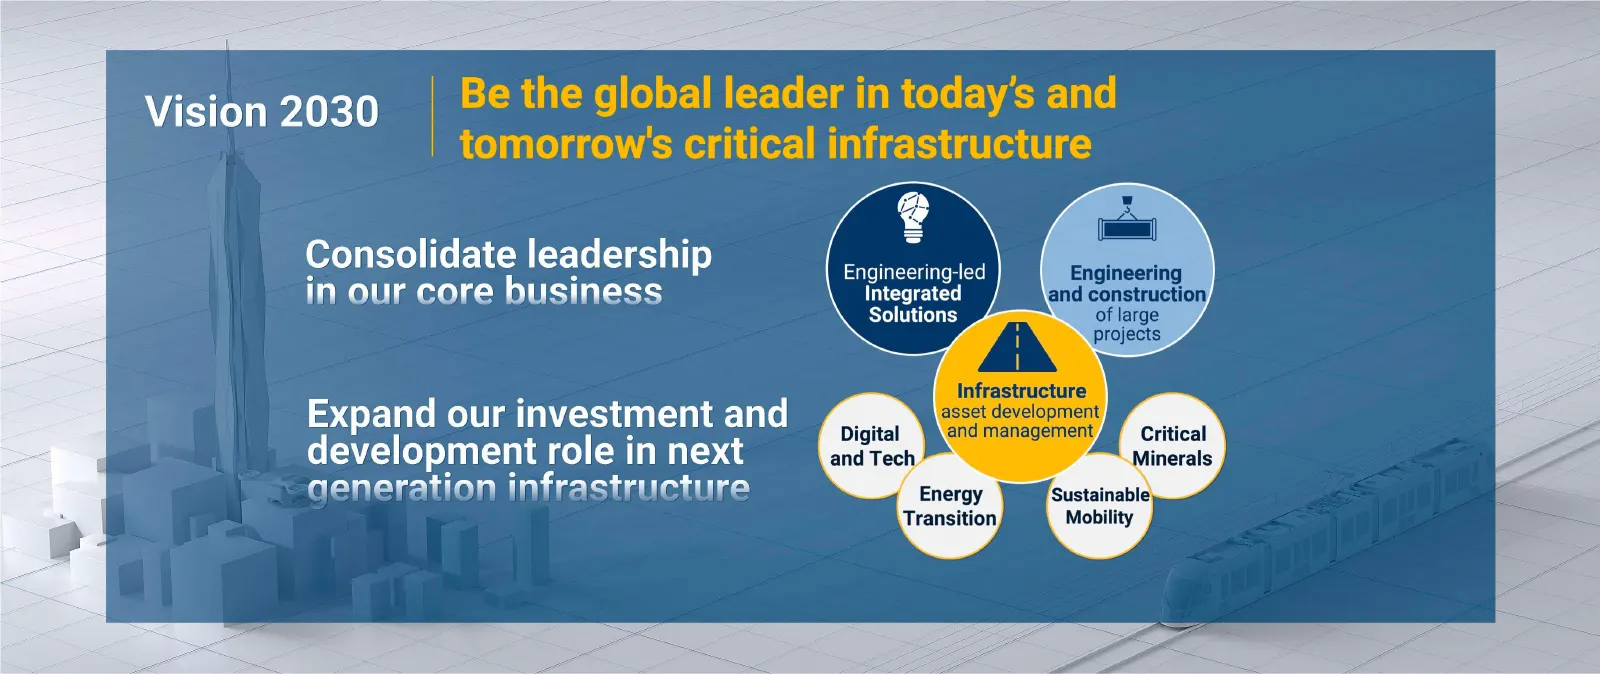
Slide 19: Vision 2030
Vision 2030 Consolidate leadership Enolreeringled in our core business Integrated Solutions Expand our investment and 4 “i . igital Critical development role in next and Tec! inerals generation infrastructure erg ot
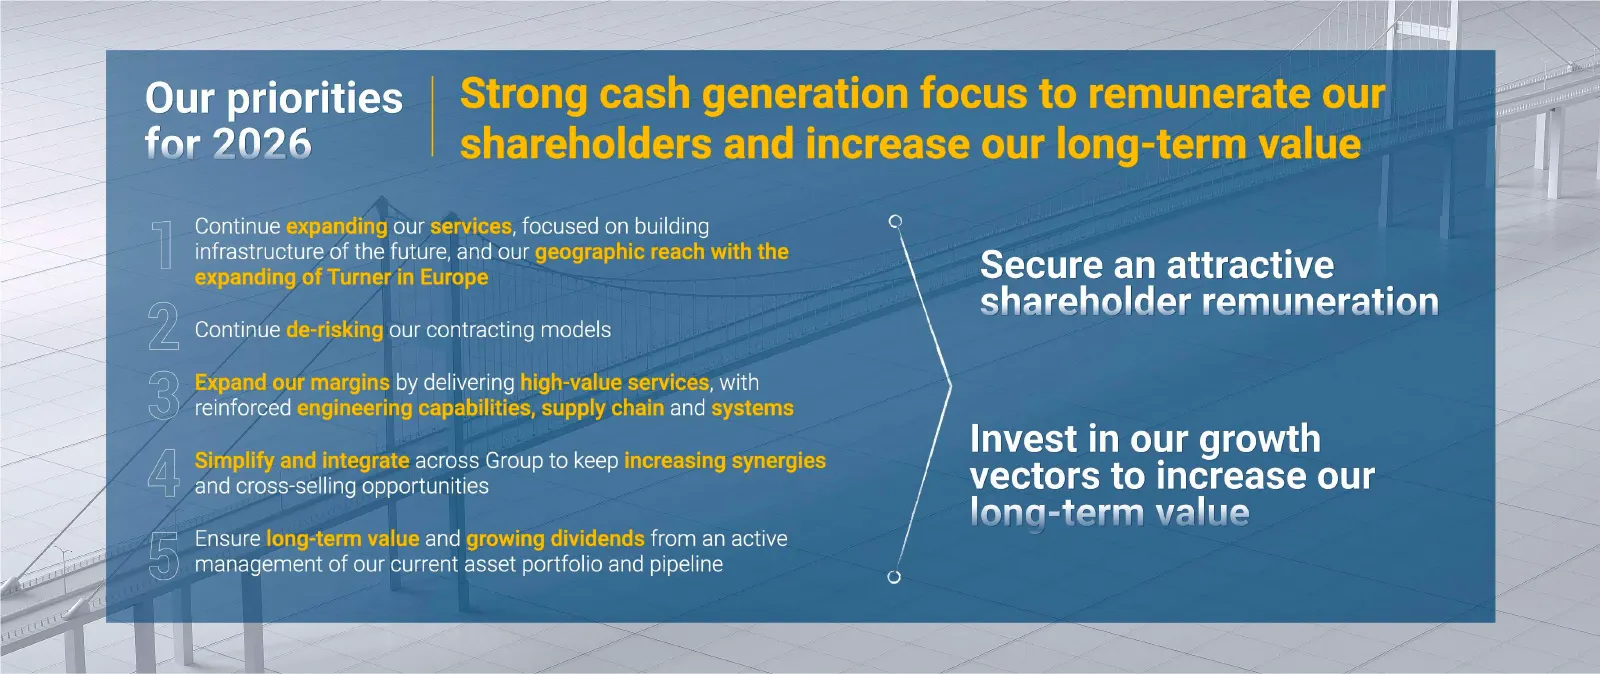
Slide 20: Our priorities for 2026
Our priorities for 2026 cal P Ol te Oe Continue e» jing our services, focused on building structure yi the future and our geogr: Continue de- g our contracting models nargins by delivering hic ateAe eering ca ir d across Group to keep Anil cross- Ping opportunities Ensure 4 and from an active manage
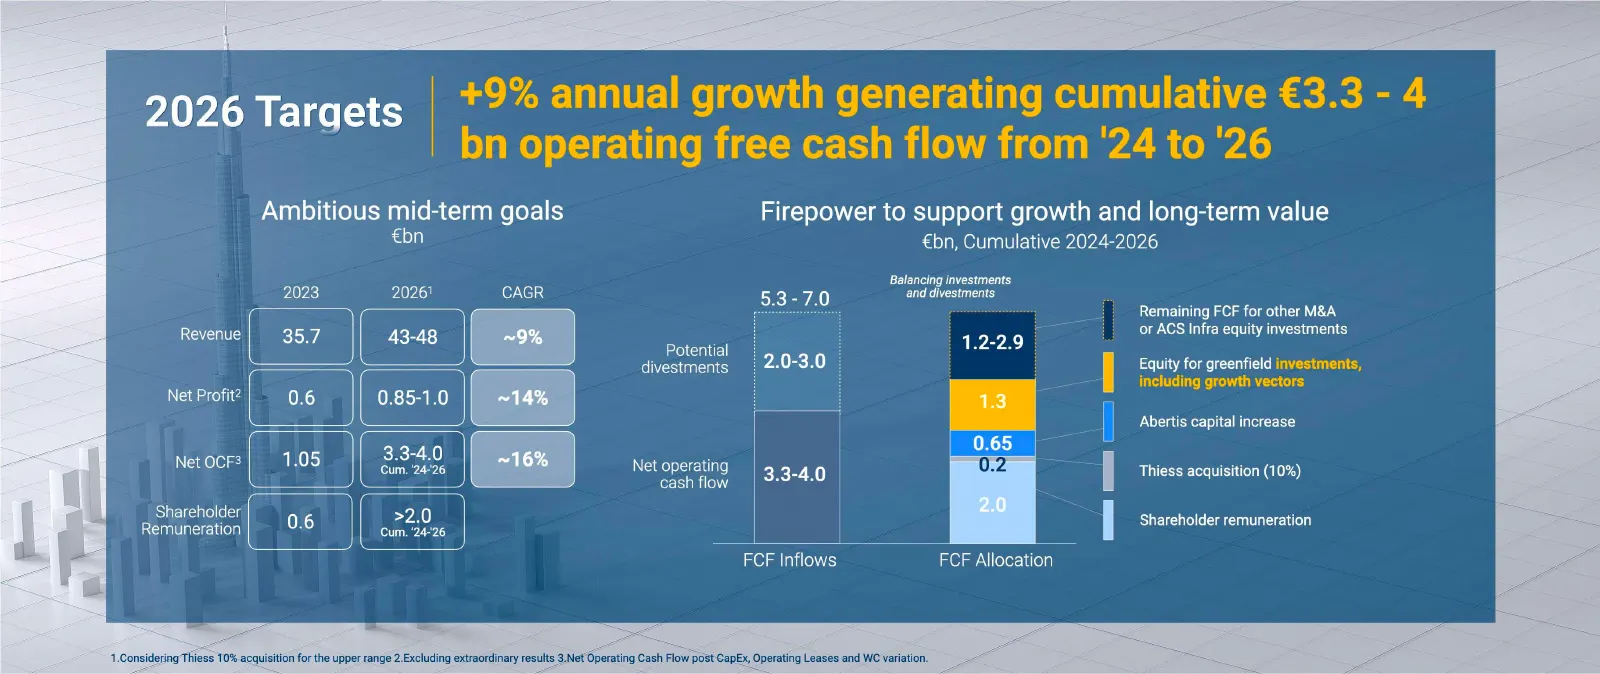
Slide 21: 2026 Targets
2026 Targets Ambitious mid-term goals Firepower to support growth and long-term value €bn €bn, Cumulative 2024-2026 Balancing investments ‘and divestments Remaining FCF for other M&A or ACS Infra equity investments Potential 1.22.9 divestments Equity for greenfield Abertis capital increase Net opera
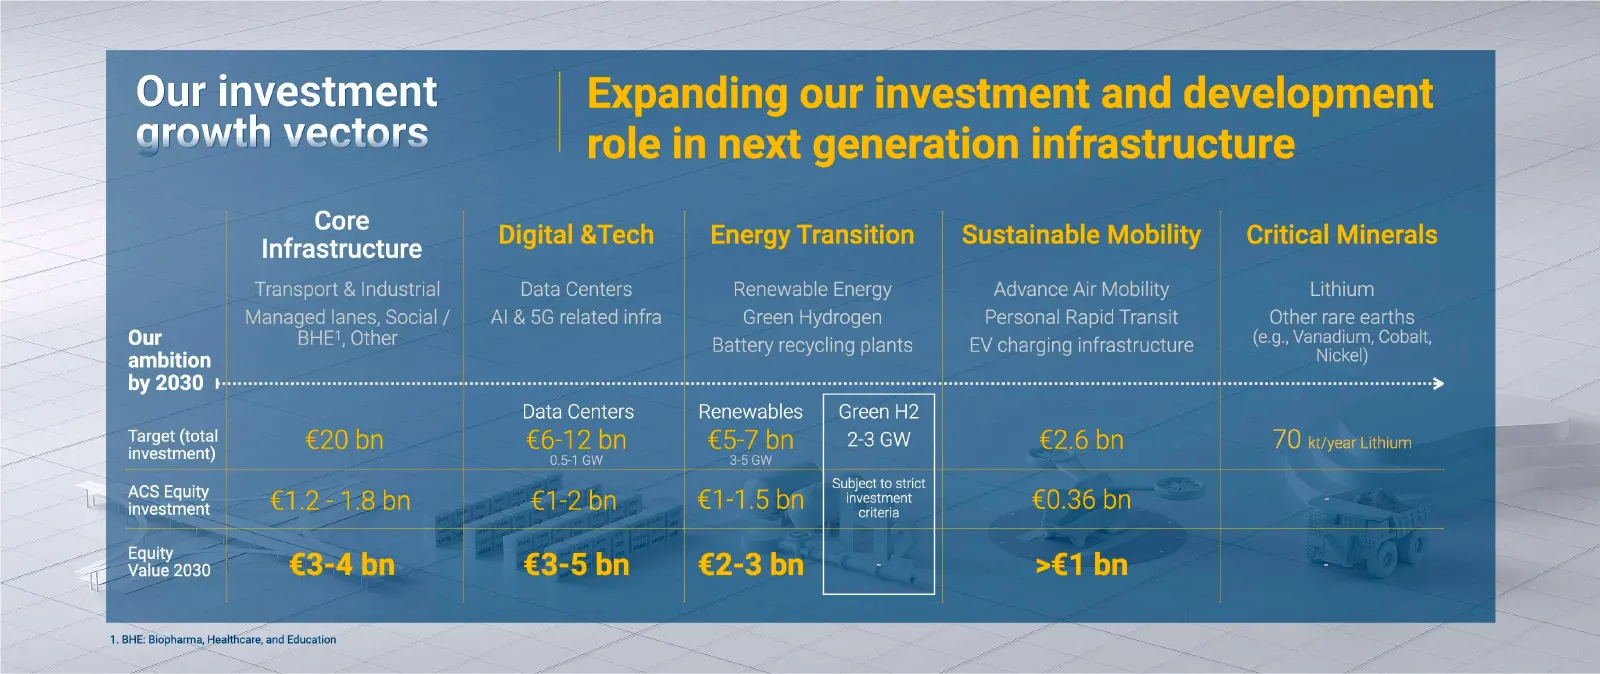
Slide 22: Our investment growth vectors
Our investment arowth vectors Core Infrastructure Transport & Industrial Managed lanes, Social / Our BHE’, Other ambition investment Equit value 2030 1, BHE: Biopharma, Healthcare, and Education Data Centers Al & 5G related infra Data Centers 05-1 GW Renewable Energy Green Hydrogen Battery recycling
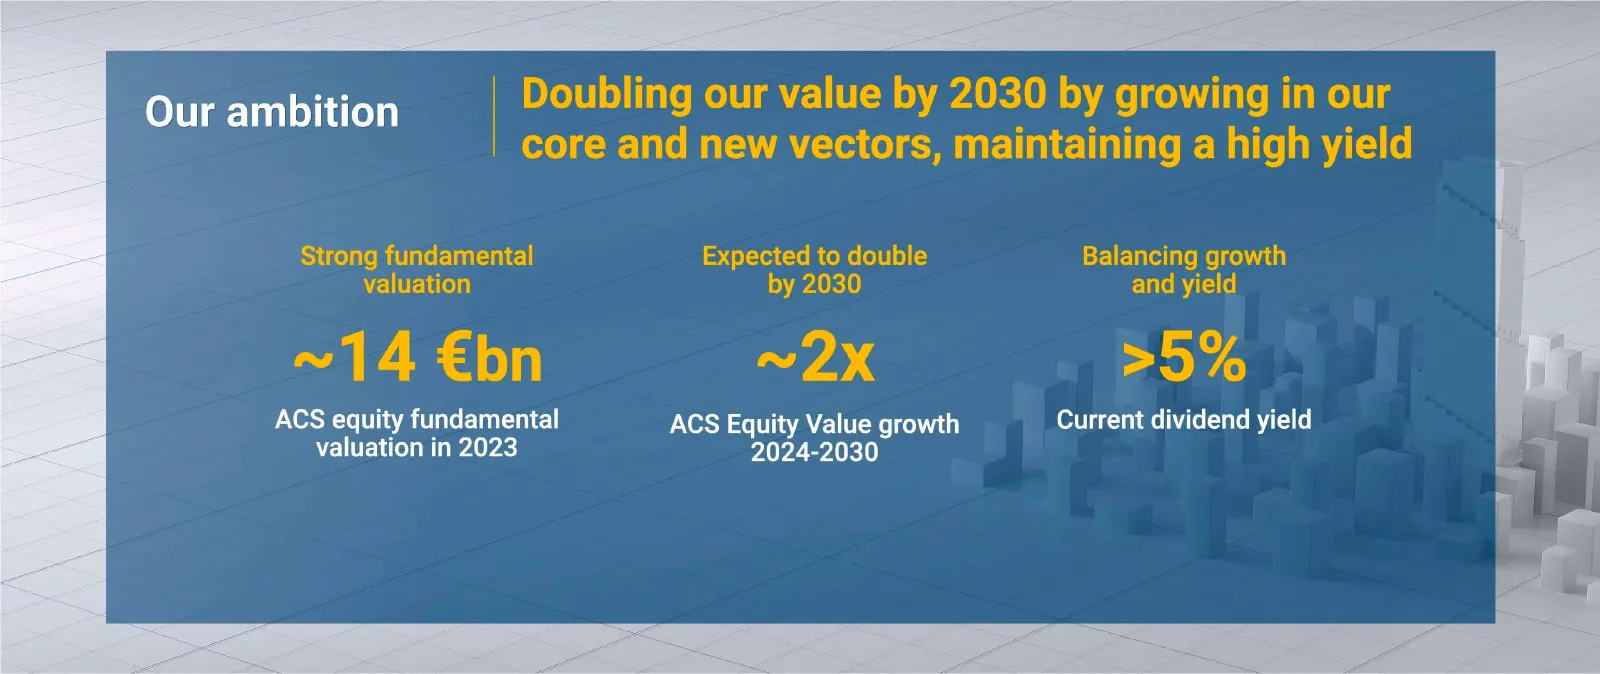
Slide 23: Doubling our value by 2030
Doubling our value by 2030 by growing in our core and new vectors, maintaining a high yield Strong fundamental Expected to double Balancing growth valuation by 2030 and yield ~14 €bn ~2X >5%
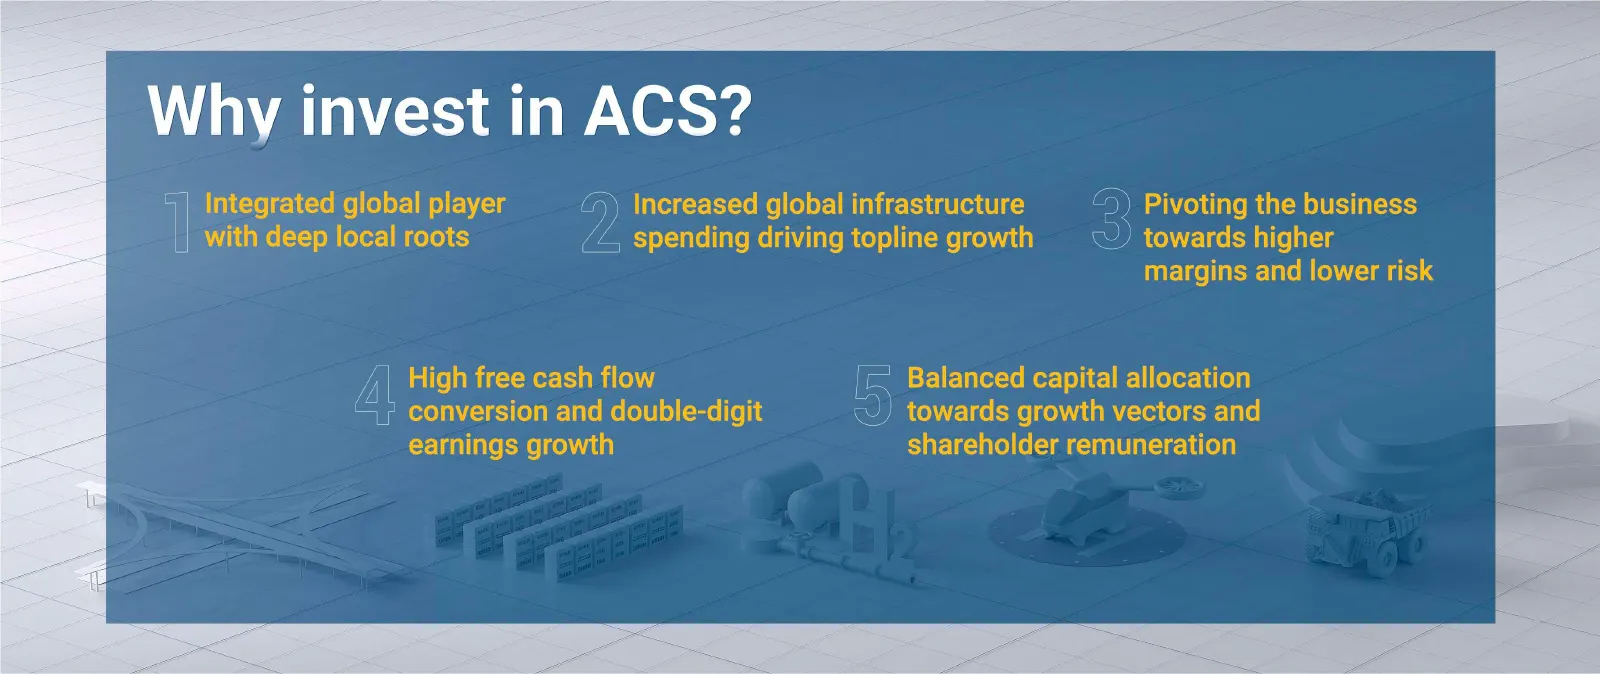
Slide 24: Why invest in ACS?
Why invest in ACS? 1 or nae y)
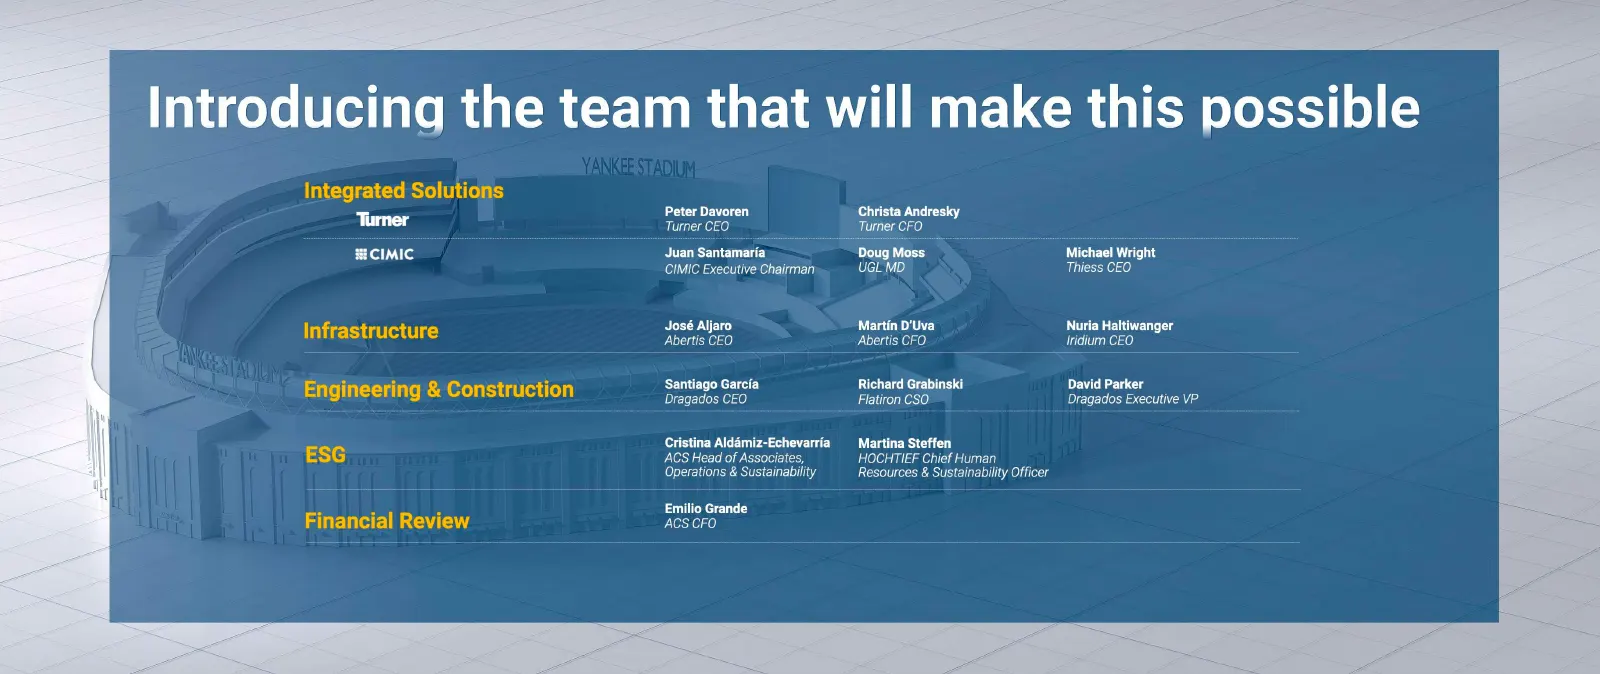
Slide 25: Introducing the team that will make this possible
Introducing the team that will make this possible ‘Turmer #ICIMIC Peter Davoren Turner CEO Juan Santamaria CIMIC Executive Chairman, José Aljaro Abertis CEO Santiago Garcia Dragados CEO Cristina Aldémiz-Echevarria ACS Head of Associates, Operations & Sustainability Emilio Grande ACS CFO Christa Andr
Slide 26: Integrated Solutions - Turner
Capital Markets Day Integrated Solutions - Turner 17th April 2024 1
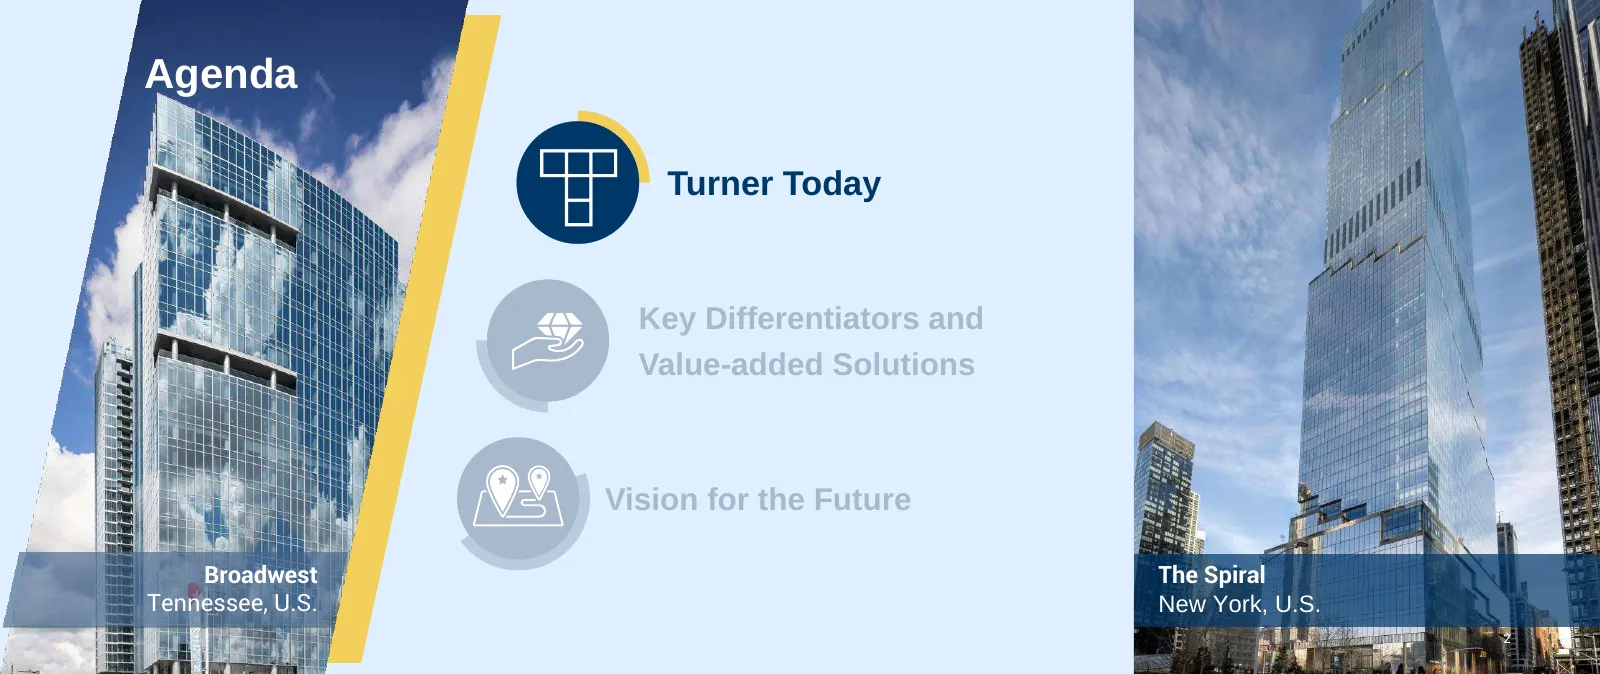
Slide 27: Agenda
Agenda Turner Today Key Differentiators and Value-added Solutions Vision for the Future Broadwest The Spiral Tennessee, U.S. New York, U.S. 2
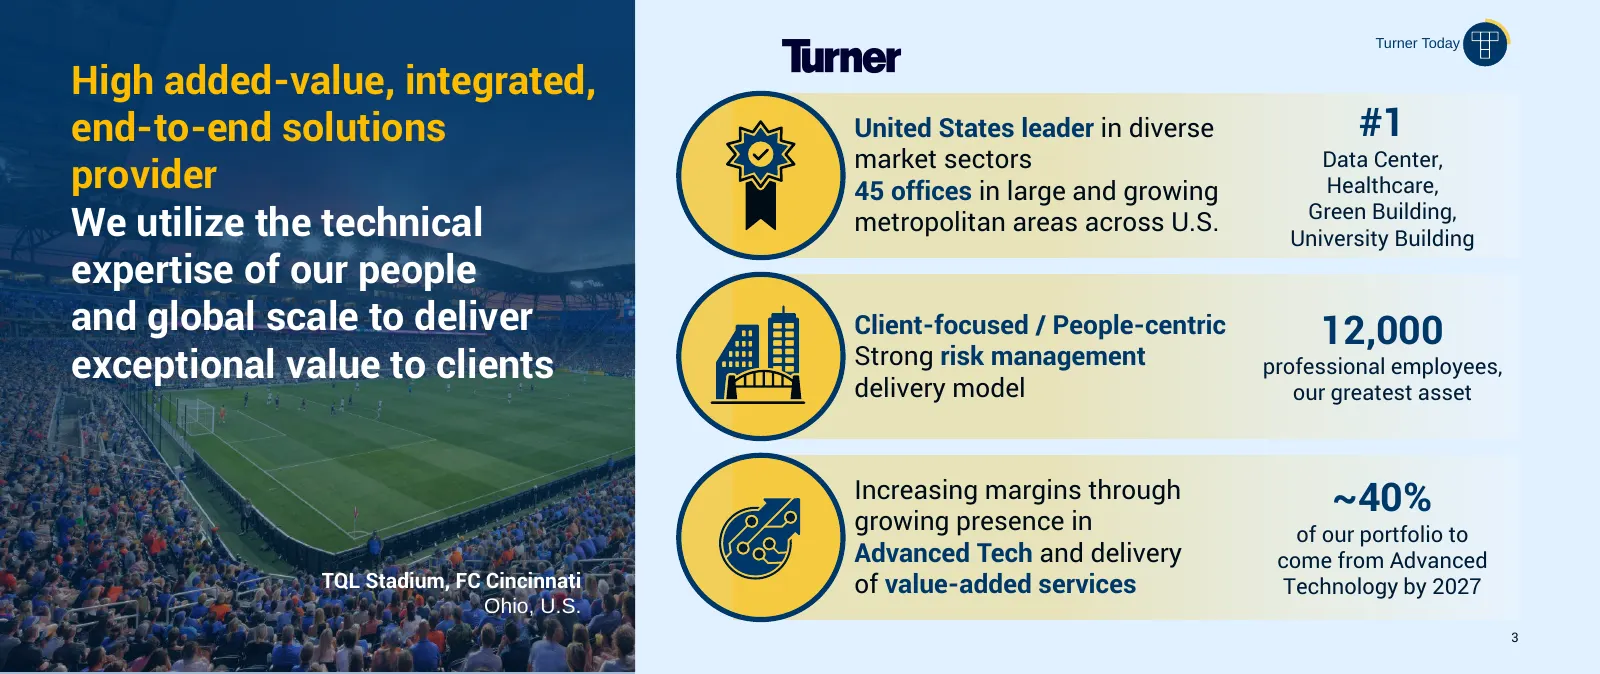
Slide 28: Turner: High added-value, integrated, end-to-end solutions provider
Turner Today High added-value, integrated, end-to-end solutions United States leader in diverse #1 market sectors Data Center, provider 45 offices in large and growing Healthcare, Green Building, We utilize the technical metropolitan areas across U.S. University Building expertise of our people and
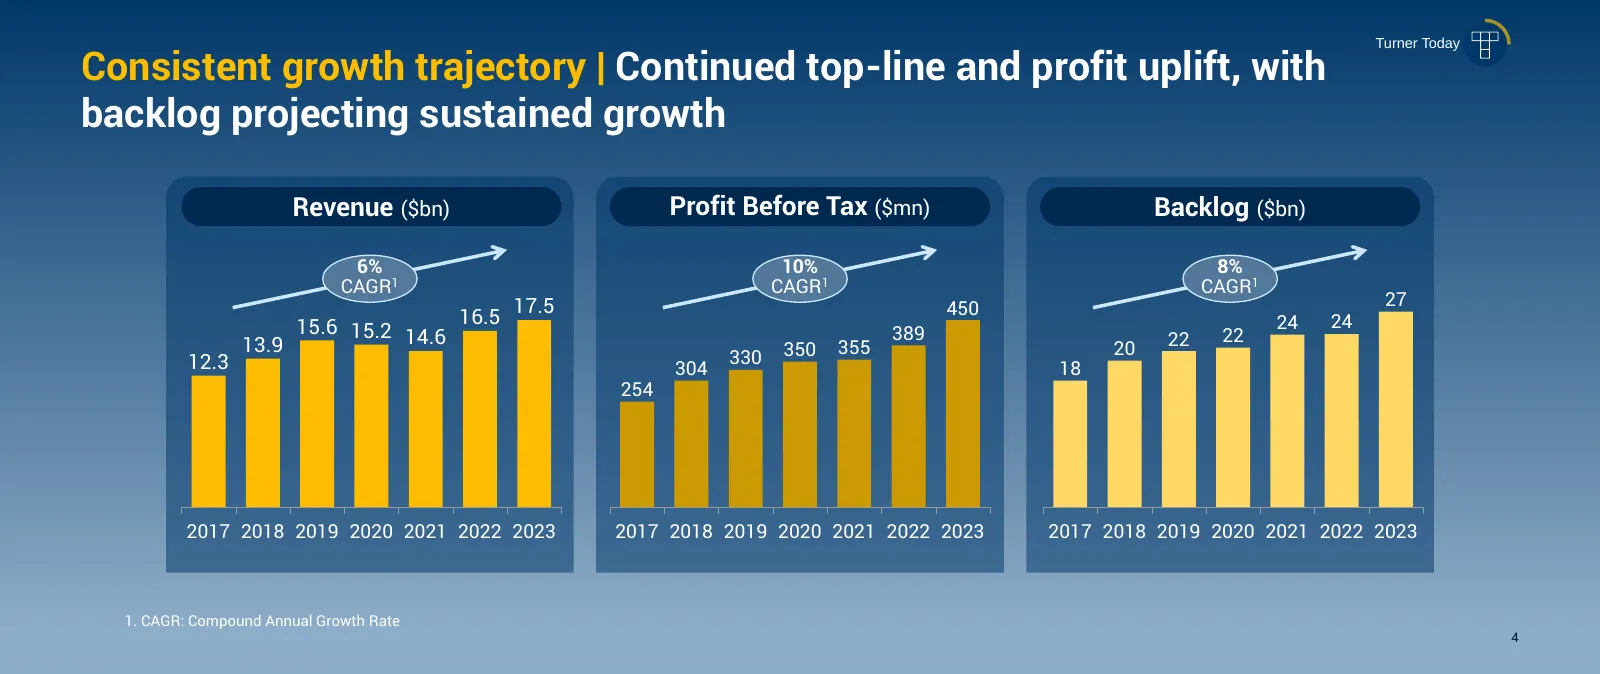
Slide 29: Consistent growth trajectory
Turner Today Consistent growth trajectory | Continued top-line and profit uplift, with backlog projecting sustained growth Revenue ($bn) Profit Before Tax ($mn) Backlog ($bn) 6% 10% 8% CAGR1 CAGR 1 CAGR1 17.5 450 27 15.6 15.2 16.5 24 24 14.6 389 22 22 13.9 350 355 20 12.3 330 304 18 254 2017 2018 20
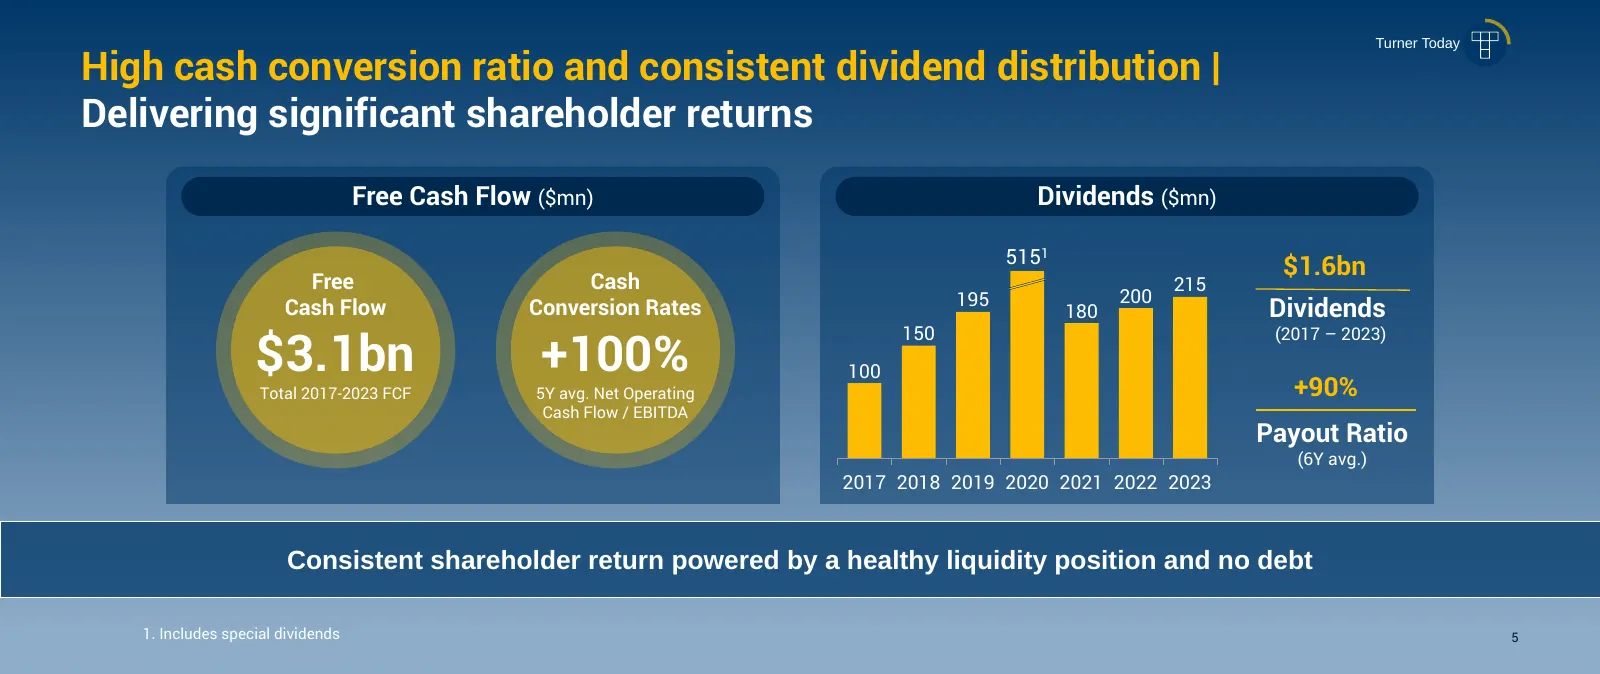
Slide 30: High cash conversion and consistent dividend distribution
Turner Today High cash conversion ratio and consistent dividend distribution | Delivering significant shareholder returns Free Cash Flow ($mn) Dividends ($mn) 5151 $1.6bn Free Cash 215 195 200 Cash Flow Conversion Rates 180 Dividends 150 (2017 – 2023) $3.1bn +100% 100 +90% Total 2017-2023 FCF 5Y avg
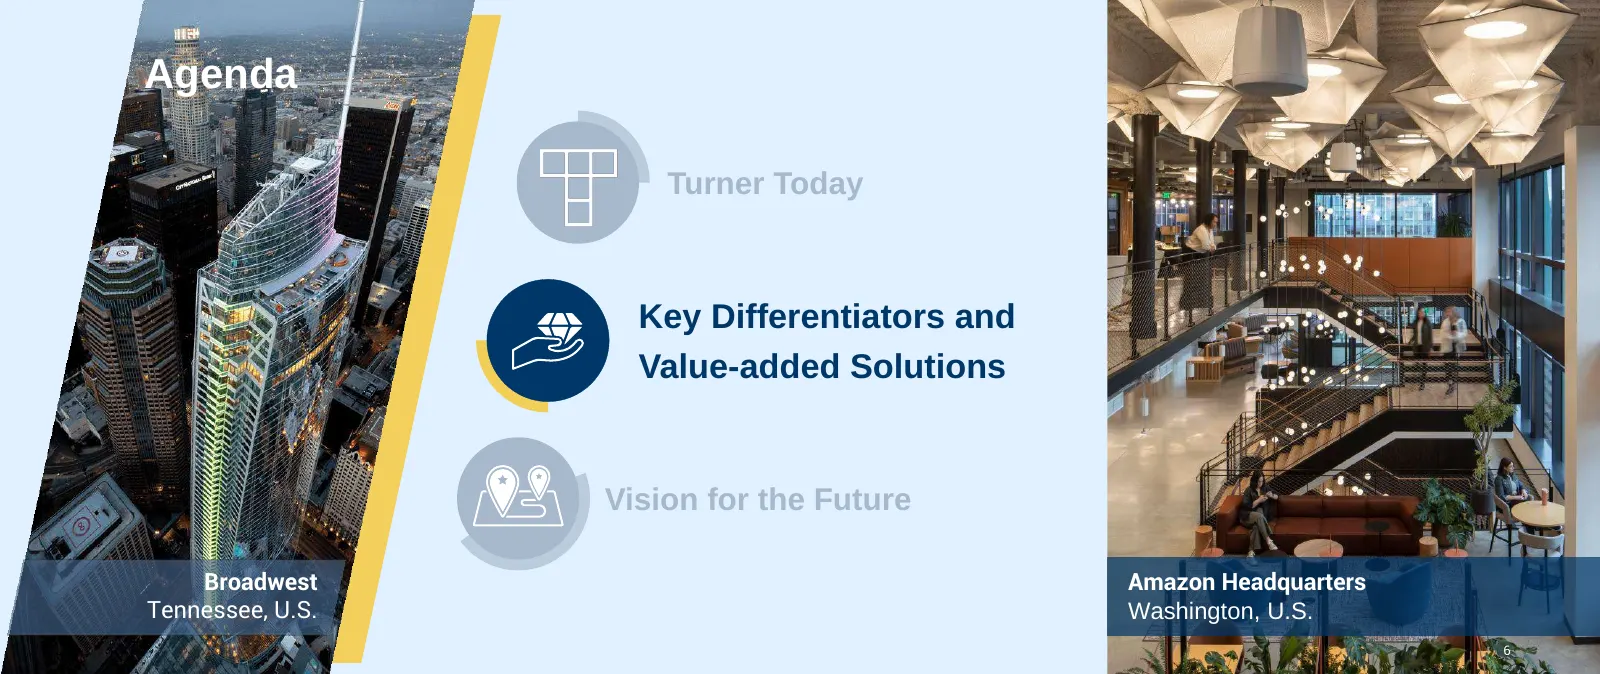
Slide 31: Agenda
Agenda Turner Today Key Differentiators and Value-added Solutions Vision for the Future Broadwest Amazon Headquarters Tennessee, U.S. Washington, U.S. 6 6
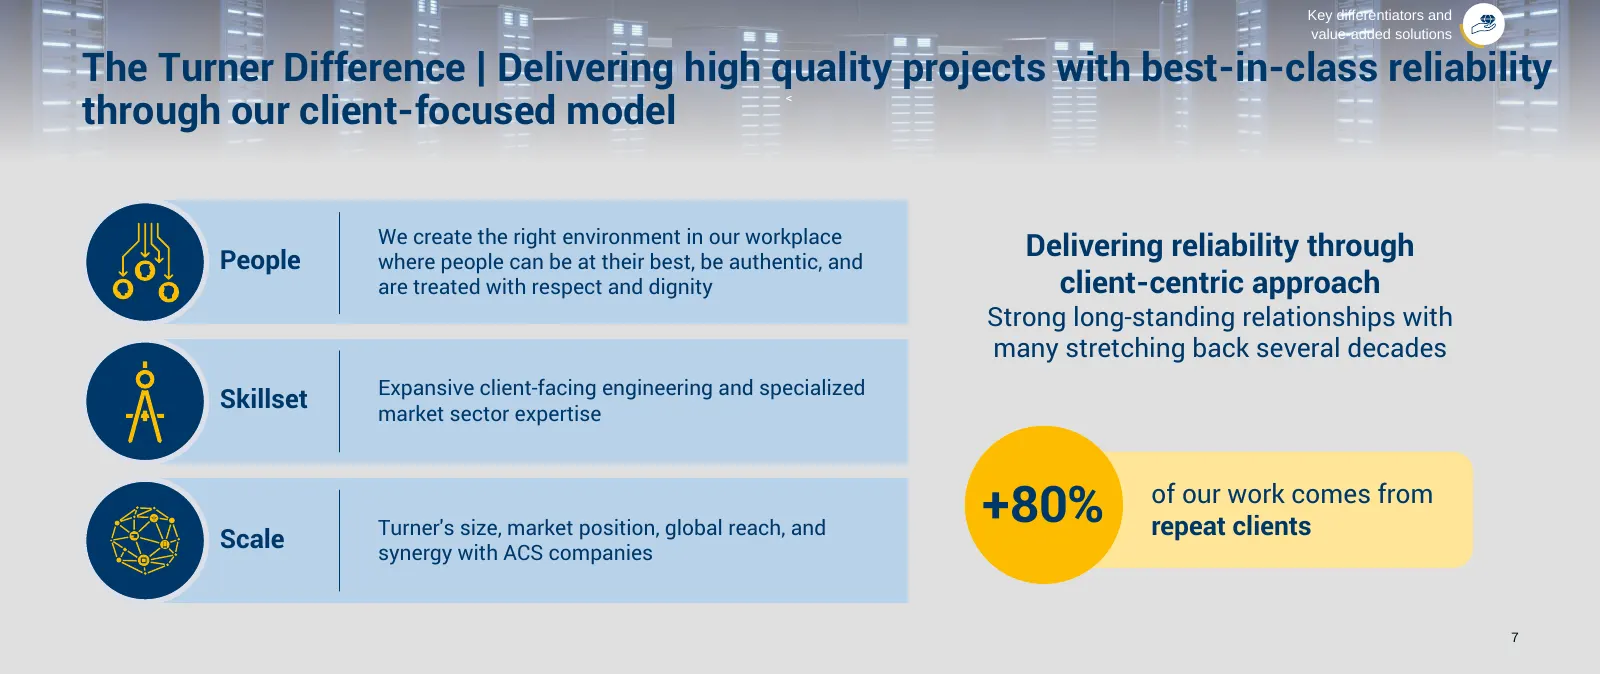
Slide 32: The Turner Difference: reliability through client-focused model
Key differentiators and value-added solutions The Turner Difference | Delivering high quality projects with best-in-class reliability through our client-focused model < We create the right environment in our workplace People where people can be at their best, be authentic, and Delivering reliability
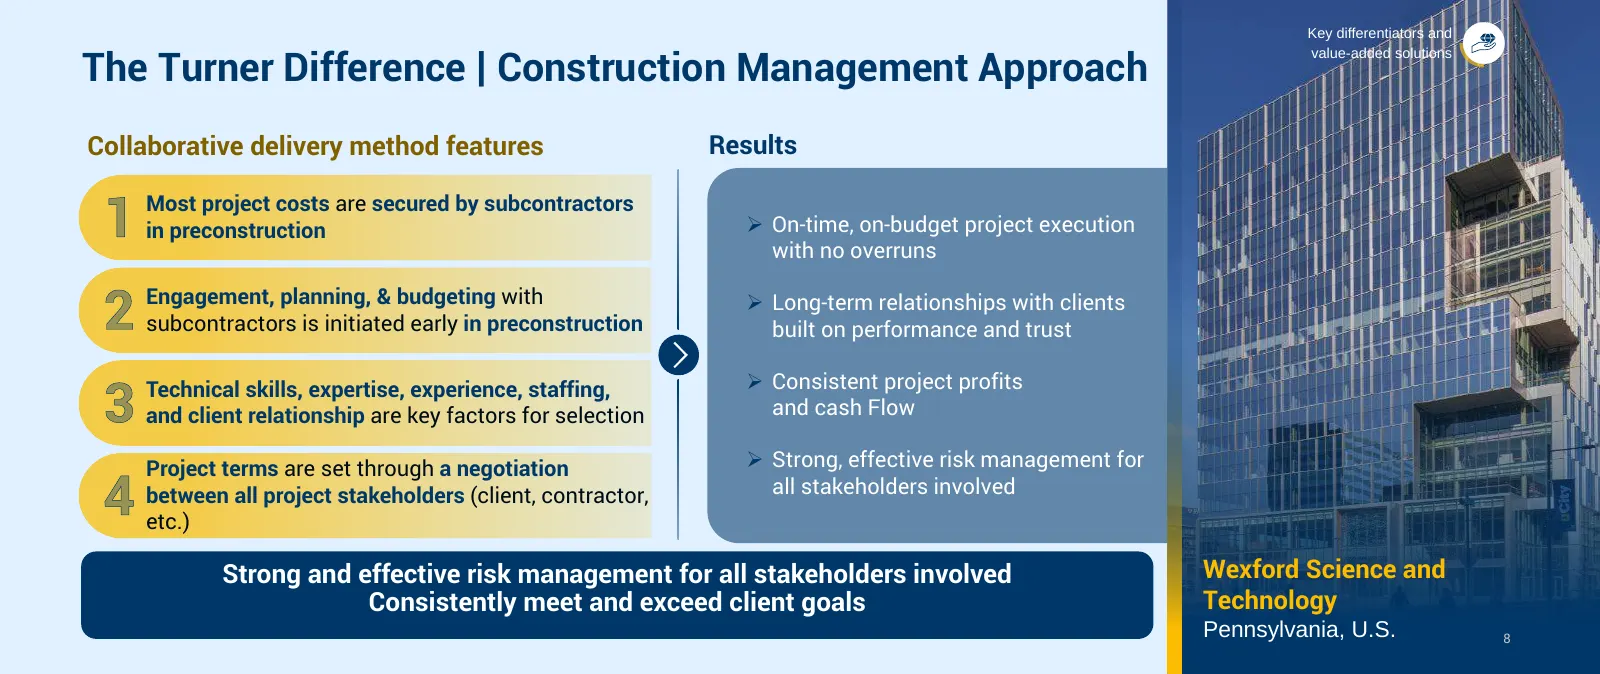
Slide 33: The Turner Difference: Construction Management Approach
Key differentiators and The Turner Difference | Construction Management Approach value-added solutions Collaborative delivery method features Results 1 Most project costs are secured by subcontractors in preconstruction ➢ On-time, on-budget project execution with no overruns 2 Engagement, planning,
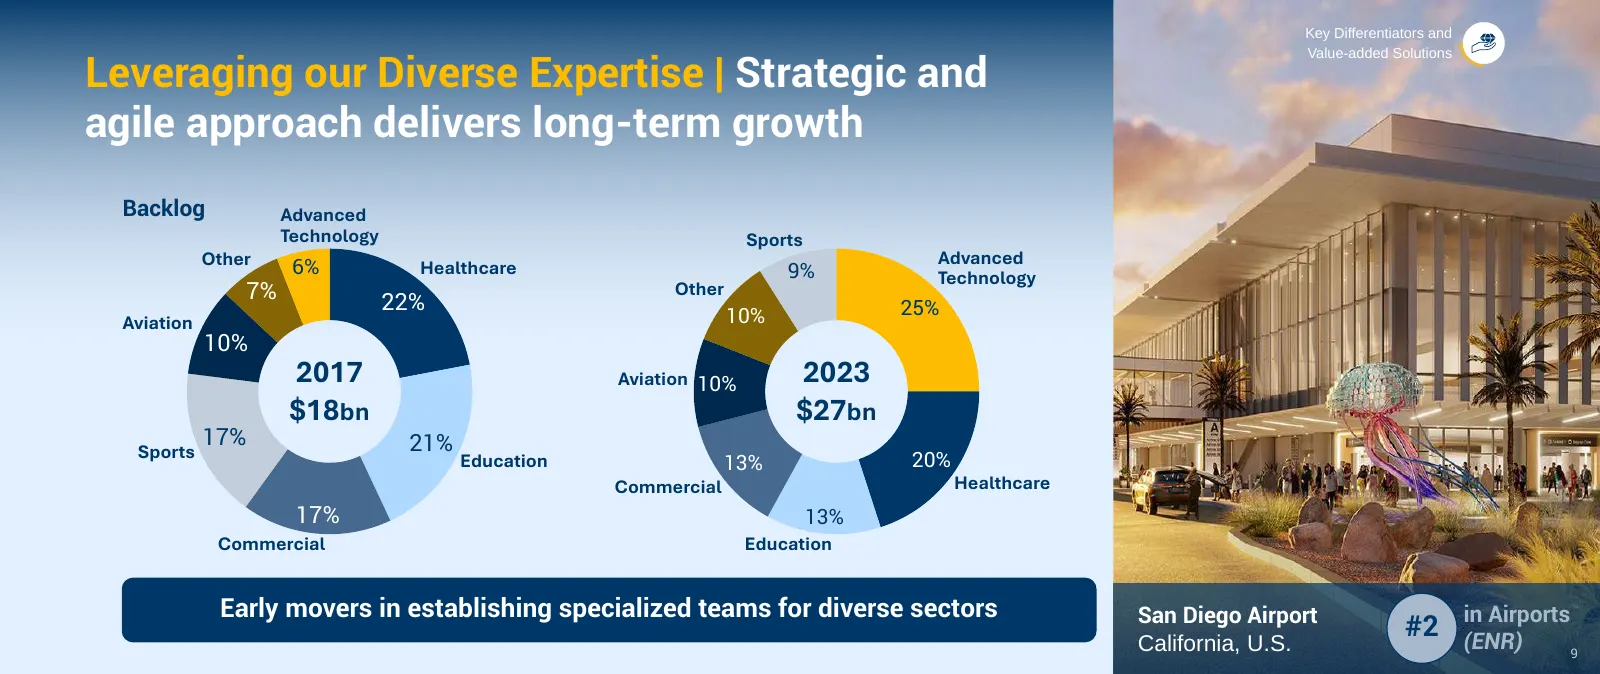
Slide 34: Leveraging our Diverse Expertise
Key Differentiators and Value-added Solutions Leveraging our Diverse Expertise | Strategic and agile approach delivers long-term growth Backlog Advanced Technology Sports Other Advanced 6% Healthcare 9% Technology 7% 22% Other 10% 25% Aviation 10% 2017 Aviation 10% 2023 $18bn $27bn 17% 21% Sports 20
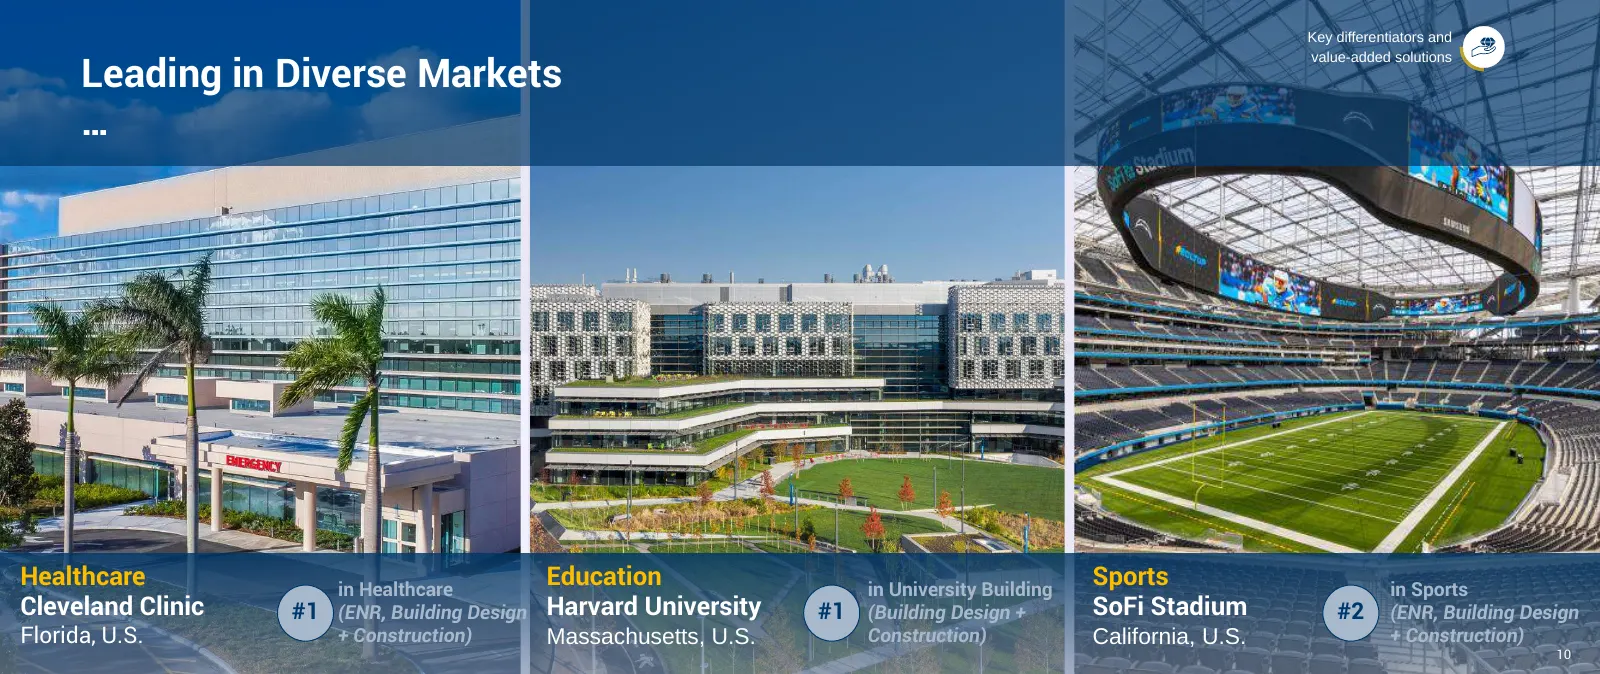
Slide 35: Leading in Diverse Markets
Key differentiators and Leading in Diverse Markets value-added solutions … Healthcare in Healthcare Education in University Building Sports in Sports Cleveland Clinic #1 (ENR, Building Design Harvard University #1 (Building Design + SoFi Stadium #2 (ENR, Building Design Florida, U.S. + Construction)
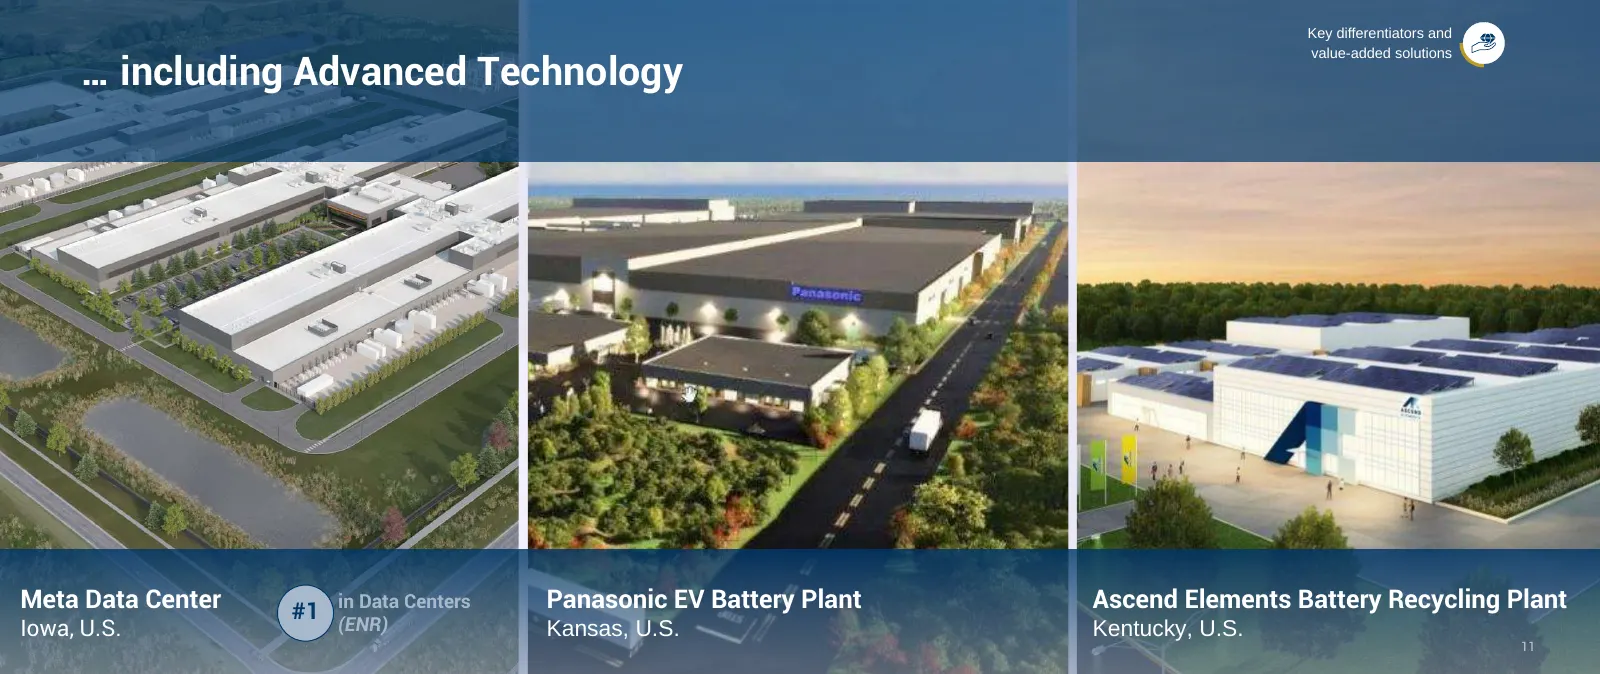
Slide 36: Including Advanced Technology
Key differentiators and value-added solutions … including Advanced Technology Meta Data Center in Data Centers #1 (ENR) Panasonic EV Battery Plant Ascend Elements Battery Recycling Plant Iowa, U.S. Kansas, U.S. Kentucky, U.S. 11 11
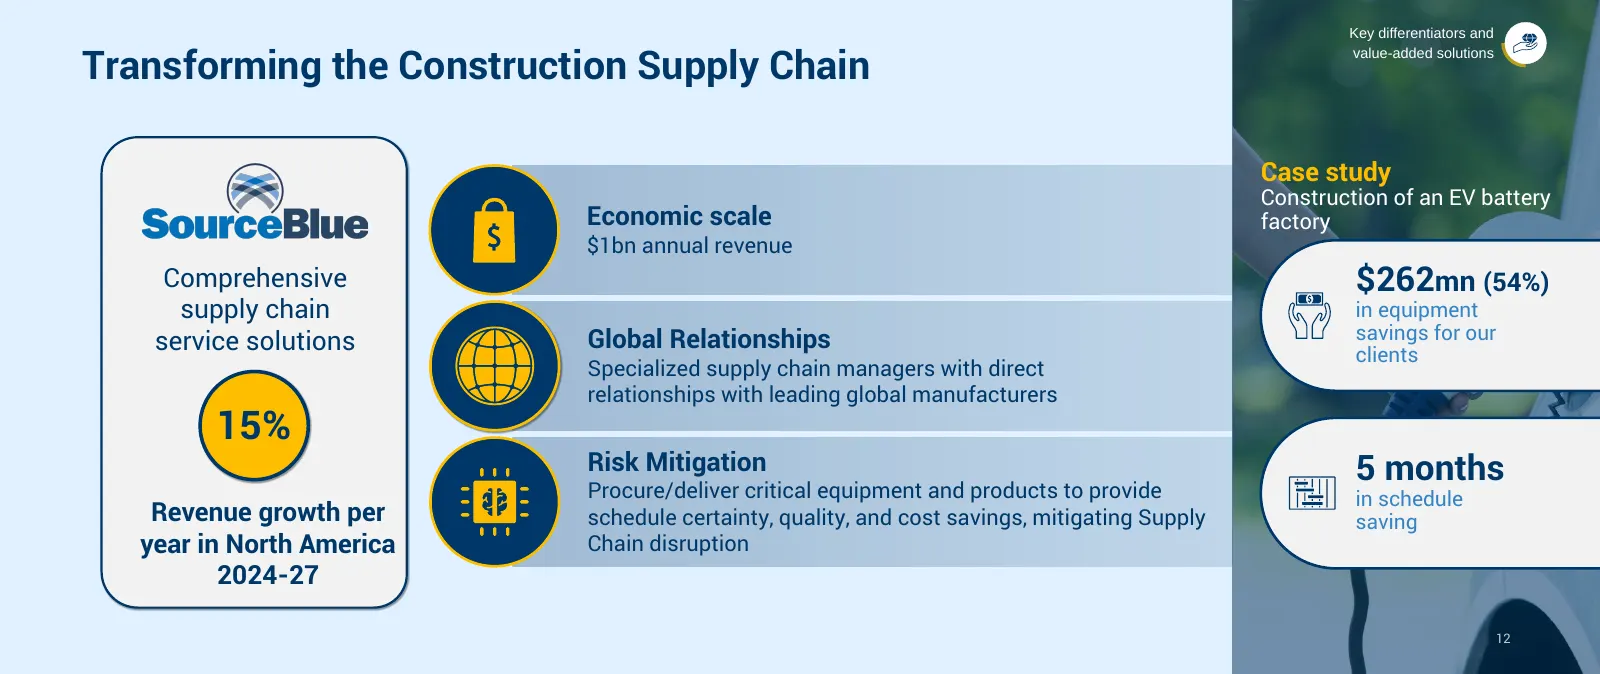
Slide 37: Transforming the Construction Supply Chain
Key differentiators and Transforming the Construction Supply Chain value-added solutions Case study Construction of an EV battery Economic scale factory $1bn annual revenue Comprehensive $262mn (54%) supply chain in equipment service solutions Global Relationships savings for our clients Specialized
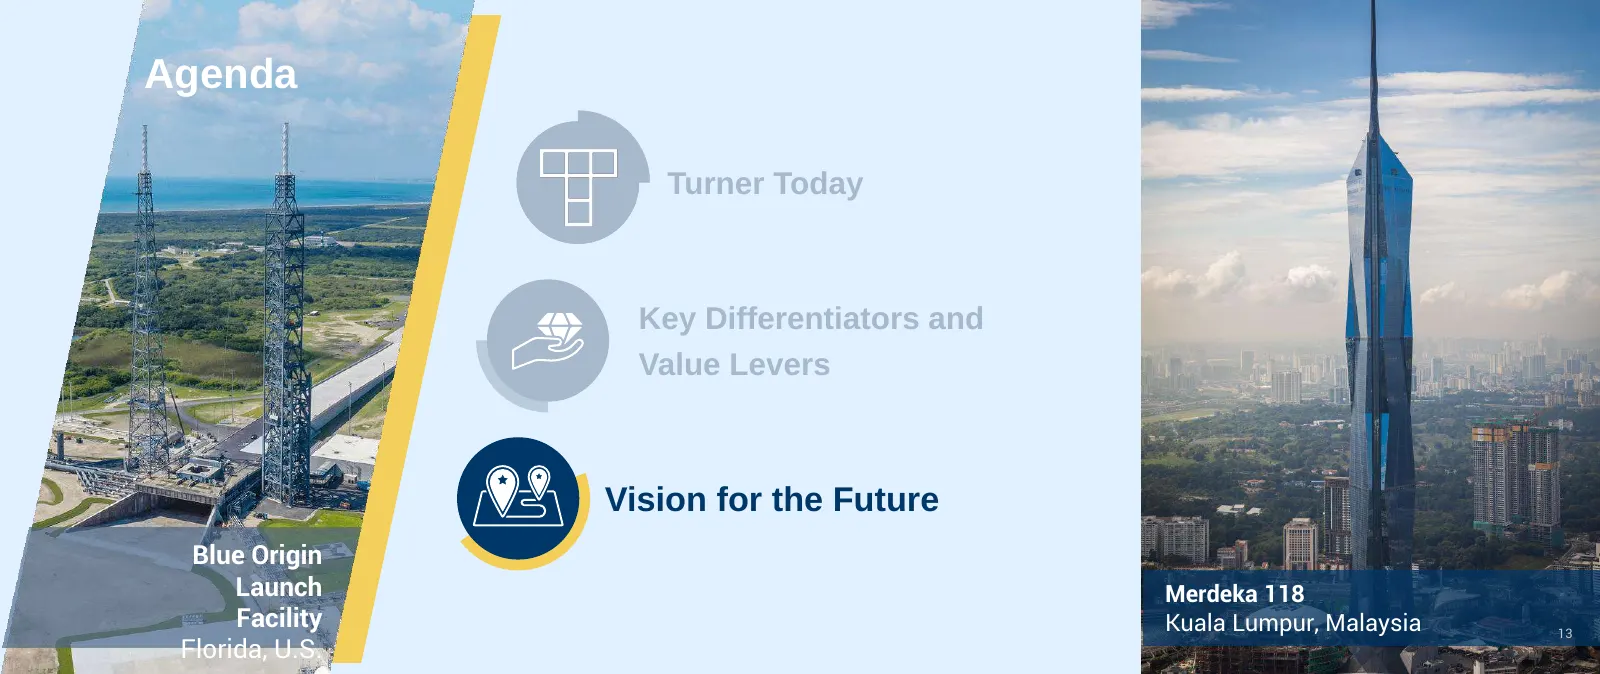
Slide 38: Agenda
Agenda Turner Today Key Differentiators and Value Levers Vision for the Future Blue Origin Launch Merdeka 118 Facility Kuala Lumpur, Malaysia 13 13 Florida, U.S.
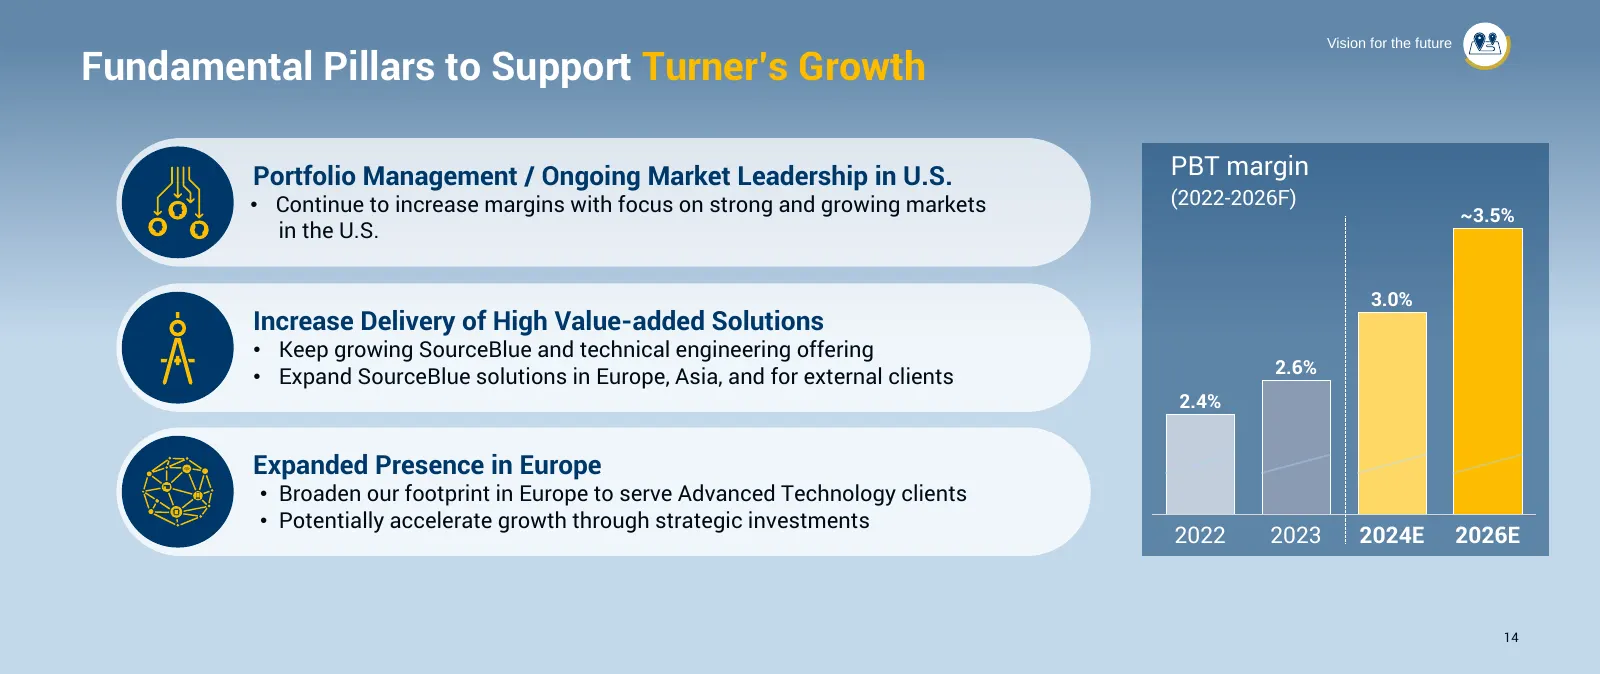
Slide 39: Fundamental Pillars to Support Turner's Growth
Vision for the future Fundamental Pillars to Support Turner’s Growth Portfolio Management / Ongoing Market Leadership in U.S. PBT margin • Continue to increase margins with focus on strong and growing markets (2022-2026F) ~3.5% in the U.S. 3.0% Increase Delivery of High Value-added Solutions • Keep
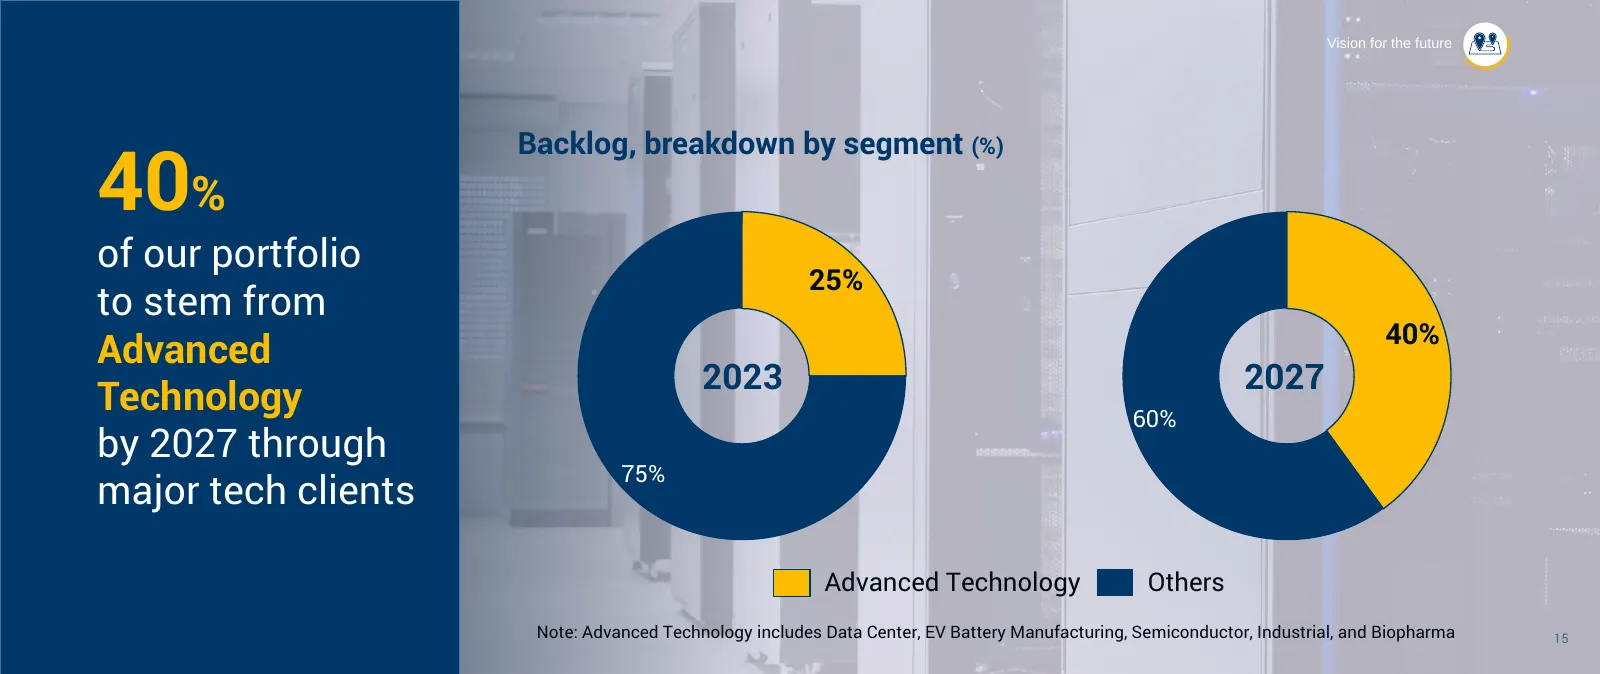
Slide 40: Advanced Technology to reach 40% of portfolio by 2027
Vision for the future Backlog, breakdown by segment (%) 40% of our portfolio 25% to stem from 40% Advanced 2023 2027 Technology 60% by 2027 through 75% major tech clients Advanced Technology Others Note: Advanced Technology includes Data Center, EV Battery Manufacturing, Semiconductor, Industrial, a
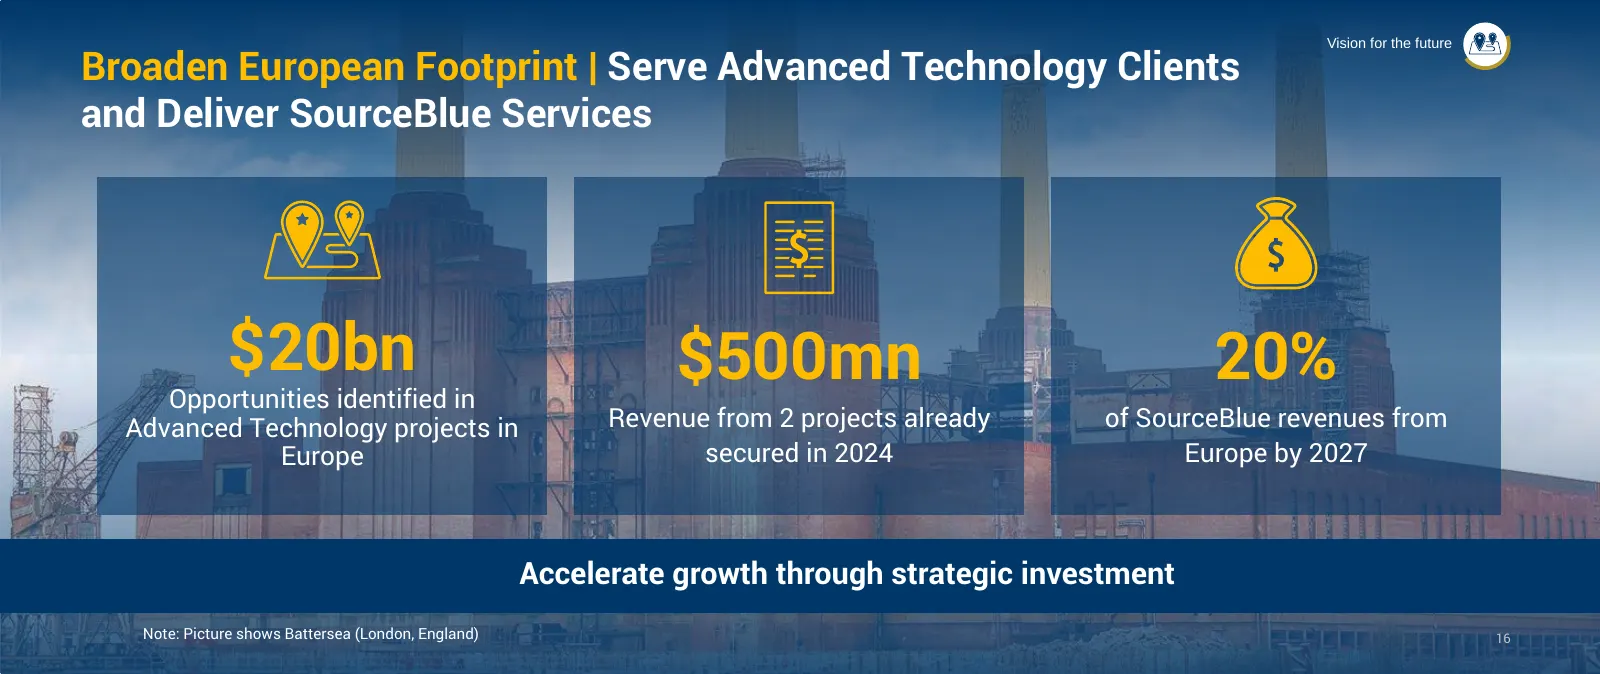
Slide 41: Broaden European Footprint
Vision for the future Broaden European Footprint | Serve Advanced Technology Clients and Deliver SourceBlue Services $20bn $500mn 20% Opportunities identified in Advanced Technology projects in Revenue from 2 projects already of SourceBlue revenues from Europe secured in 2024 Europe by 2027 Accelera
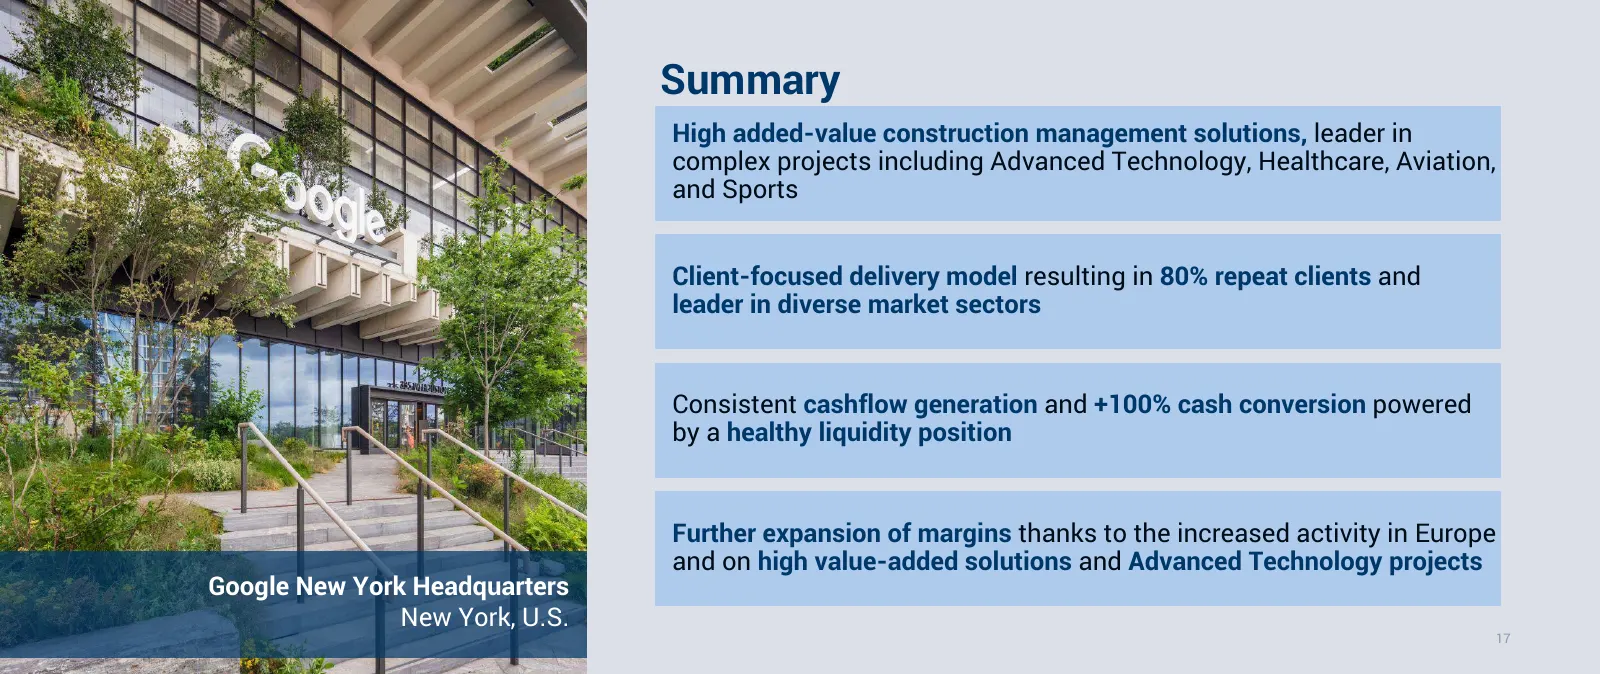
Slide 42: Summary
Summary High added-value construction management solutions, leader in complex projects including Advanced Technology, Healthcare, Aviation, and Sports Client-focused delivery model resulting in 80% repeat clients and leader in diverse market sectors Consistent cashflow generation and +100% cash conv
Slide 43: Integrated Solutions - CIMIC
Capital Markets Day Integrated Solutions - CIMIC 17th April 2024 18
Slide 44: Agenda
Agenda CIMIC Today Key Differentiators 19 19
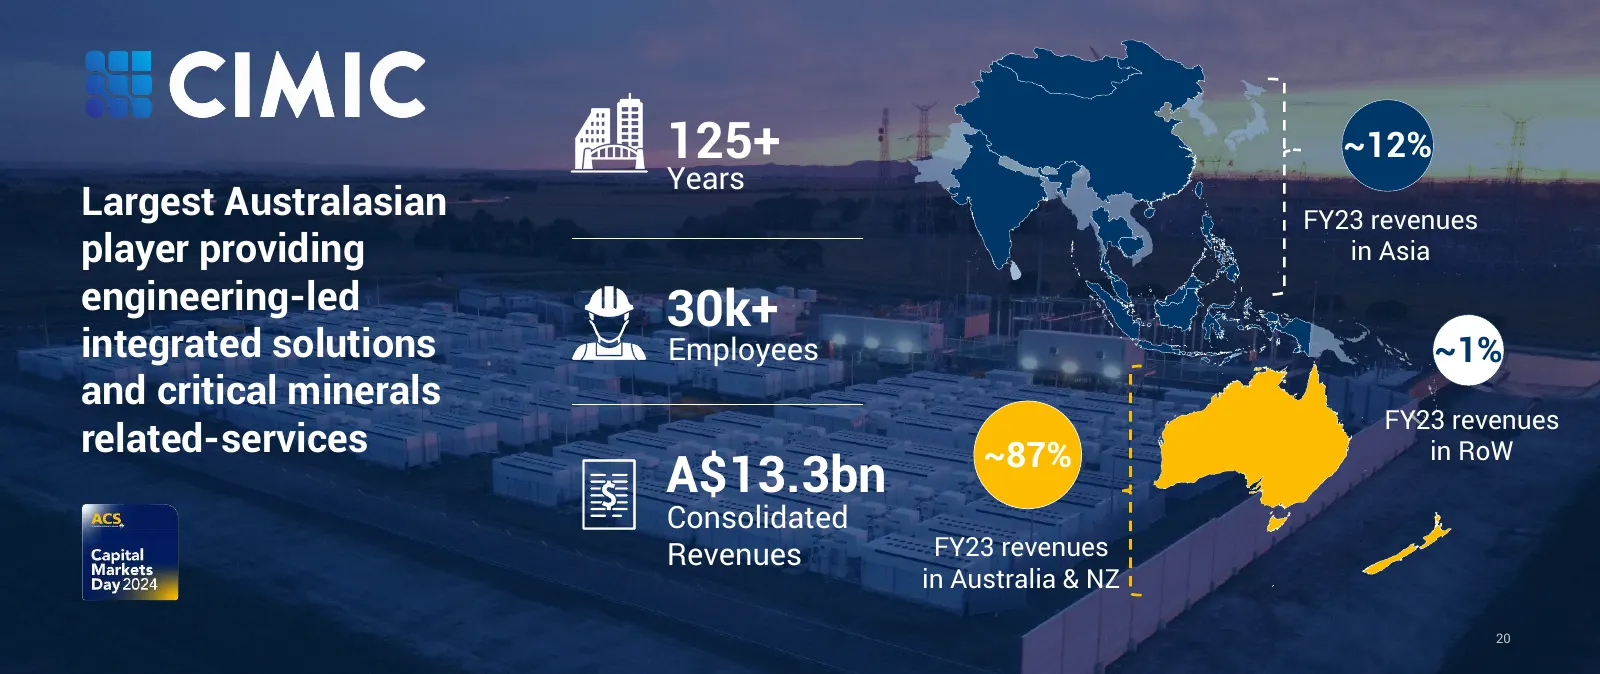
Slide 45: CIMIC Today
125+ ~12% Years Largest Australasian FY23 revenues player providing in Asia engineering-led 30k+ integrated solutions Employees ~1% and critical minerals FY23 revenues related-services ~87% in RoW A$13.3bn Consolidated Revenues FY23 revenues in Australia & NZ 20 20
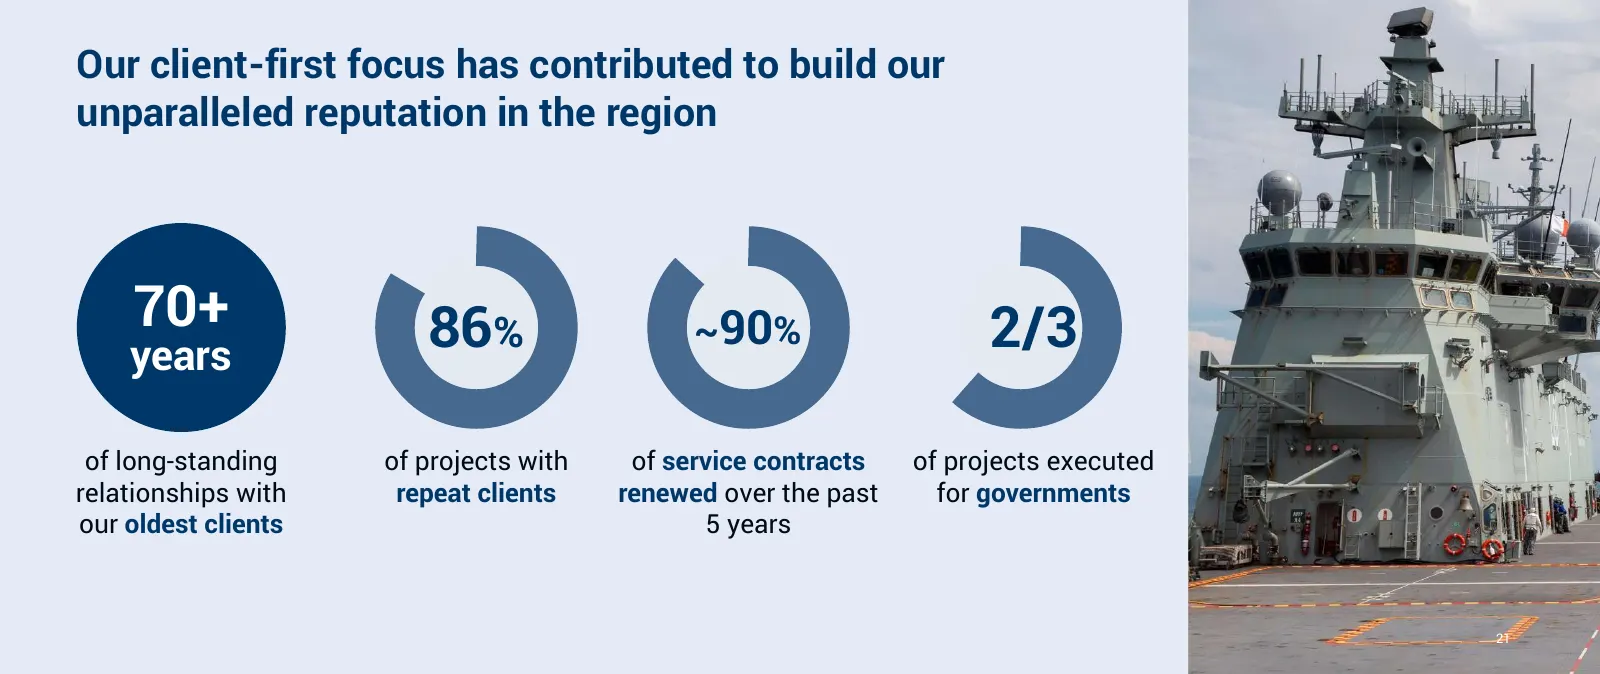
Slide 46: Client-first focus and reputation in the region
Our client-first focus has contributed to build our unparalleled reputation in the region 70+ 86% ~90% 2/3 years of long-standing of projects with of service contracts of projects executed relationships with repeat clients renewed over the past for governments our oldest clients 5 years 21
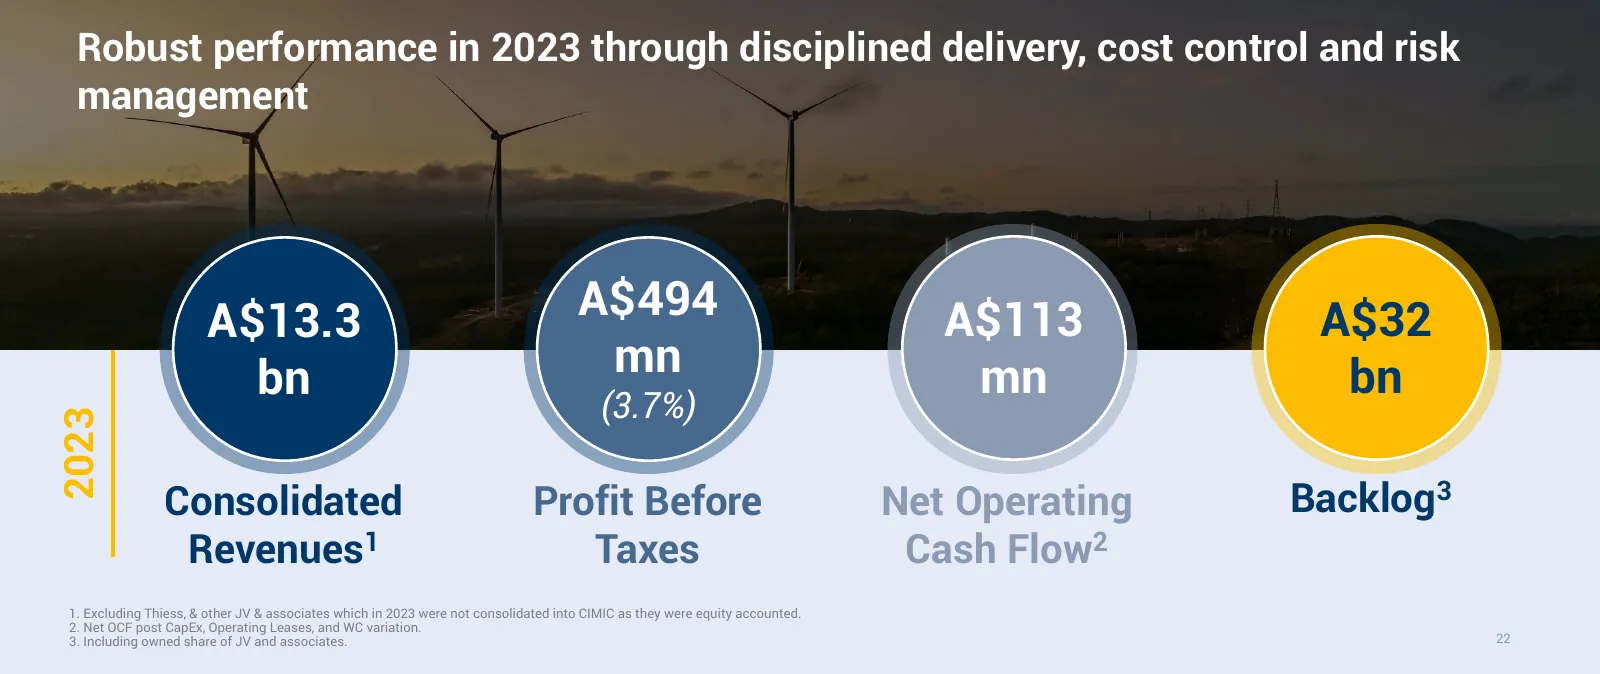
Slide 47: Robust performance in 2023
Robust performance in 2023 through disciplined delivery, cost control and risk management A$13.3 A$494 A$113 A$32 bn mn mn bn (3.7%) 2023 Consolidated Profit Before Net Operating Backlog 3 Revenues 1 Taxes Cash Flow 2 1. Excluding Thiess, & other JV & associates which in 2023 were not consolidated i
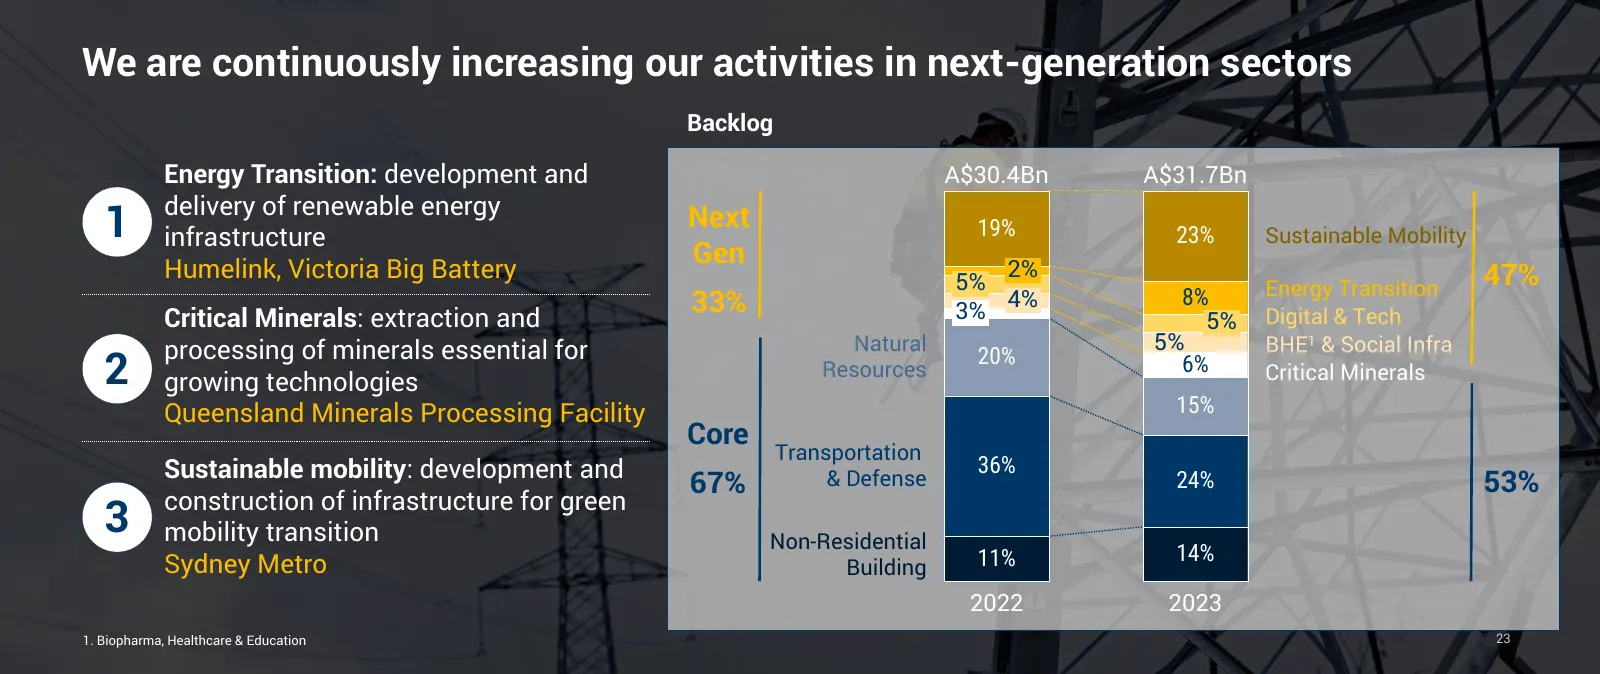
Slide 48: Increasing activities in next-generation sectors
We are continuously increasing our activities in next-generation sectors Backlog Energy Transition: development and A$30.4Bn A$31.7Bn delivery of renewable energy 1 infrastructure Next 19% 23% Sustainable Mobility Gen Humelink, Victoria Big Battery 5% 2% 47% 4% 8% Energy Transition 33% 3% Critical M
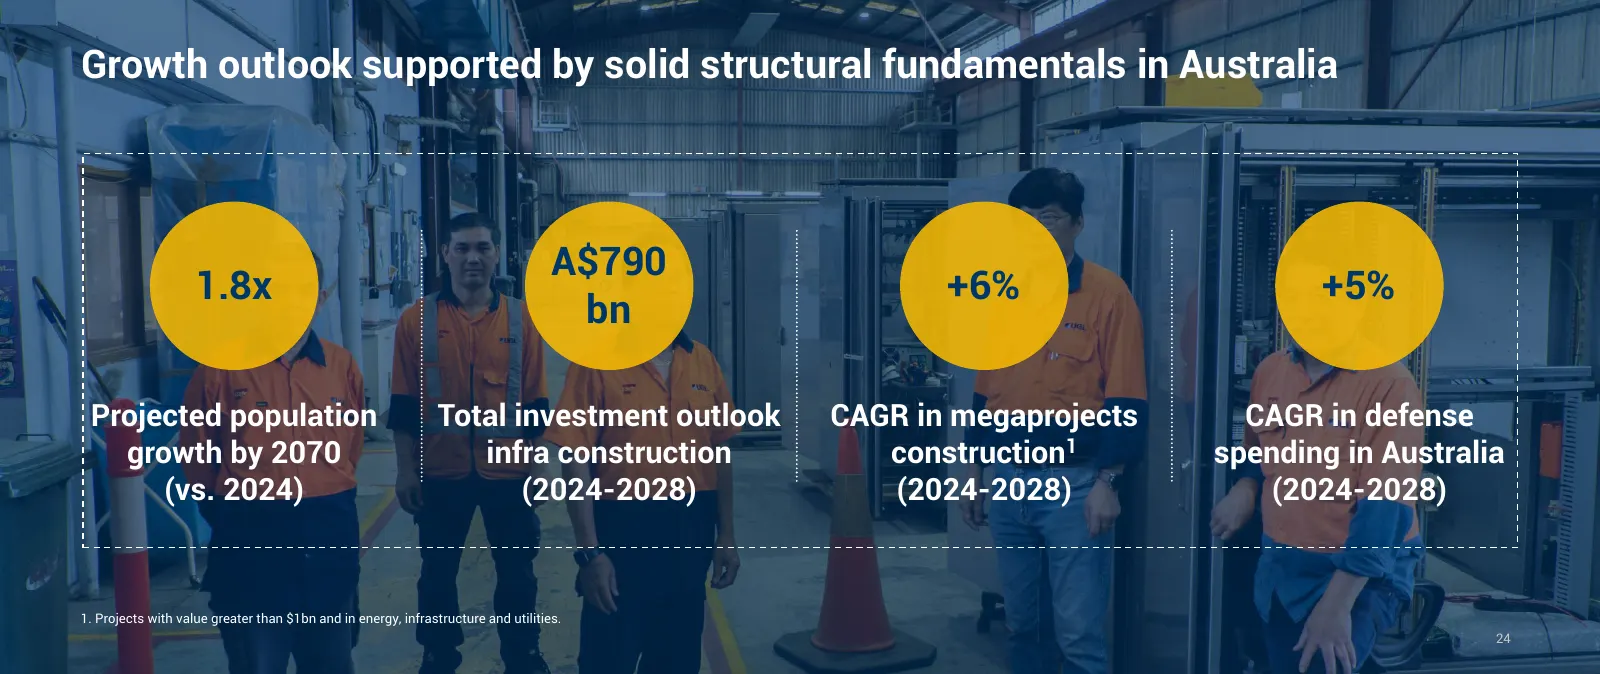
Slide 49: Growth outlook supported by structural fundamentals in Australia
Growth outlook supported by solid structural fundamentals in Australia A$790 1.8x +6% +5% bn Projected population Total investment outlook CAGR in megaprojects CAGR in defense growth by 2070 infra construction construction 1 spending in Australia (vs. 2024) (2024-2028) (2024-2028) (2024-2028) 1. Pro
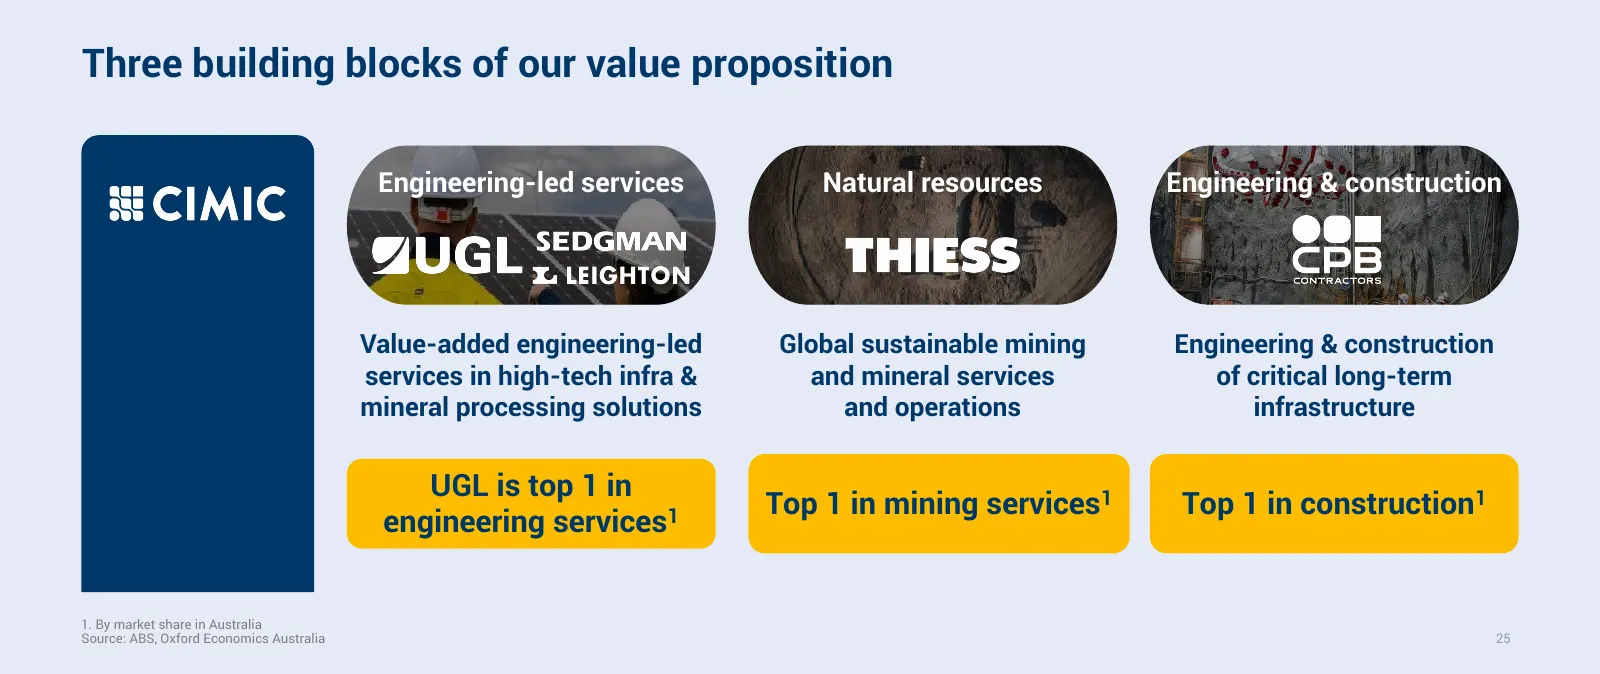
Slide 50: Three building blocks of our value proposition
Three building blocks of our value proposition Engineering-led services Natural resources Engineering & construction Value-added engineering-led Global sustainable mining Engineering & construction services in high-tech infra & and mineral services of critical long-term mineral processing solutions
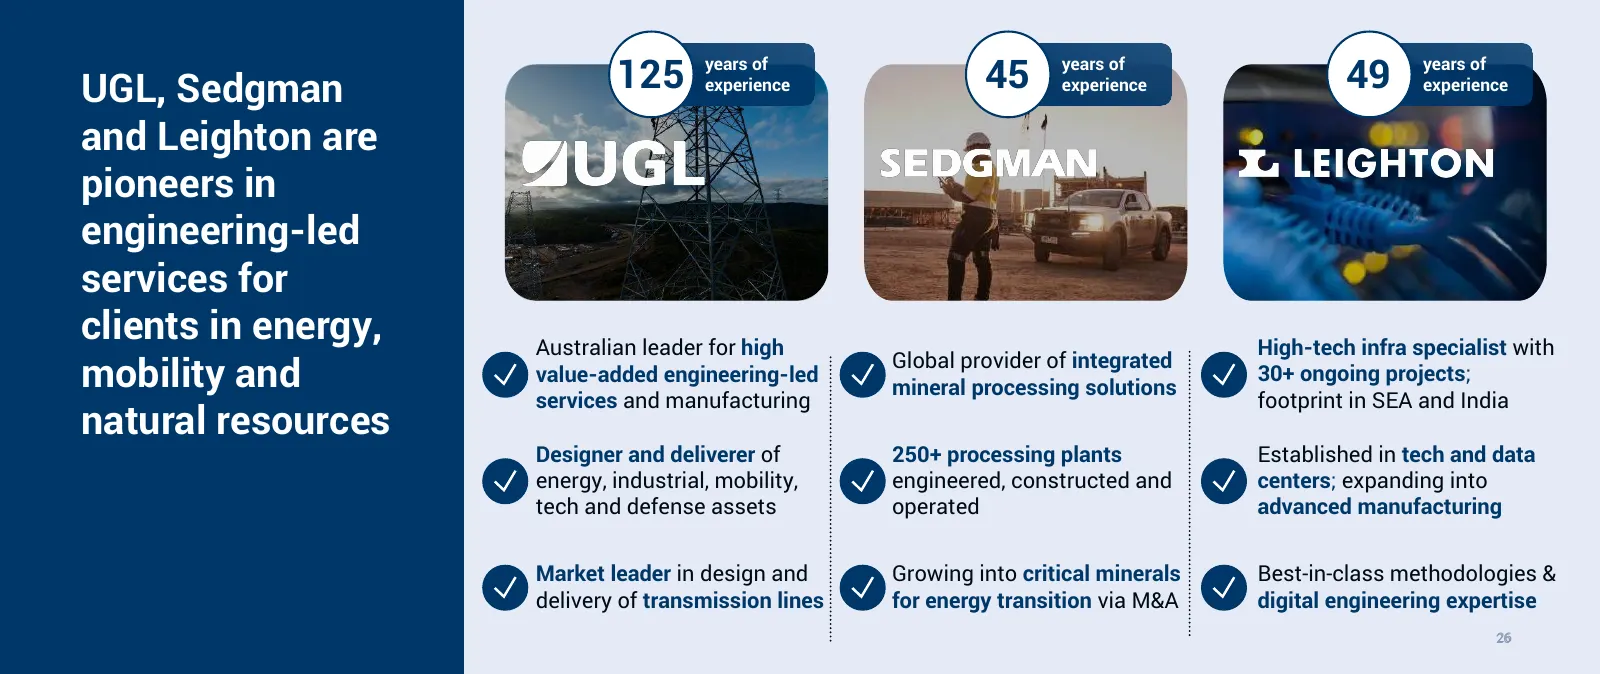
Slide 51: UGL, Sedgman and Leighton are pioneers in engineering-led services
UGL, Sedgman 125 years of experience 45 years of experience 49 years of experience and Leighton are pioneers in engineering-led services for clients in energy, Australian leader for high High-tech infra specialist with Global provider of integrated mobility and value-added engineering-led mineral pr
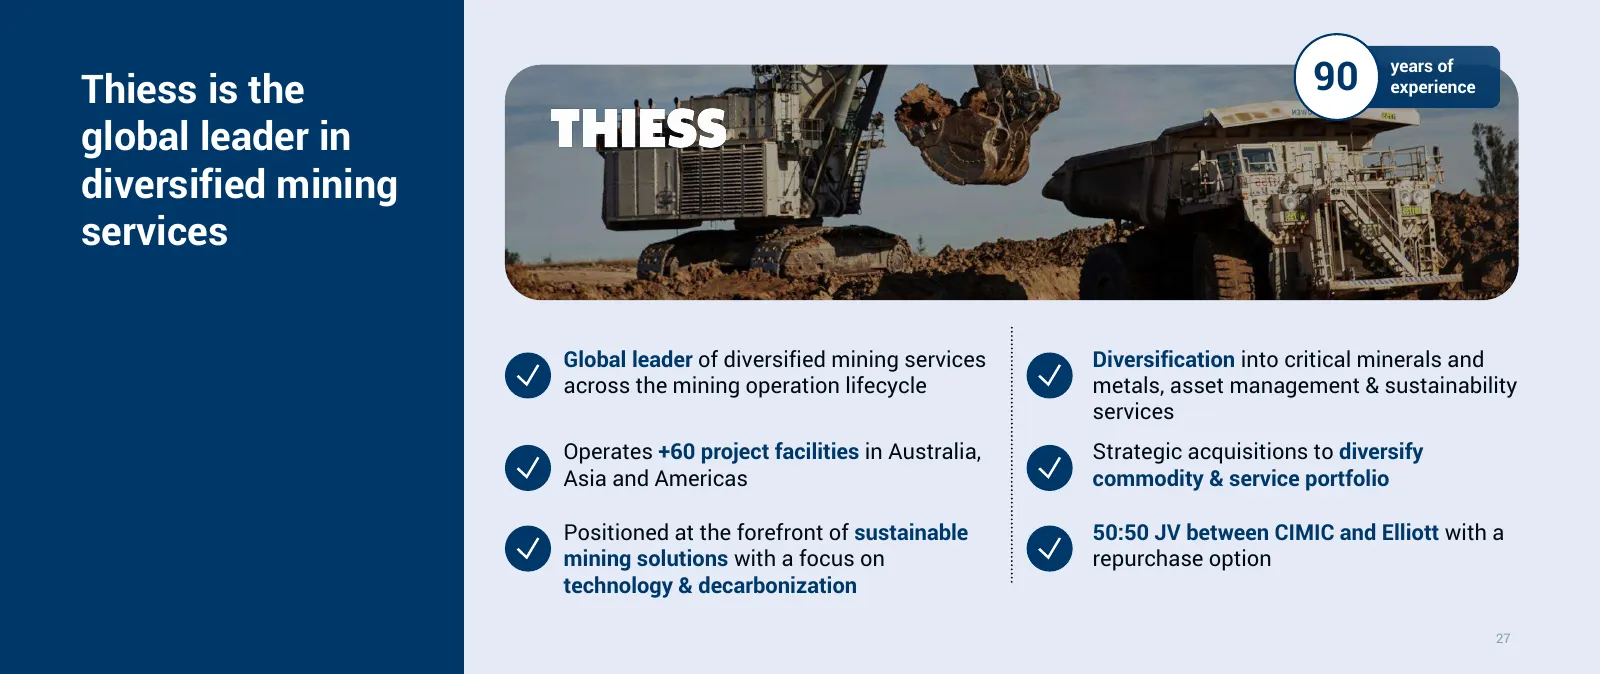
Slide 52: Thiess is the global leader in diversified mining services
Thiess is the 90 years of experience global leader in diversified mining services Global leader of diversified mining services Diversification into critical minerals and across the mining operation lifecycle metals, asset management & sustainability services Operates +60 project facilities in Austra
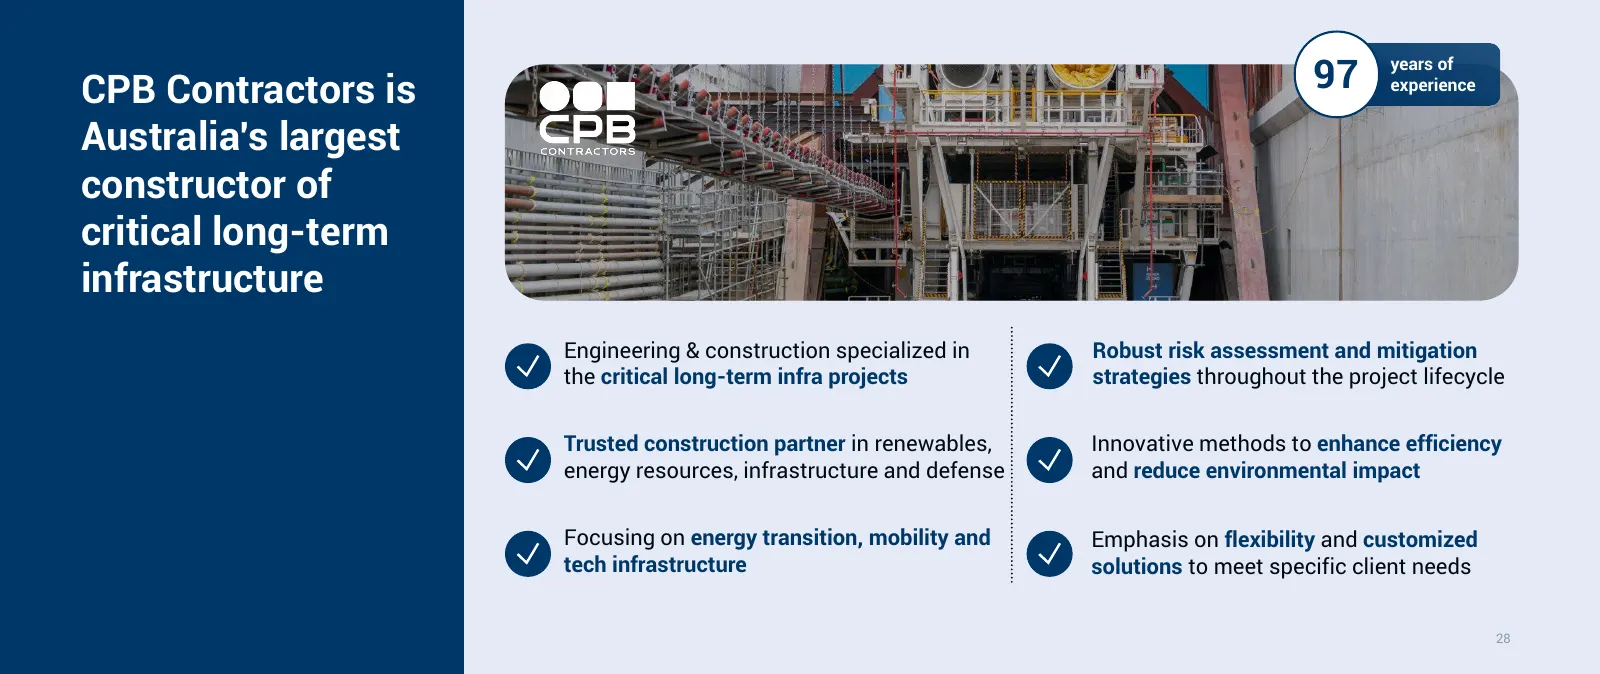
Slide 53: CPB Contractors is Australia's largest constructor
CPB Contractors is 97 years of experience Australia's largest constructor of critical long-term infrastructure Engineering & construction specialized in Robust risk assessment and mitigation the critical long-term infra projects strategies throughout the project lifecycle Trusted construction partne
Slide 54: Agenda
Agenda CIMIC Today Key Differentiators 2929
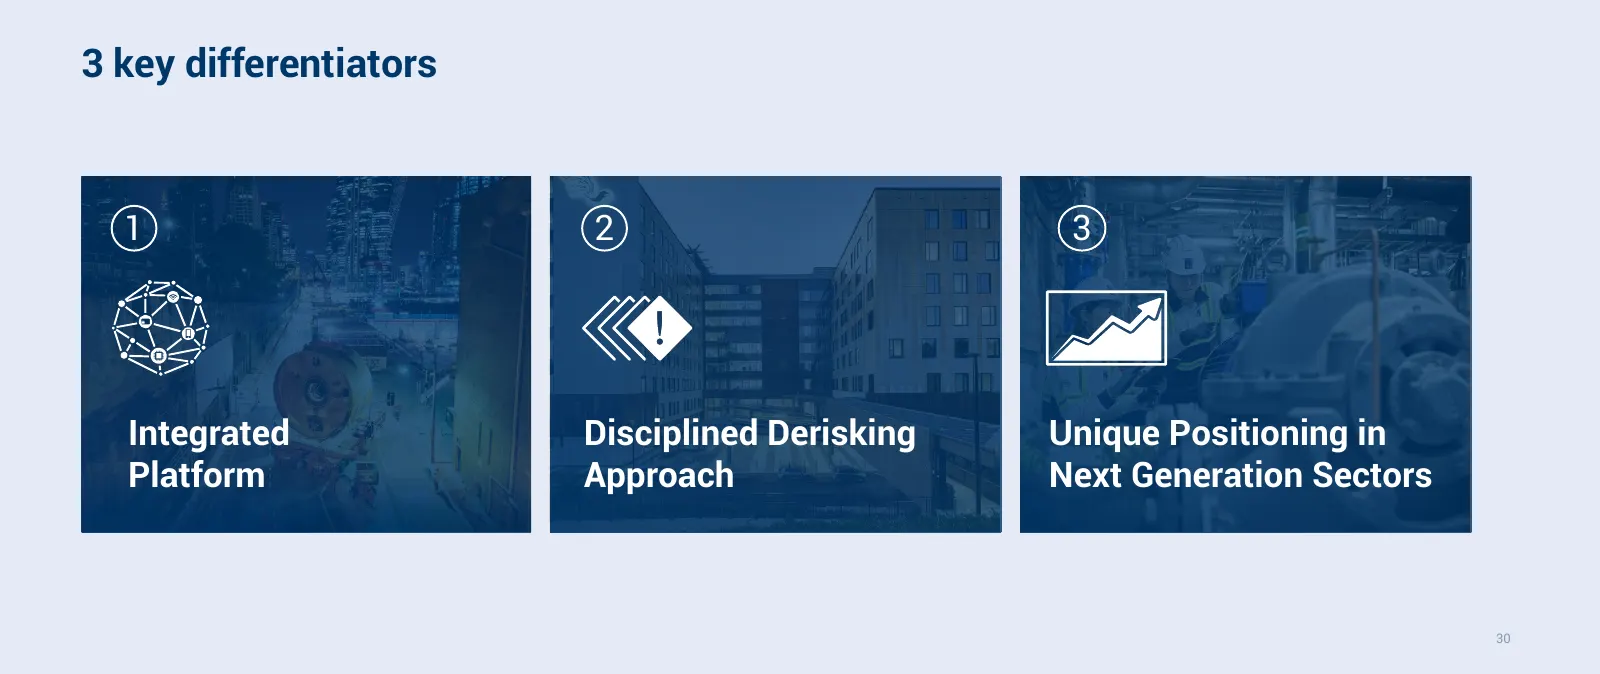
Slide 55: 3 key differentiators
3 key differentiators 1 2 3 Integrated Disciplined Derisking Unique Positioning in Platform Approach Next Generation Sectors 30
Slide 56: 3 key differentiators
3 key differentiators 1 2 3 Integrated Disciplined Derisking Unique Positioning in Platform Approach Next Generation Sectors 31
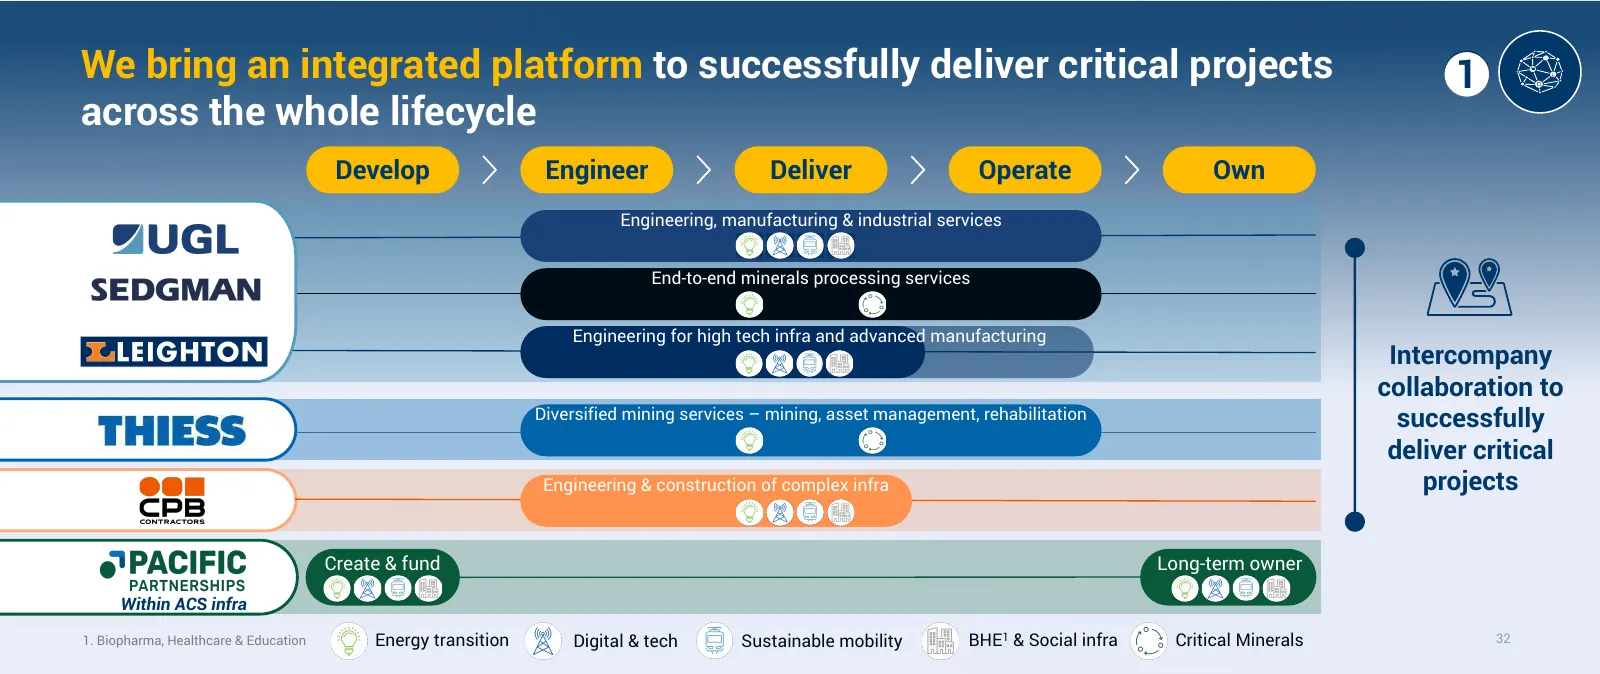
Slide 57: Integrated platform across the whole project lifecycle
We bring an integrated platform to successfully deliver critical projects 1 across the whole lifecycle Develop Engineer Deliver Operate Own Engineering, manufacturing & industrial services End-to-end minerals processing services Engineering for high tech infra and advanced manufacturing Intercompany
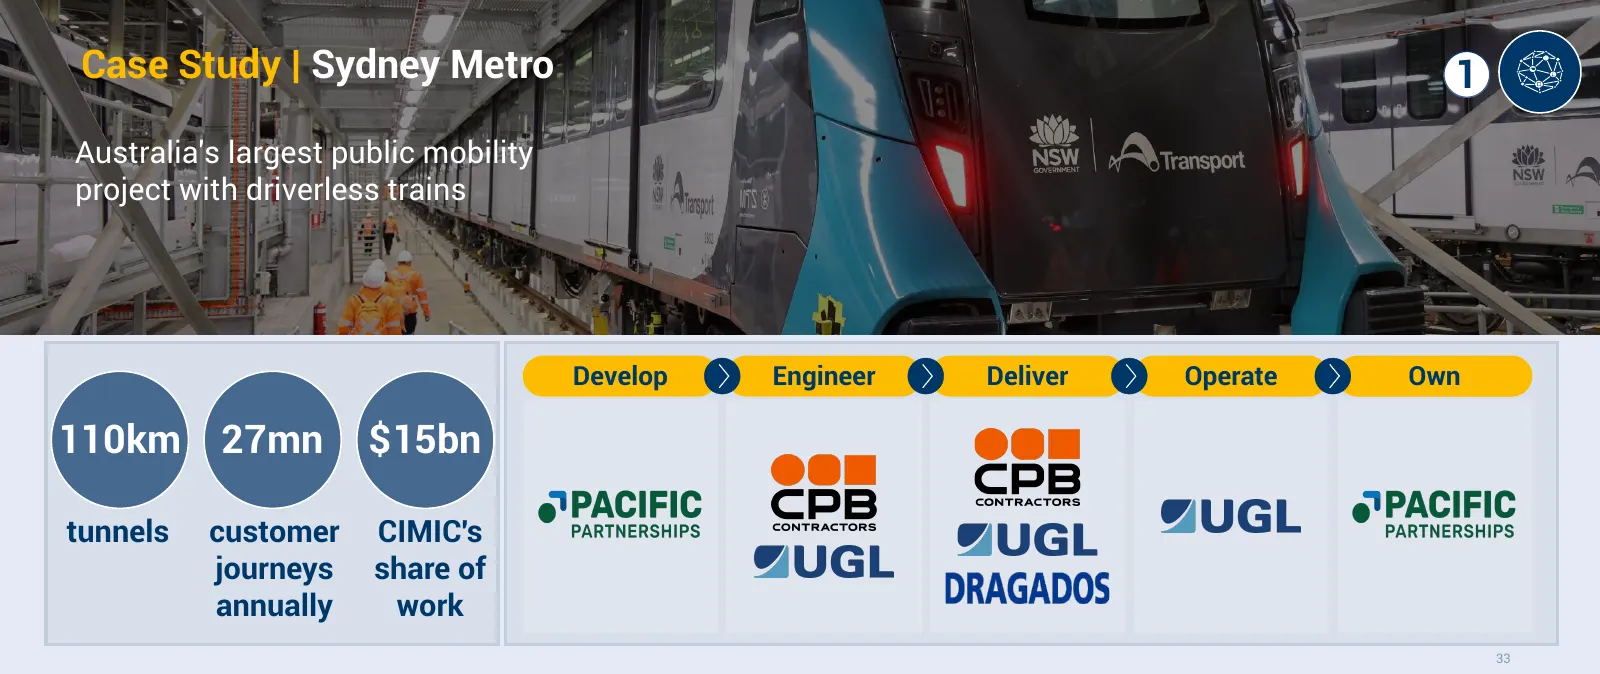
Slide 58: Case Study: Sydney Metro
Case Study | Sydney Metro 1 Australia's largest public mobility project with driverless trains Develop Engineer Deliver Operate Own 110km 27mn $15bn tunnels customer CIMIC's journeys share of annually work 33
Slide 59: 3 key differentiators
3 key differentiators 1 2 3 Integrated Disciplined Derisking Unique Positioning in Platform Approach Next Generation Sectors 34
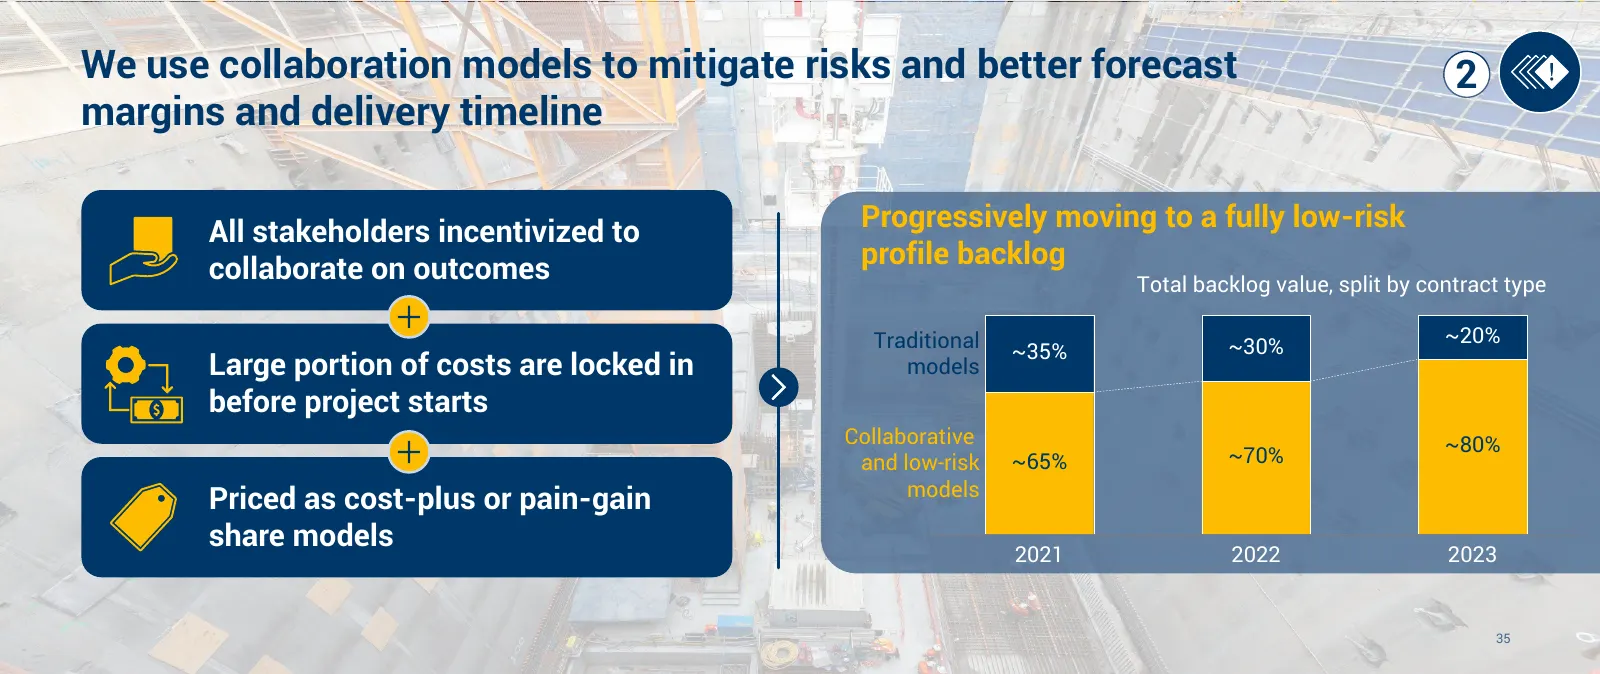
Slide 60: Collaboration models to mitigate risks
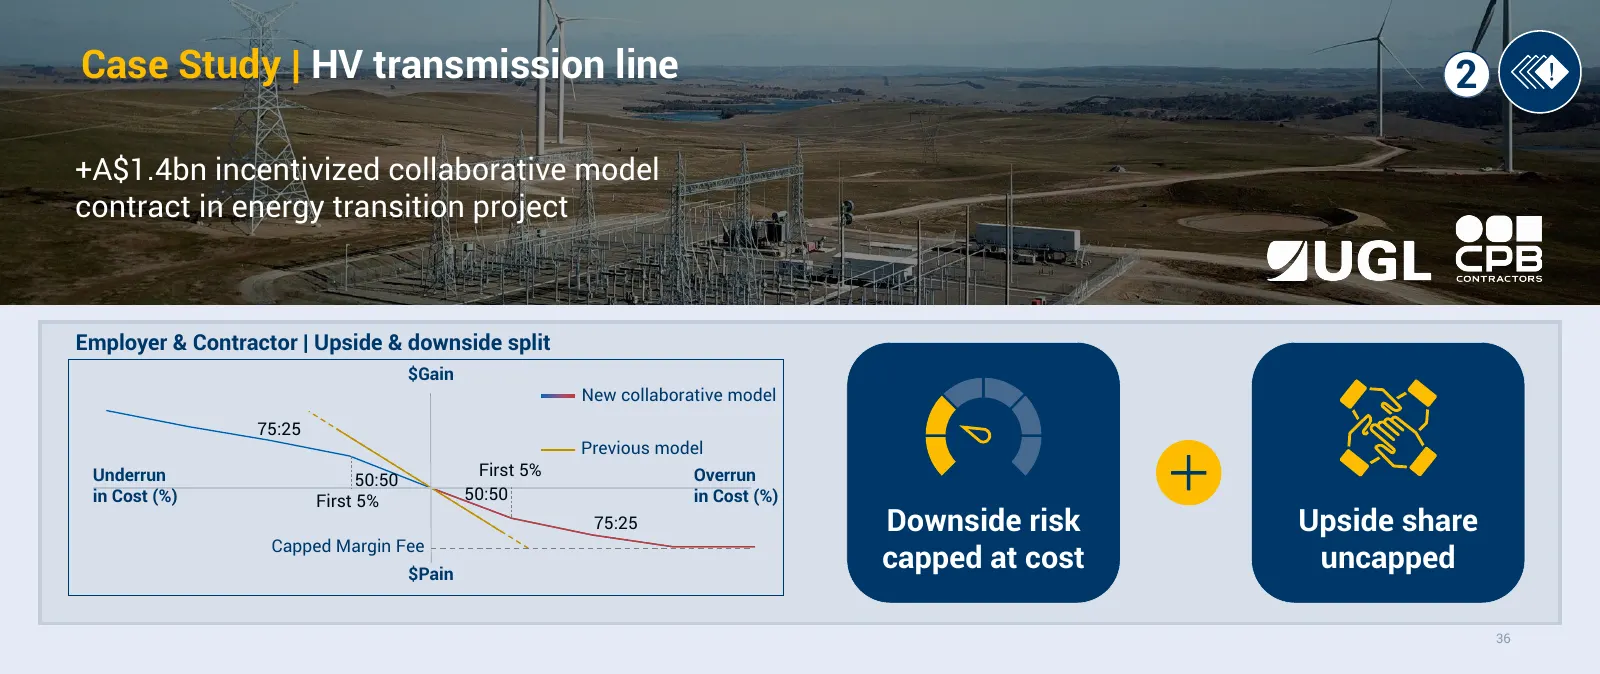
We use collaboration models to mitigate risks and better forecast 2 margins and delivery timeline All stakeholders incentivized to Progressively moving to a fully low-risk collaborate on outcomes profile backlog Total backlog value, split by contract type Traditional ~30% ~20% ~35% Large portion of
Slide 61: Case Study: HV transmission line
Case Study | HV transmission line 2 +A$1.4bn incentivized collaborative model contract in energy transition project Employer & Contractor | Upside & downside split $Gain New collaborative model 75:25 Previous model Underrun First 5% Overrun 50:50 in Cost (%) First 5% 50:50 in Cost (%) 75:25 Downside
Slide 62: 3 key differentiators
3 key differentiators 1 2 3 Integrated Disciplined Derisking Unique Positioning in Platform Approach Next Generation Sectors 37
Slide 63: Leading in sustainable mobility, energy transition and critical minerals
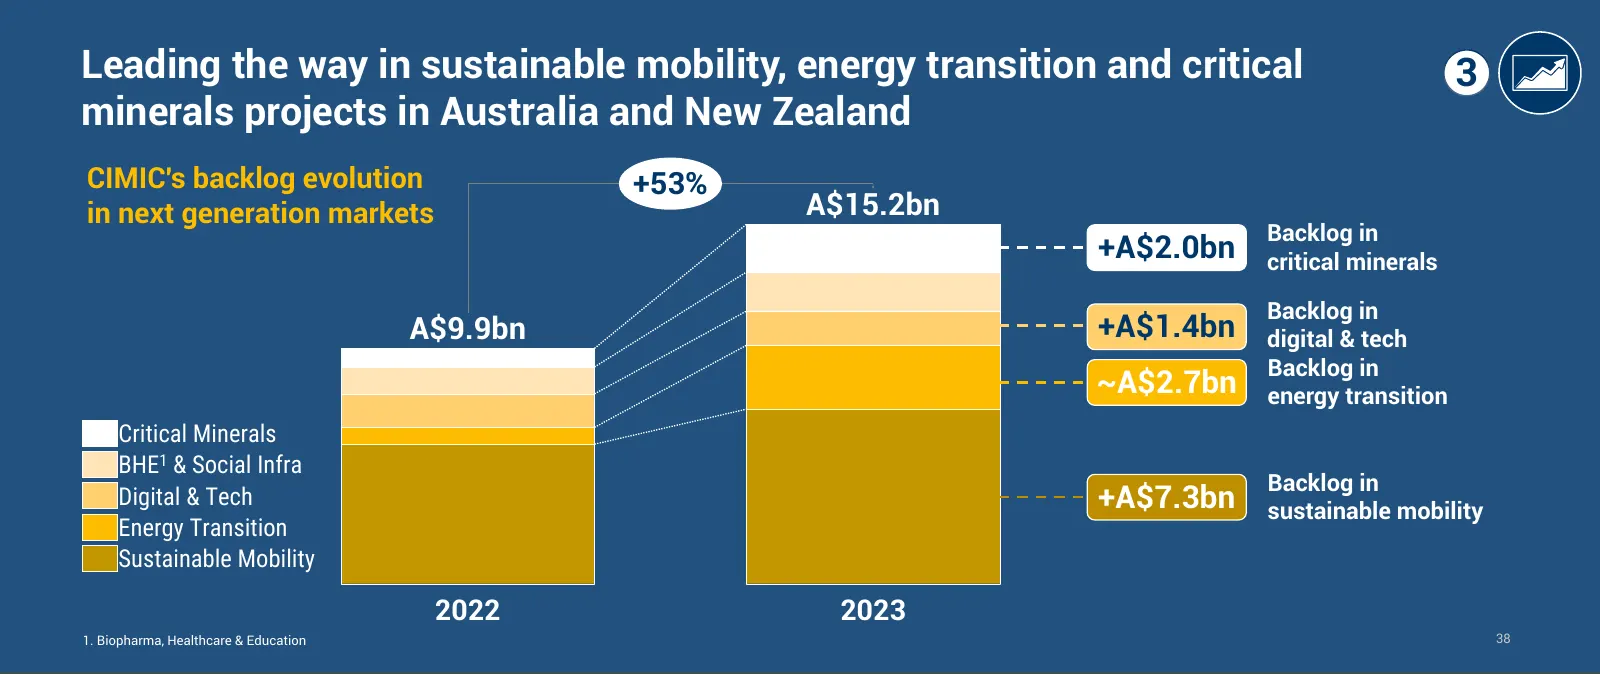
Leading the way in sustainable mobility, energy transition and critical 3 minerals projects in Australia and New Zealand CIMIC's backlog evolution +53% in next generation markets A$15.2bn Backlog in +A$2.0bn critical minerals Backlog in A$9.9bn +A$1.4bn digital & tech Backlog in ~A$2.7bn energy tran
Slide 64: Energy transition: ideally positioned for energy challenges
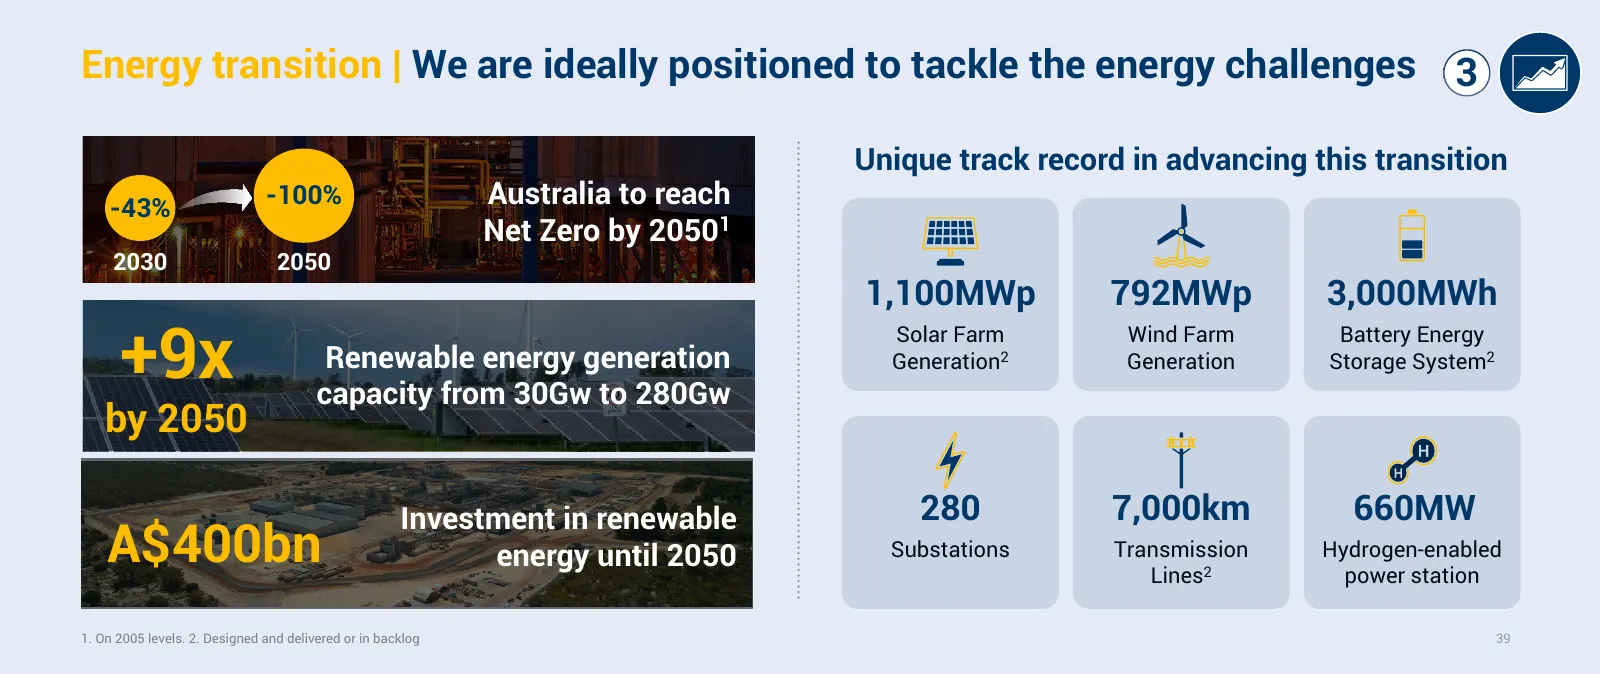
Energy transition | We are ideally positioned to tackle the energy challenges 3 Unique track record in advancing this transition -43% -100% Australia to reach Net Zero by 2050 1 2030 2050 1,100MWp 792MWp 3,000MWh +9x Solar Farm Wind Farm Battery Energy Renewable energy generation Generation 2 Genera
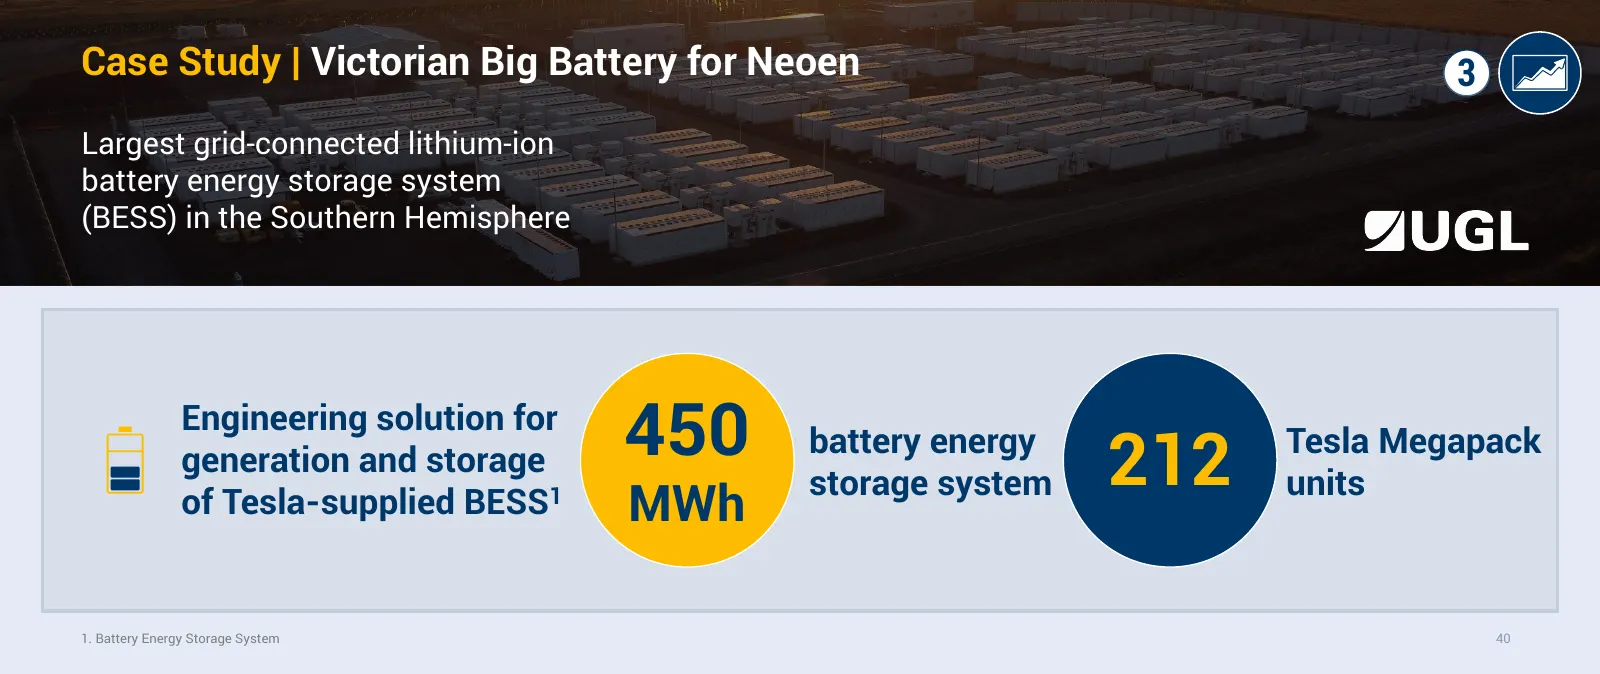
Slide 65: Case Study: Victorian Big Battery for Neoen
Case Study | Victorian Big Battery for Neoen 3 Largest grid-connected lithium-ion battery energy storage system (BESS) in the Southern Hemisphere Engineering solution for generation and storage 450 battery energy 212 Tesla Megapack storage system units of Tesla-supplied BESS 1 MWh 1. Battery Energy
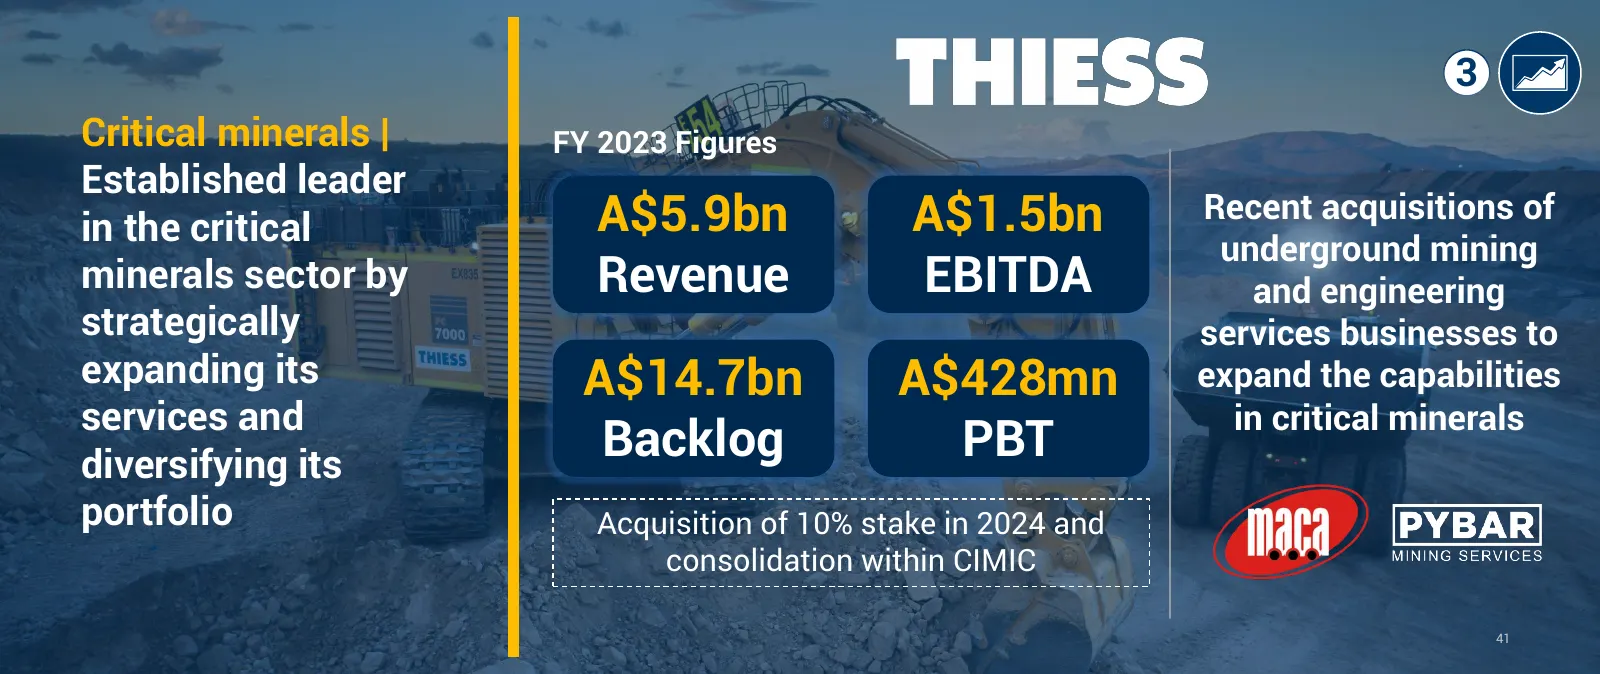
Slide 66: Critical minerals: FY 2023 Figures
3 Critical minerals | FY 2023 Figures Established leader in the critical A$5.9bn A$1.5bn Recent acquisitions of underground mining minerals sector by Revenue EBITDA and engineering strategically services businesses to expanding its A$14.7bn A$428mn expand the capabilities services and in critical mi
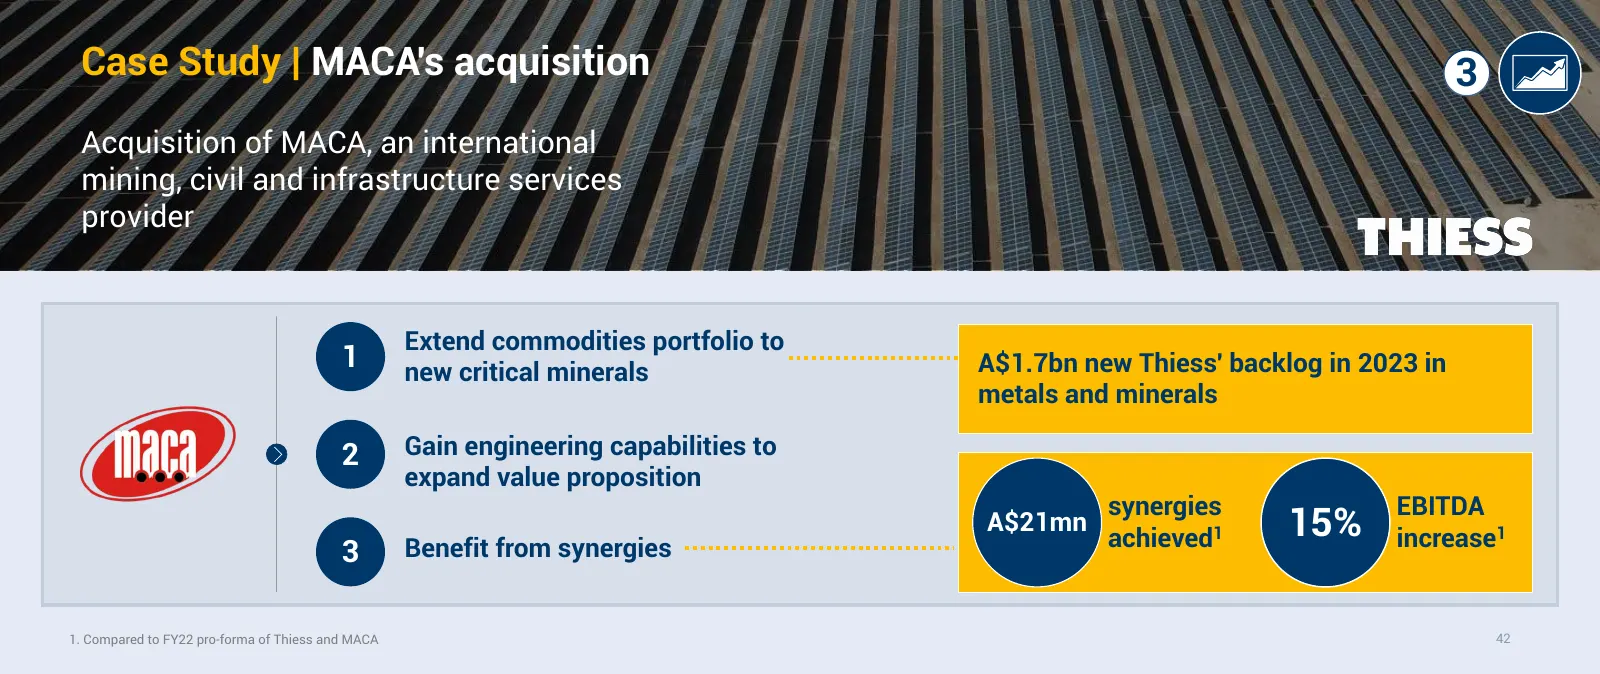
Slide 67: Case Study: MACA's acquisition
Case Study | MACA's acquisition 3 Acquisition of MACA, an international mining, civil and infrastructure services provider Extend commodities portfolio to 1 new critical minerals A$1.7bn new Thiess' backlog in 2023 in metals and minerals 2 Gain engineering capabilities to expand value proposition sy
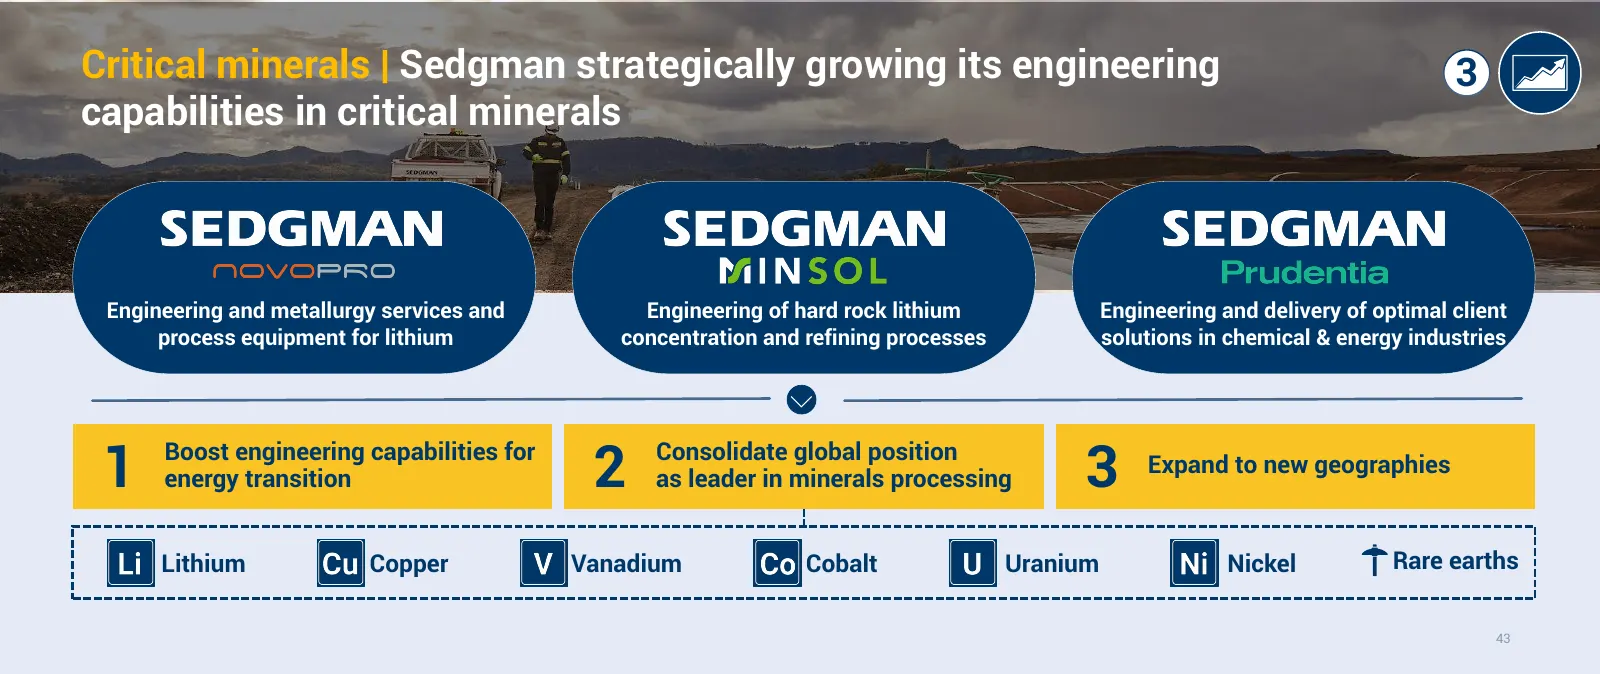
Slide 68: Sedgman growing engineering capabilities in critical minerals
Critical minerals | Sedgman strategically growing its engineering 3 capabilities in critical minerals Engineering and metallurgy services and Engineering of hard rock lithium Engineering and delivery of optimal client process equipment for lithium concentration and refining processes solutions in ch
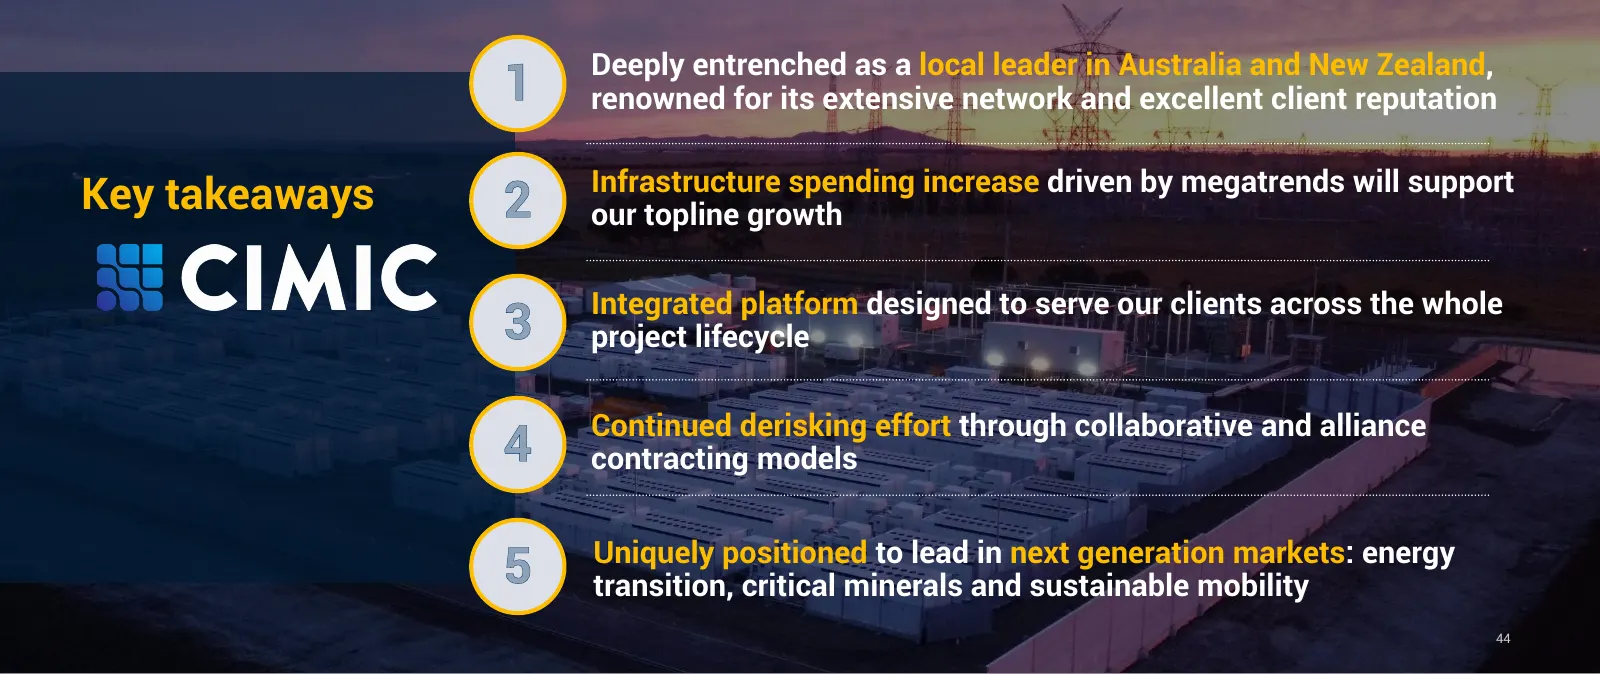
Slide 69: Key takeaways
Deeply entrenched as a local leader in Australia and New Zealand, 1 renowned for its extensive network and excellent client reputation Infrastructure spending increase driven by megatrends will support Key takeaways 2 our topline growth Integrated platform designed to serve our clients across the wh
Slide 70: Infrastructure Brownfield - Abertis
Capital Markets Day Infrastructure Brownfield - Abertis 17th April 2024
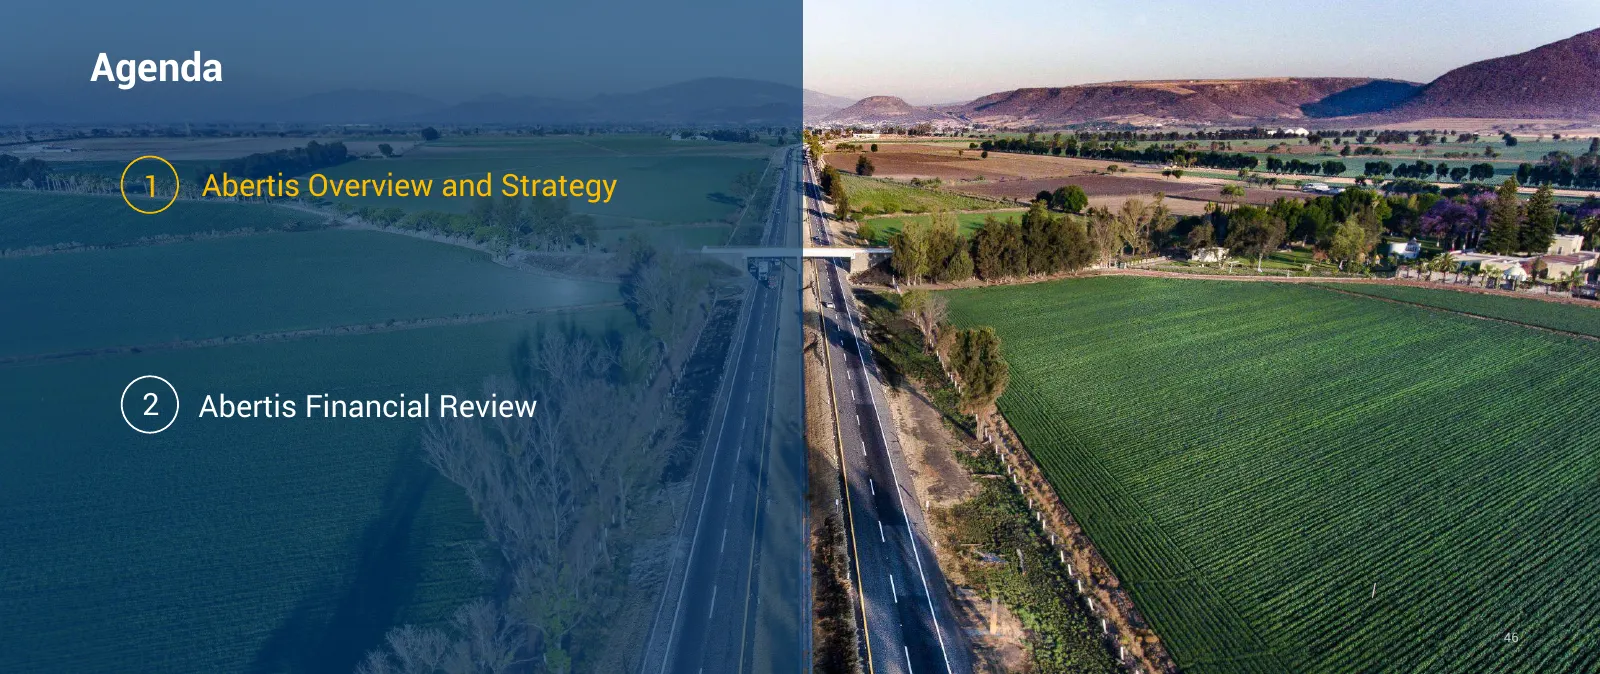
Slide 71: Agenda
Agenda 1 Abertis Overview and Strategy 2 Abertis Financial Review 46
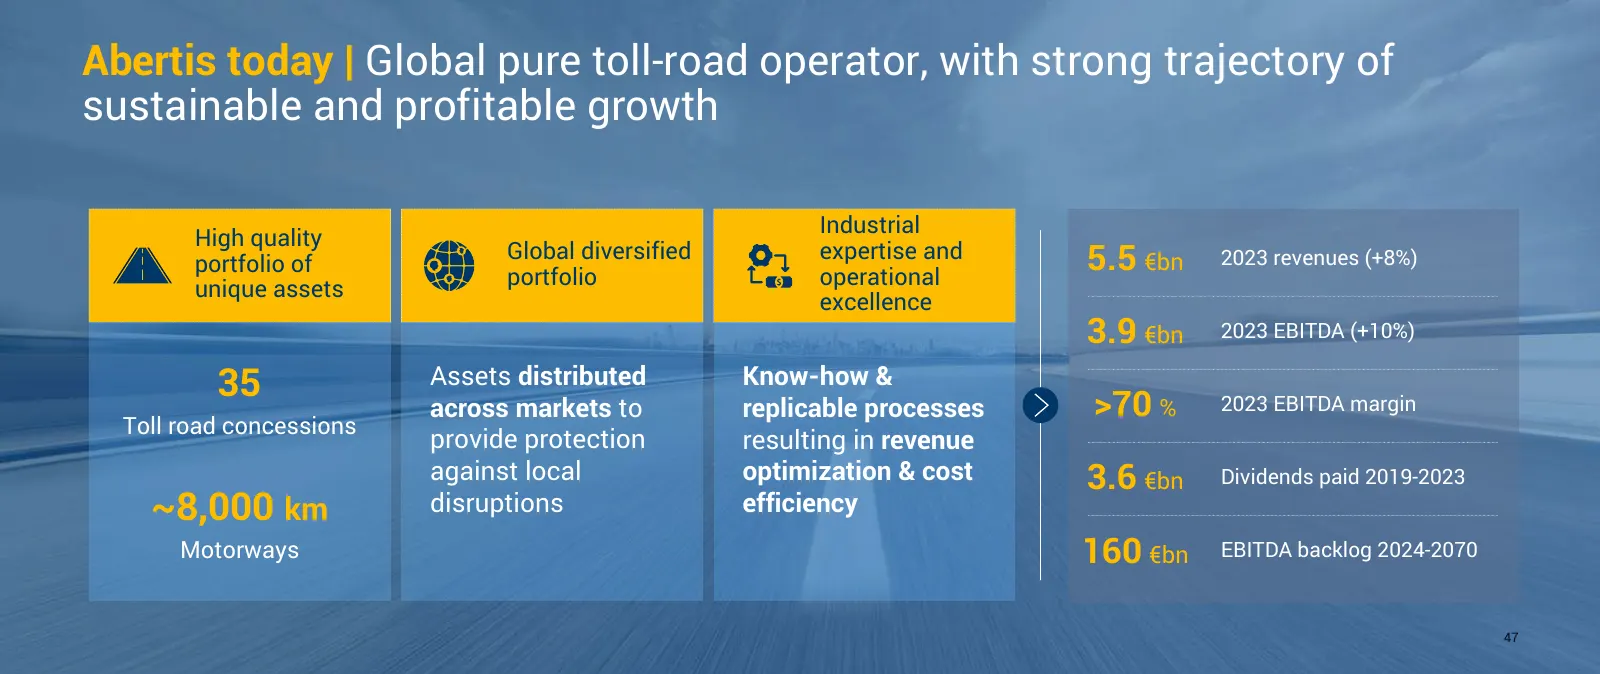
Slide 72: Abertis today: global pure toll-road operator
Abertis today | Global pure toll-road operator, with strong trajectory of sustainable and profitable growth Industrial High quality Global diversified expertise and 5.5 €bn 2023 revenues (+8%) portfolio of portfolio operational unique assets excellence 3.9 €bn 2023 EBITDA (+10%) 35 Assets distribute
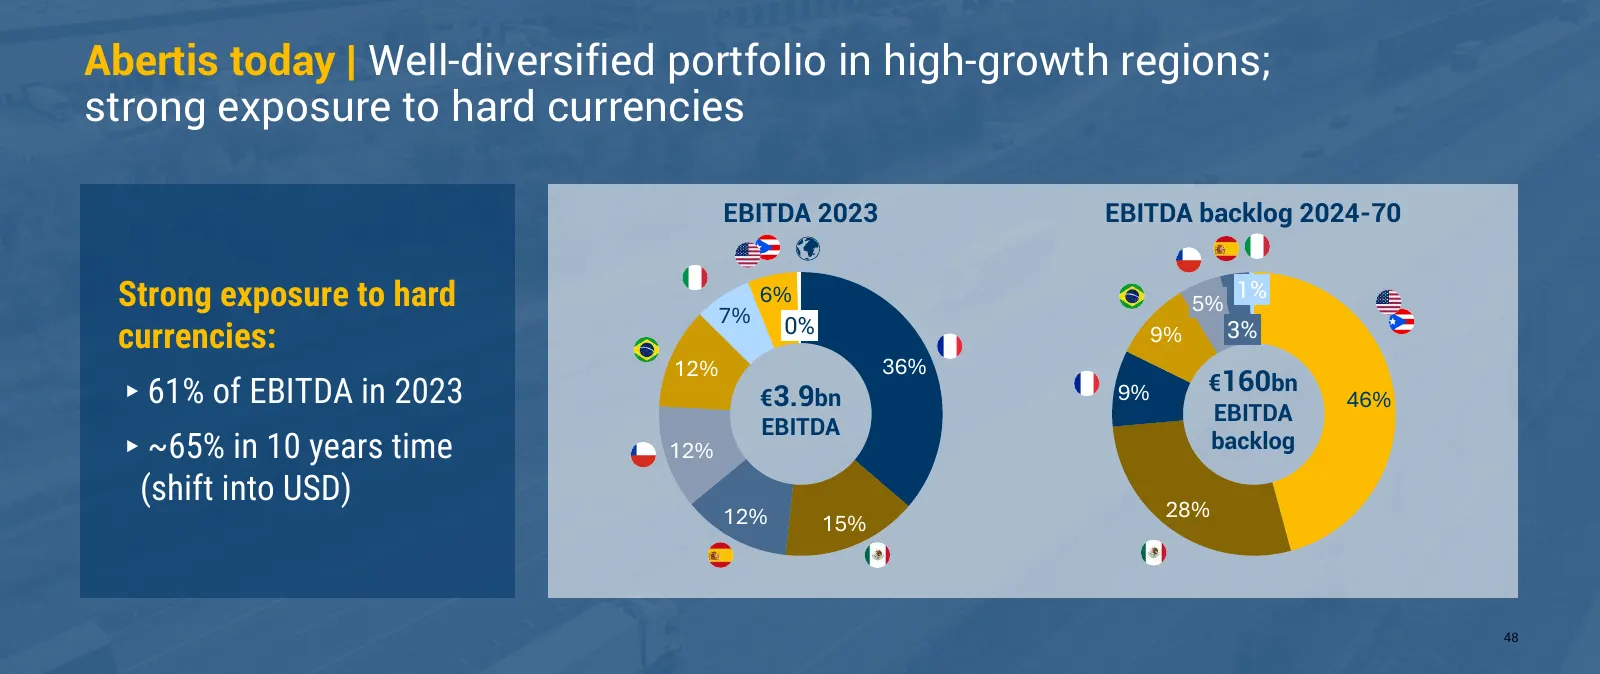
Slide 73: Abertis today: well-diversified portfolio
Abertis today | Well-diversified portfolio in high-growth regions; strong exposure to hard currencies EBITDA 2023 EBITDA backlog 2024-70 Strong exposure to hard 6% 1% 5% 7% 0% currencies: 9% 3% 12% 36% ▸61% of EBITDA in 2023 9% €160bn €3.9bn 46% EBITDA EBITDA ▸~65% in 10 years time 12% backlog (shif
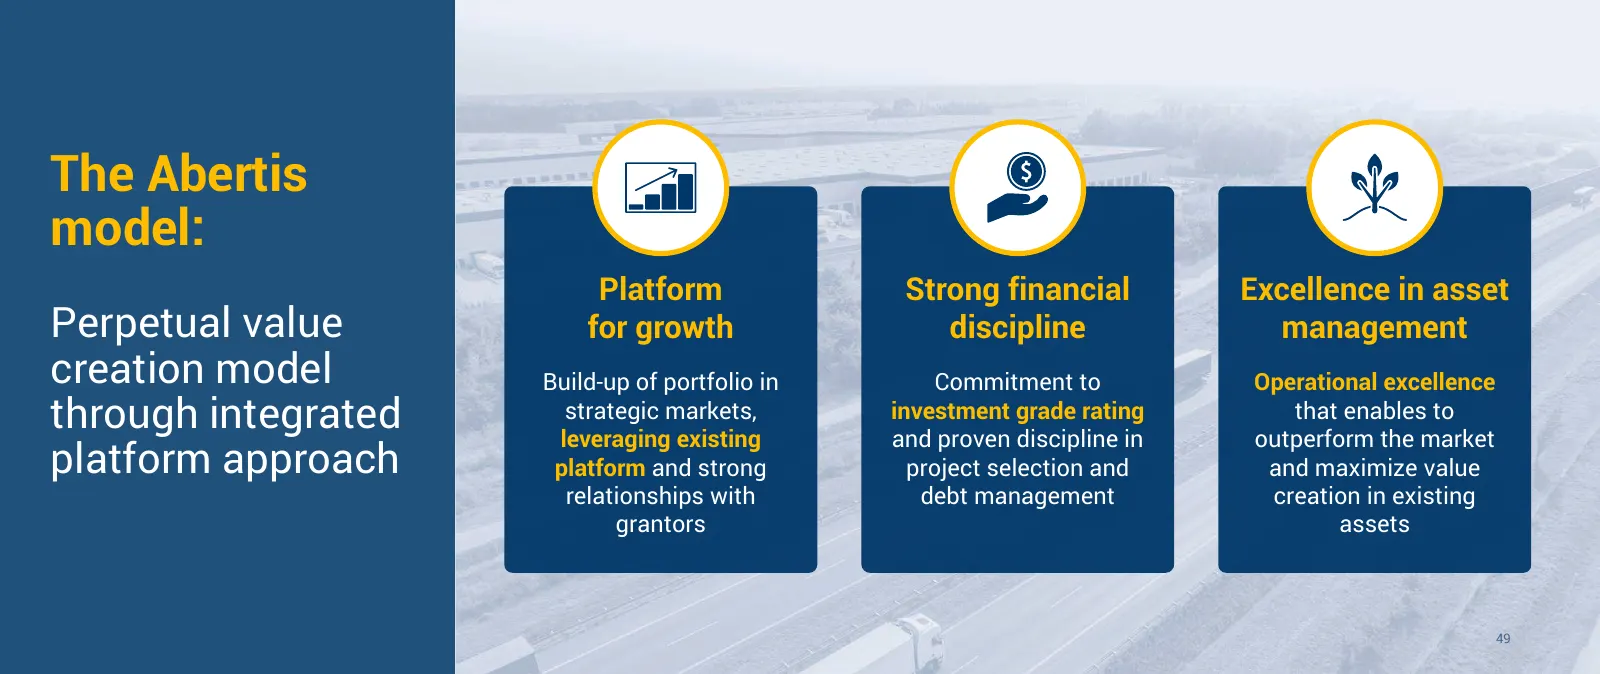
Slide 74: The Abertis model
The Abertis model: Platform Strong financial Excellence in asset Perpetual value for growth discipline management creation model Build-up of portfolio in Commitment to Operational excellence through integrated strategic markets, leveraging existing investment grade rating and proven discipline in th
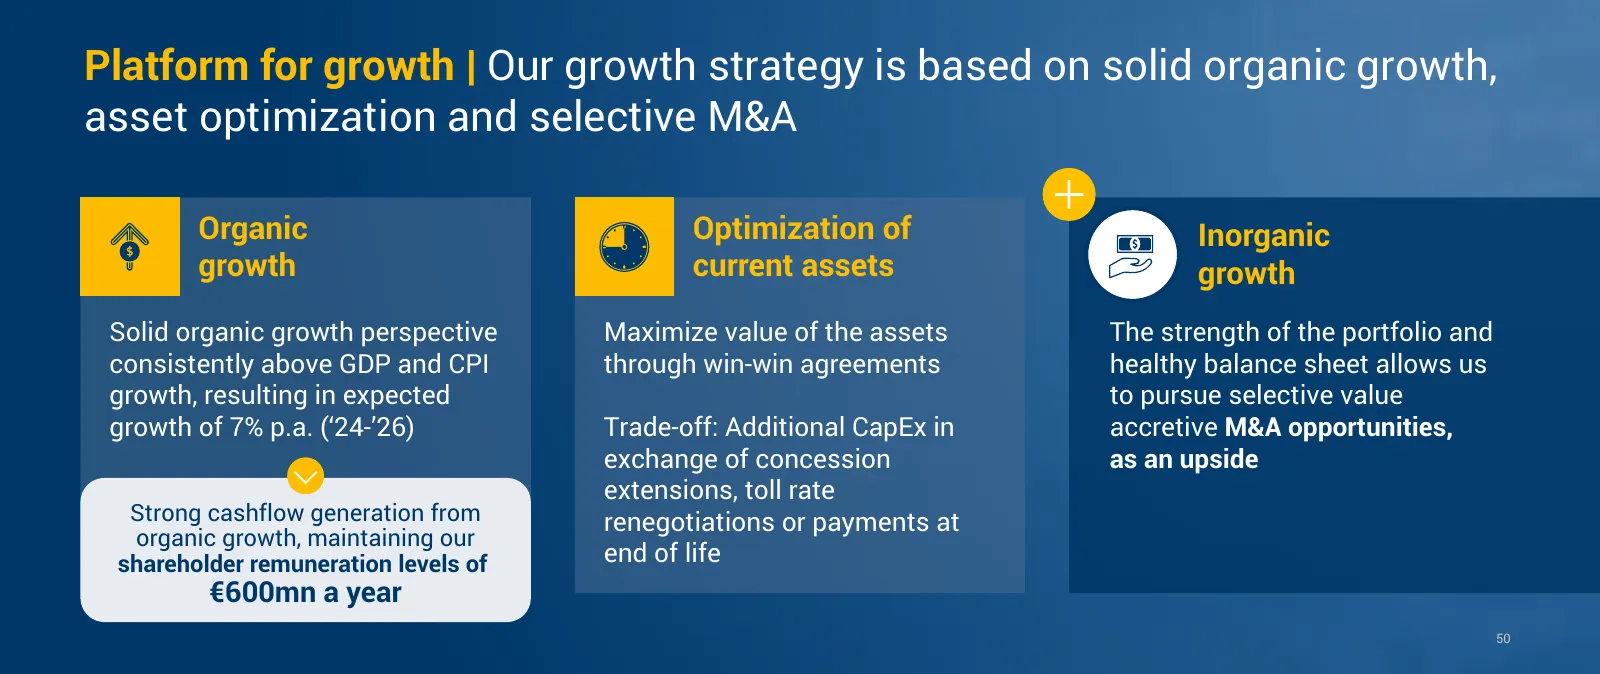
Slide 75: Platform for growth
Platform for growth | Our growth strategy is based on solid organic growth, asset optimization and selective M&A Organic Optimization of Inorganic growth current assets growth Solid organic growth perspective Maximize value of the assets The strength of the portfolio and consistently above GDP and C
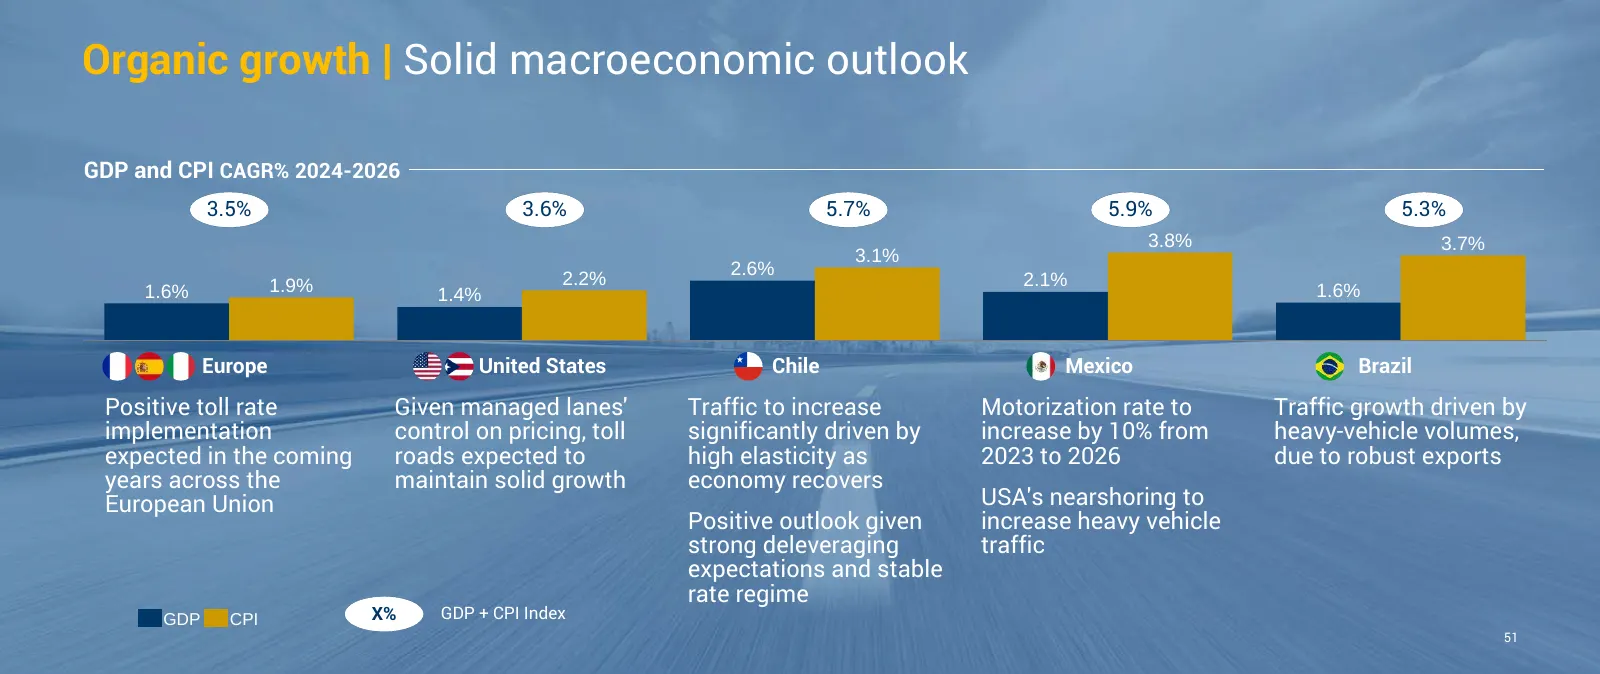
Slide 76: Organic growth: solid macroeconomic outlook
Organic growth | Solid macroeconomic outlook GDP and CPI CAGR% 2024-2026 3.5% 3.6% 5.7% 5.9% 5.3% 3.8% 3.7% 3.1% 2.6% 1.9% 2.2% 2.1% 1.6% 1.4% 1.6% Europe United States Chile Mexico Brazil Positive toll rate Given managed lanes' Traffic to increase Motorization rate to Traffic growth driven by imple
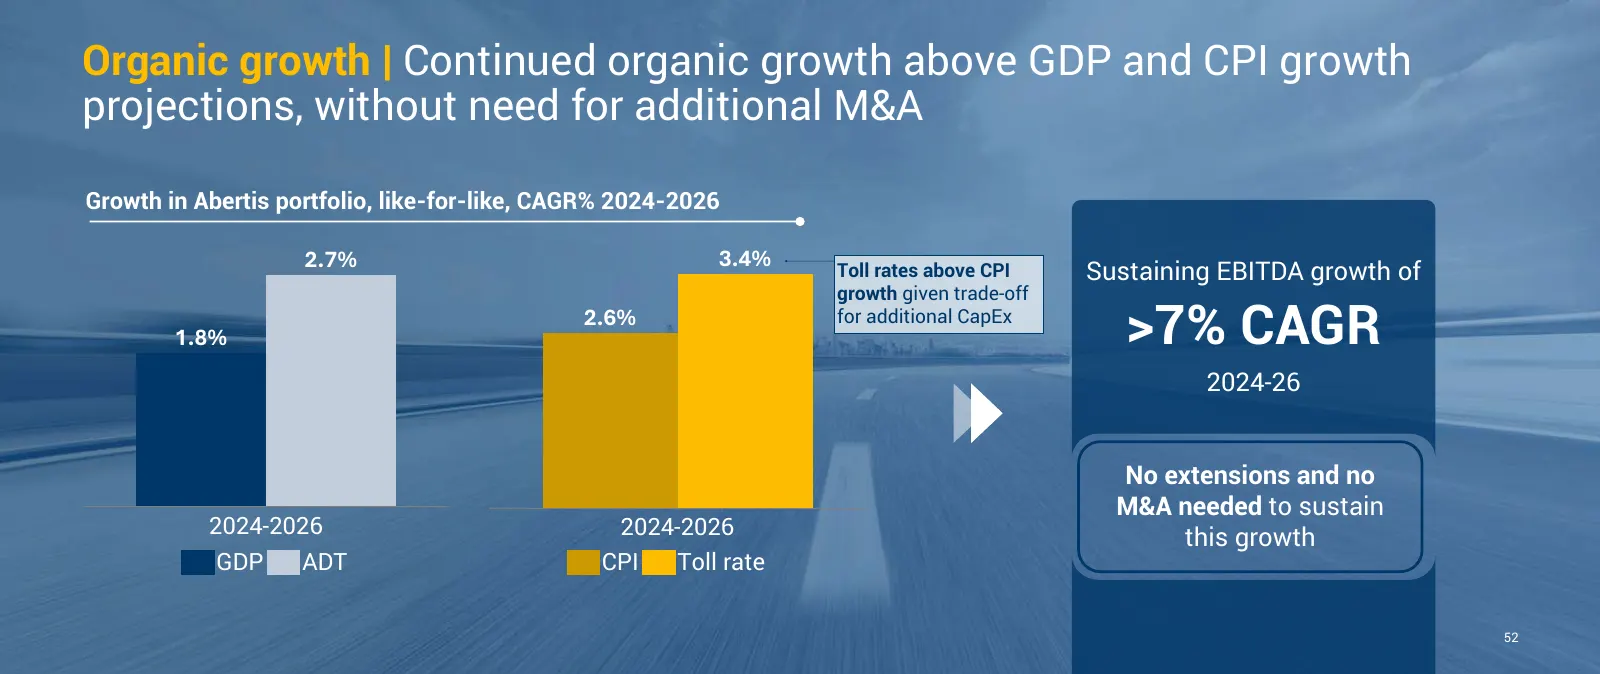
Slide 77: Organic growth above GDP and CPI
Organic growth | Continued organic growth above GDP and CPI growth projections, without need for additional M&A Growth in Abertis portfolio, like-for-like, CAGR% 2024-2026 2.7% 3.4% Toll rates above CPI Sustaining EBITDA growth of growth given trade-off 1.8% 2.6% for additional CapEx >7% CAGR 2024-2
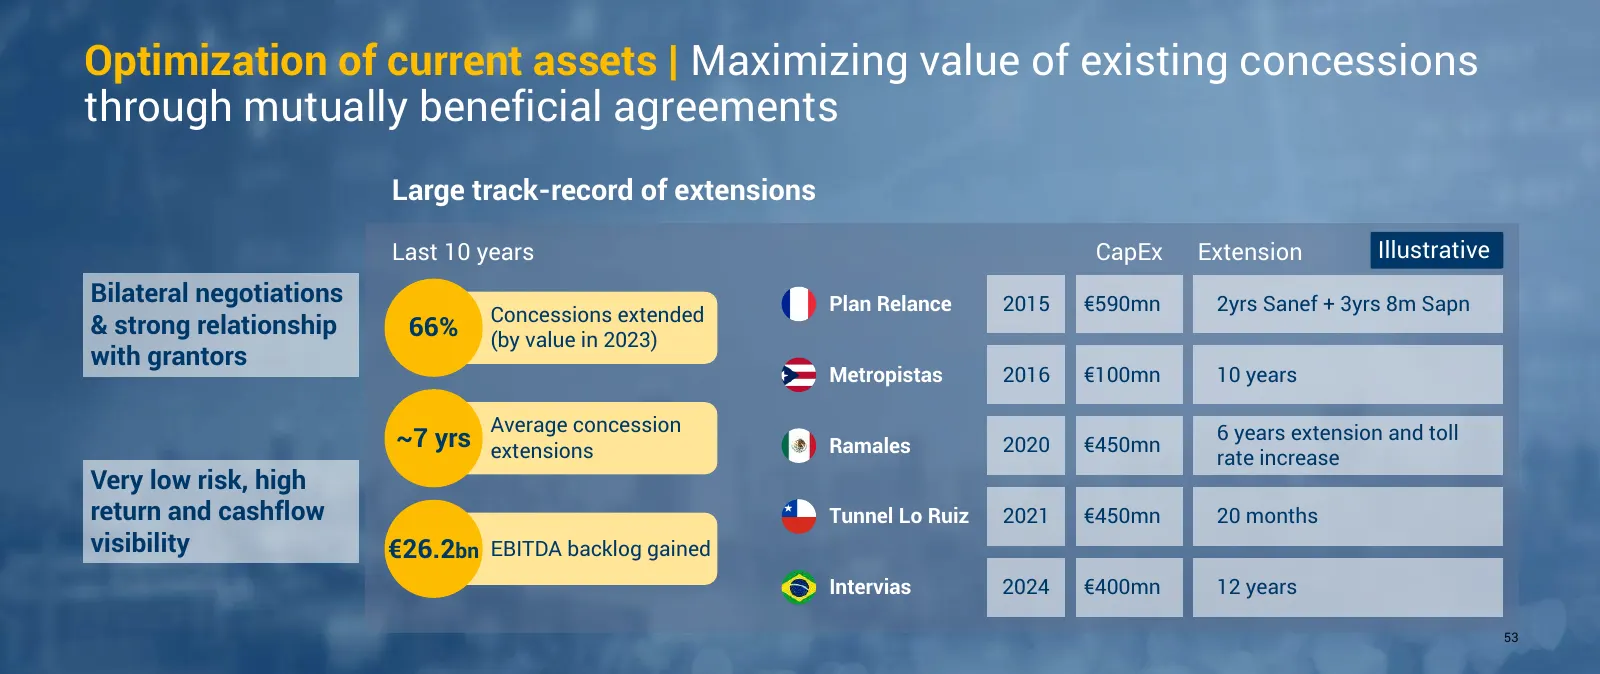
Slide 78: Optimization of current assets
Optimization of current assets | Maximizing value of existing concessions through mutually beneficial agreements Large track-record of extensions Last 10 years CapEx Extension Illustrative Bilateral negotiations Plan Relance 2015 €590mn 2yrs Sanef + 3yrs 8m Sapn Concessions extended & strong relatio
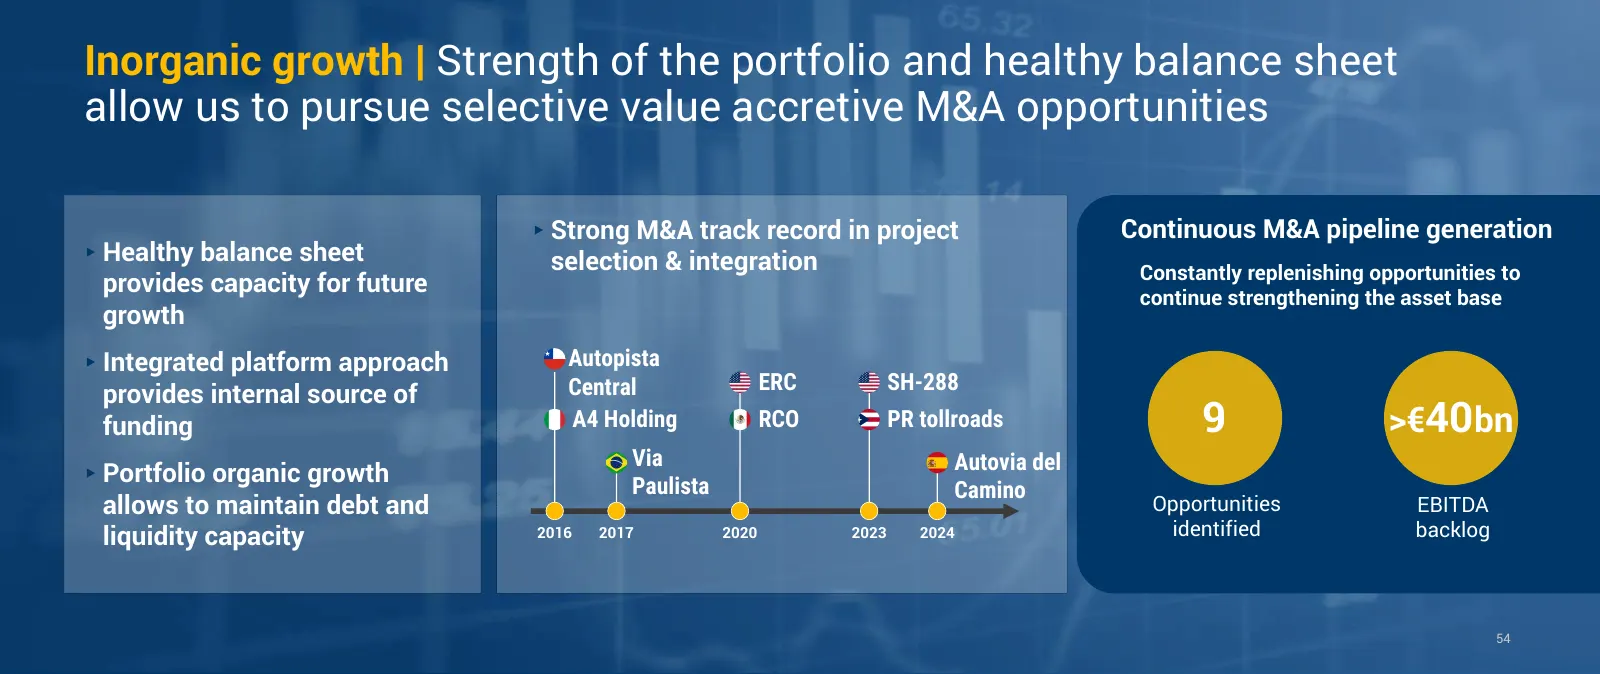
Slide 79: Inorganic growth
Inorganic growth | Strength of the portfolio and healthy balance sheet allow us to pursue selective value accretive M&A opportunities ▸Strong M&A track record in project Continuous M&A pipeline generation ▸Healthy balance sheet selection & integration ▸ Constantly replenishing opportunities to provi
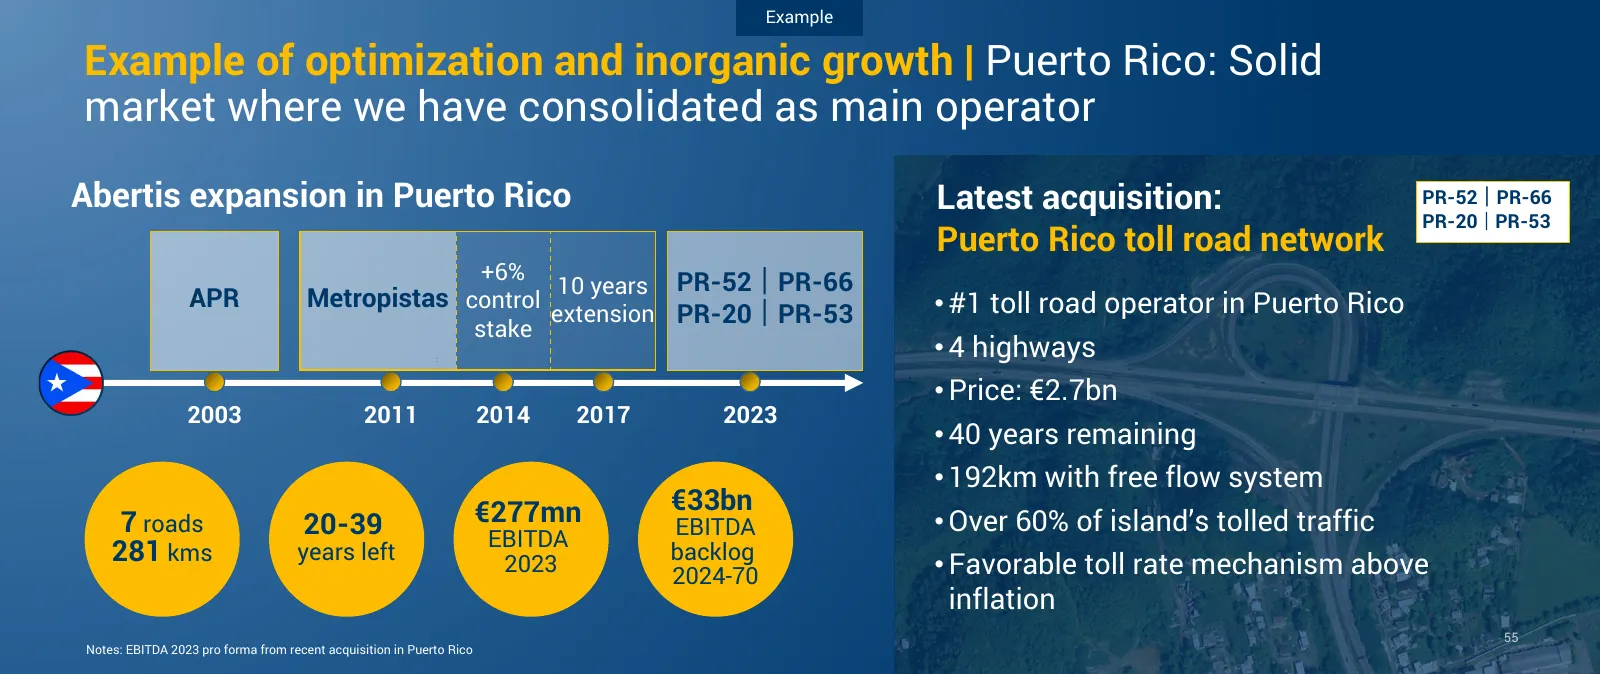
Slide 80: Example of optimization and inorganic growth: Puerto Rico
Example Example of optimization and inorganic growth | Puerto Rico: Solid market where we have consolidated as main operator Abertis expansion in Puerto Rico Latest acquisition: PR-52 PR-66 PR-20 PR-53 Puerto Rico toll road network +6% 10 years PR-52 PR-66 APR Metropistas control extension PR-
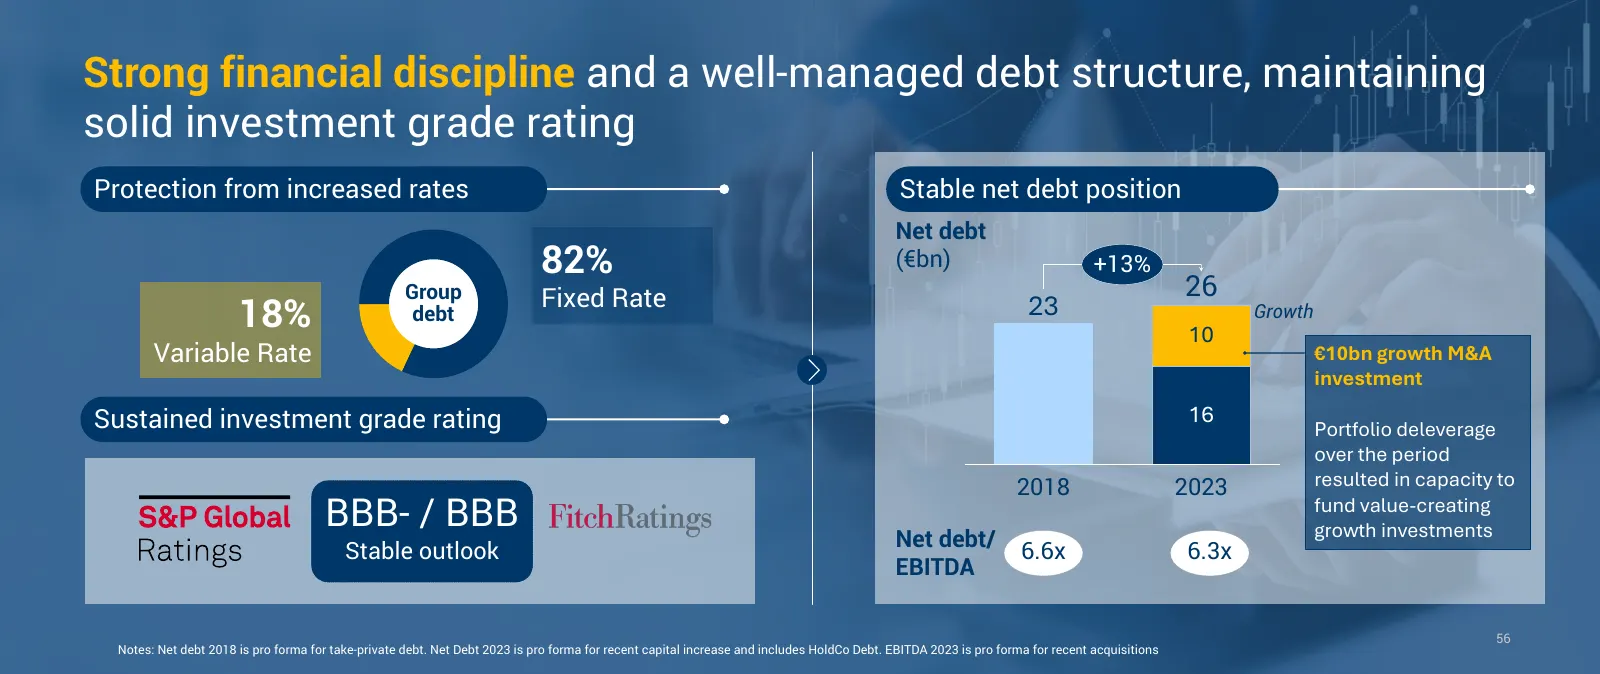
Slide 81: Strong financial discipline and well-managed debt structure
Strong financial discipline and a well-managed debt structure, maintaining solid investment grade rating Protection from increased rates Stable net debt position Net debt 82% (€bn) +13% Group Fixed Rate 26 18% debt 23 Growth 10 Variable Rate €10bn growth M&A investment Sustained investment grade rat
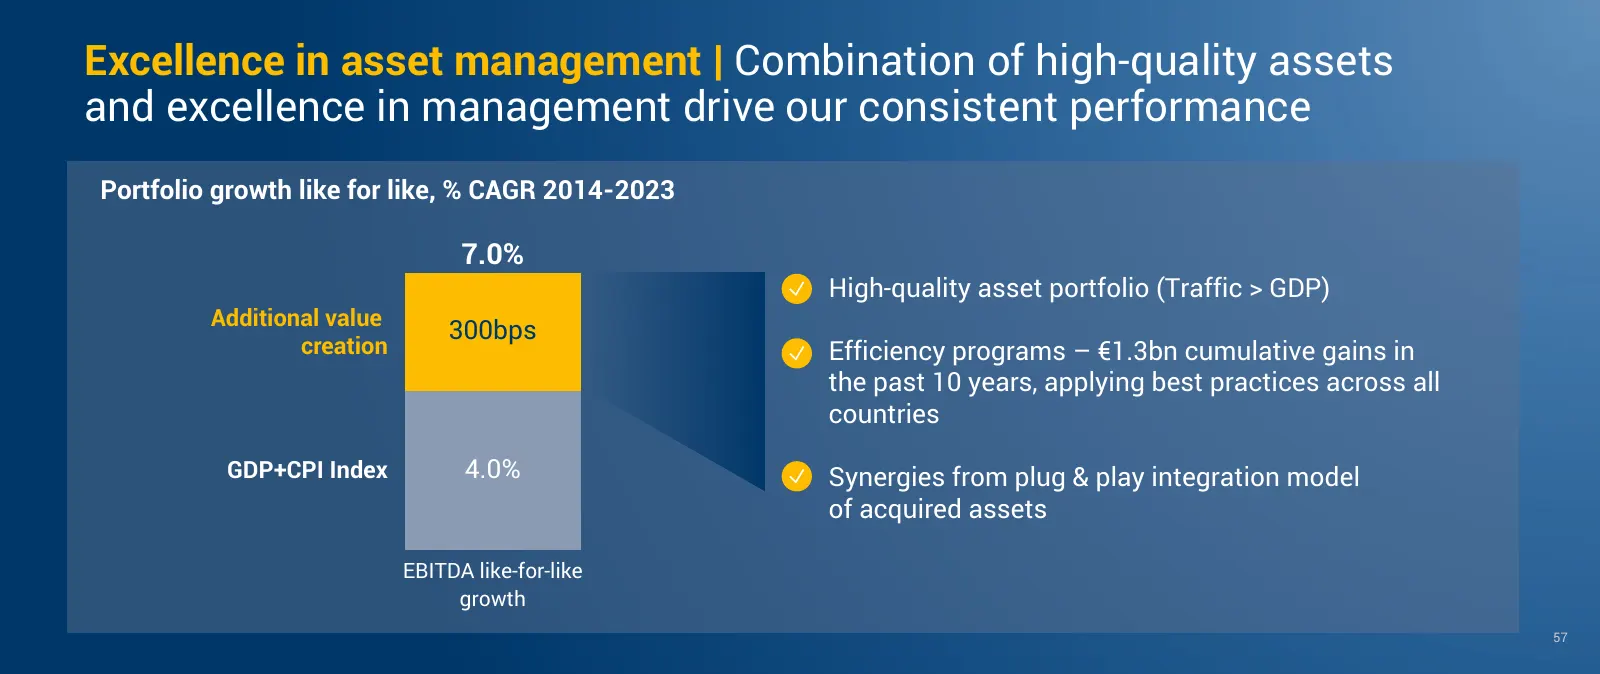
Slide 82: Excellence in asset management
Excellence in asset management | Combination of high-quality assets and excellence in management drive our consistent performance Portfolio growth like for like, % CAGR 2014-2023 7.0% • High-quality asset portfolio (Traffic > GDP) Additional value 300bps creation • Efficiency programs – €1.3bn cumul
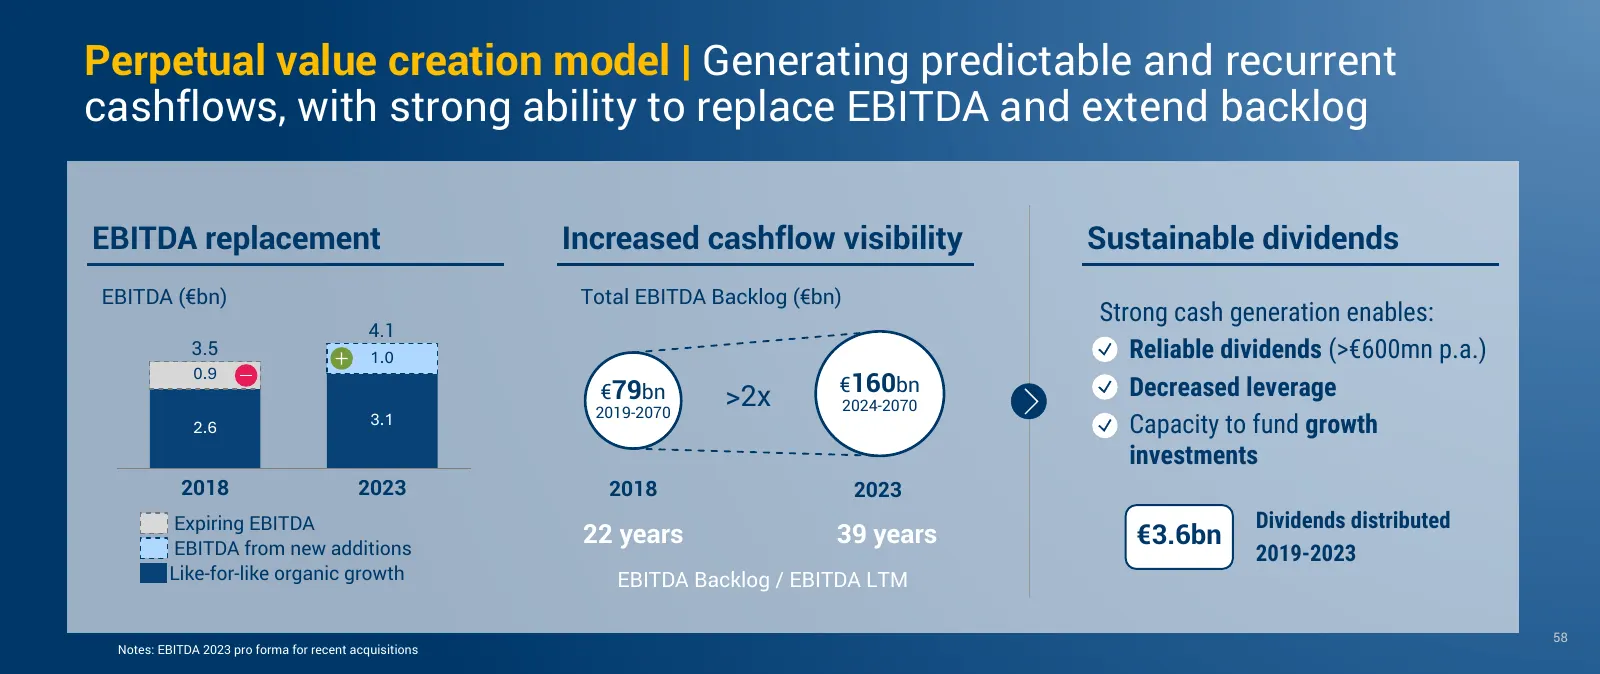
Slide 83: Perpetual value creation model: predictable cashflows
Perpetual value creation model | Generating predictable and recurrent cashflows, with strong ability to replace EBITDA and extend backlog EBITDA replacement Increased cashflow visibility Sustainable dividends EBITDA (€bn) Total EBITDA Backlog (€bn) Strong cash generation enables: 4.1 3.5 1.0 • Relia
Slide 84: Agenda
Agenda 1 Abertis Overview and Strategy 2 Abertis Financial Review 59
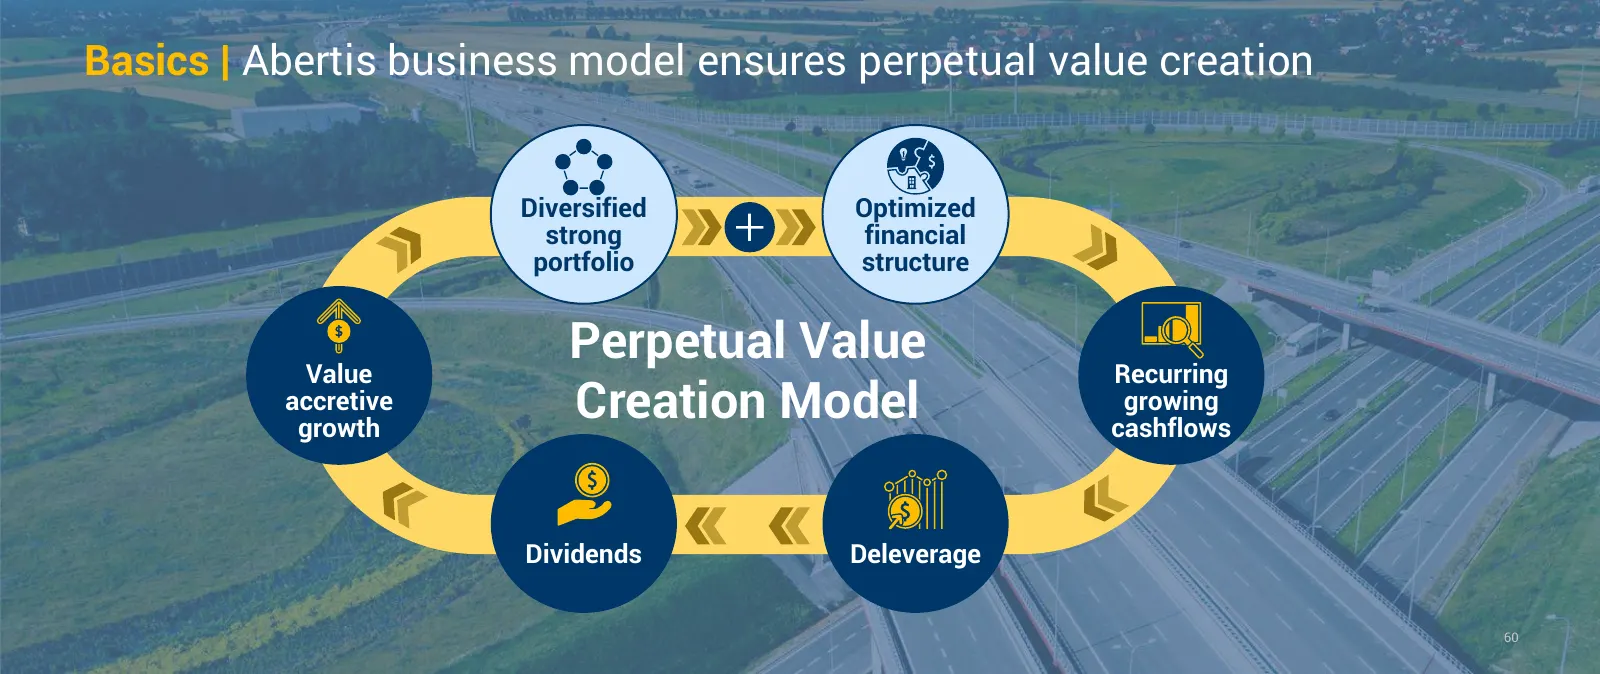
Slide 85: Abertis business model ensures perpetual value creation
Basics | Abertis business model ensures perpetual value creation Diversified Optimized strong financial portfolio structure Perpetual Value Value Recurring accretive growth Creation Model growing cashflows Dividends Deleverage 60
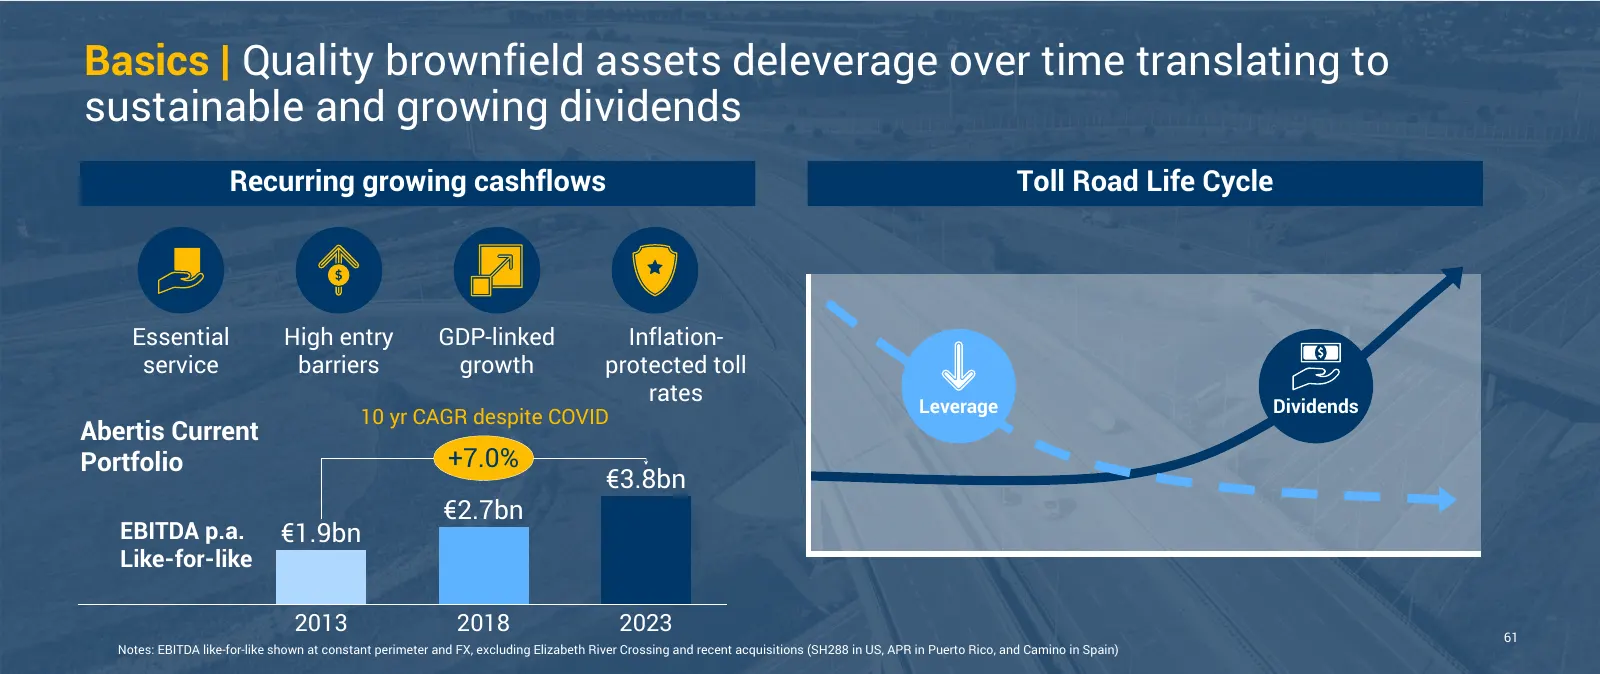
Slide 86: Brownfield assets deleverage over time
Basics | Quality brownfield assets deleverage over time translating to sustainable and growing dividends Recurring growing cashflows Toll Road Life Cycle Essential High entry GDP-linked Inflation- service barriers growth protected toll rates Leverage Dividends 10 yr CAGR despite COVID Abertis Curren
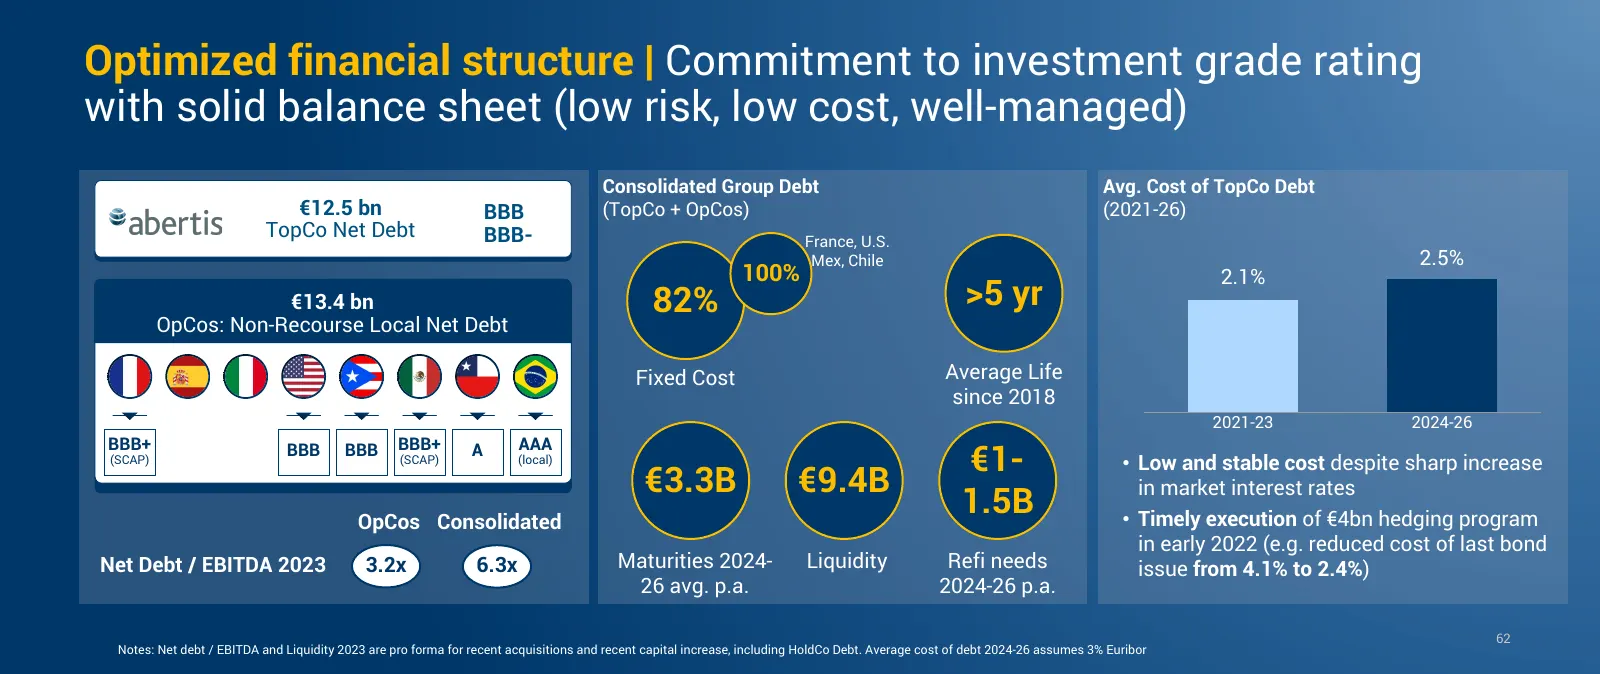
Slide 87: Optimized financial structure
Optimized financial structure | Commitment to investment grade rating with solid balance sheet (low risk, low cost, well-managed) Consolidated Group Debt Avg. Cost of TopCo Debt €12.5 bn BBB (TopCo + OpCos) (2021-26) TopCo Net Debt BBB- France, U.S. Mex, Chile 2.5% 100% 2.1% €13.4 bn 82% >5 yr OpCos
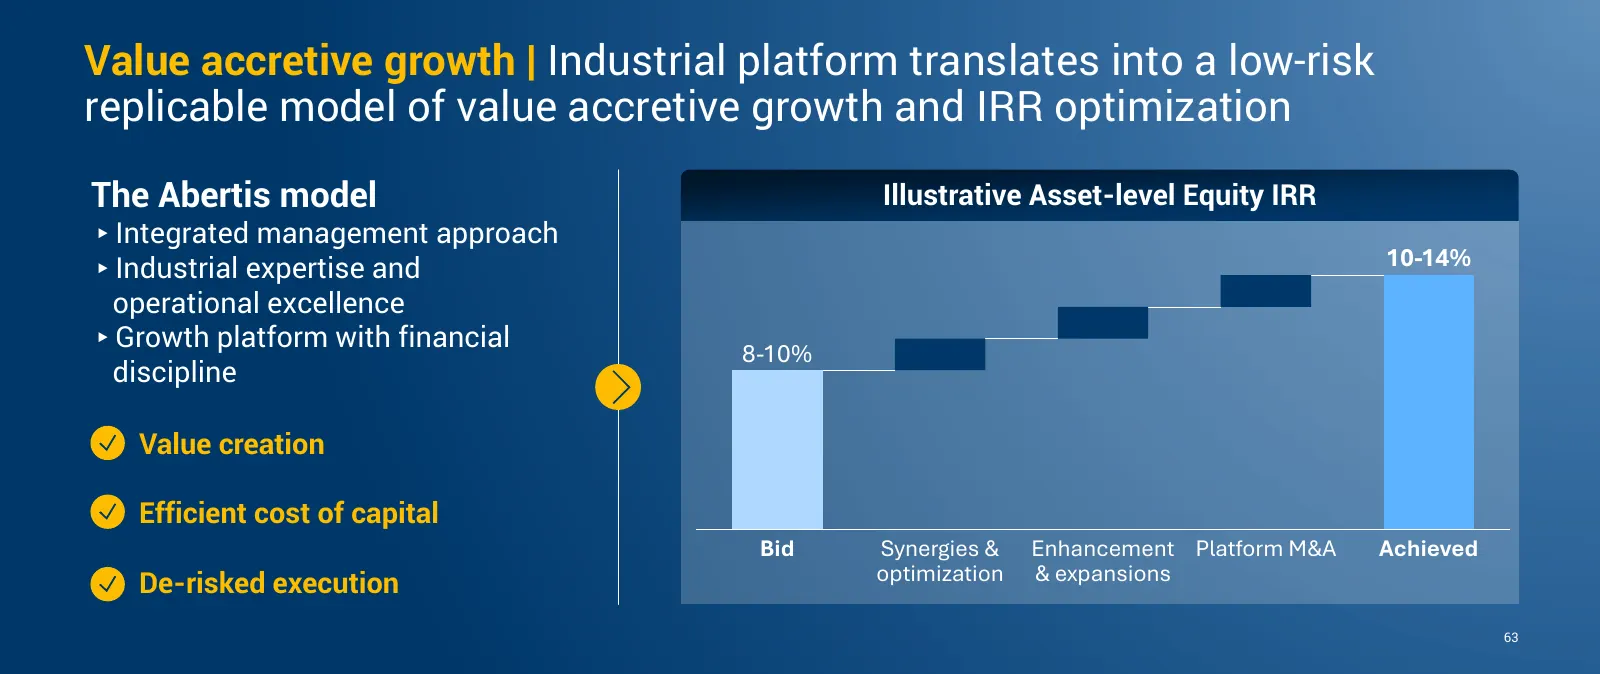
Slide 88: Value accretive growth
Value accretive growth | Industrial platform translates into a low-risk replicable model of value accretive growth and IRR optimization The Abertis model Illustrative Asset-level Equity IRR ▸Integrated management approach ▸Industrial expertise and 10-14% operational excellence ▸Growth platform with
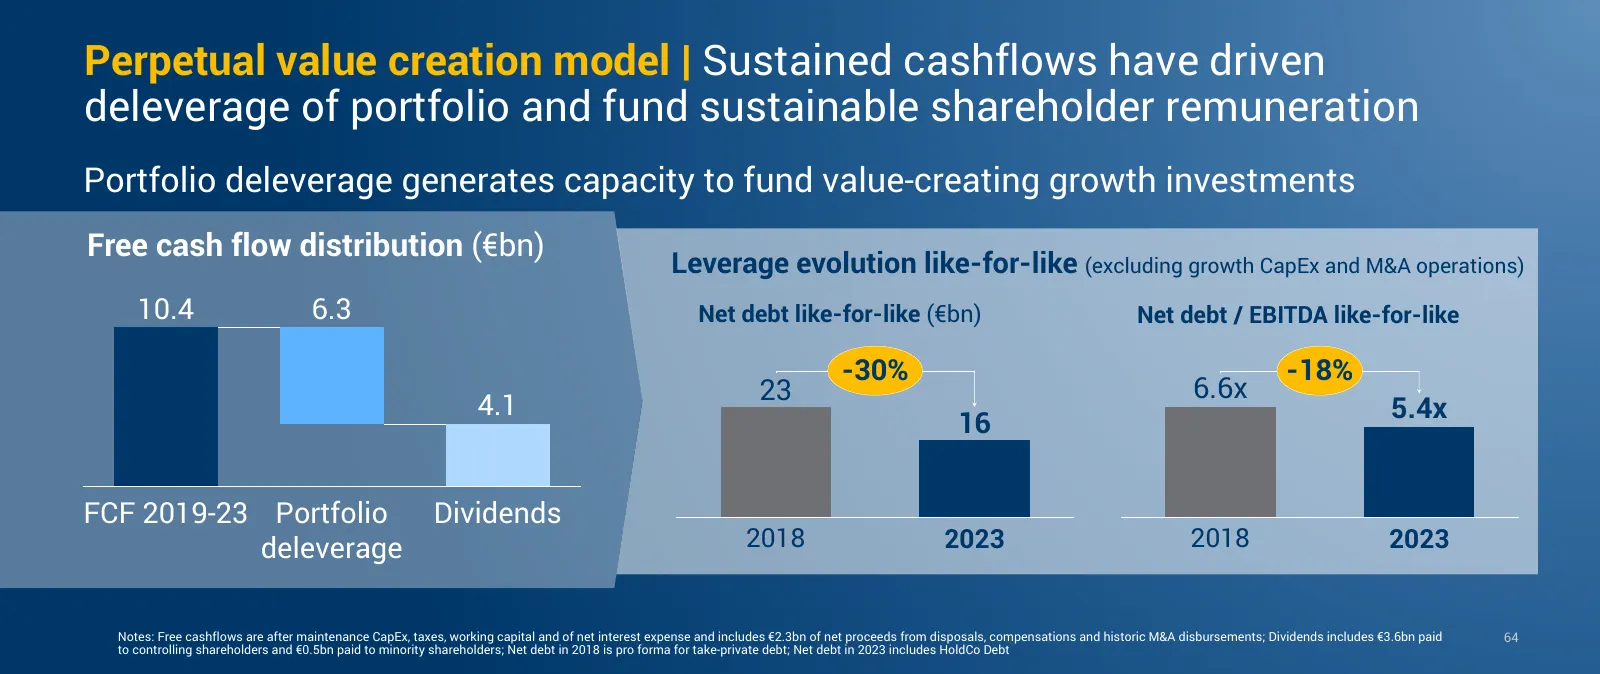
Slide 89: Sustained cashflows drive deleverage and remuneration
Perpetual value creation model | Sustained cashflows have driven deleverage of portfolio and fund sustainable shareholder remuneration Portfolio deleverage generates capacity to fund value-creating growth investments Free cash flow distribution (€bn) Leverage evolution like-for-like (excluding growt
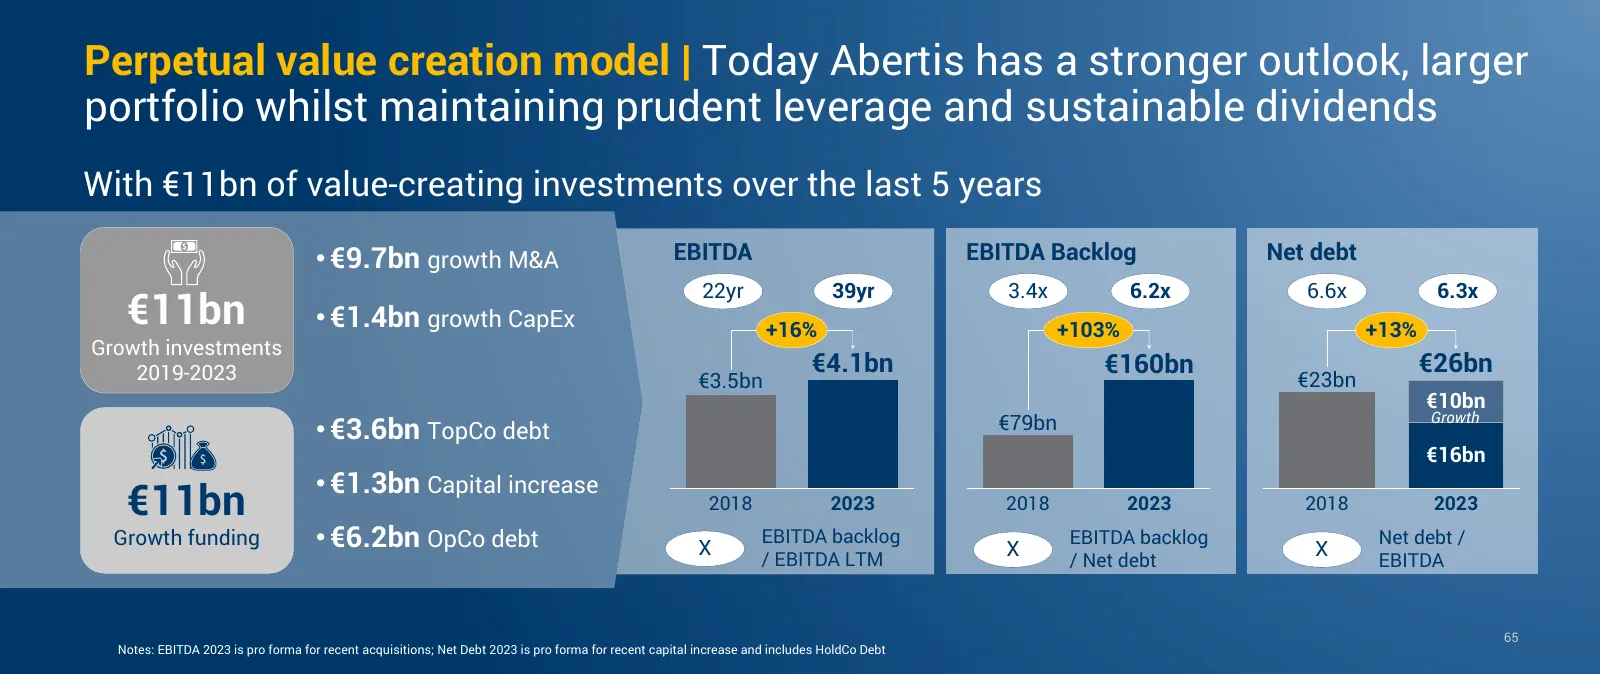
Slide 90: Stronger outlook with prudent leverage
Perpetual value creation model | Today Abertis has a stronger outlook, larger portfolio whilst maintaining prudent leverage and sustainable dividends With €11bn of value-creating investments over the last 5 years • €9.7bn growth M&A EBITDA EBITDA Backlog Net debt 22yr 39yr 3.4x 6.2x 6.6x 6.3x €11bn
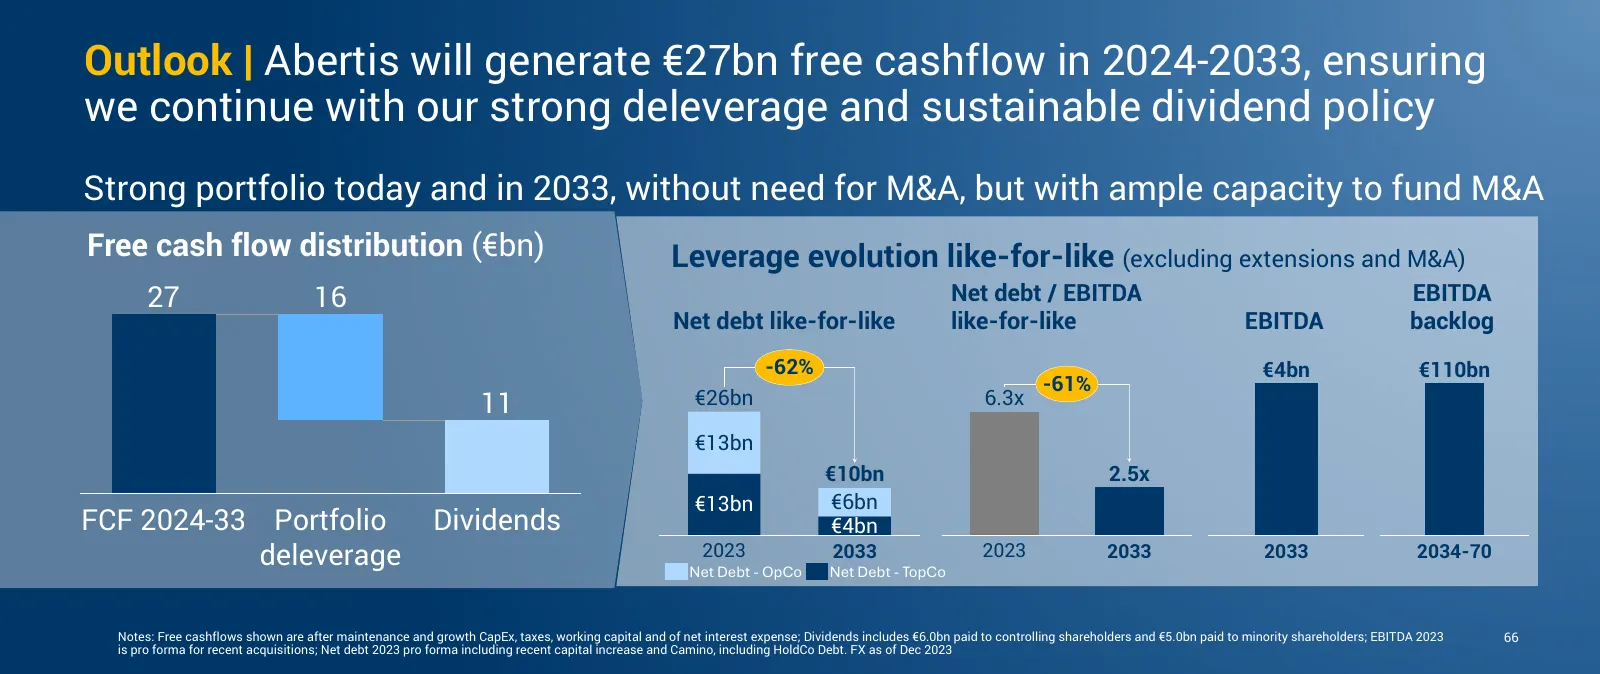
Slide 91: Outlook: €27bn free cashflow in 2024-2033
Outlook | Abertis will generate €27bn free cashflow in 2024-2033, ensuring we continue with our strong deleverage and sustainable dividend policy Strong portfolio today and in 2033, without need for M&A, but with ample capacity to fund M&A Free cash flow distribution (€bn) Leverage evolution like-fo
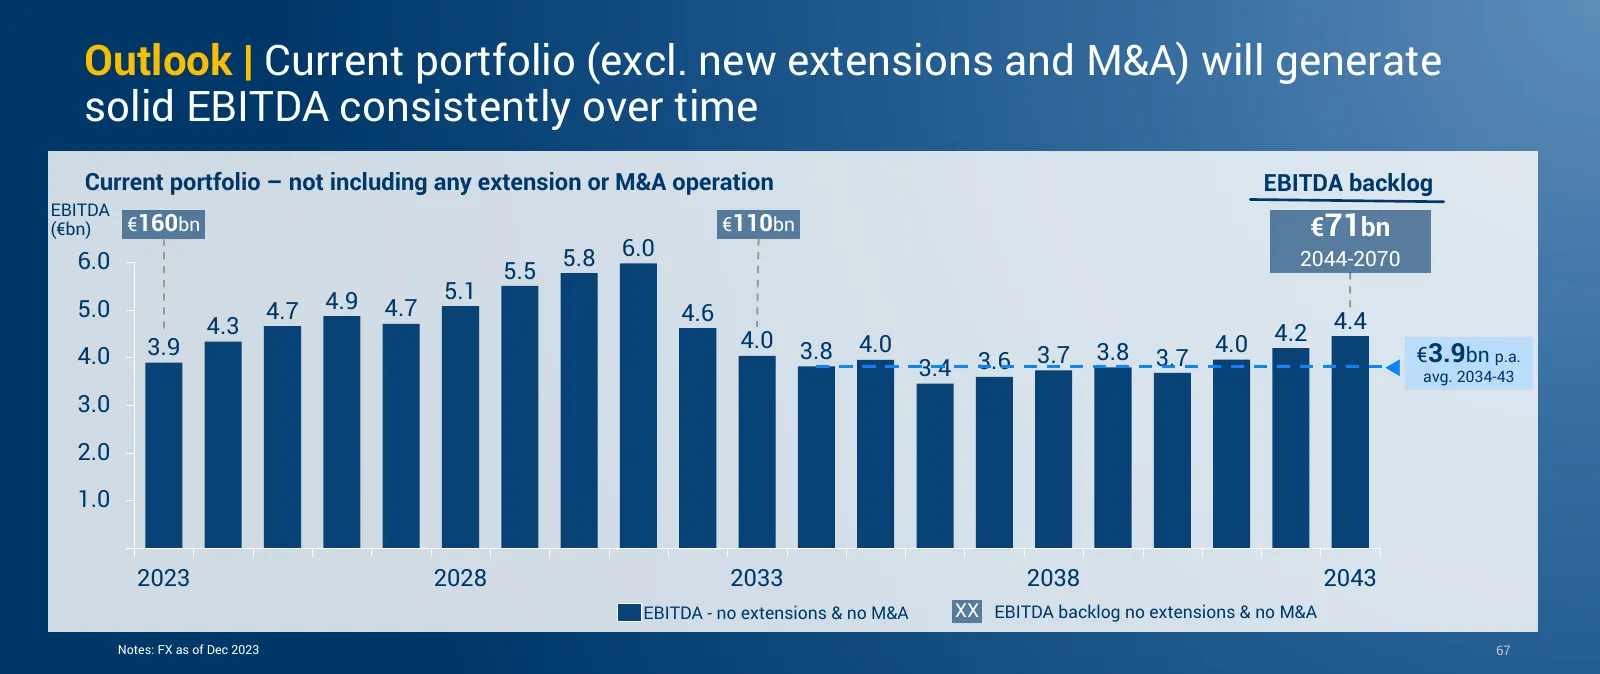
Slide 92: Outlook: current portfolio generates solid EBITDA
Outlook | Current portfolio (excl. new extensions and M&A) will generate solid EBITDA consistently over time Current portfolio – not including any extension or M&A operation EBITDA backlog EBITDA (€bn) €160bn €110bn €71bn 5.8 6.0 2044-2070 6.0 5.5 4.9 5.1 5.0 4.7 4.7 4.6 4.3 4.4 4.0 4.0 4.0 4.2 4.0
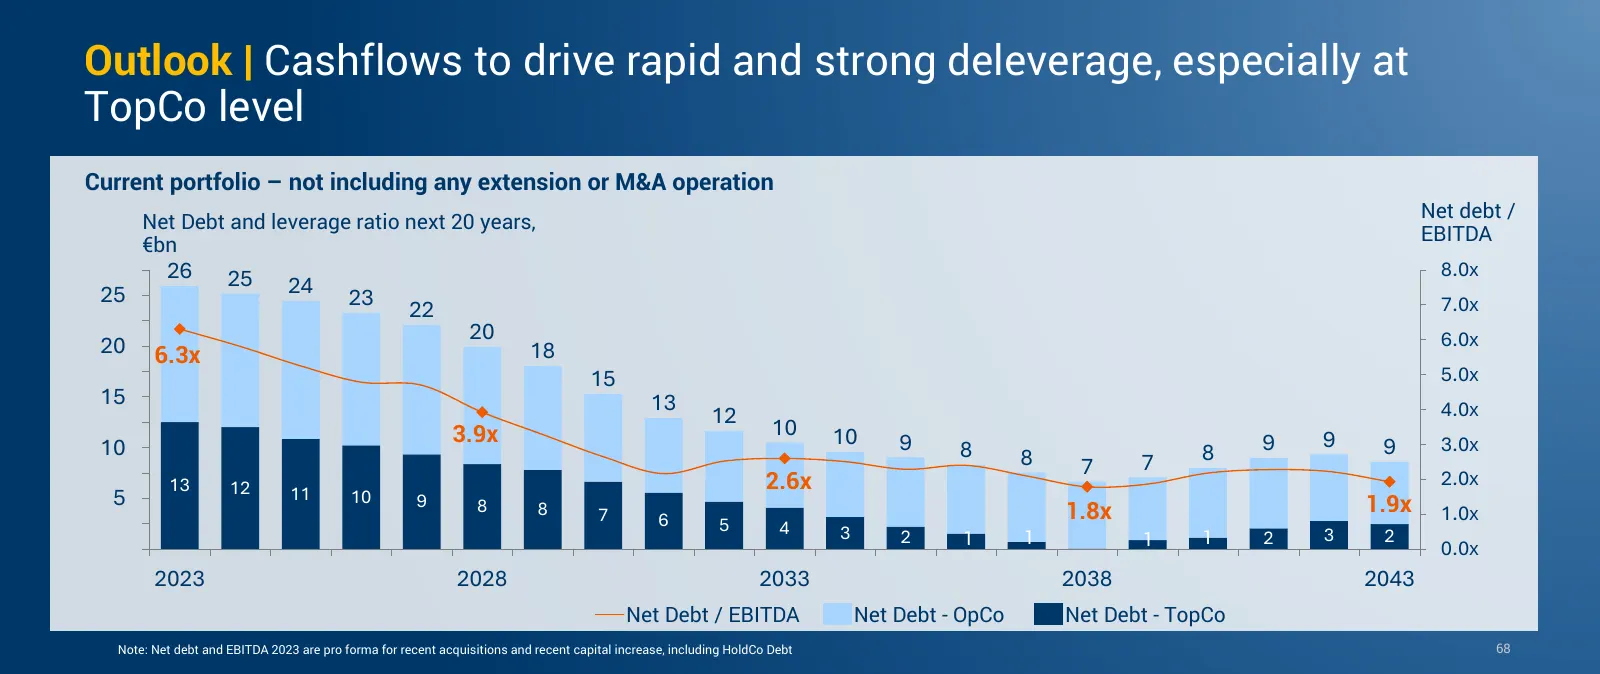
Slide 93: Outlook: rapid deleverage especially at TopCo
Outlook | Cashflows to drive rapid and strong deleverage, especially at TopCo level Current portfolio – not including any extension or M&A operation Net debt / Net Debt and leverage ratio next 20 years, EBITDA €bn 26 25 8.0x 25 24 23 7.0x 22 20 6.0x 20 6.3x 18 15 5.0x 15 13 12 4.0x 3.9x 10 10 9 10 9
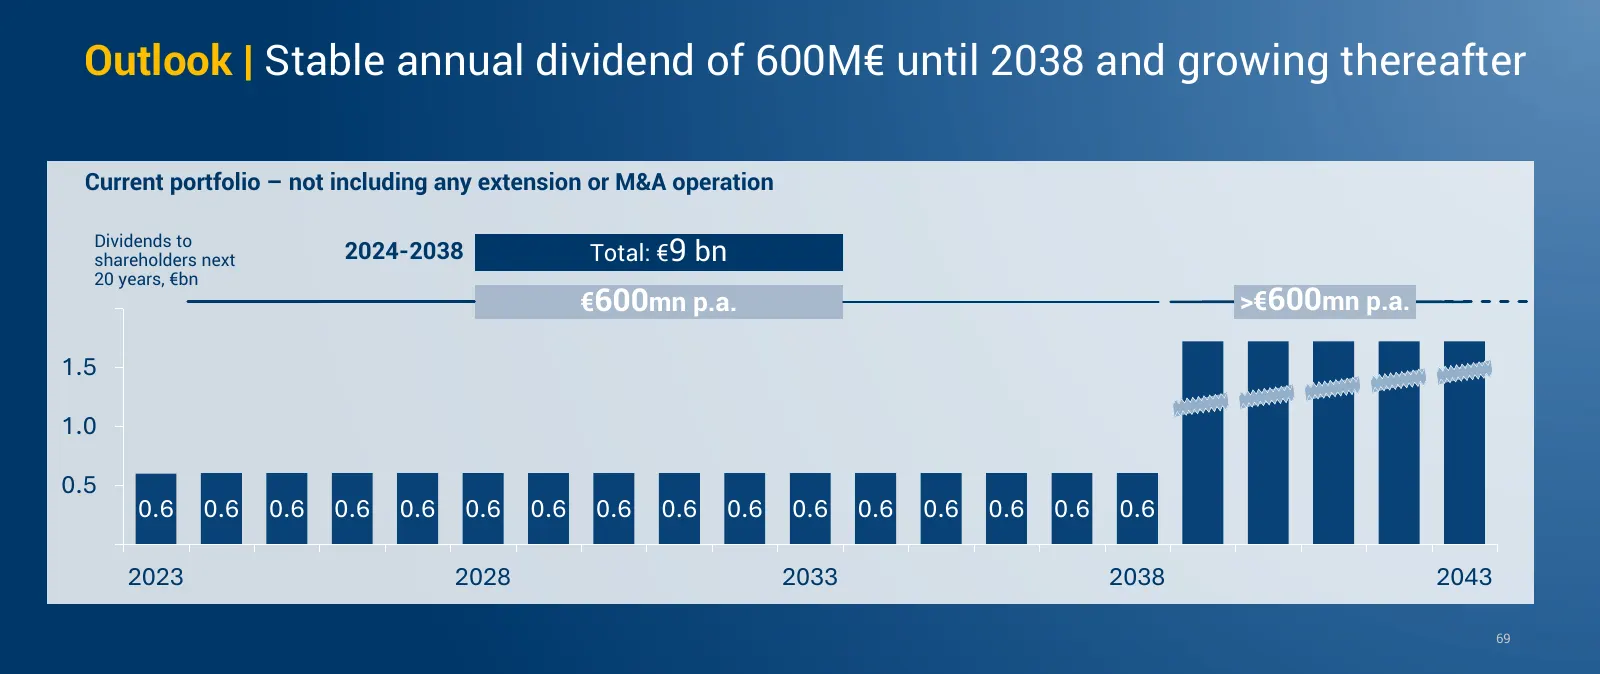
Slide 94: Stable annual dividend of €600M until 2038
Outlook | Stable annual dividend of 600M€ until 2038 and growing thereafter Current portfolio – not including any extension or M&A operation Total: €9 bn Dividends to shareholders next 2024-2038 20 years, €bn €600mn p.a. >€600mn p.a. 1.5 1.0 0.5 0.6 0.6 0.6 0.6 0.6 0.6 0.6 0.6 0.6 0.6 0.6 0.6 0.6 0.
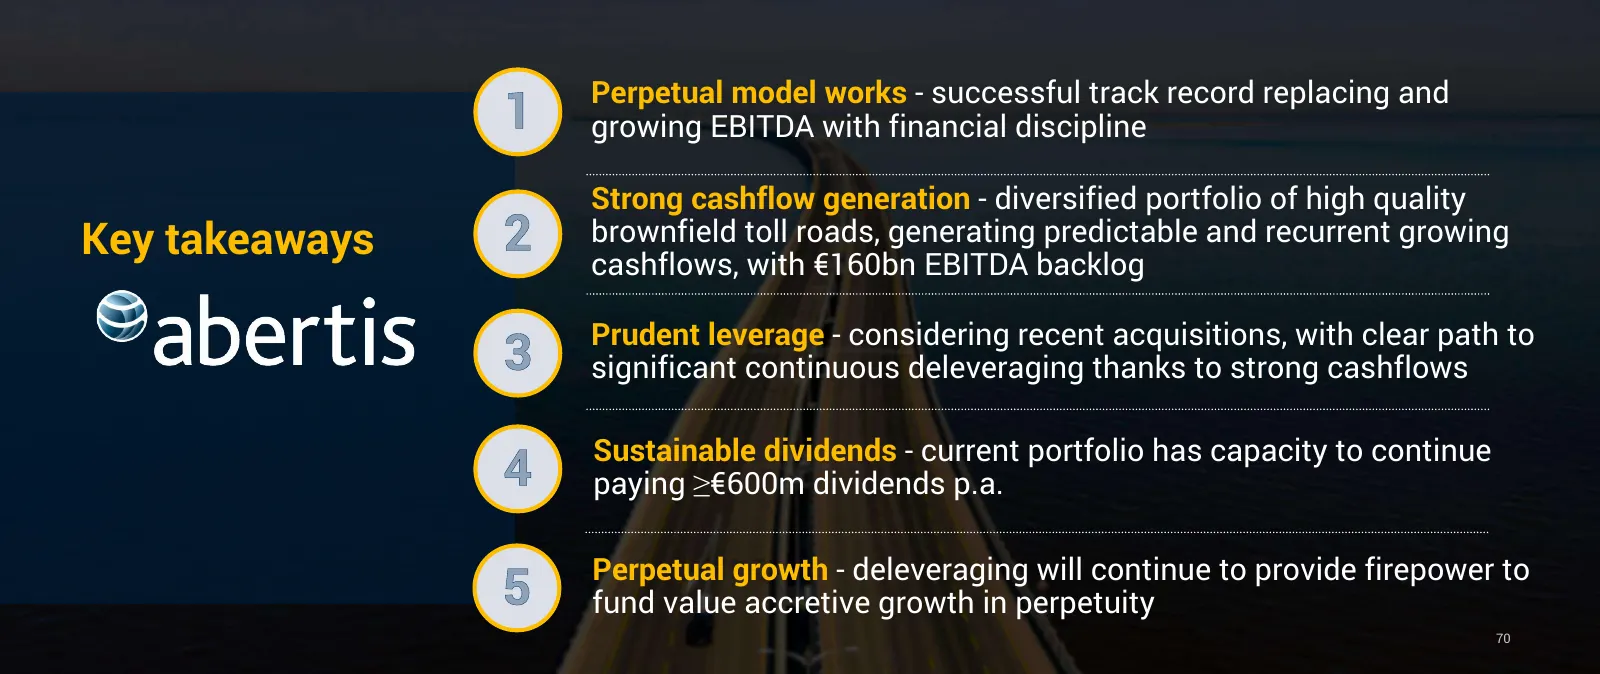
Slide 95: Key takeaways
Perpetual model works - successful track record replacing and 1 growing EBITDA with financial discipline Strong cashflow generation - diversified portfolio of high quality Key takeaways 2 brownfield toll roads, generating predictable and recurrent growing cashflows, with €160bn EBITDA backlog Pruden
Slide 96: Infrastructure Greenfield
Capital Markets Day Infrastructure Greenfield 17th April 2024 71
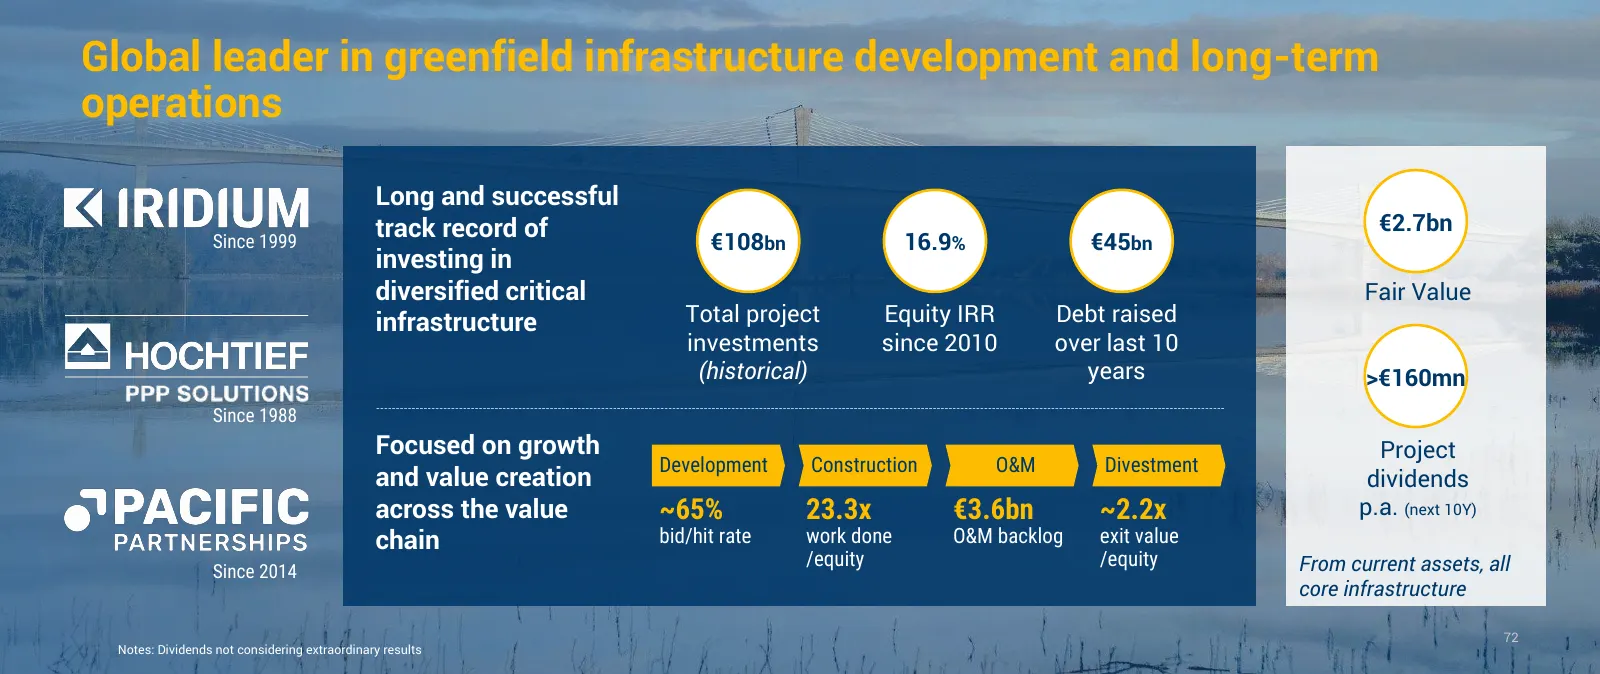
Slide 97: Global leader in greenfield infrastructure development
Global leader in greenfield infrastructure development and long-term operations Long and successful track record of €2.7bn Since 1999 €108bn 16.9% €45bn investing in diversified critical Fair Value infrastructure Total project Equity IRR Debt raised investments since 2010 over last 10 (historical) y
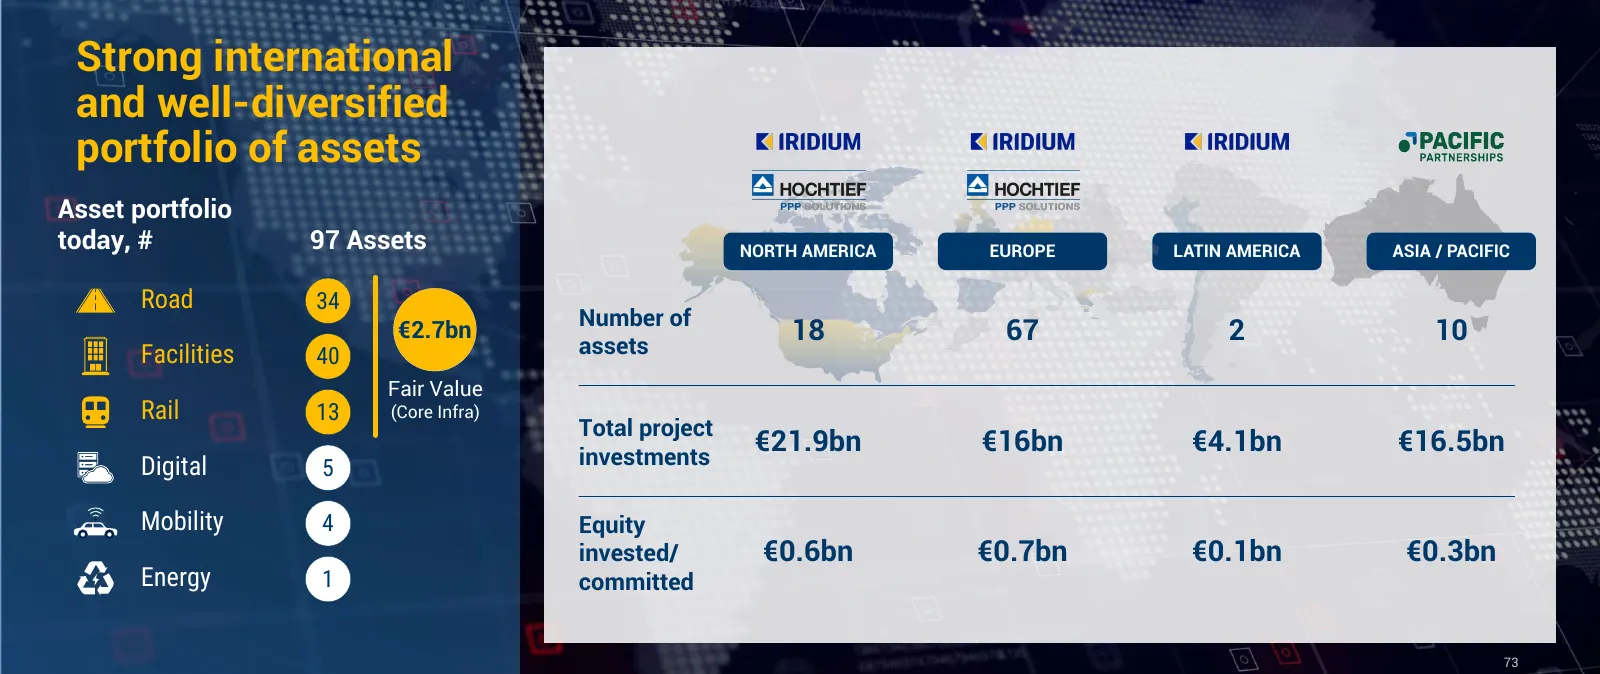
Slide 98: Strong international and diversified portfolio of assets
Strong international and well-diversified portfolio of assets Asset portfolio today, # 97 Assets NORTH AMERICA EUROPE LATIN AMERICA ASIA / PACIFIC Road 34 Number of €2.7bn assets 18 67 2 10 Facilities 40 Fair Value Rail 13 (Core Infra) Total project investments €21.9bn €16bn €4.1bn €16.5bn Digital 5
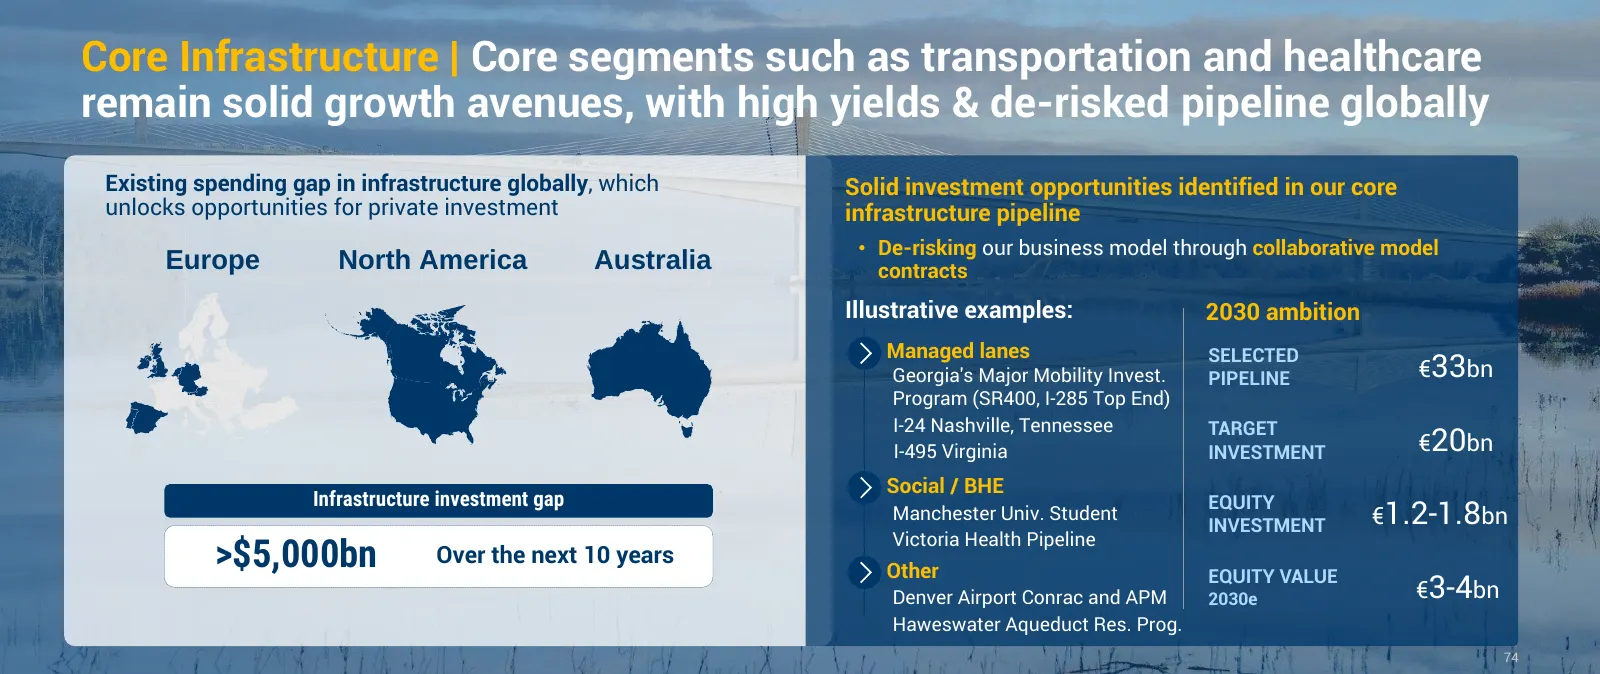
Slide 99: Core Infrastructure: solid growth avenues
Core Infrastructure | Core segments such as transportation and healthcare remain solid growth avenues, with high yields & de-risked pipeline globally Existing spending gap in infrastructure globally, which Solid investment opportunities identified in our core unlocks opportunities for private invest
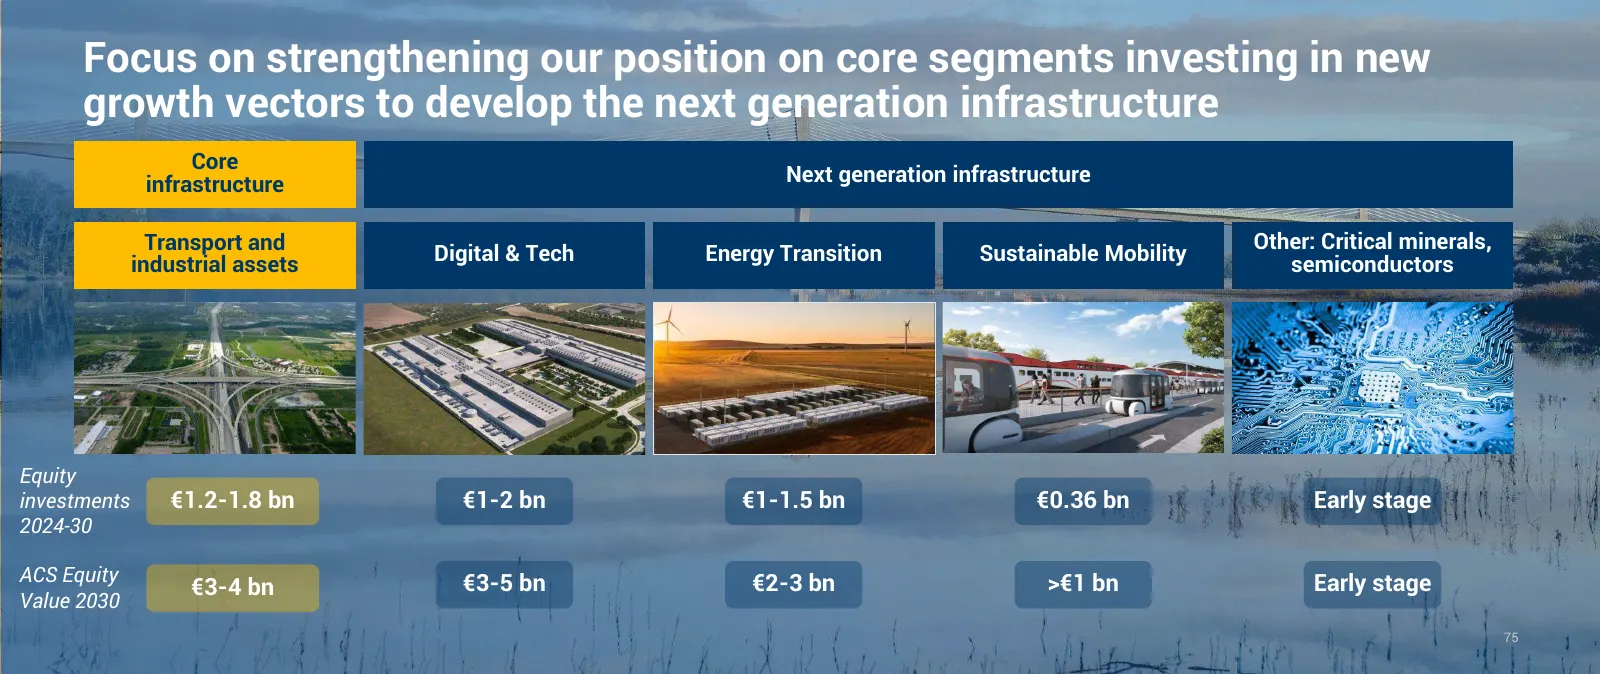
Slide 100: Strengthening core segments and investing in new growth vectors
Focus on strengthening our position on core segments investing in new growth vectors to develop the next generation infrastructure Core infrastructure Next generation infrastructure Transport and Other: Critical minerals, Digital & Tech Energy Transition Sustainable Mobility industrial assets semico
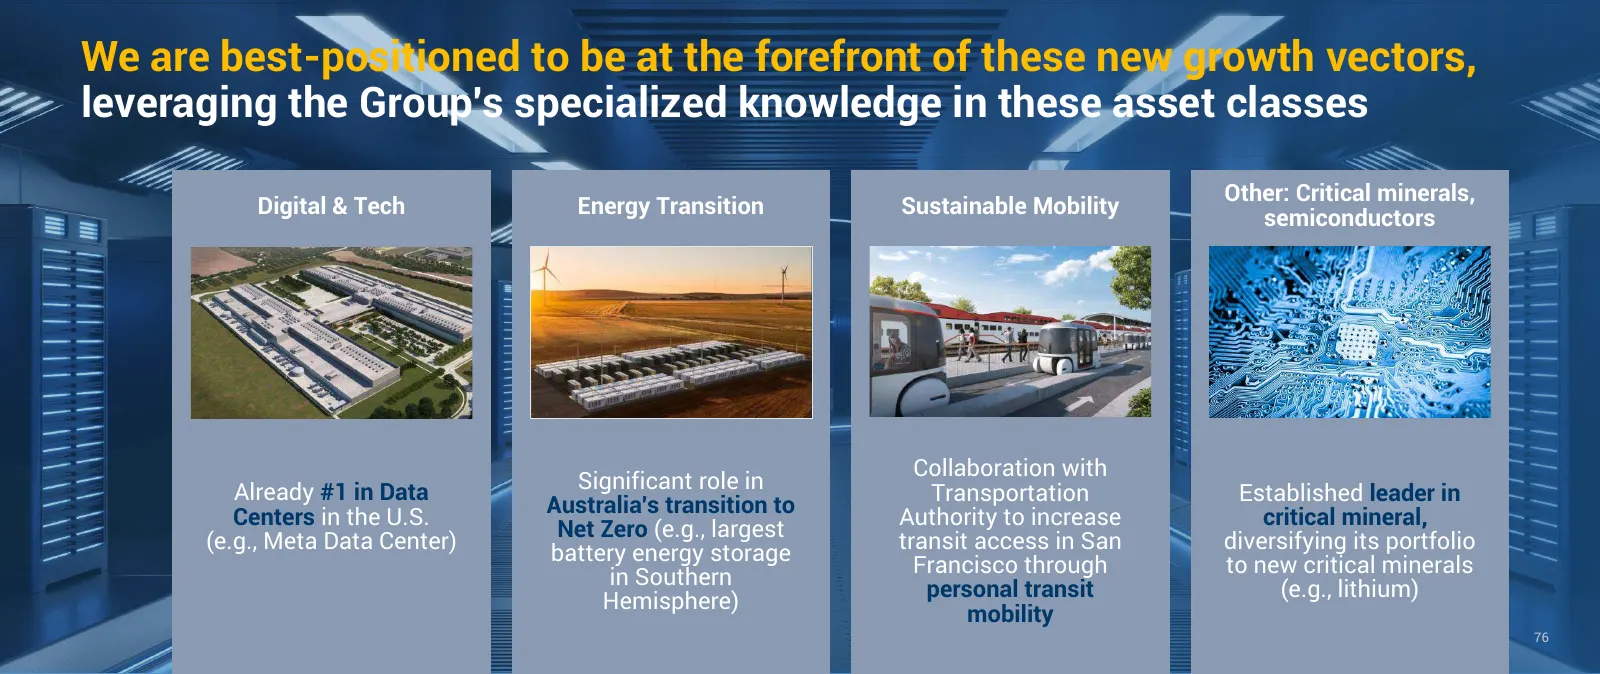
Slide 101: Best-positioned for new growth vectors
We are best-positioned to be at the forefront of these new growth vectors, leveraging the Group's specialized knowledge in these asset classes Other: Critical minerals, Digital & Tech Energy Transition Sustainable Mobility semiconductors Collaboration with Significant role in Already #1 in Data Tran
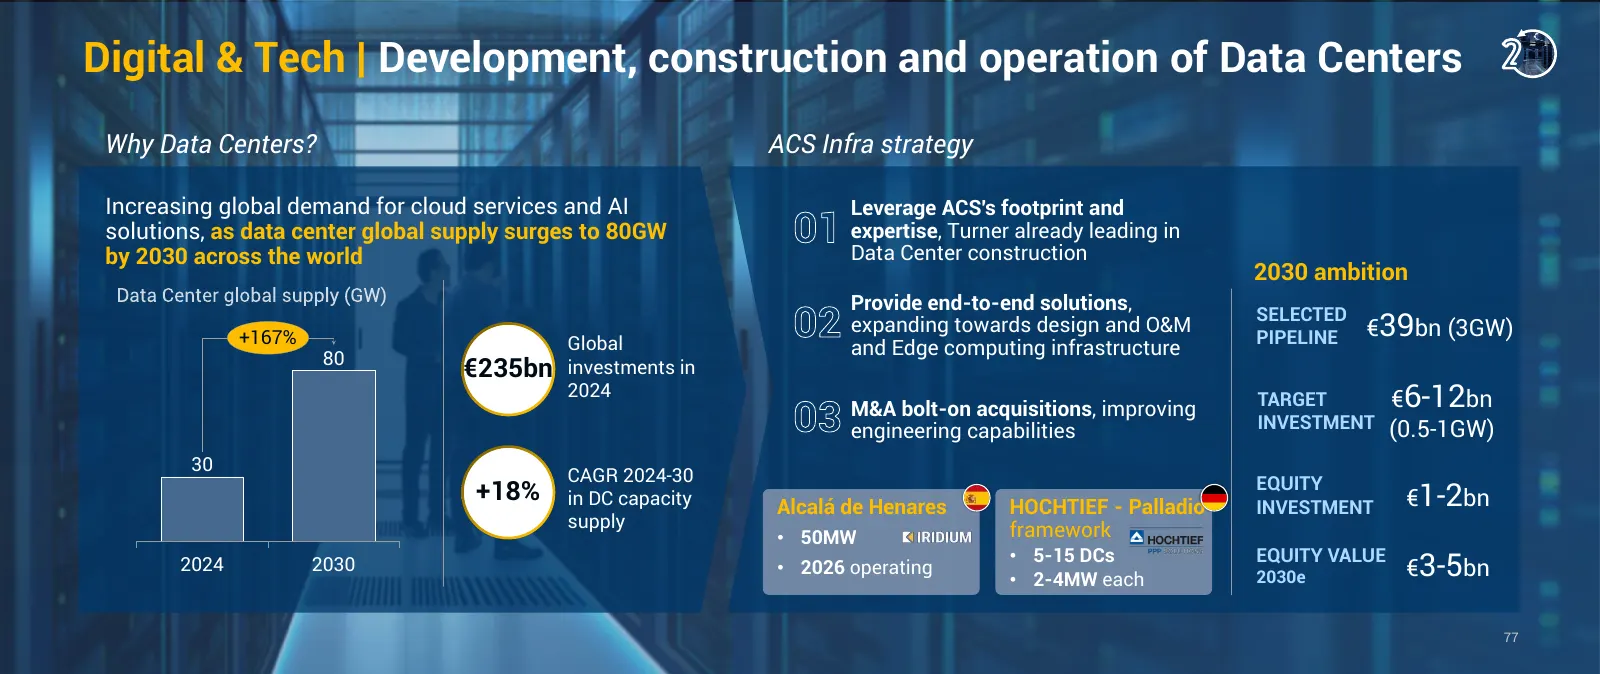
Slide 102: Digital & Tech: Data Centers
Digital & Tech | Development, construction and operation of Data Centers Why Data Centers? ACS Infra strategy Increasing global demand for cloud services and AI Leverage ACS's footprint and solutions, as data center global supply surges to 80GW 01 expertise, Turner already leading in Data Center con
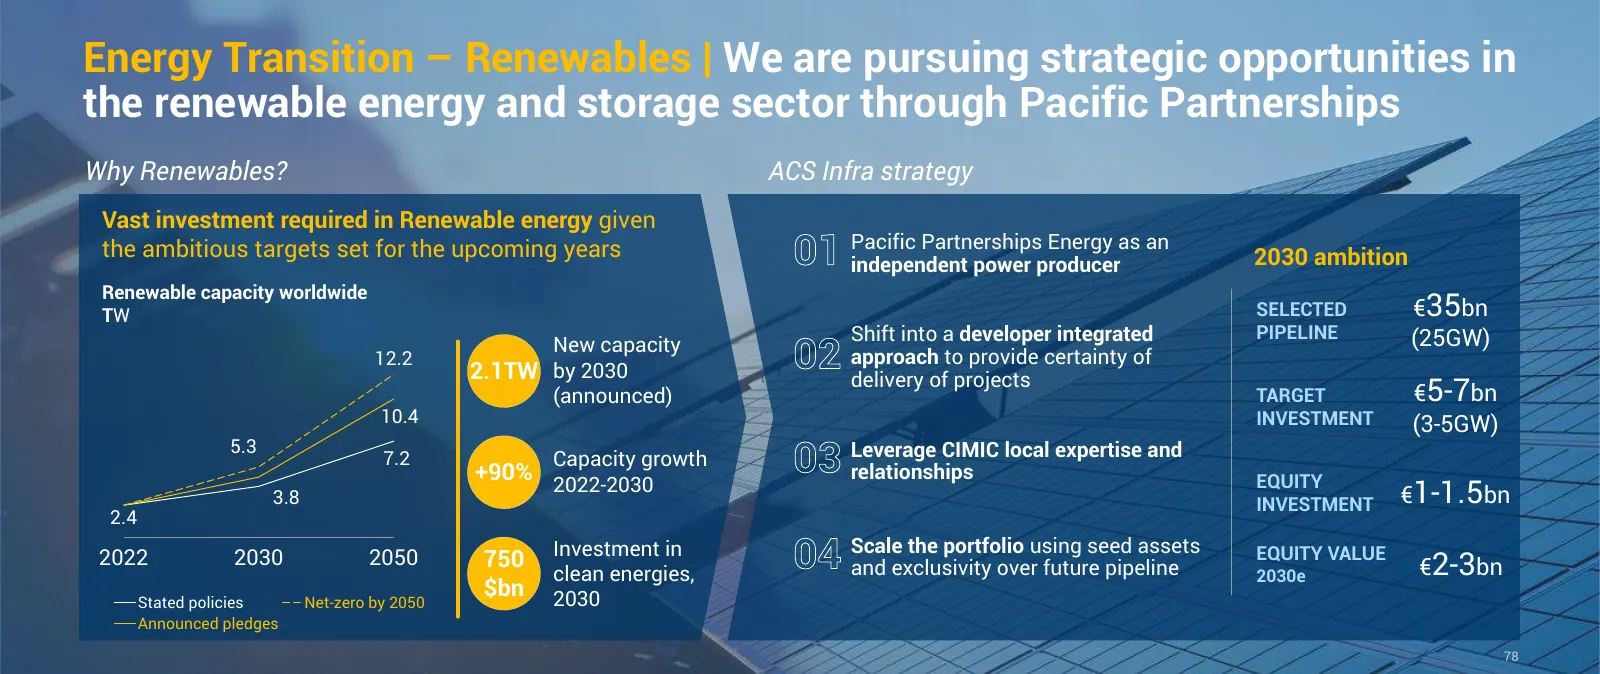
Slide 103: Energy Transition – Renewables
Energy Transition – Renewables | We are pursuing strategic opportunities in the renewable energy and storage sector through Pacific Partnerships Why Renewables? ACS Infra strategy Vast investment required in Renewable energy given the ambitious targets set for the upcoming years 01 Pacific Partnersh
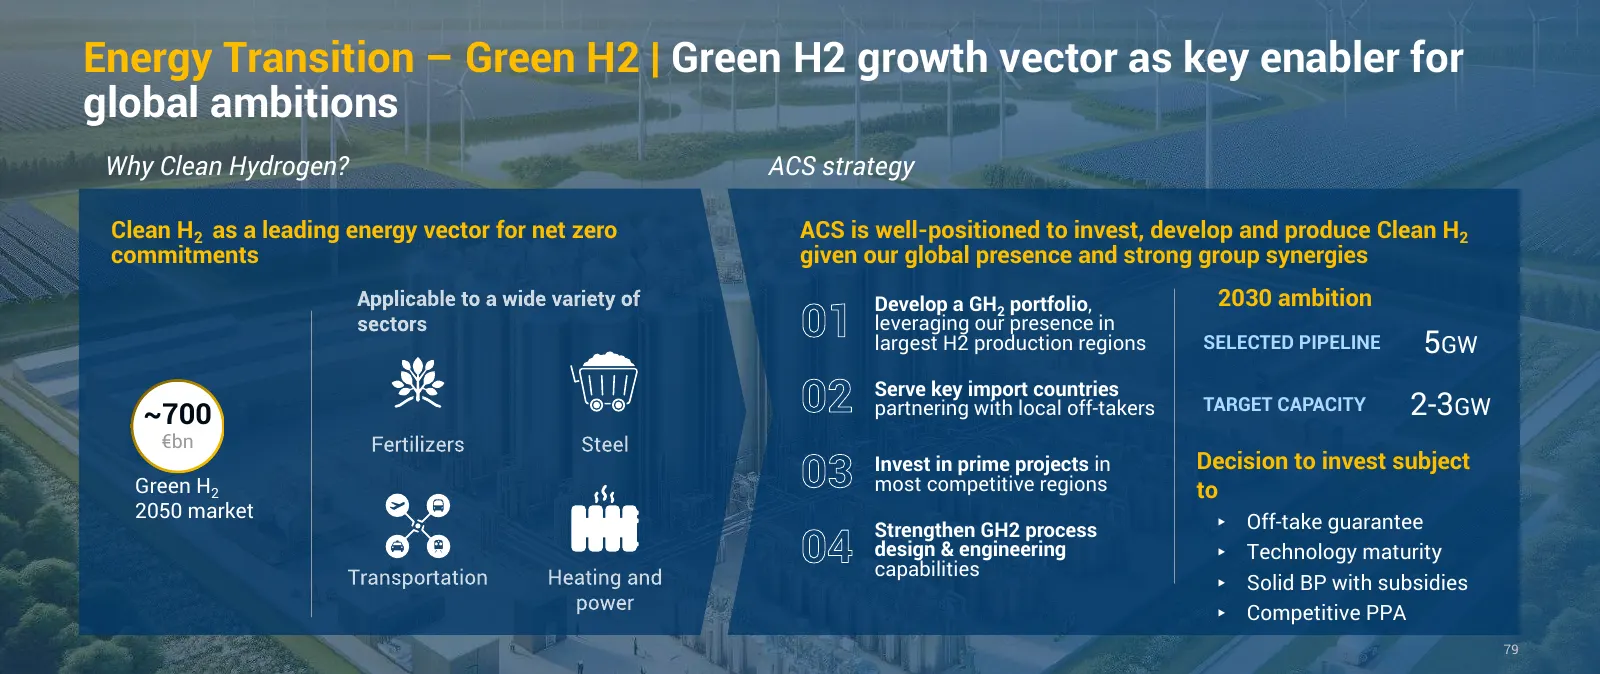
Slide 104: Energy Transition – Green H2
Energy Transition – Green H2 | Green H2 growth vector as key enabler for global ambitions Why Clean Hydrogen? ACS strategy Clean H2 as a leading energy vector for net zero ACS is well-positioned to invest, develop and produce Clean H2 commitments given our global presence and strong group synergies
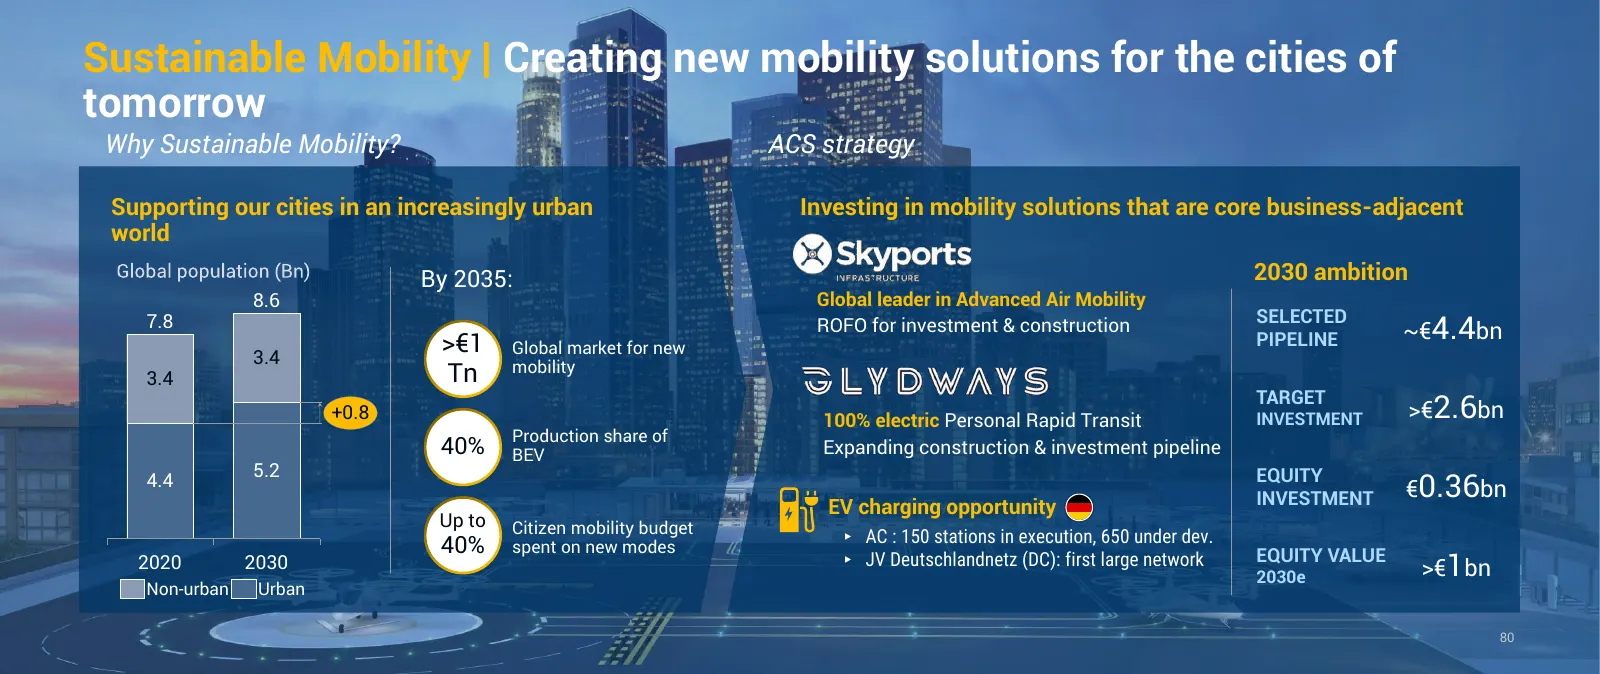
Slide 105: Sustainable Mobility
Sustainable Mobility | Creating new mobility solutions for the cities of tomorrow Why Sustainable Mobility? ACS strategy Supporting our cities in an increasingly urban Investing in mobility solutions that are core business-adjacent world By 2035: 2030 ambition 8.6 Global leader in Advanced Air Mobil
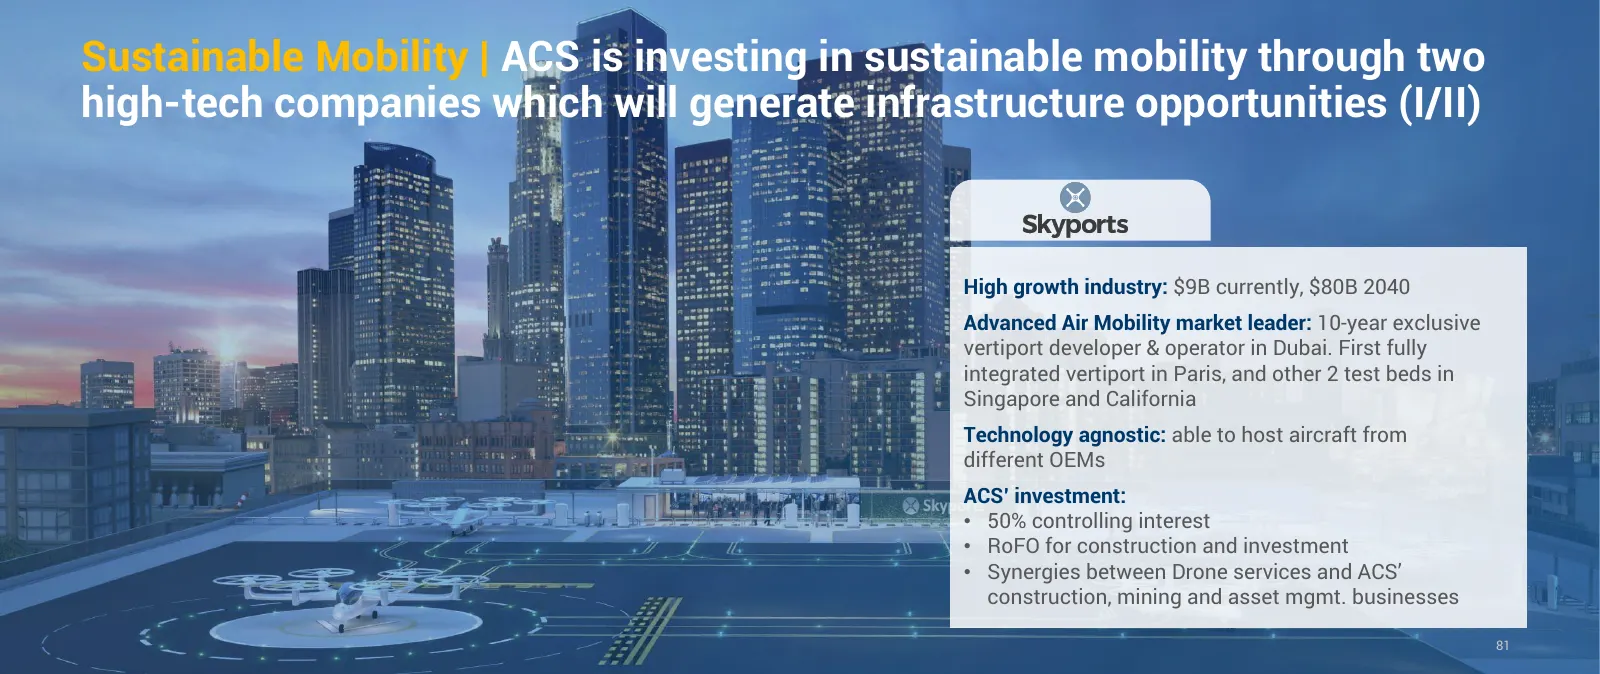
Slide 106: Sustainable Mobility: two high-tech companies (I/II)
Sustainable Mobility | ACS is investing in sustainable mobility through two high-tech companies which will generate infrastructure opportunities (I/II) High growth industry: $9B currently, $80B 2040 Advanced Air Mobility market leader: 10-year exclusive vertiport developer & operator in Dubai. First
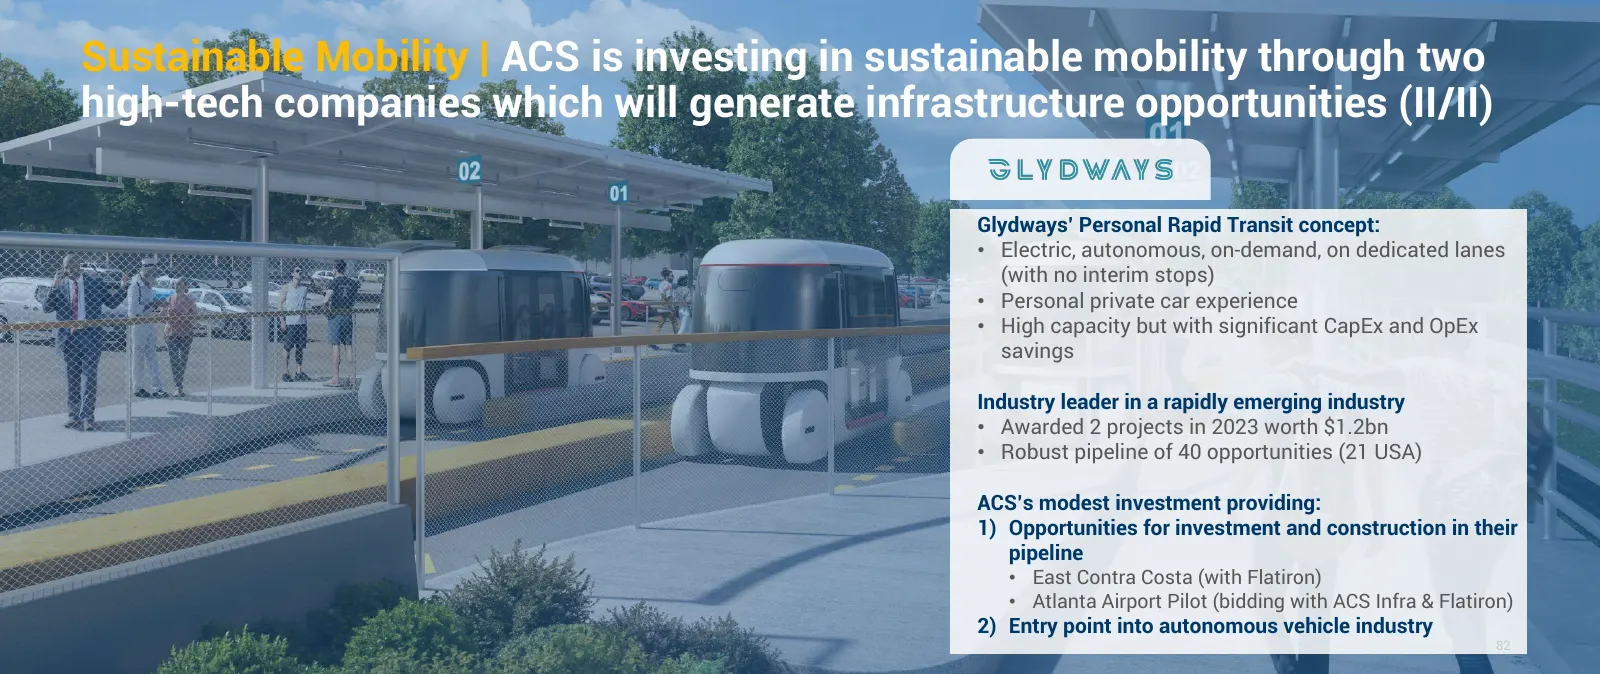
Slide 107: Sustainable Mobility: two high-tech companies (II/II)
Sustainable Mobility | ACS is investing in sustainable mobility through two high-tech companies which will generate infrastructure opportunities (II/II) Glydways’ Personal Rapid Transit concept: • Electric, autonomous, on-demand, on dedicated lanes (with no interim stops) • Personal private car expe
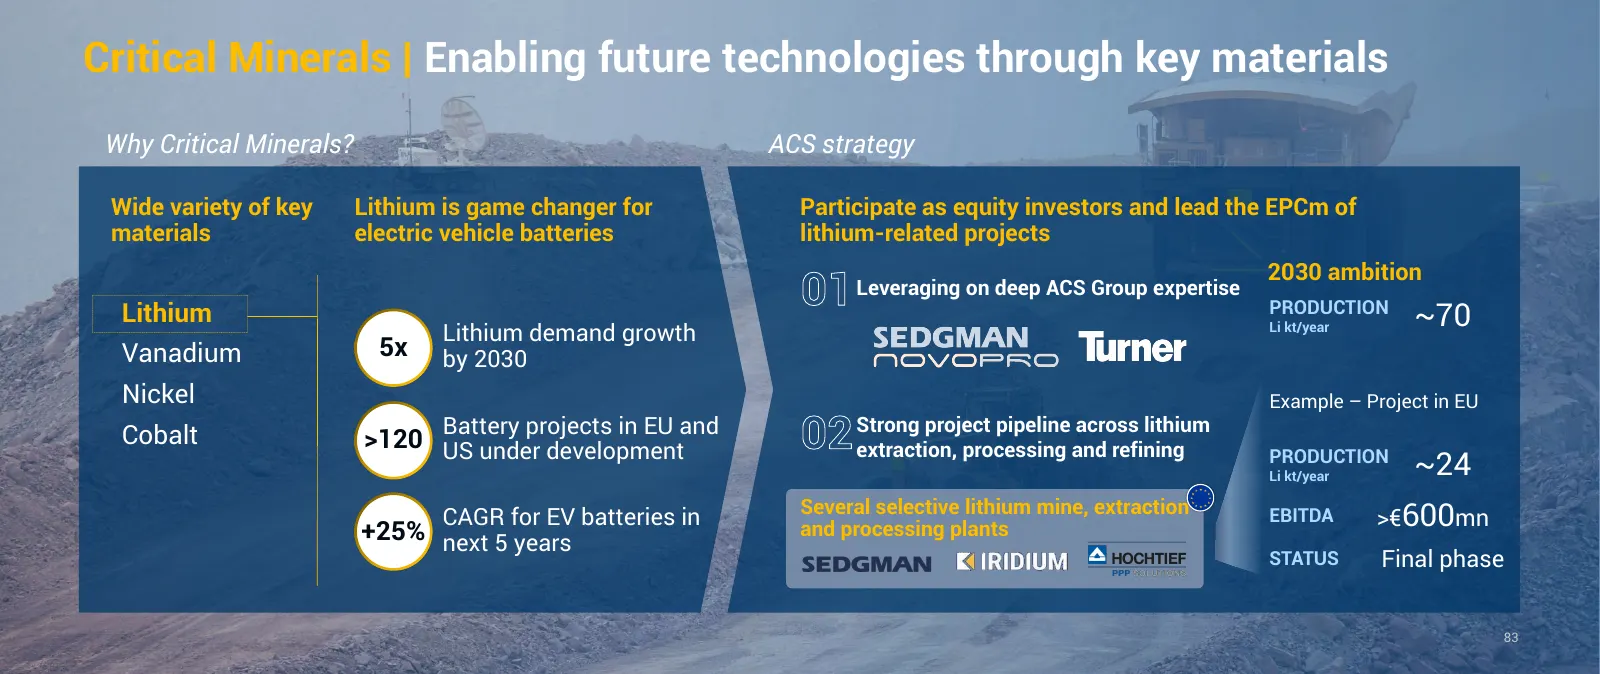
Slide 108: Critical Minerals
Critical Minerals | Enabling future technologies through key materials Why Critical Minerals? ACS strategy Wide variety of key Lithium is game changer for Participate as equity investors and lead the EPCm of materials electric vehicle batteries lithium-related projects 2030 ambition Lithium 01 Lever
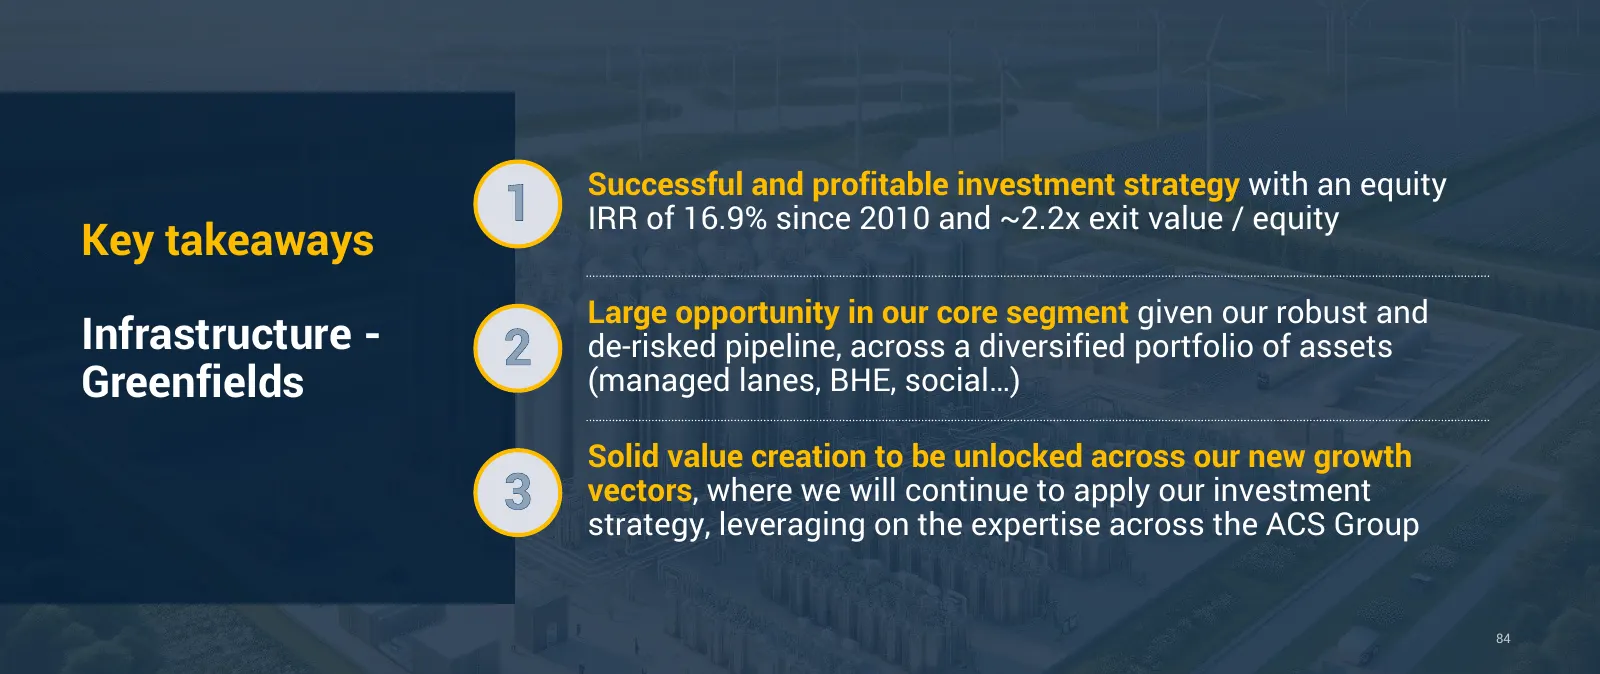
Slide 109: Key takeaways Infrastructure - Greenfields
Successful and profitable investment strategy with an equity 1 IRR of 16.9% since 2010 and ~2.2x exit value / equity Key takeaways Large opportunity in our core segment given our robust and Infrastructure - 2 de-risked pipeline, across a diversified portfolio of assets Greenfields (managed lanes, BH
Slide 110: E&C
Capital Markets Day E&C 17th April 2024 85
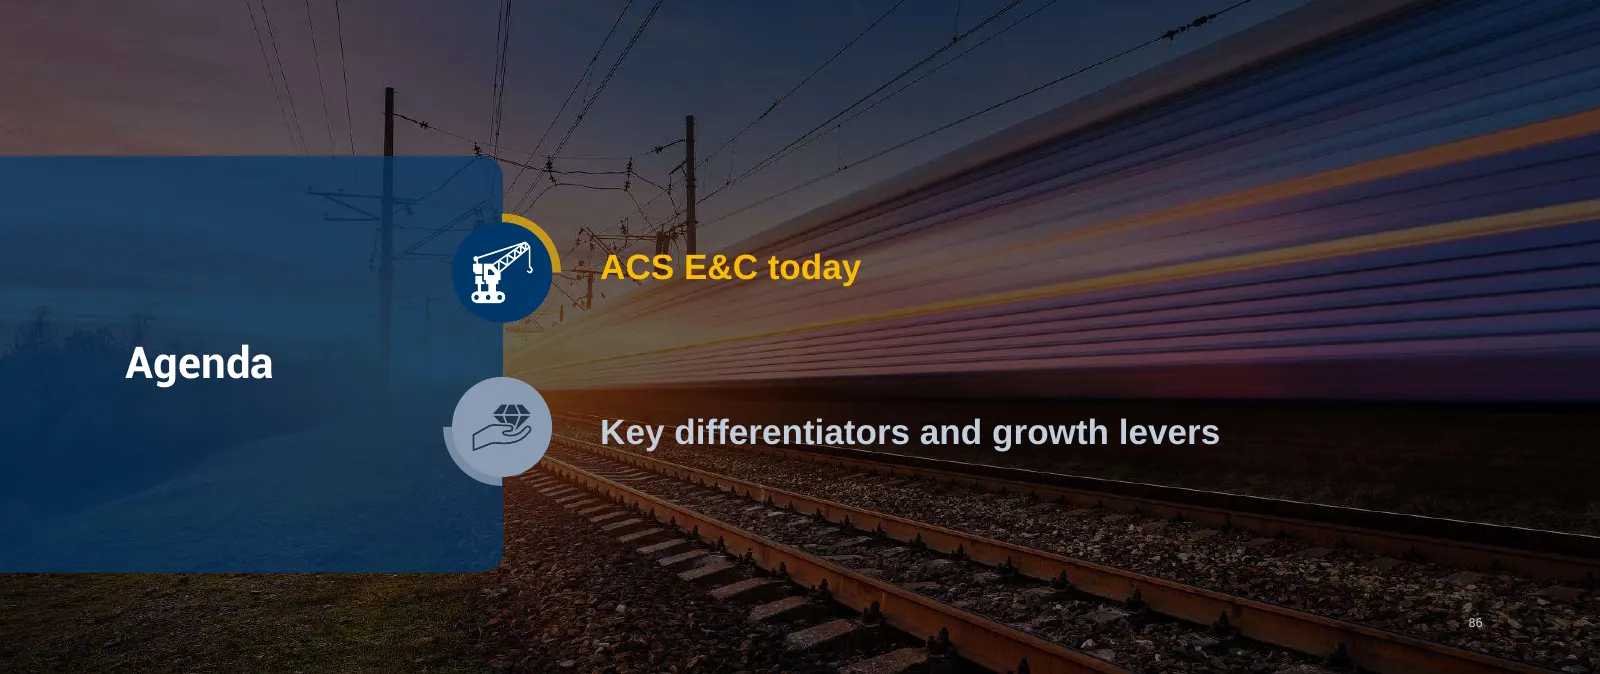
Slide 111: Agenda
ACS E&C today Agenda Key differentiators and growth levers 86
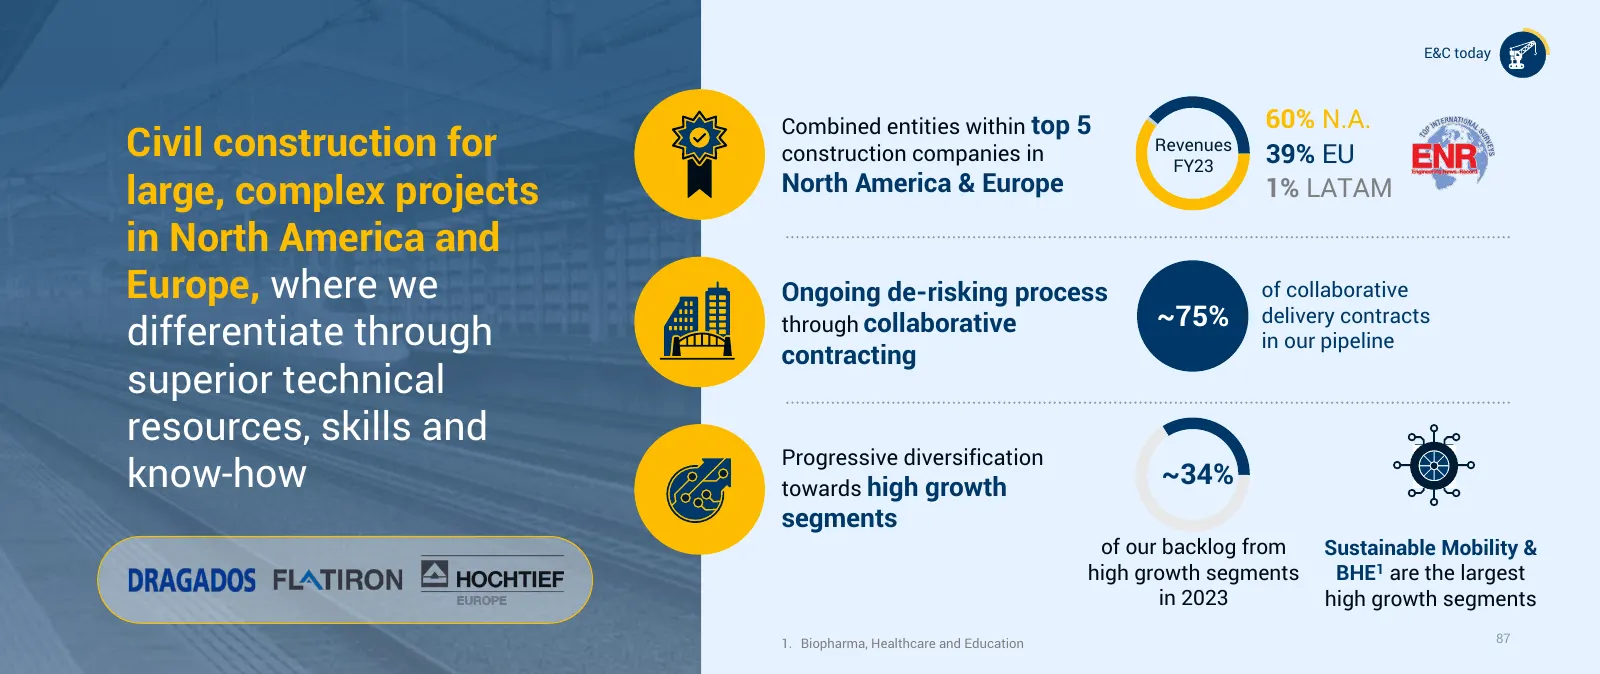
Slide 112: E&C today: civil construction for large, complex projects
E&C today Combined entities within top 5 60% N.A. Civil construction for construction companies in Revenues FY23 39% EU large, complex projects North America & Europe 1% LATAM in North America and Europe, where we Ongoing de-risking process of collaborative ~75% delivery contracts differentiate thro
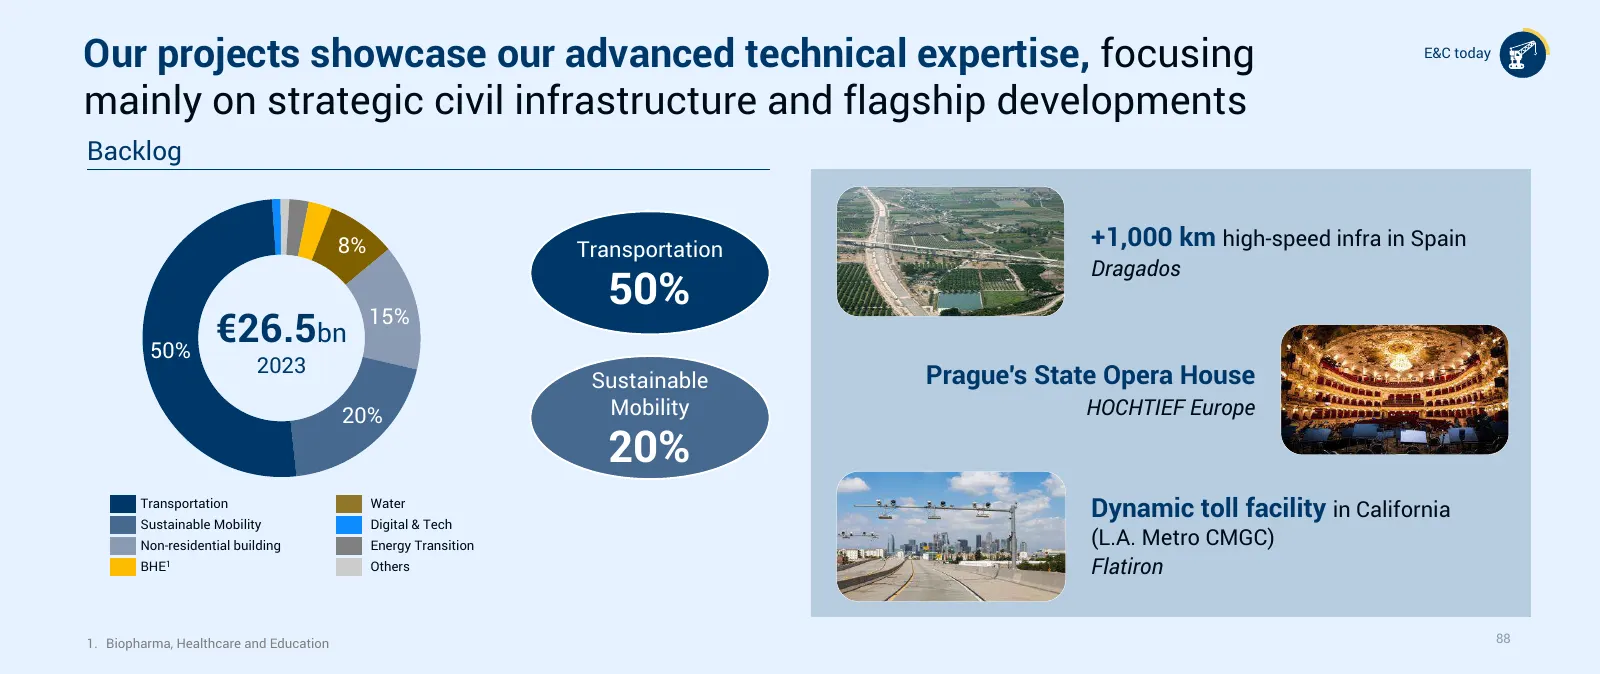
Slide 113: Projects showcase advanced technical expertise
Our projects showcase our advanced technical expertise, focusing E&C today mainly on strategic civil infrastructure and flagship developments Backlog 8% Transportation +1,000 km high-speed infra in Spain Dragados 15% 50% 50% €26.5bn 2023 Sustainable Prague's State Opera House 20% Mobility HOCHTIEF E
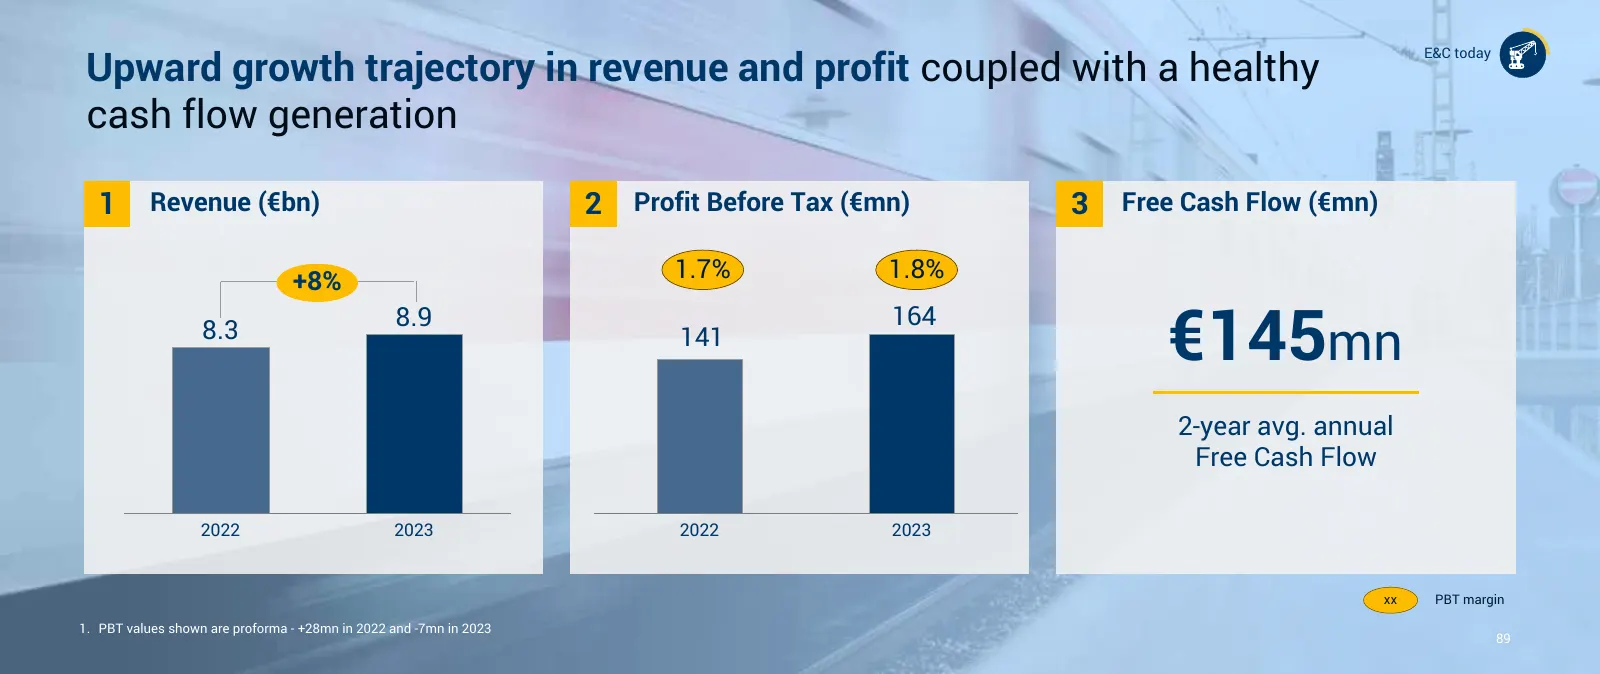
Slide 114: Upward growth in revenue and profit with healthy cash flow
Upward growth trajectory in revenue and profit coupled with a healthy E&C today cash flow generation 1 Revenue (€bn) 2 Profit Before Tax (€mn) 3 Free Cash Flow (€mn) +8% 1.7% 1.8% €145mn 8.9 164 8.3 141 2-year avg. annual Free Cash Flow 2022 2023 2022 2023 xx PBT margin 1. PBT values shown are profo
Slide 115: Agenda
ACS E&C today Agenda Key differentiators and growth levers 90
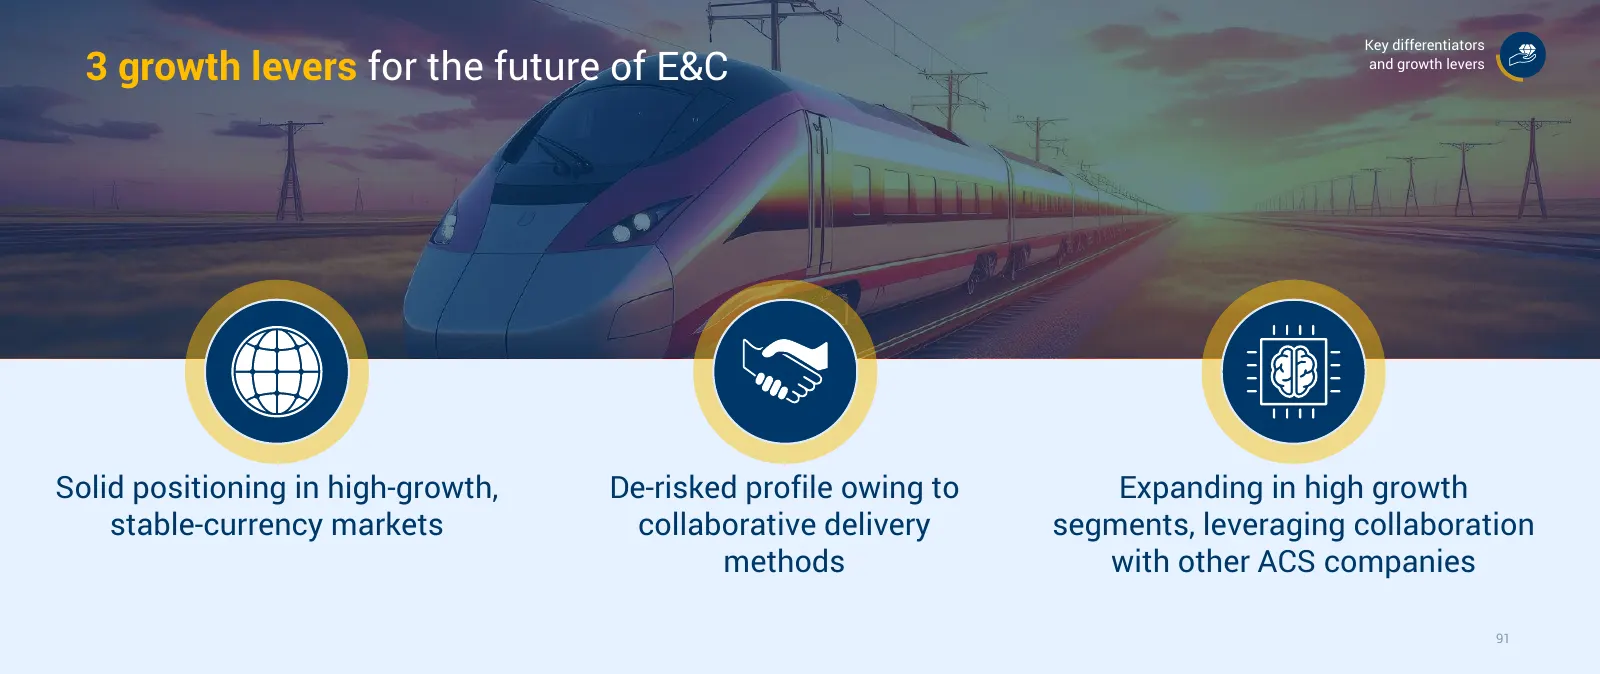
Slide 116: 3 growth levers for the future of E&C
Key differentiators 3 growth levers for the future of E&C and growth levers Solid positioning in high-growth, De-risked profile owing to Expanding in high growth stable-currency markets collaborative delivery segments, leveraging collaboration methods with other ACS companies 91
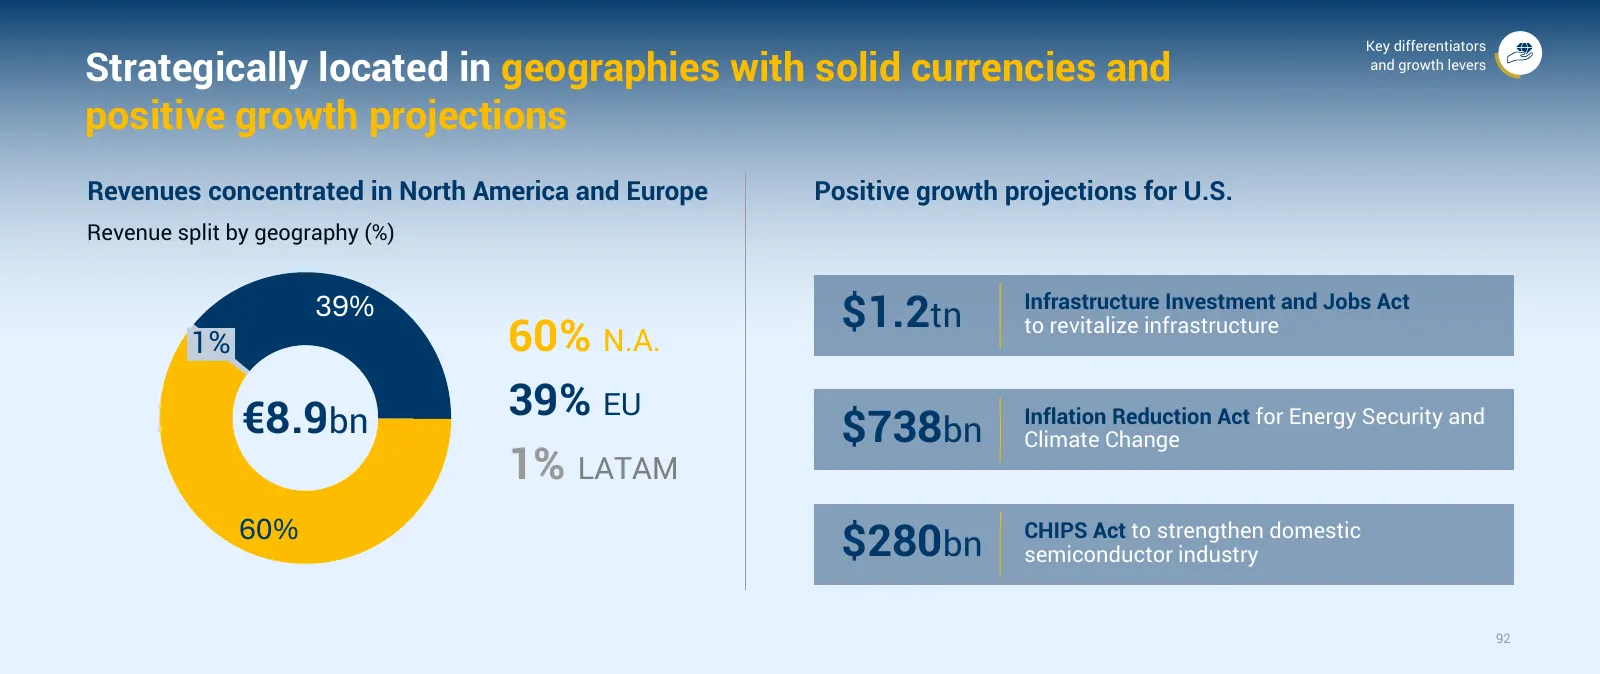
Slide 117: Geographies with solid currencies and positive growth projections
Key differentiators Strategically located in geographies with solid currencies and and growth levers positive growth projections Revenues concentrated in North America and Europe Positive growth projections for U.S. Revenue split by geography (%) 39% $1.2tn Infrastructure Investment and Jobs Act to
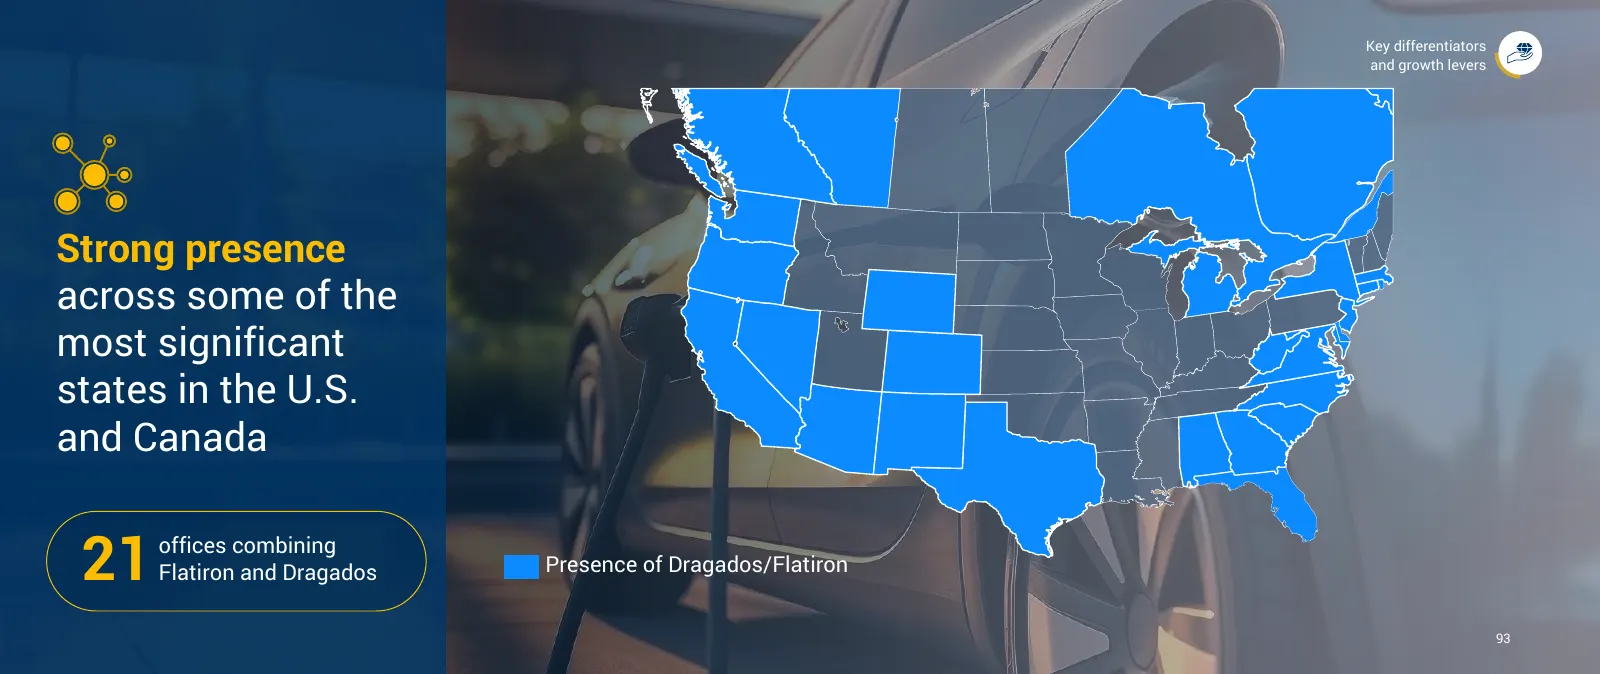
Slide 118: Strong presence across states in the U.S. and Canada
Key differentiators and growth levers Strong presence across some of the most significant states in the U.S. and Canada 21 offices combining Flatiron and Dragados Presence of Dragados/Flatiron 93
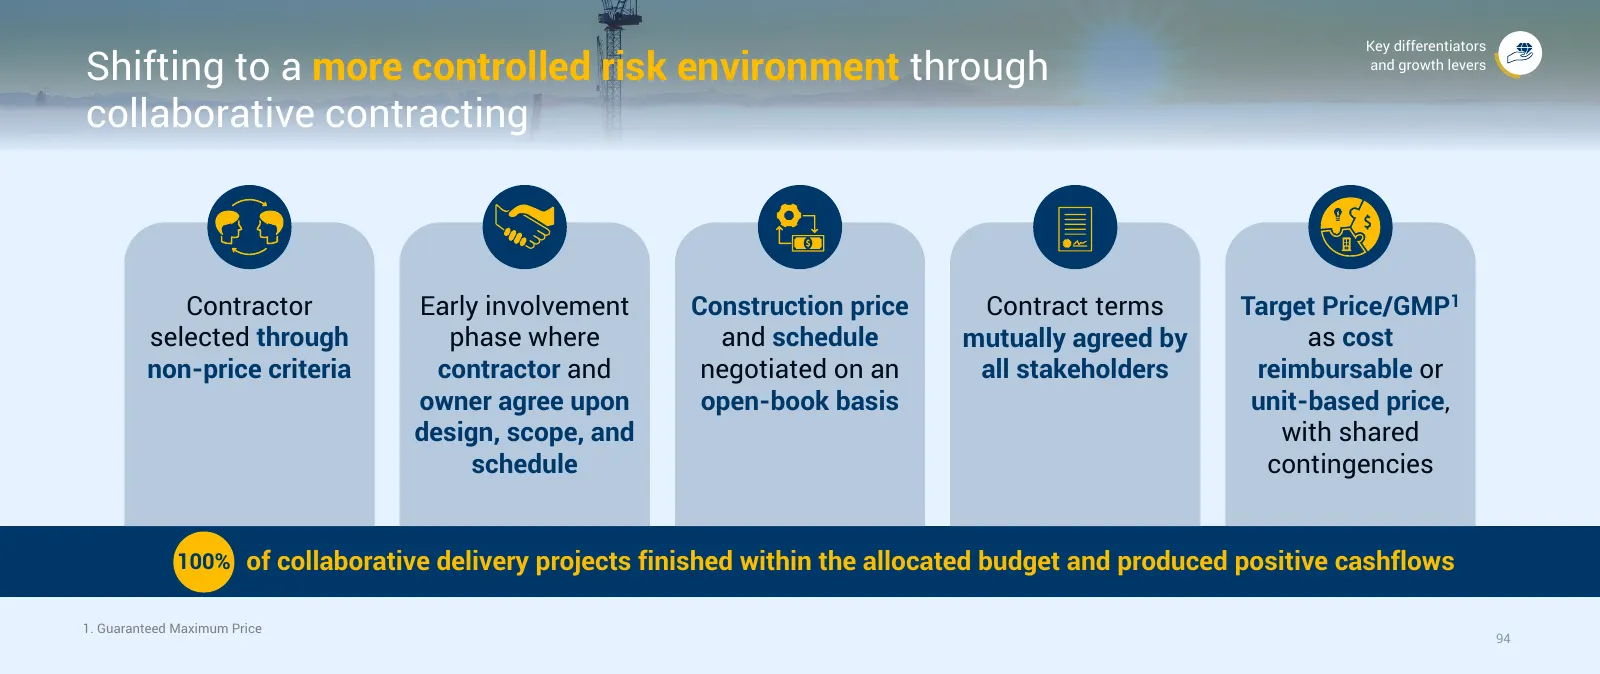
Slide 119: Shifting to controlled risk through collaborative contracting
Key differentiators Shifting to a more controlled risk environment through and growth levers collaborative contracting Contractor Early involvement Construction price Contract terms Target Price/GMP 1 selected through phase where and schedule mutually agreed by as cost non-price criteria contractor
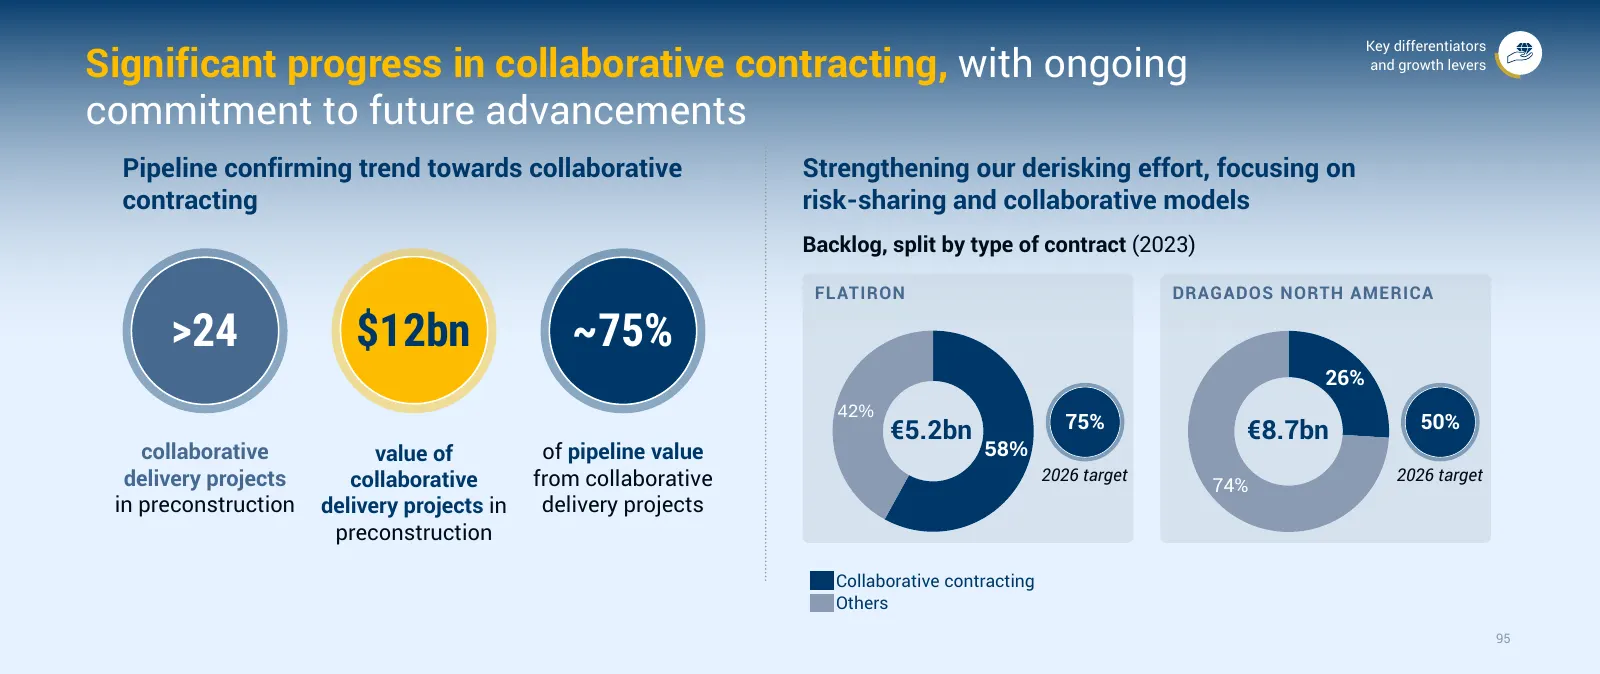
Slide 120: Significant progress in collaborative contracting
Key differentiators Significant progress in collaborative contracting, with ongoing and growth levers commitment to future advancements Pipeline confirming trend towards collaborative Strengthening our derisking effort, focusing on contracting risk-sharing and collaborative models Backlog, split by
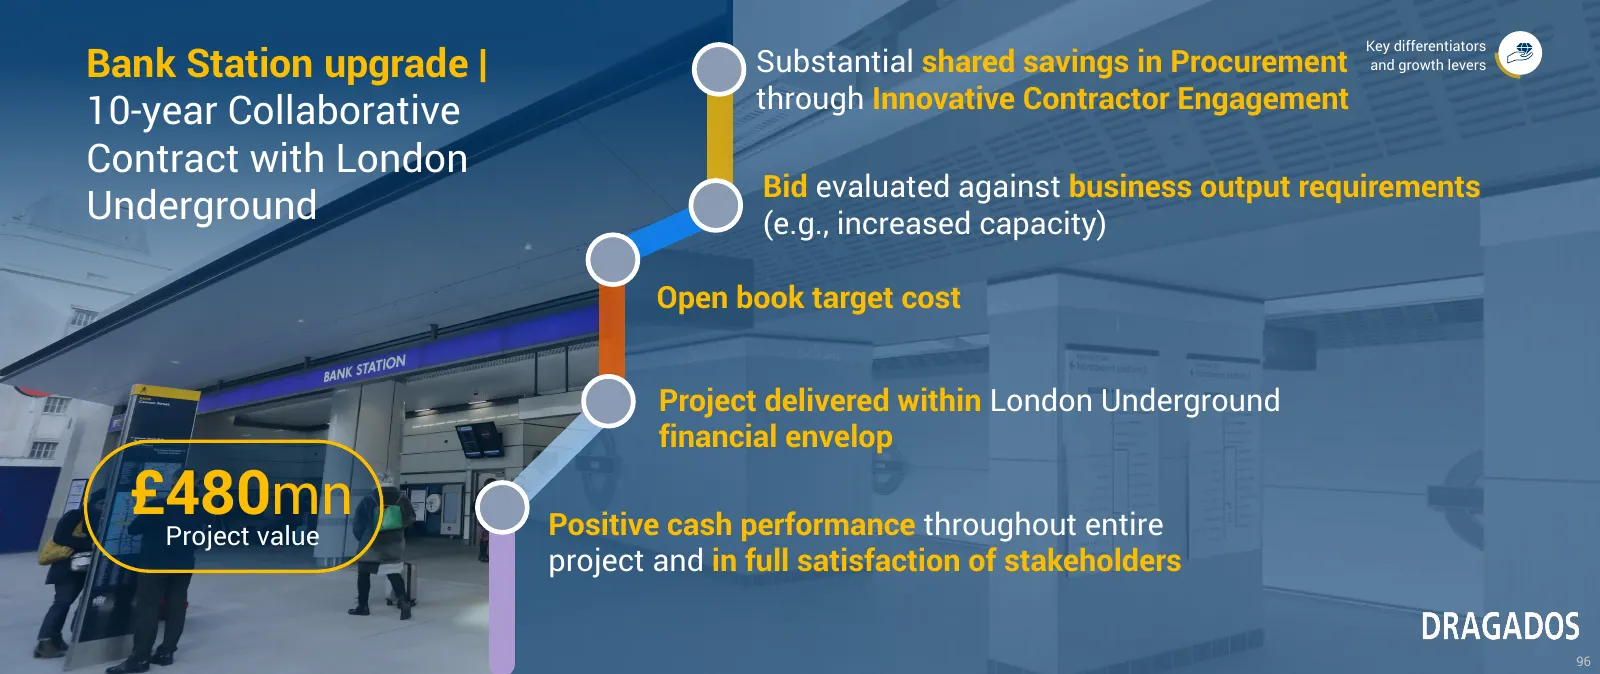
Slide 121: Bank Station upgrade
Key differentiators Bank Station upgrade | Substantial shared savings in Procurement and growth levers through Innovative Contractor Engagement 10-year Collaborative Contract with London Bid evaluated against business output requirements Underground (e.g., increased capacity) Open book target cost P
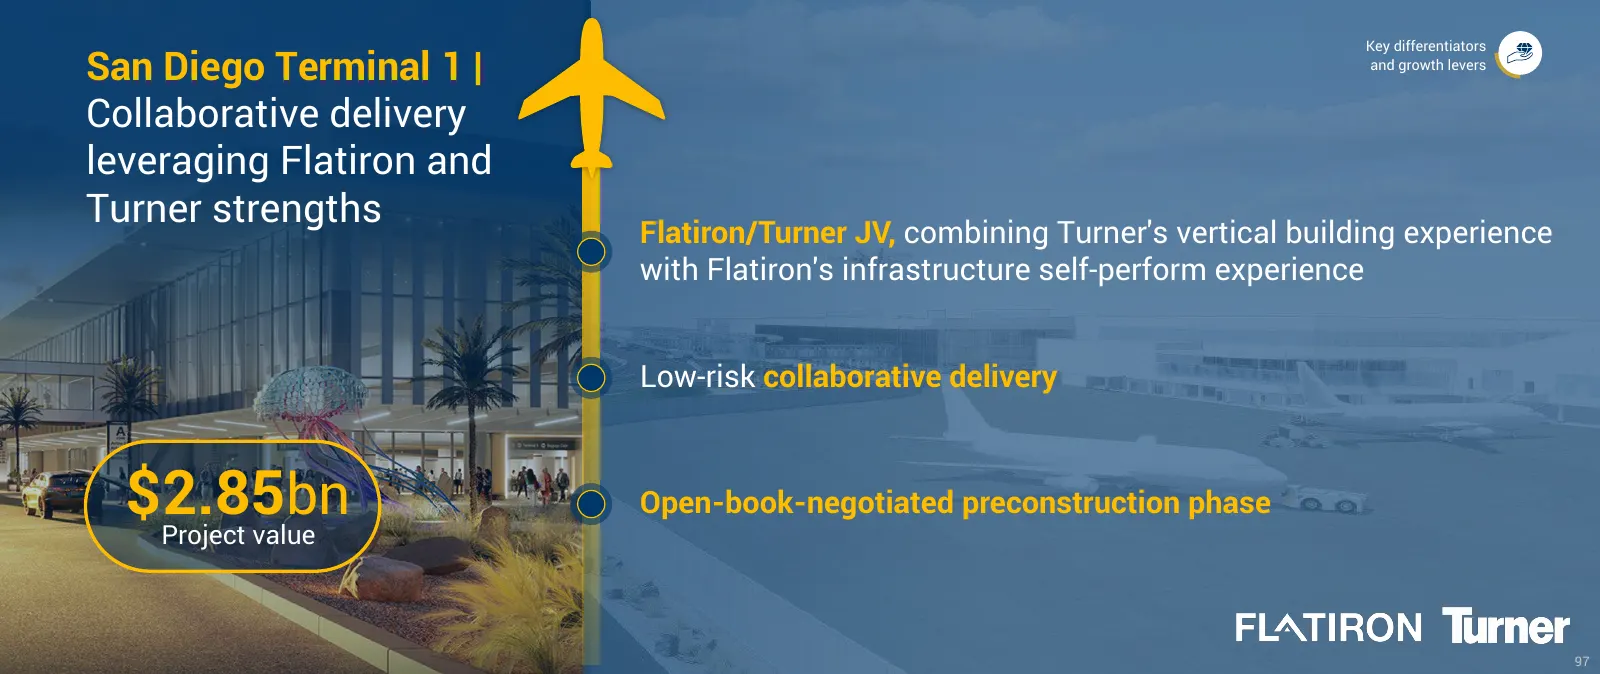
Slide 122: San Diego Terminal
Key differentiators San Diego Terminal 1 | and growth levers Collaborative delivery leveraging Flatiron and Turner strengths Flatiron/Turner JV, combining Turner's vertical building experience with Flatiron's infrastructure self-perform experience Low-risk collaborative delivery $2.85 bn Open-book-n
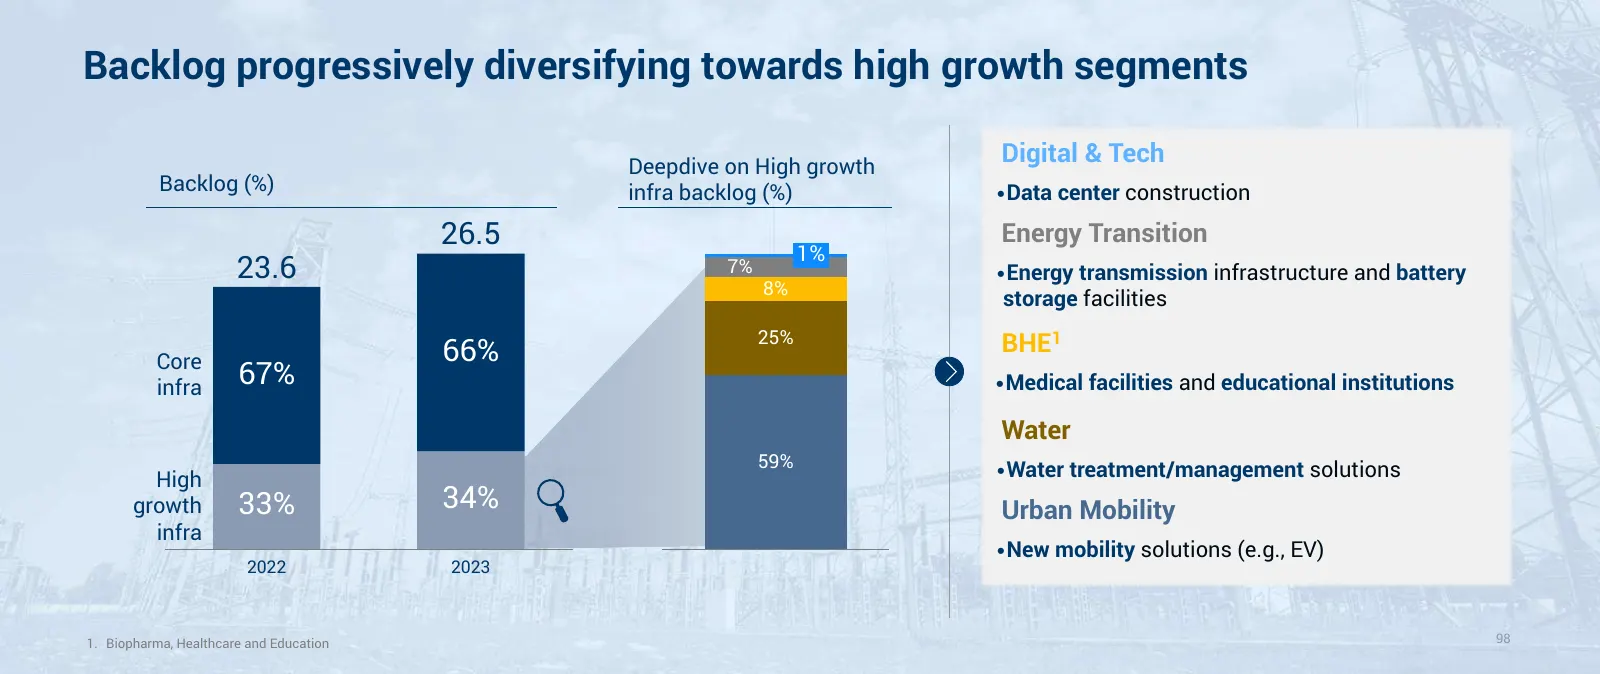
Slide 123: Backlog diversifying towards high growth segments
Backlog progressively diversifying towards high growth segments Deepdive on High growth Digital & Tech Backlog (%) infra backlog (%) •Data center construction 26.5 Energy Transition 1% 23.6 7% •Energy transmission infrastructure and battery 8% storage facilities 25% BHE 1 Core 66% infra 67% •Medical
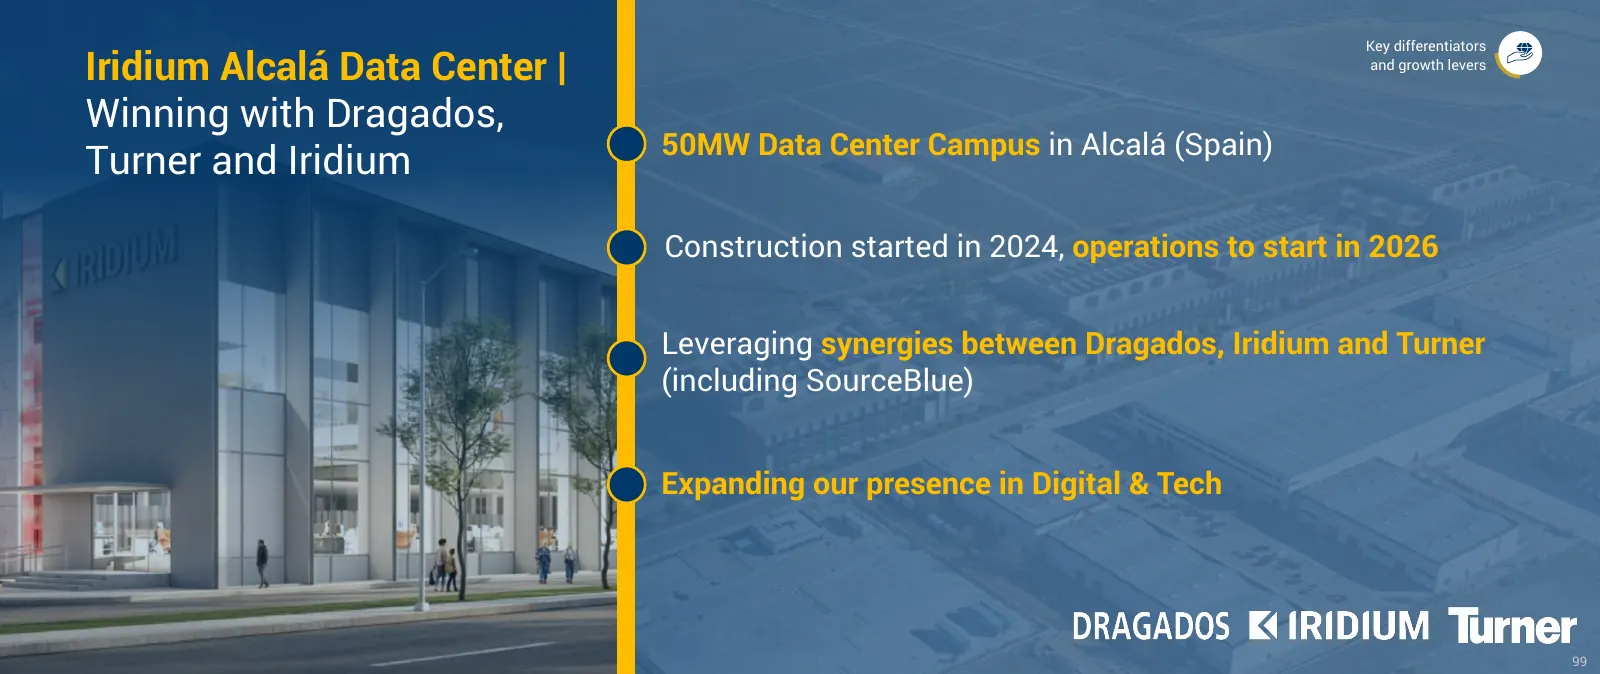
Slide 124: Iridium Alcalá Data Center
Key differentiators Iridium Alcalá Data Center | and growth levers Winning with Dragados, 50MW Data Center Campus in Alcalá (Spain) Turner and Iridium Construction started in 2024, operations to start in 2026 Leveraging synergies between Dragados, Iridium and Turner (including SourceBlue) Expanding
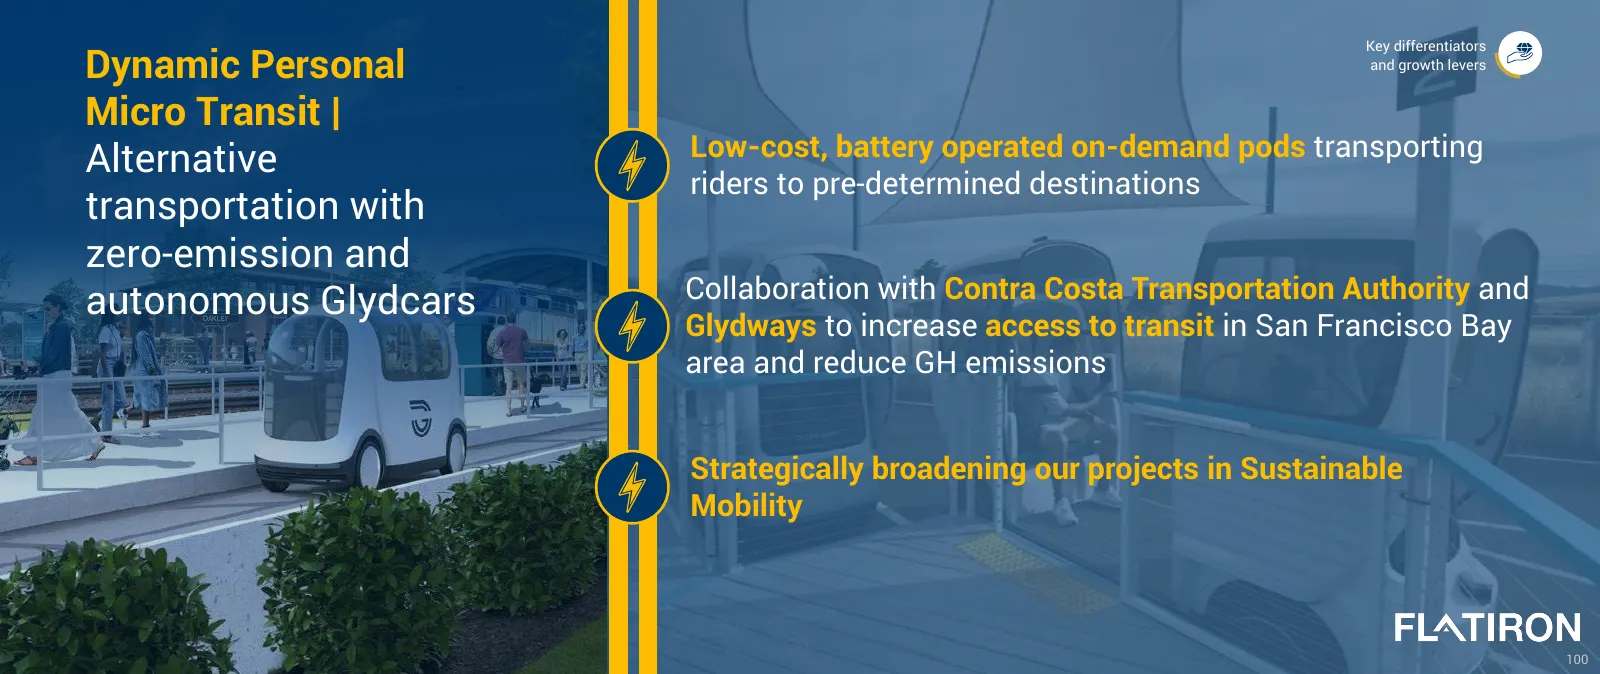
Slide 125: Dynamic Personal Micro Transit
Key differentiators Dynamic Personal and growth levers Micro Transit | Alternative Low-cost, battery operated on-demand pods transporting riders to pre-determined destinations transportation with zero-emission and autonomous Glydcars Collaboration with Contra Costa Transportation Authority and Glydw
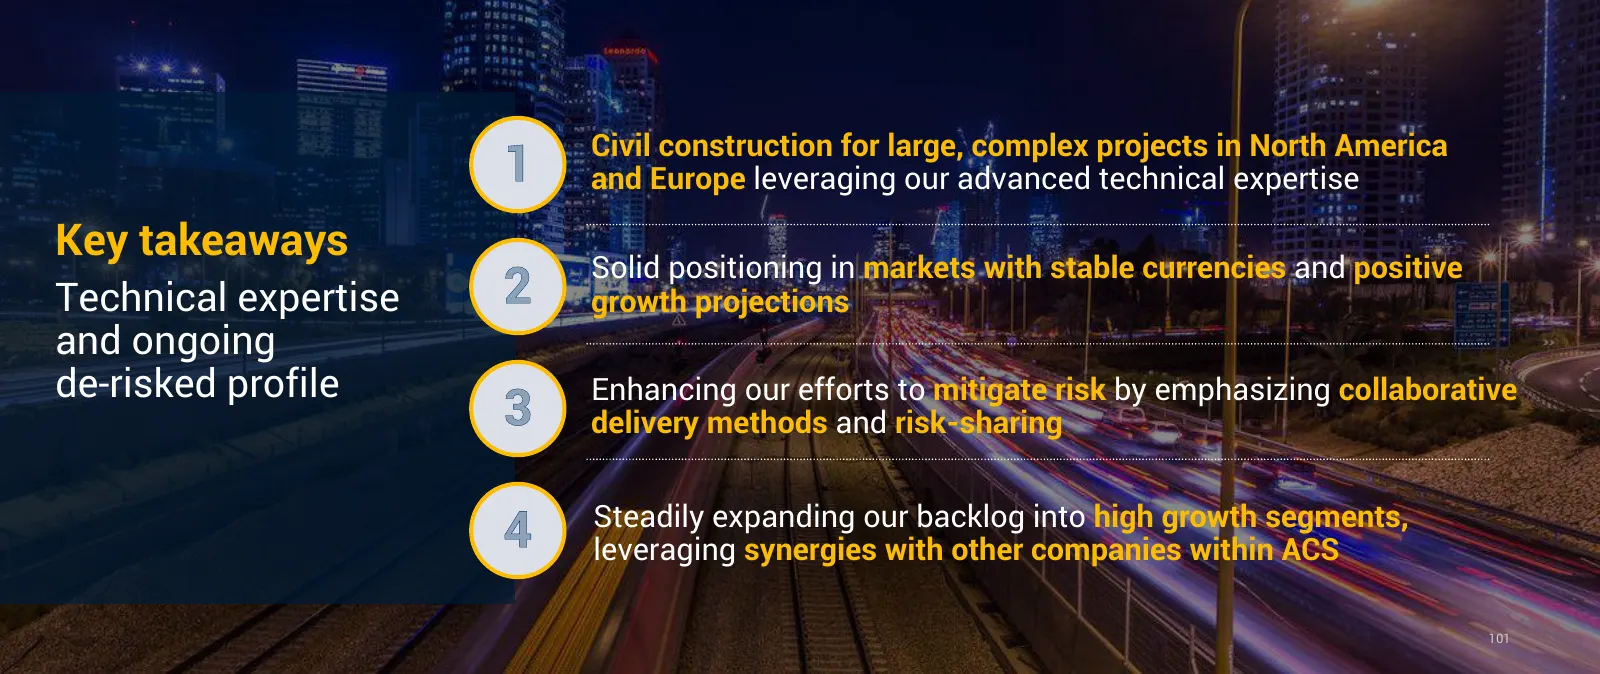
Slide 126: Key takeaways
Civil construction for large, complex projects in North America 1 and Europe leveraging our advanced technical expertise Key takeaways Solid positioning in markets with stable currencies and positive Technical expertise 2 growth projections and ongoing de-risked profile Enhancing our efforts to miti
Slide 127: ESG
Capital Markets Day ESG 17th April 2024 102
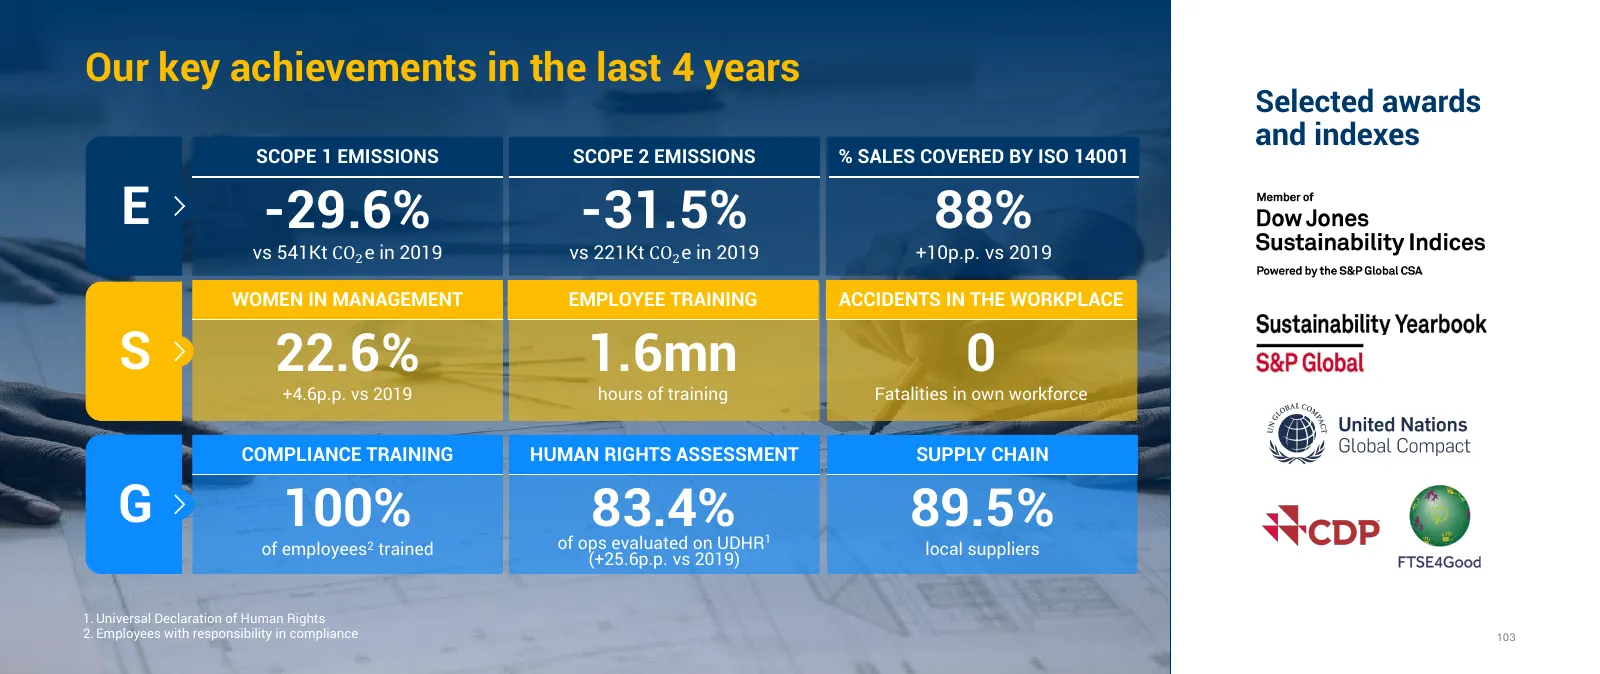
Slide 128: Our key achievements in the last years
Our key achievements in the last 4 years Selected awards and indexes SCOPE 1 EMISSIONS SCOPE 2 EMISSIONS % SALES COVERED BY ISO 14001 E -29.6% -31.5% 88% vs 541Kt CO2 e in 2019 vs 221Kt CO2 e in 2019 +10p.p. vs 2019 WOMEN IN MANAGEMENT EMPLOYEE TRAINING ACCIDENTS IN THE WORKPLACE S 22.6% 1.6mn 0 +4.
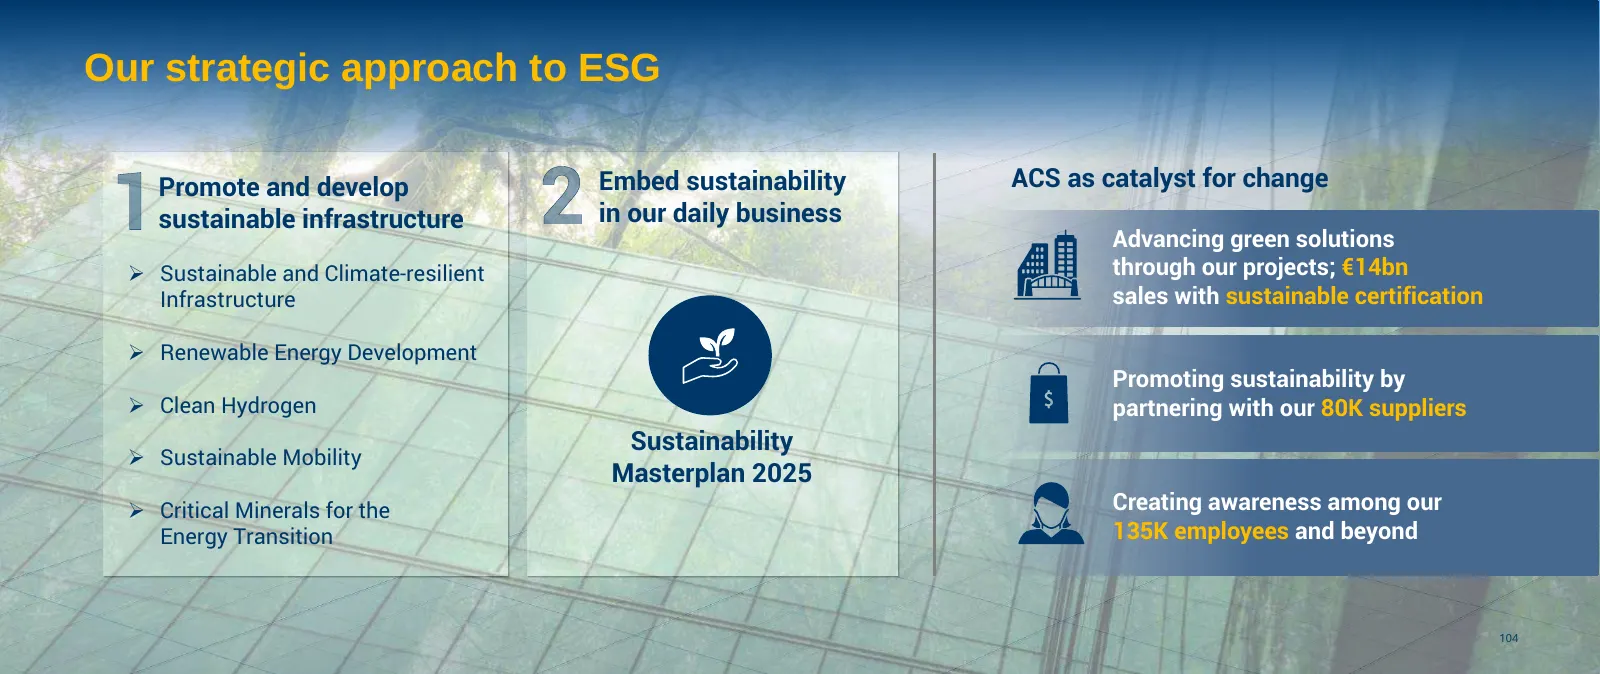
Slide 129: Our strategic approach to ESG
Our strategic approach to ESG 1 Promote and develop sustainable infrastructure 2 Embed sustainability in our daily business ACS as catalyst for change Advancing green solutions ➢ Sustainable and Climate-resilient through our projects; €14bn Infrastructure sales with sustainable certification ➢ Renew
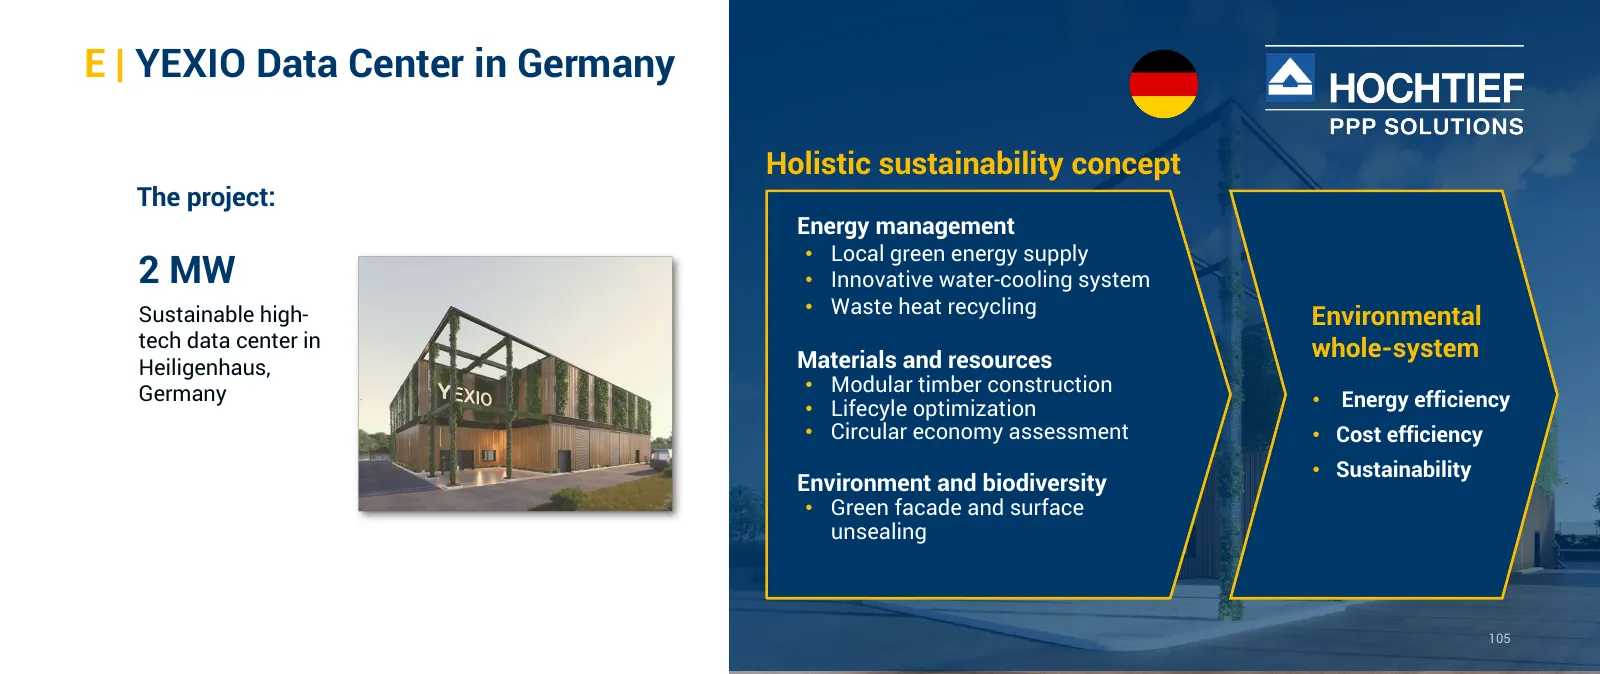
Slide 130: E: YEXIO Data Center in Germany
E | YEXIO Data Center in Germany Holistic sustainability concept The project: Energy management • Local green energy supply 2 MW • Innovative water-cooling system Sustainable high- • Waste heat recycling Environmental tech data center in whole-system Heiligenhaus, Materials and resources Germany • M
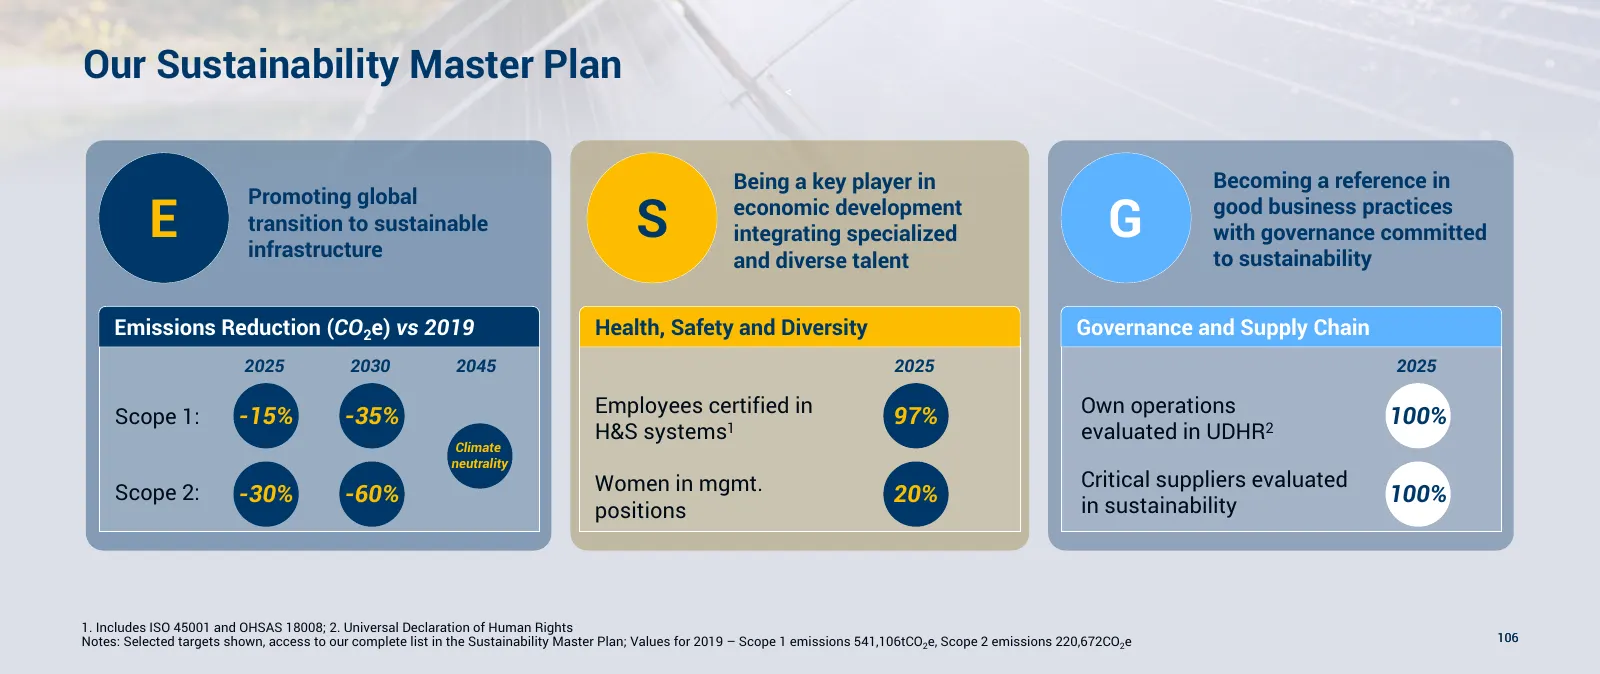
Slide 131: Our Sustainability Master Plan
Our Sustainability Master Plan < Being a key player in Becoming a reference in Promoting global E transition to sustainable infrastructure S economic development integrating specialized G good business practices with governance committed and diverse talent to sustainability Emissions Reduction (CO2e
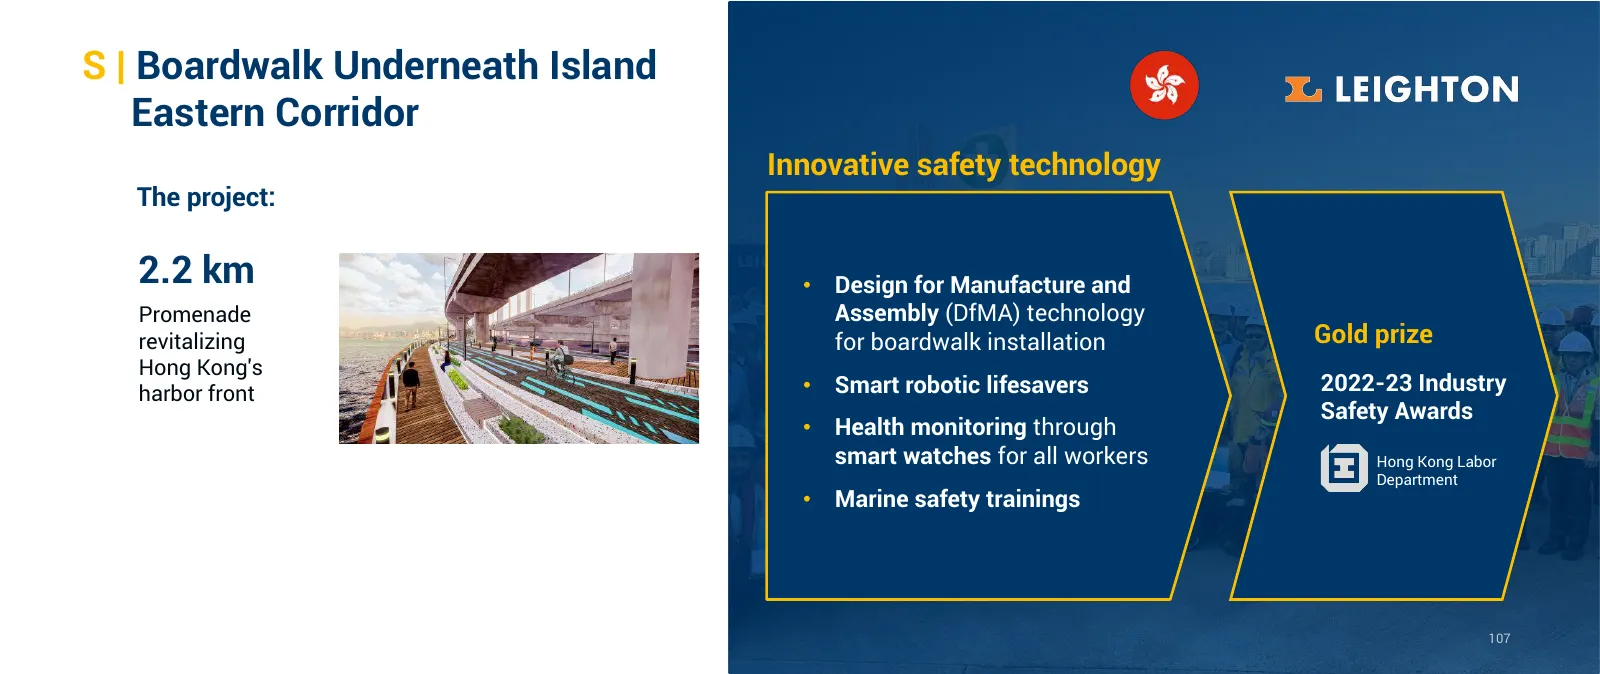
Slide 132: S: Boardwalk Underneath Island Eastern Corridor
S | Boardwalk Underneath Island Eastern Corridor Innovative safety technology The project: 2.2 km • Design for Manufacture and Promenade Assembly (DfMA) technology revitalizing for boardwalk installation Gold prize Hong Kong's harbor front • Smart robotic lifesavers 2022-23 Industry Safety Awards •
Slide 133: Financial Review
Capital Markets Day Financial Review 17th April 2024 108
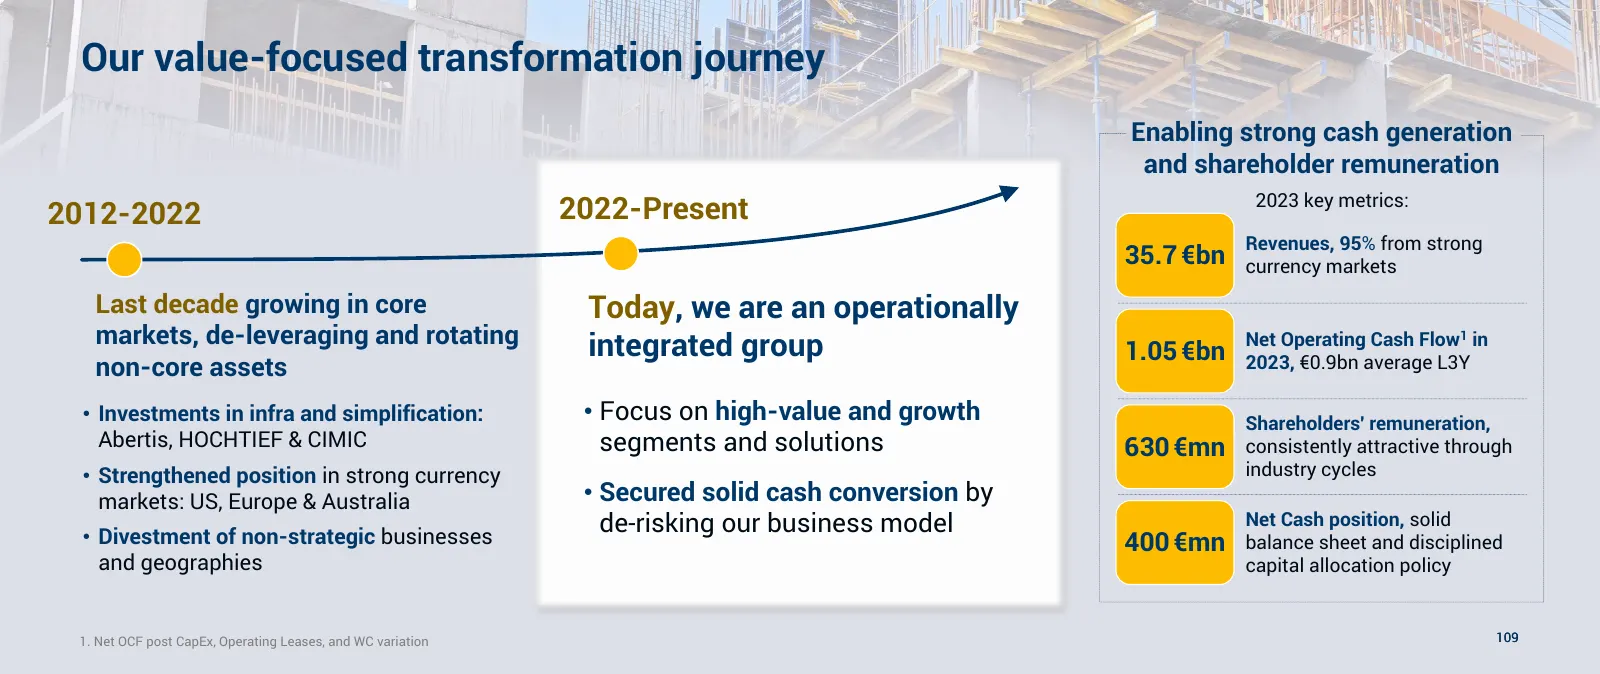
Slide 134: Our value-focused transformation journey
Our value-focused transformation journey Enabling strong cash generation and shareholder remuneration 2023 key metrics: 2012-2022 2022-Present Revenues, 95% from strong 35.7 €bn currency markets Last decade growing in core Today, we are an operationally markets, de-leveraging and rotating integrated
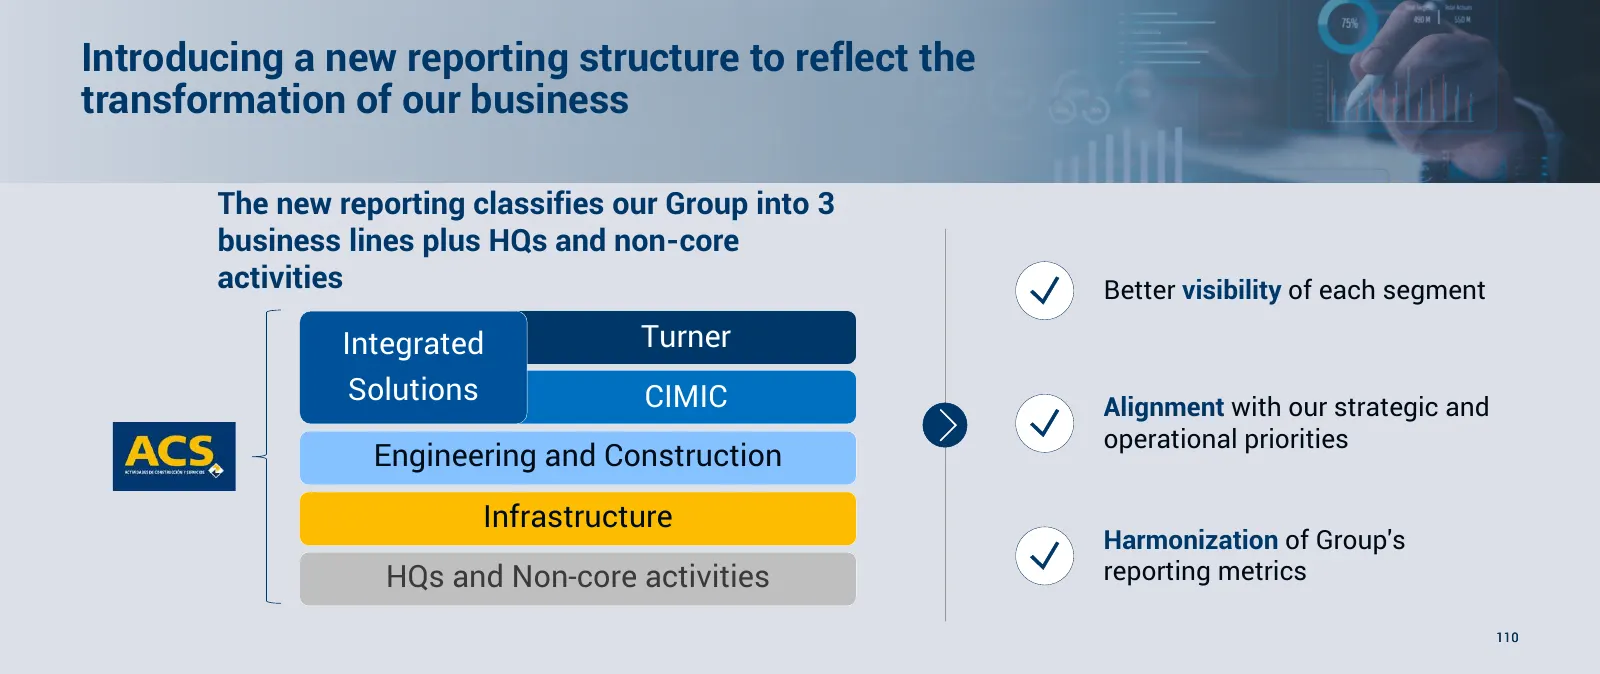
Slide 135: New reporting structure
Introducing a new reporting structure to reflect the transformation of our business The new reporting classifies our Group into 3 business lines plus HQs and non-core activities Better visibility of each segment Integrated Turner Solutions CIMIC Alignment with our strategic and operational prioritie
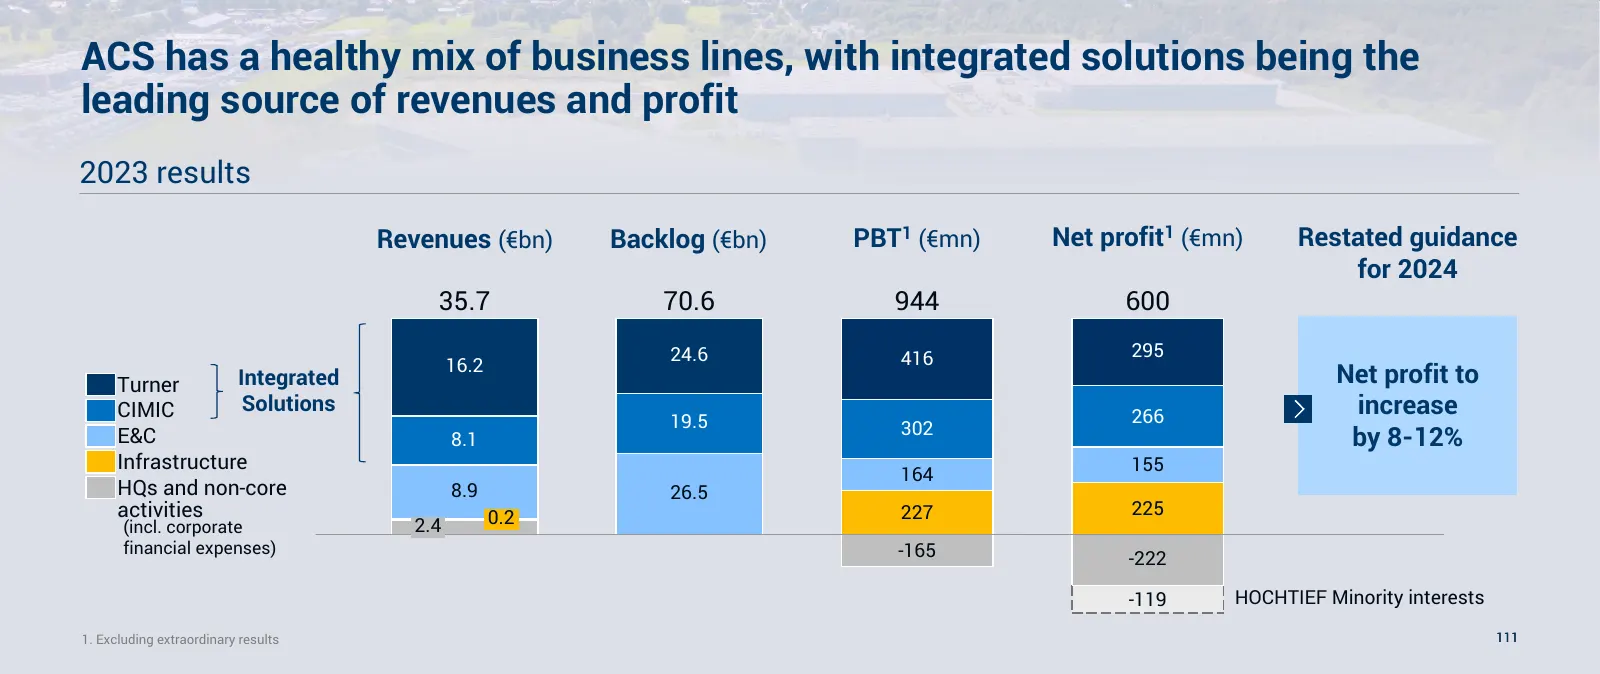
Slide 136: Healthy mix of business lines
ACS has a healthy mix of business lines, with integrated solutions being the leading source of revenues and profit 2023 results Revenues (€bn) Backlog (€bn) PBT (€mn) 1 Net profit (€mn) 1 Restated guidance for 2024 35.7 70.6 944 600 24.6 416 295 16.2 Turner Integrated Net profit to CIMIC Solutions 2
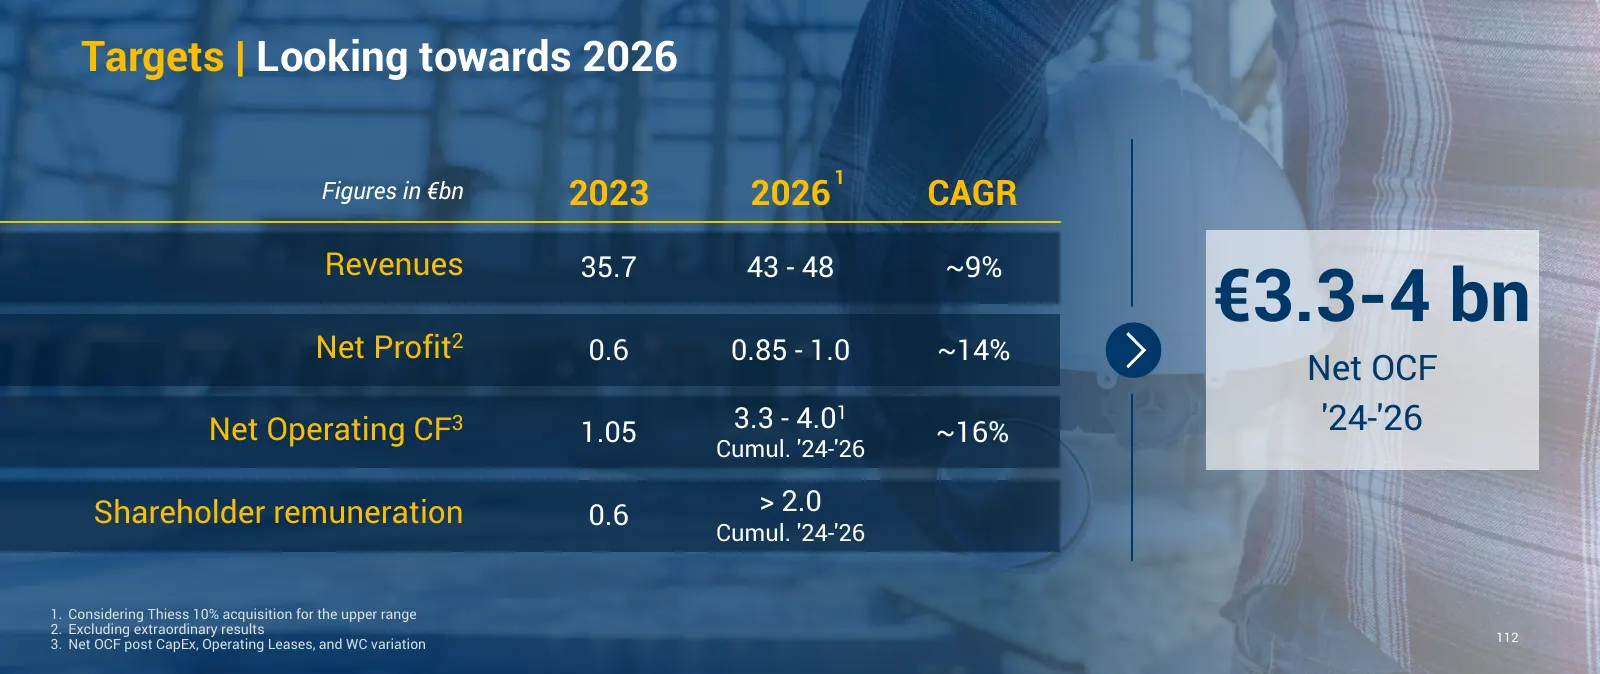
Slide 137: Targets: Looking towards 2026
Targets | Looking towards 2026 1 Figures in €bn 2023 2026 CAGR Revenues 35.7 43 - 48 ~9% €3.3-4 bn Net Profit2 0.6 0.85 - 1.0 ~14% Net OCF Net Operating CF3 1.05 3.3 - 4.0 1 ~16% '24-'26 Cumul. '24-'26 Shareholder remuneration 0.6 > 2.0 Cumul. '24-'26 1. Considering Thiess 10% acquisition for the up
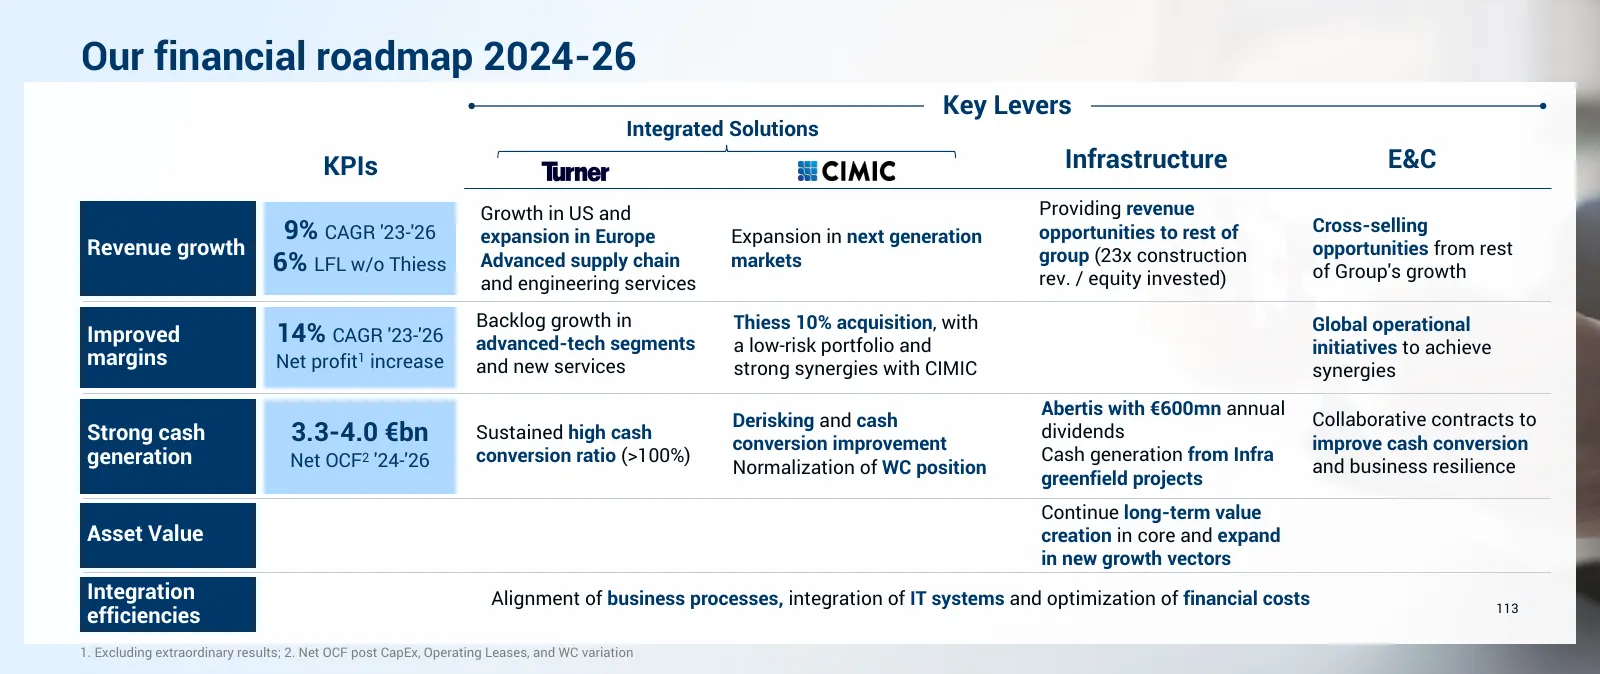
Slide 138: Our financial roadmap 2024-26
Our financial roadmap 2024-26 Key Levers Integrated Solutions KPIs Infrastructure E&C Growth in US and Providing revenue 9% CAGR '23-'26 opportunities to rest of Cross-selling expansion in Europe Expansion in next generation Revenue growth group (23x construction opportunities from rest 6% LFL w/o T
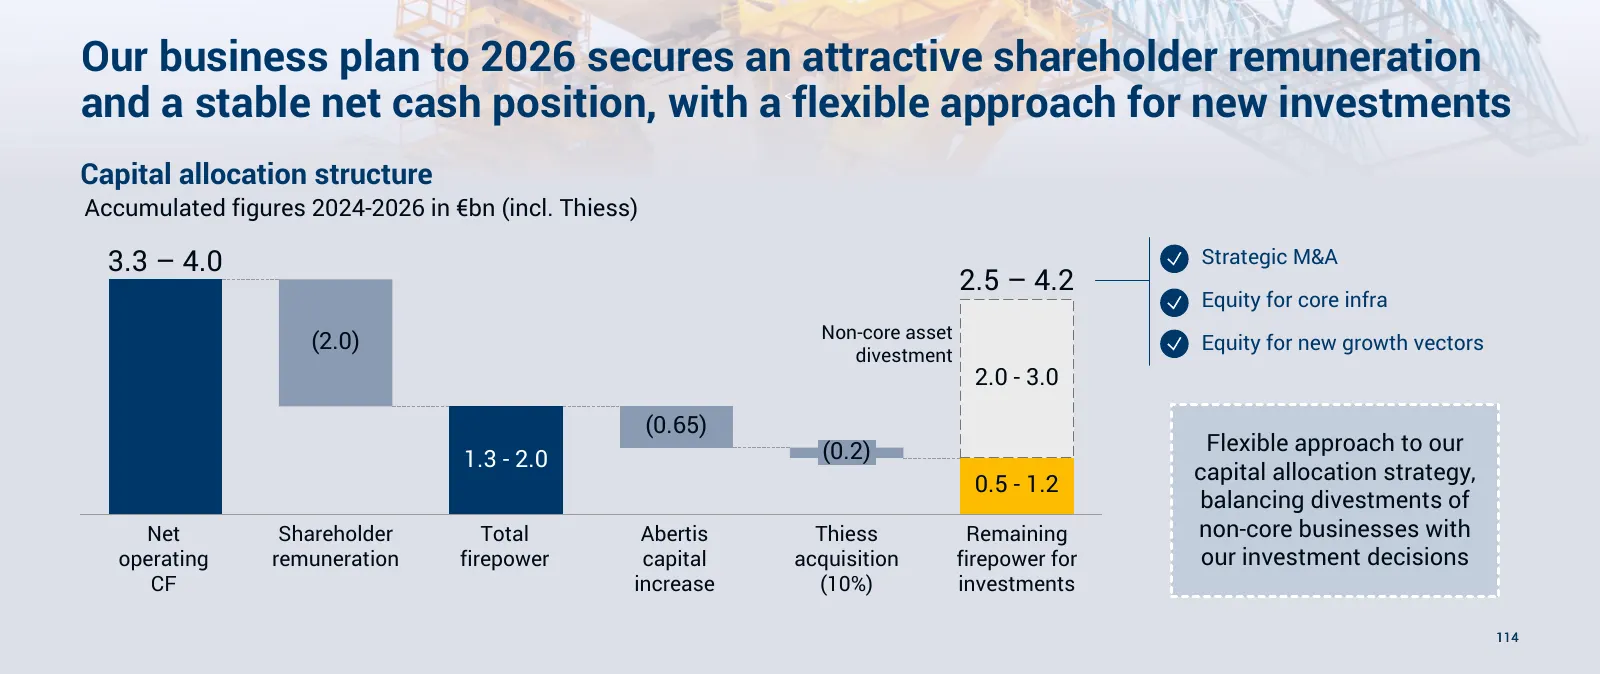
Slide 139: Business plan to 2026: capital allocation
Our business plan to 2026 secures an attractive shareholder remuneration and a stable net cash position, with a flexible approach for new investments < Capital allocation structure Accumulated figures 2024-2026 in €bn (incl. Thiess) 3.3 – 4.0 • Strategic M&A 2.5 – 4.2 • Equity for core infra Non-cor
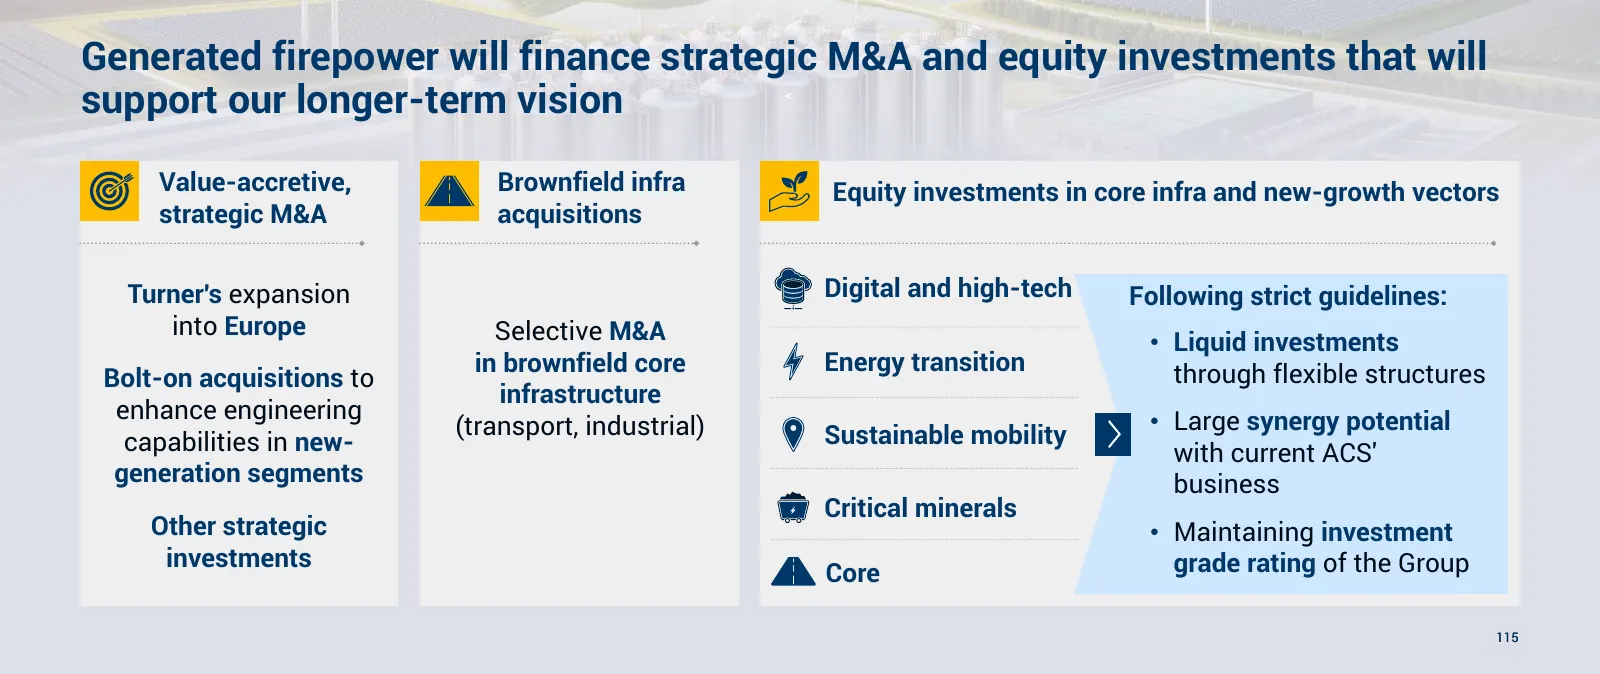
Slide 140: Firepower to finance strategic M&A and equity investments
Generated firepower will finance strategic M&A and equity investments that will support our longer-term vision < Value-accretive, Brownfield infra Equity investments in core infra and new-growth vectors strategic M&A acquisitions Turner's expansion Digital and high-tech Following strict guidelines:
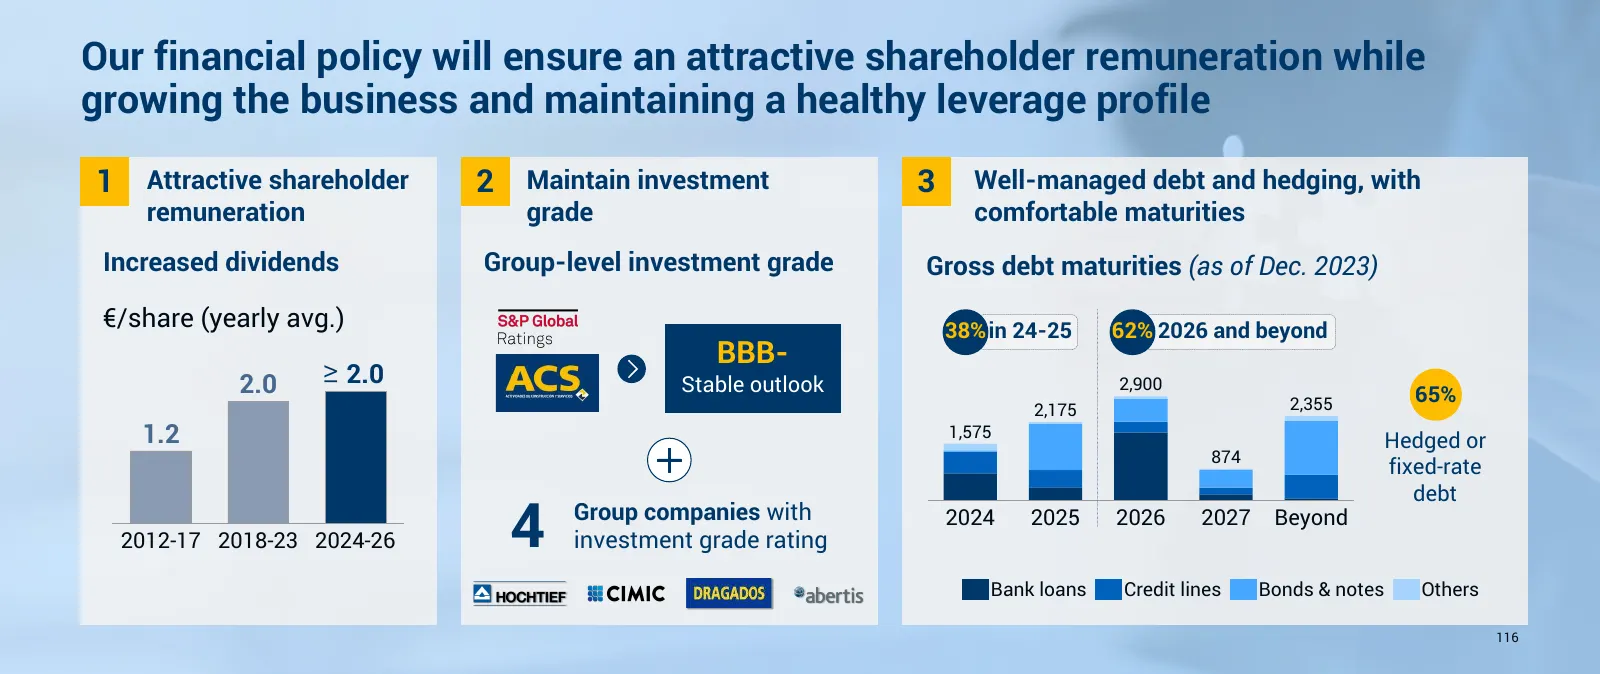
Slide 141: Financial policy: shareholder remuneration and healthy leverage
Our financial policy will ensure an attractive shareholder remuneration while growing the business and maintaining a healthy leverage profile 1 Attractive shareholder 2 Maintain investment 3 Well-managed debt and hedging, with remuneration grade comfortable maturities Increased dividends Group-level
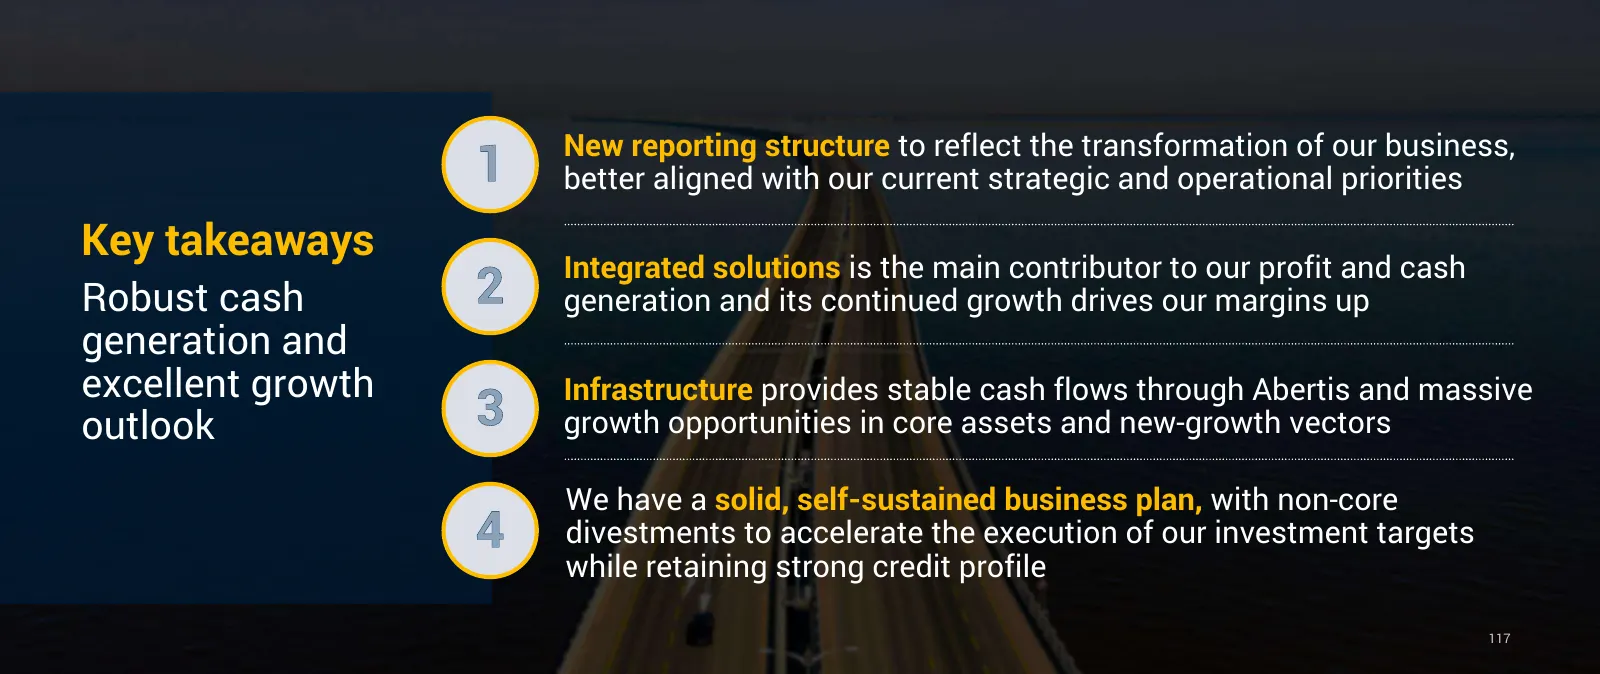
Slide 142: Key takeaways
New reporting structure to reflect the transformation of our business, 1 better aligned with our current strategic and operational priorities Key takeaways Integrated solutions is the main contributor to our profit and cash Robust cash 2 generation and its continued growth drives our margins up gene
Slide 143: Closing Remarks
Capital Markets Day Closing Remarks 17th April 2024 118
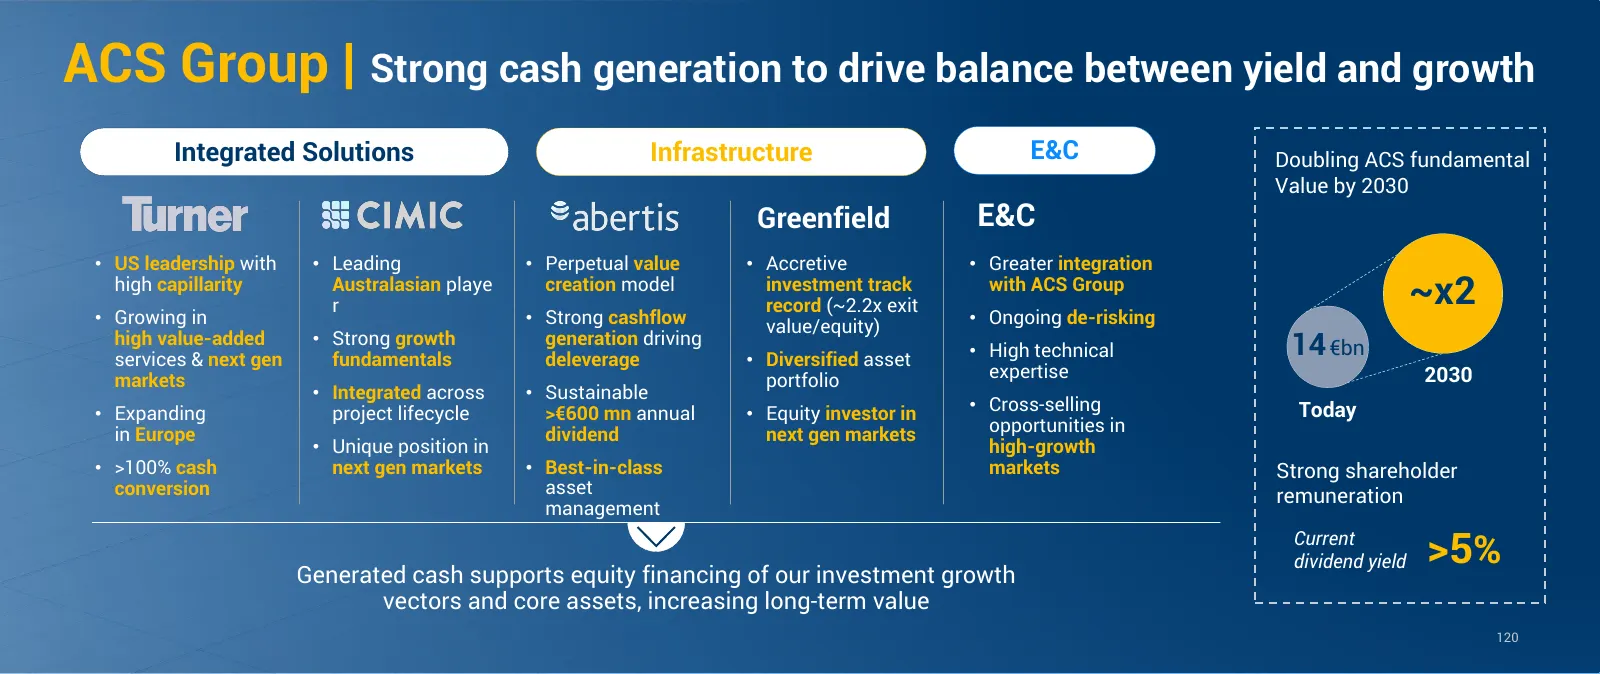
Slide 144: ACS Group: balance between yield and growth
ACS Group | Strong cash generation to drive balance between yield and growth Integrated Solutions Infrastructure E&C Doubling ACS fundamental Value by 2030 Greenfield E&C • US leadership with • Leading • Perpetual value • Accretive • Greater integration high capillarity Australasian playe r creation
Slide 145: Q&A
Capital Markets Day Q&A 17th April 2024 121

Slide 146: Actividades de Construcción y Servicios
ACTIVIDADES DE CONSTRUCCION Y SERVICIOS eo
Source: company website
More decks from ACS, Actividades de Construccion y Servicios SA
 Investor Day (November 2026)177 slides · Nov 12, 2026
 Investor Day (November 2026)104 slides · Nov 12, 2026
 Investor Day (November 2026)14 slides · Nov 12, 2026
 Investor Day (November 2026)17 slides · Nov 12, 2026
 Investor Day (November 2026)13 slides · Nov 12, 2026
 Investor Day (November 2026)17 slides · Nov 12, 2026
All 139 ACS, Actividades de Construccion y Servicios SA decks