Southern Union — Investor Presentation (February 2009)
14 slides from Southern Union's investor presentation, Feb 26, 2009
Slide 1: 2009 Financial Outlook
2009 Financial Outlook February 26, 2009 www.sug.com
Slide 2: Forward Looking Statements
Forward Looking Statements Forward-Looking Statements contained in this presentation that include company expectations or predictions di ti off th the ffuture t are fforward-looking d l ki g statements t t t iintended t d d tto b be covereddb by the safe harbor provisions of the Securities Act of 19
Slide 3: Company Facts
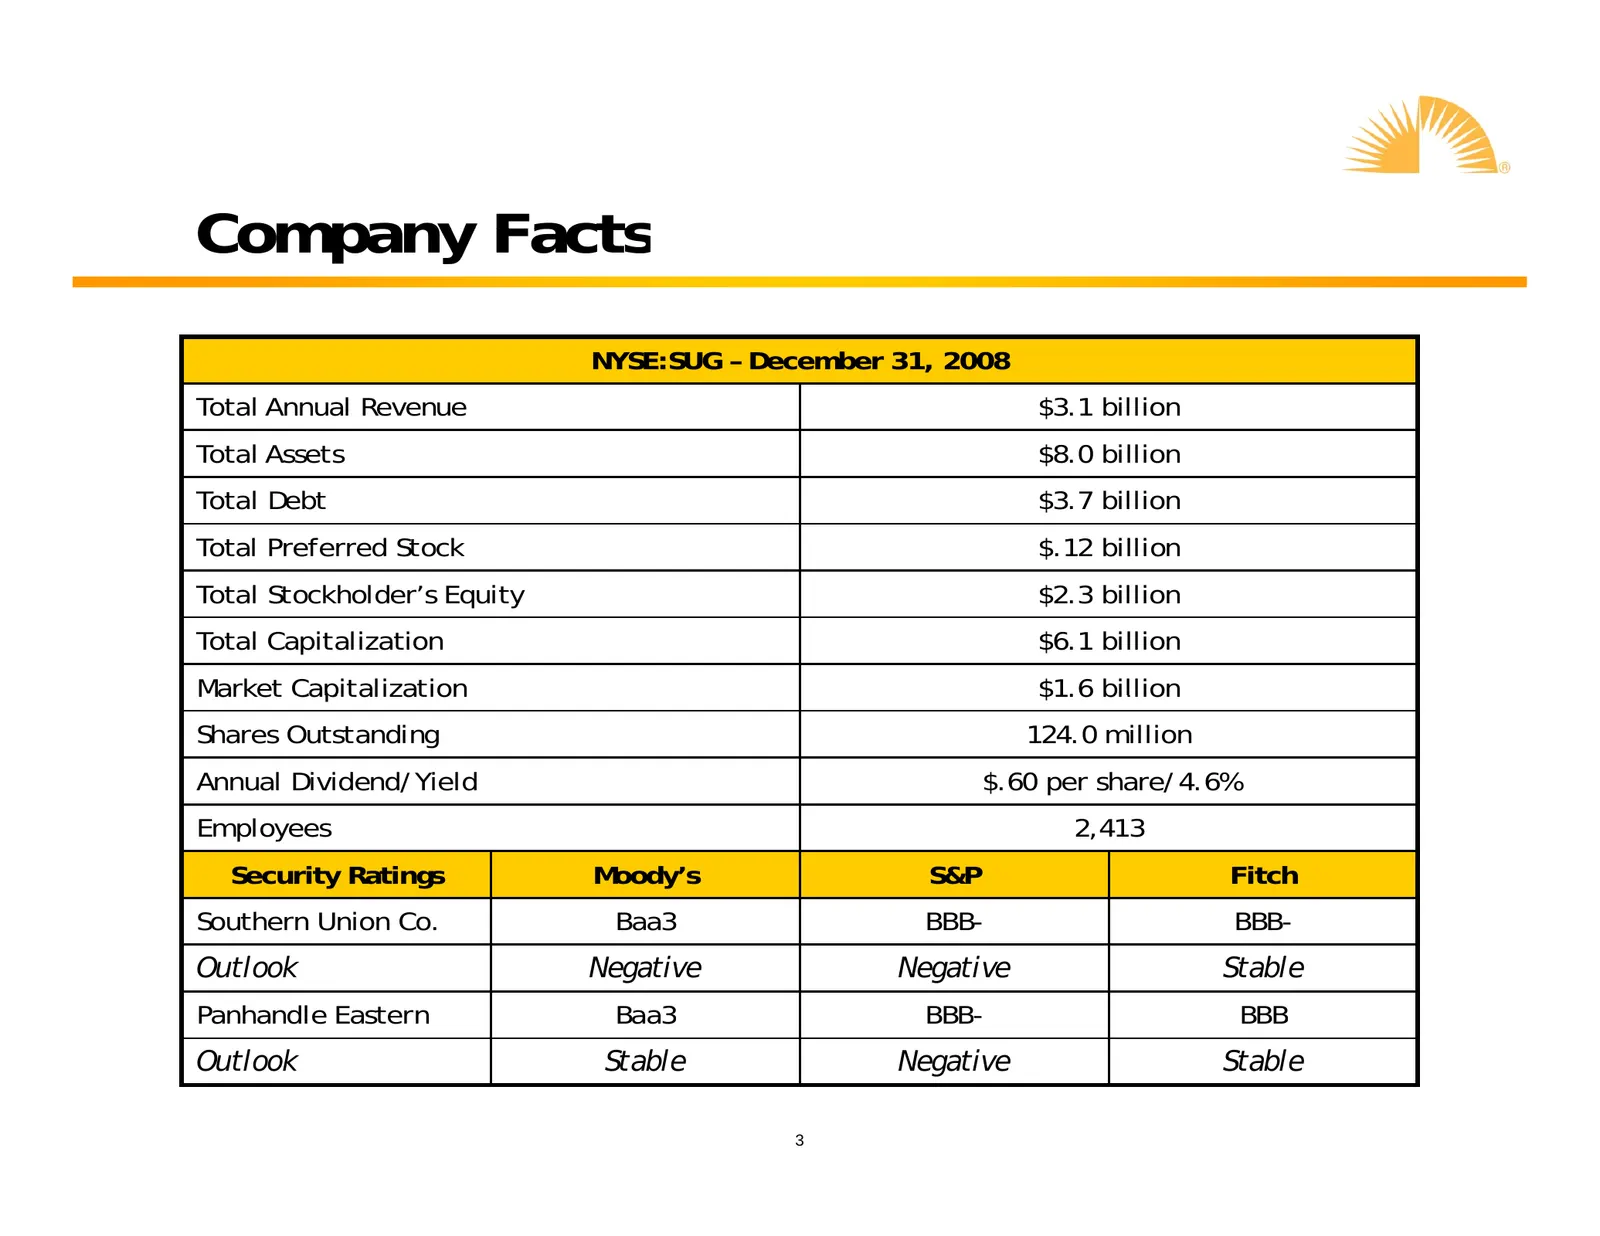
Company Facts NYSE:SUG – December 31, 2008 Total Annual Revenue $3.1 billion Total Assets $8.0 billion Total Debt $3.7 billion T t l Preferred Total P f d Stock St k $ 12 billi $.12 billion Total Stockholder’s Equity $2.3 billion Total Capitalization $6.1 billion Market Capitalization $1.6 billion S

Slide 4: 2009 Financial Outlook
2009 Financial Outlook EN
Slide 5: Adjusted EPS Outlook
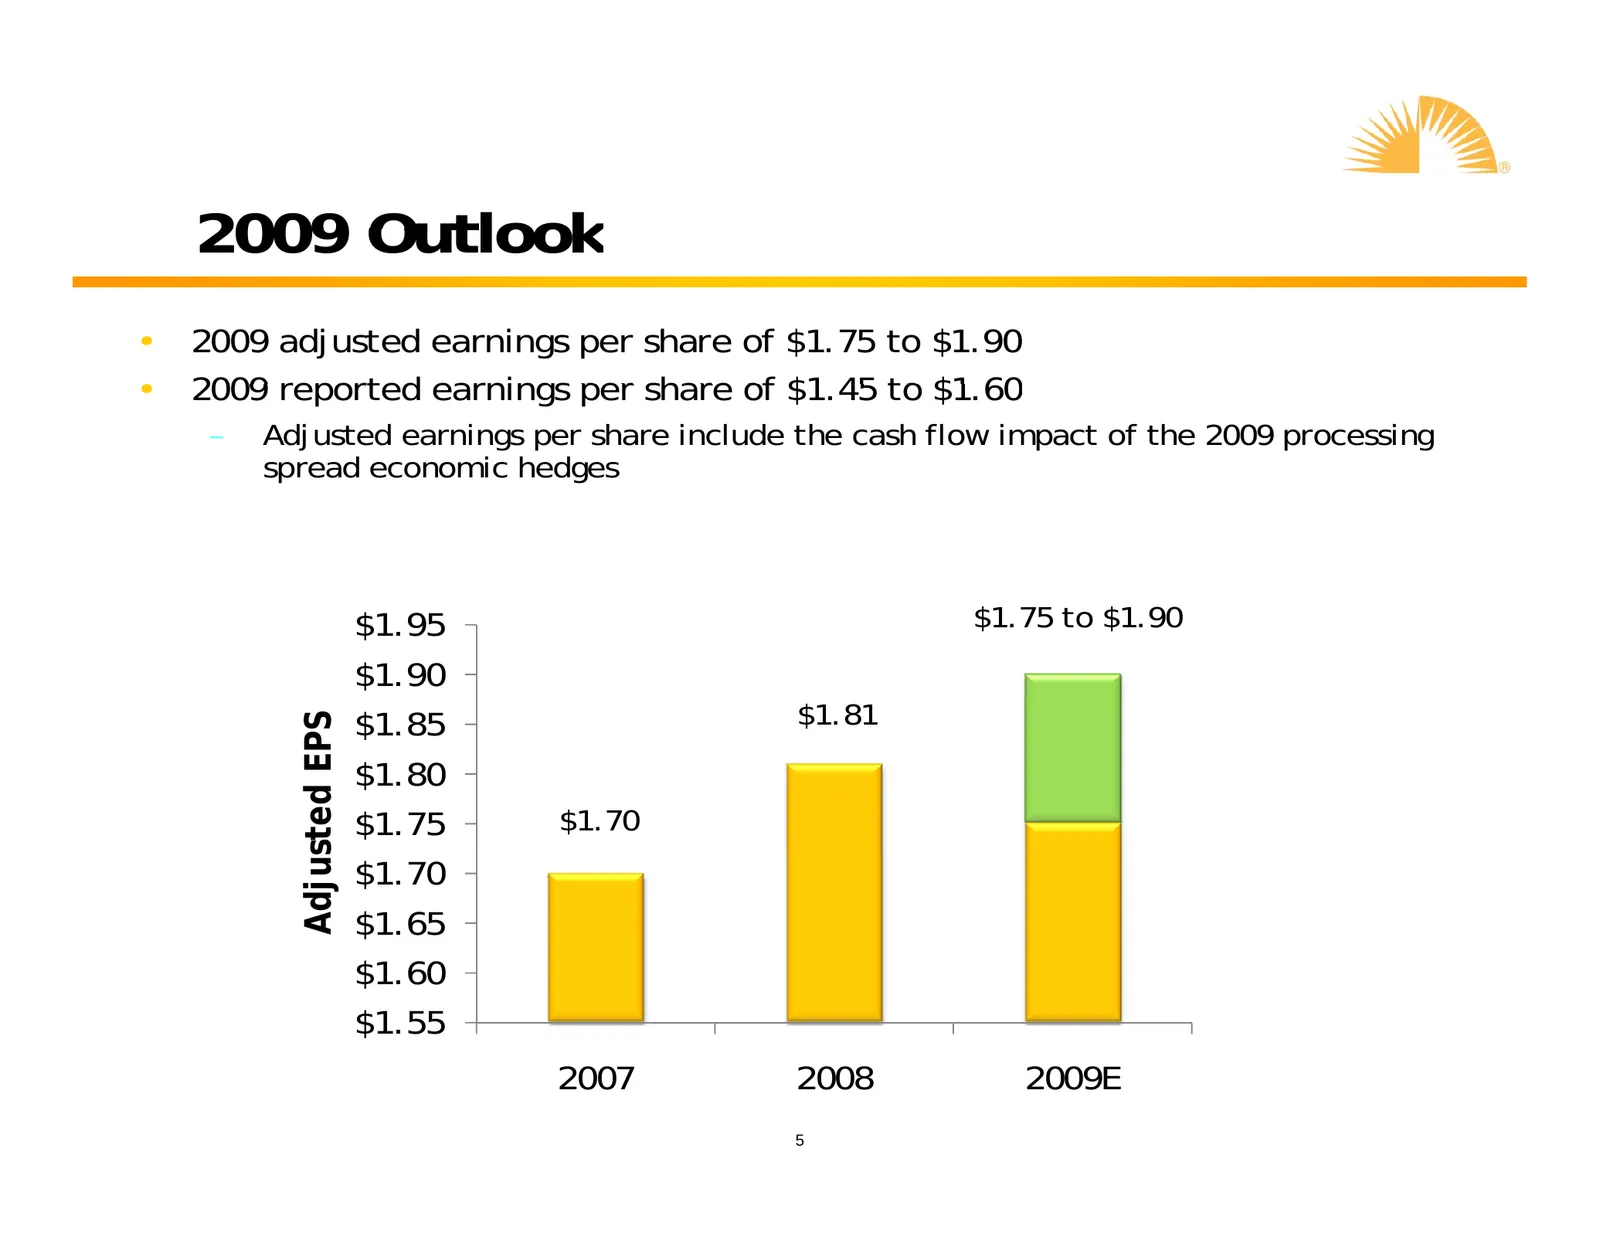
2009 Outlook • 2009 adjusted earnings per share of $1.75 to $1.90 • 2009 reported earnings per share of $1 $1.45 45 to $1 $1.60 60 – Adjusted earnings per share include the cash flow impact of the 2009 processing spread economic hedges $1.95 $1.75 to $1.90 $1.90 $1.85 $1.81 Adjussted EPS $1.80 $1.75
Slide 6: EPS Reconciliation
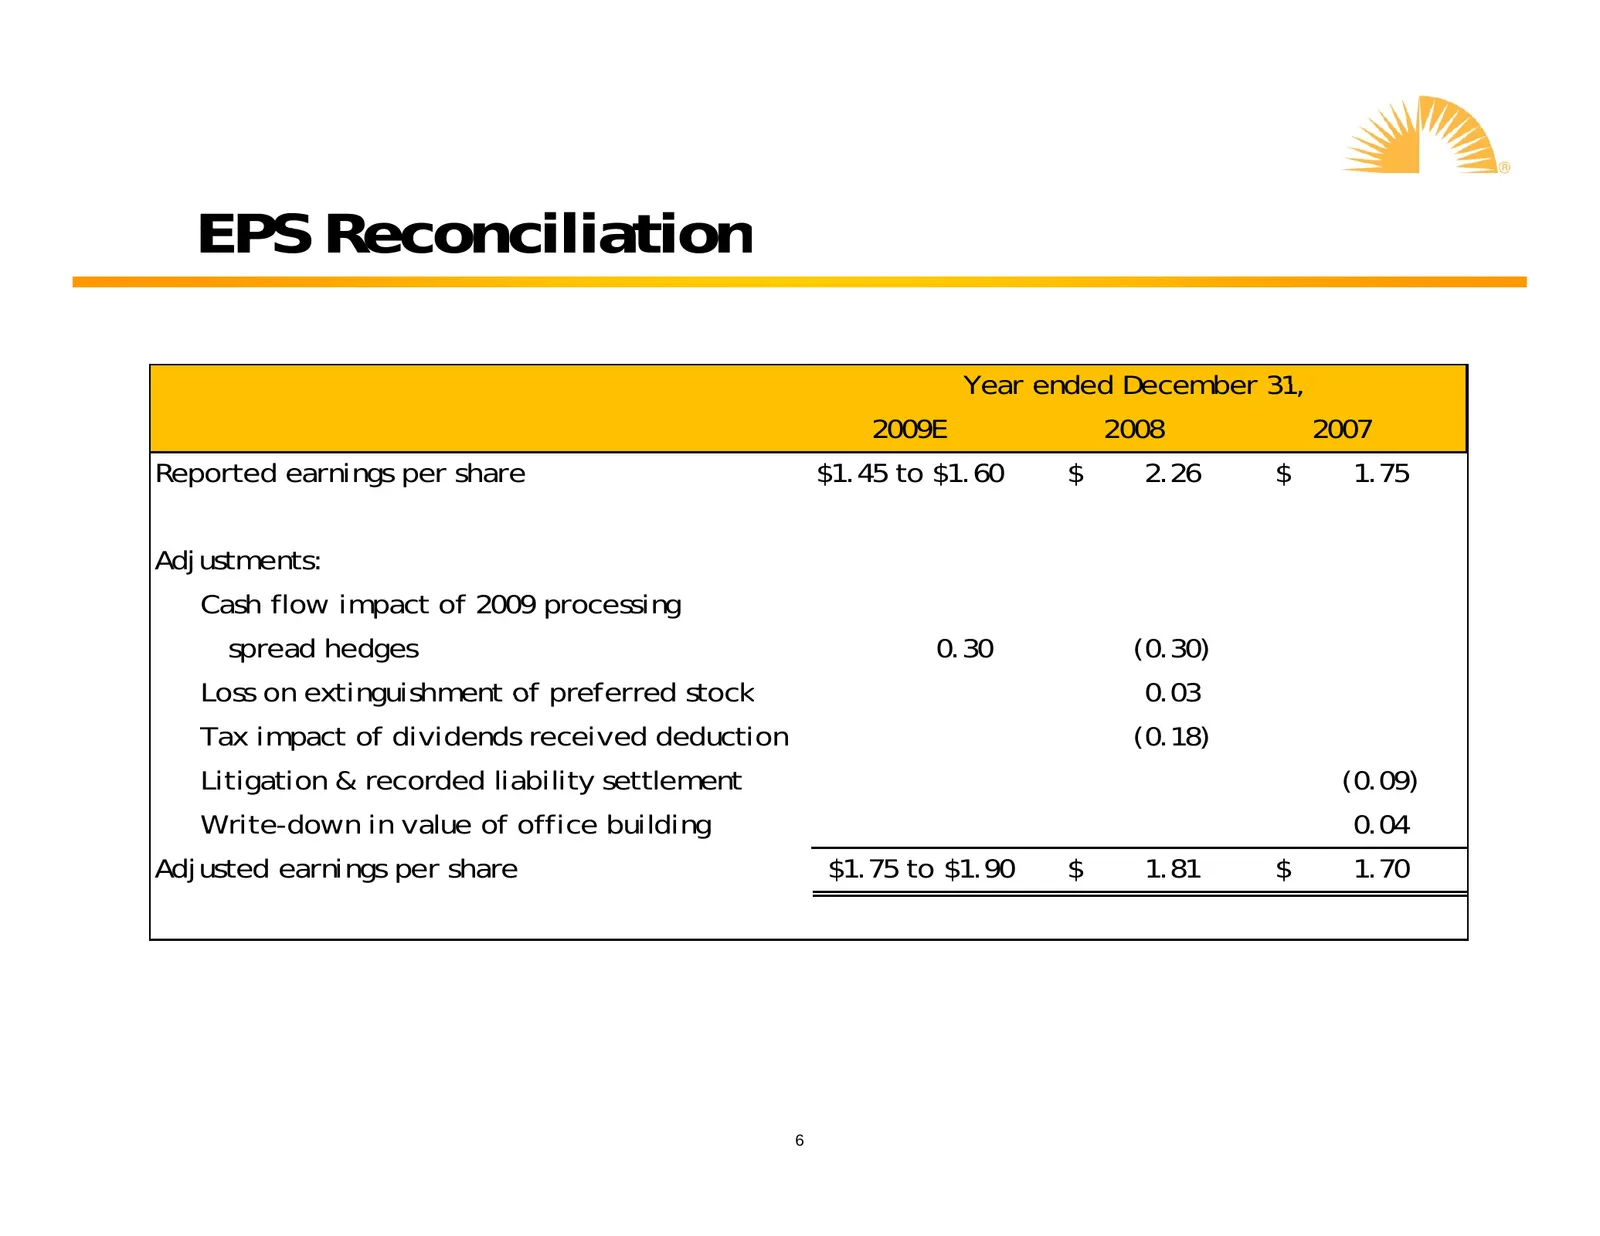
EPS Reconciliation Year ended December 31 31, 2009E 2008 2007 Reported earnings per share $1.45 to $1.60 $ 2.26 $ 1.75 Adjustments: Cash flow impact of 2009 processing spread hedges 0.30 (0.30) Loss on extinguishment of preferred stock 0 03 0.03 Tax impact of dividends received deduction (0.18) Liti
Slide 7: 2009 Consolidated Adjusted EBITDA
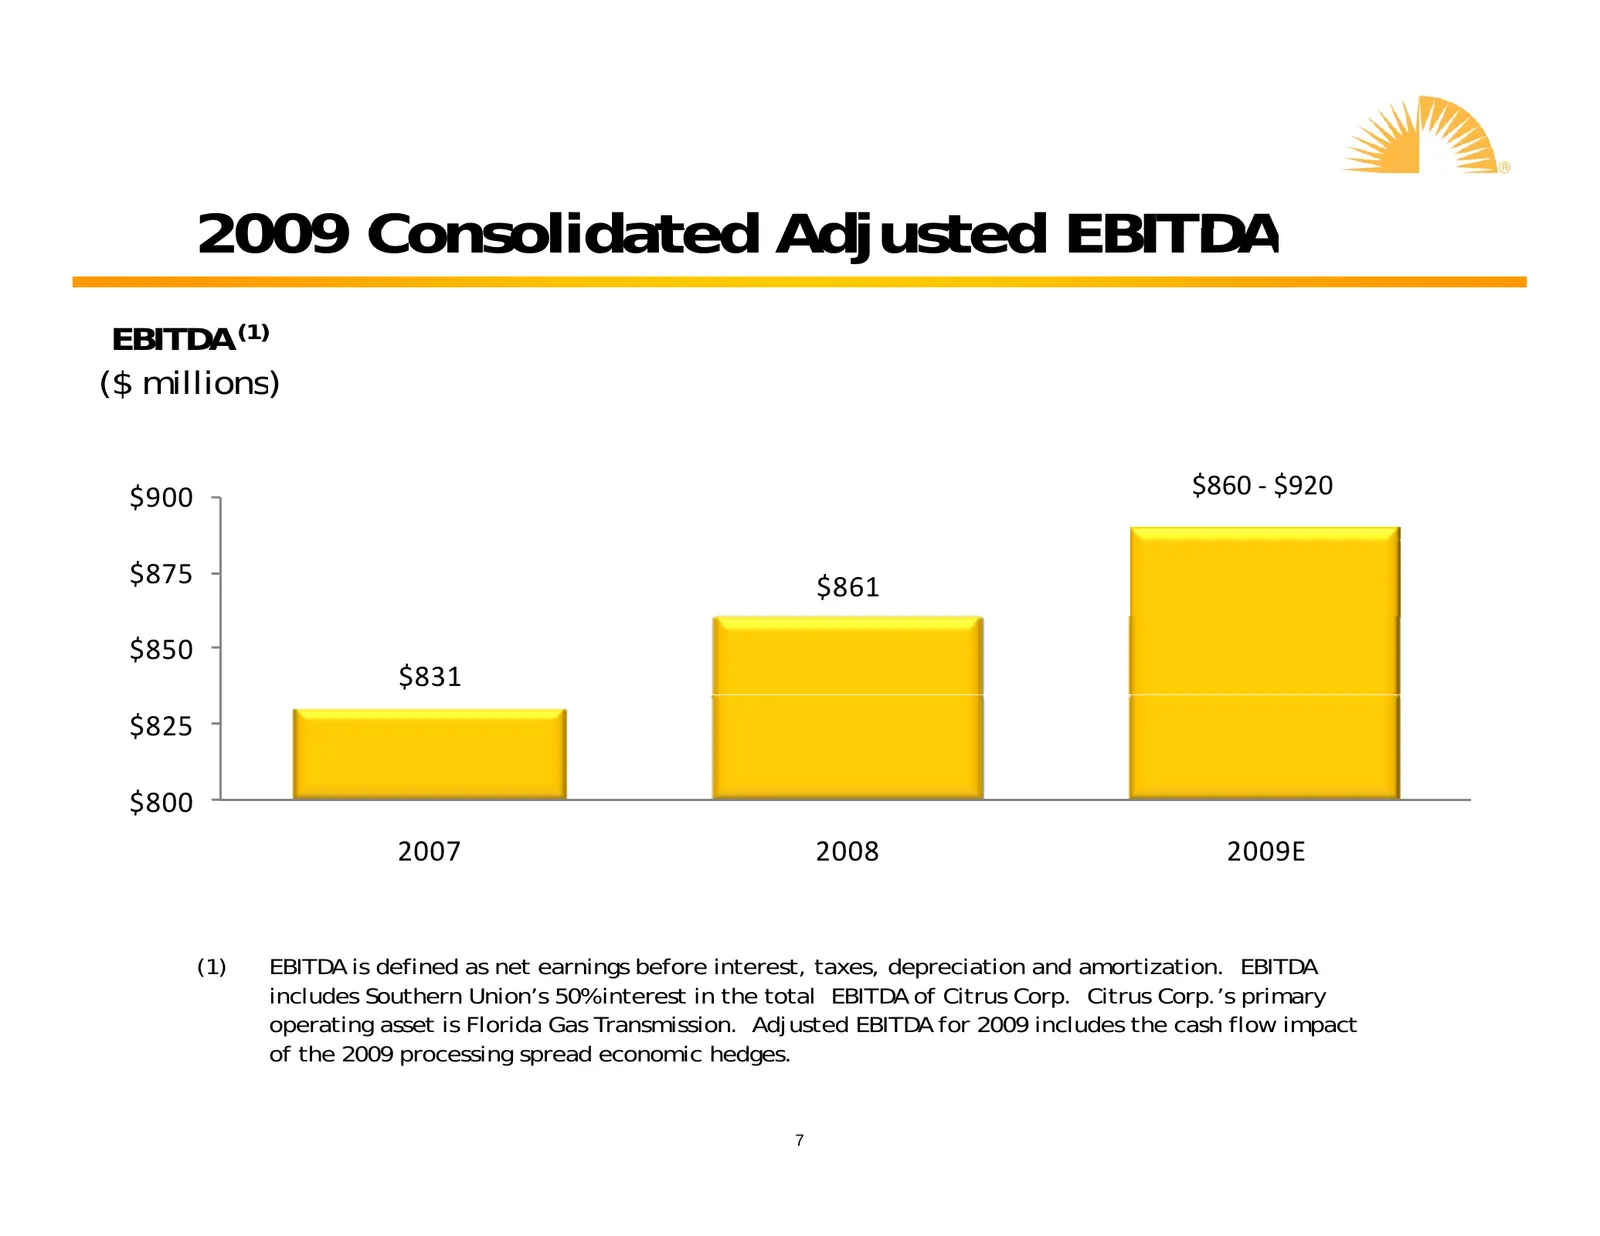
2009 Consolidated Adjusted EBITDA EBITDA (1) ($ millions) $900 $860 - $920 $875 $861 $850 $831 $825 $800 2007 2008 2009E (1) EBITDA is defined as net earnings before interest, taxes, depreciation and amortization. EBITDA includes Southern Union’s 50% interest in the total EBITDA of Citrus Corp. p Ci
Slide 8: 2009 Adjusted Segment EBITDA
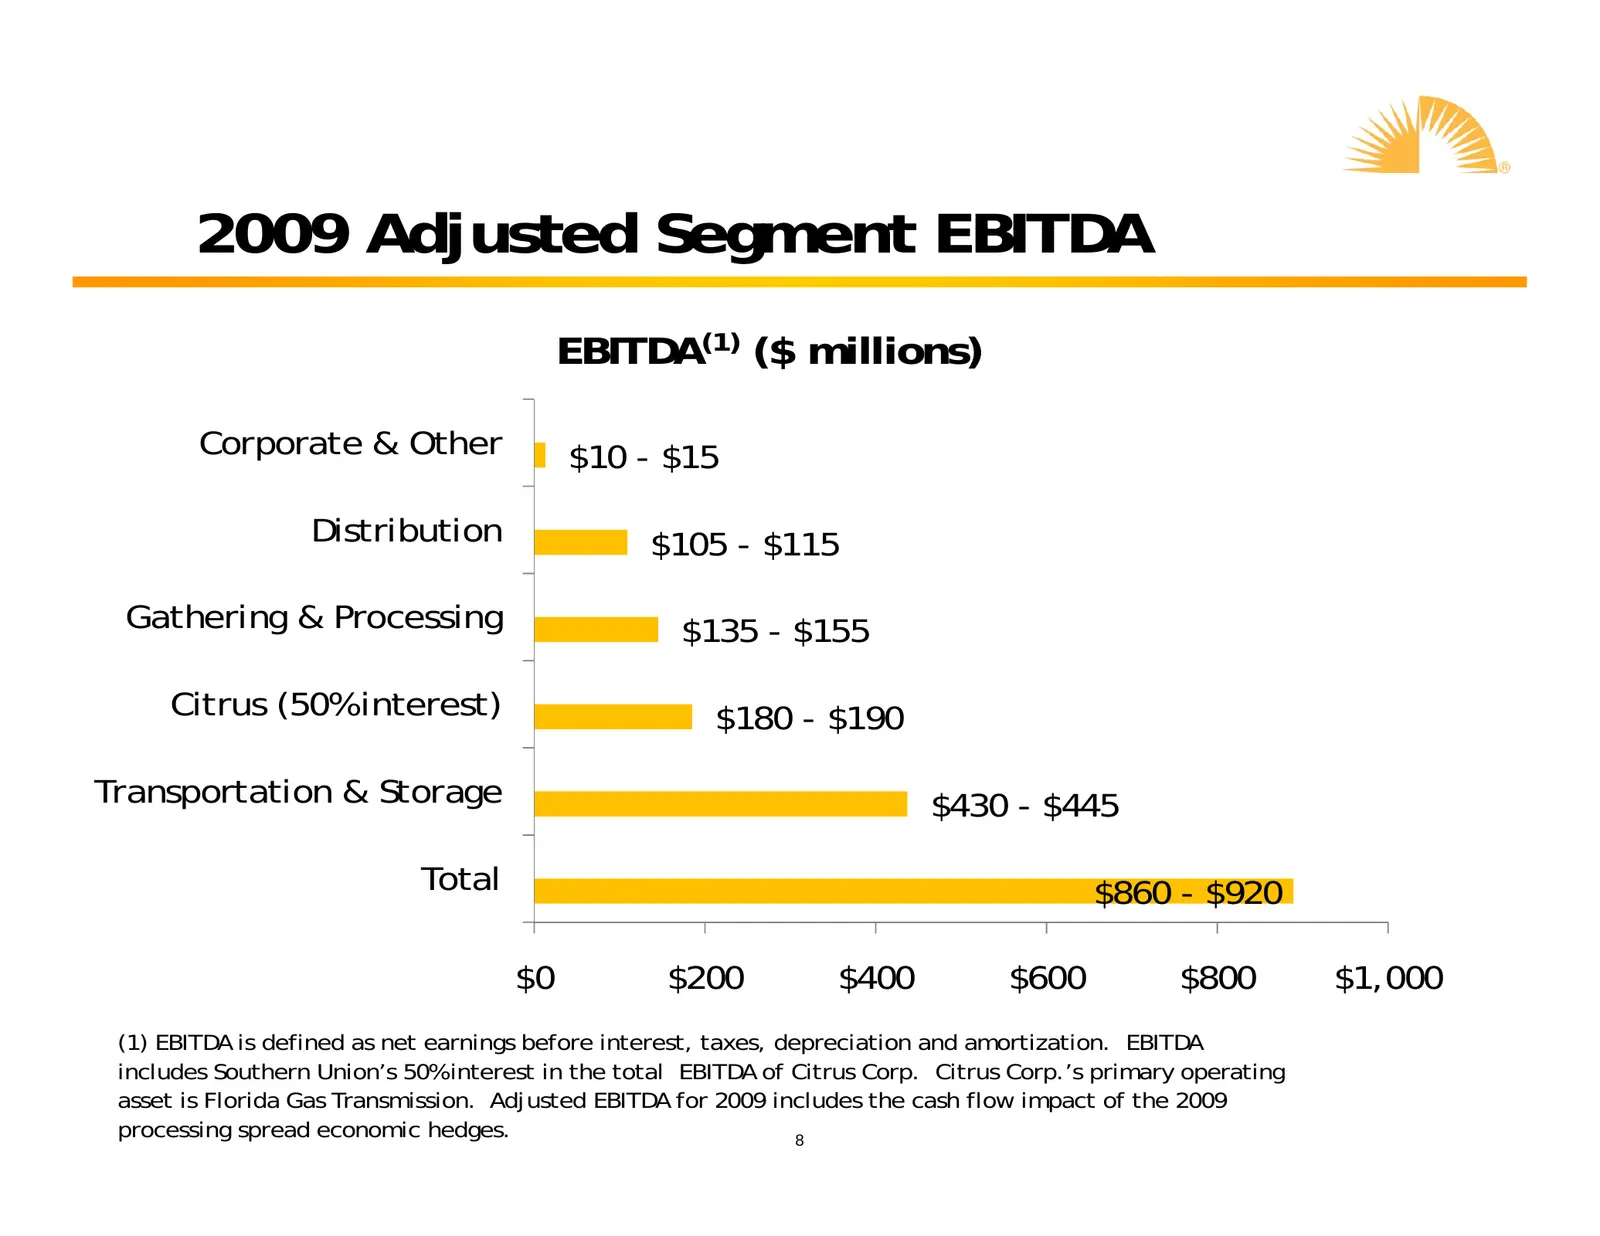
2009 Adjusted Segment EBITDA EBITDA(1) ($ millions) Corporate & Other $10 - $15 Distribution $105 - $115 Gathering & Processing $135 - $155 Cit Citrus (50% iinterest) t t) $180 - $190 Transportation & Storage $430 - $445 Total $860 - $920 $0 $200 $400 $600 $800 $1,000 (1) EBITDA is defined as net ea
Slide 9: Relative Segment EBITDA Contribution
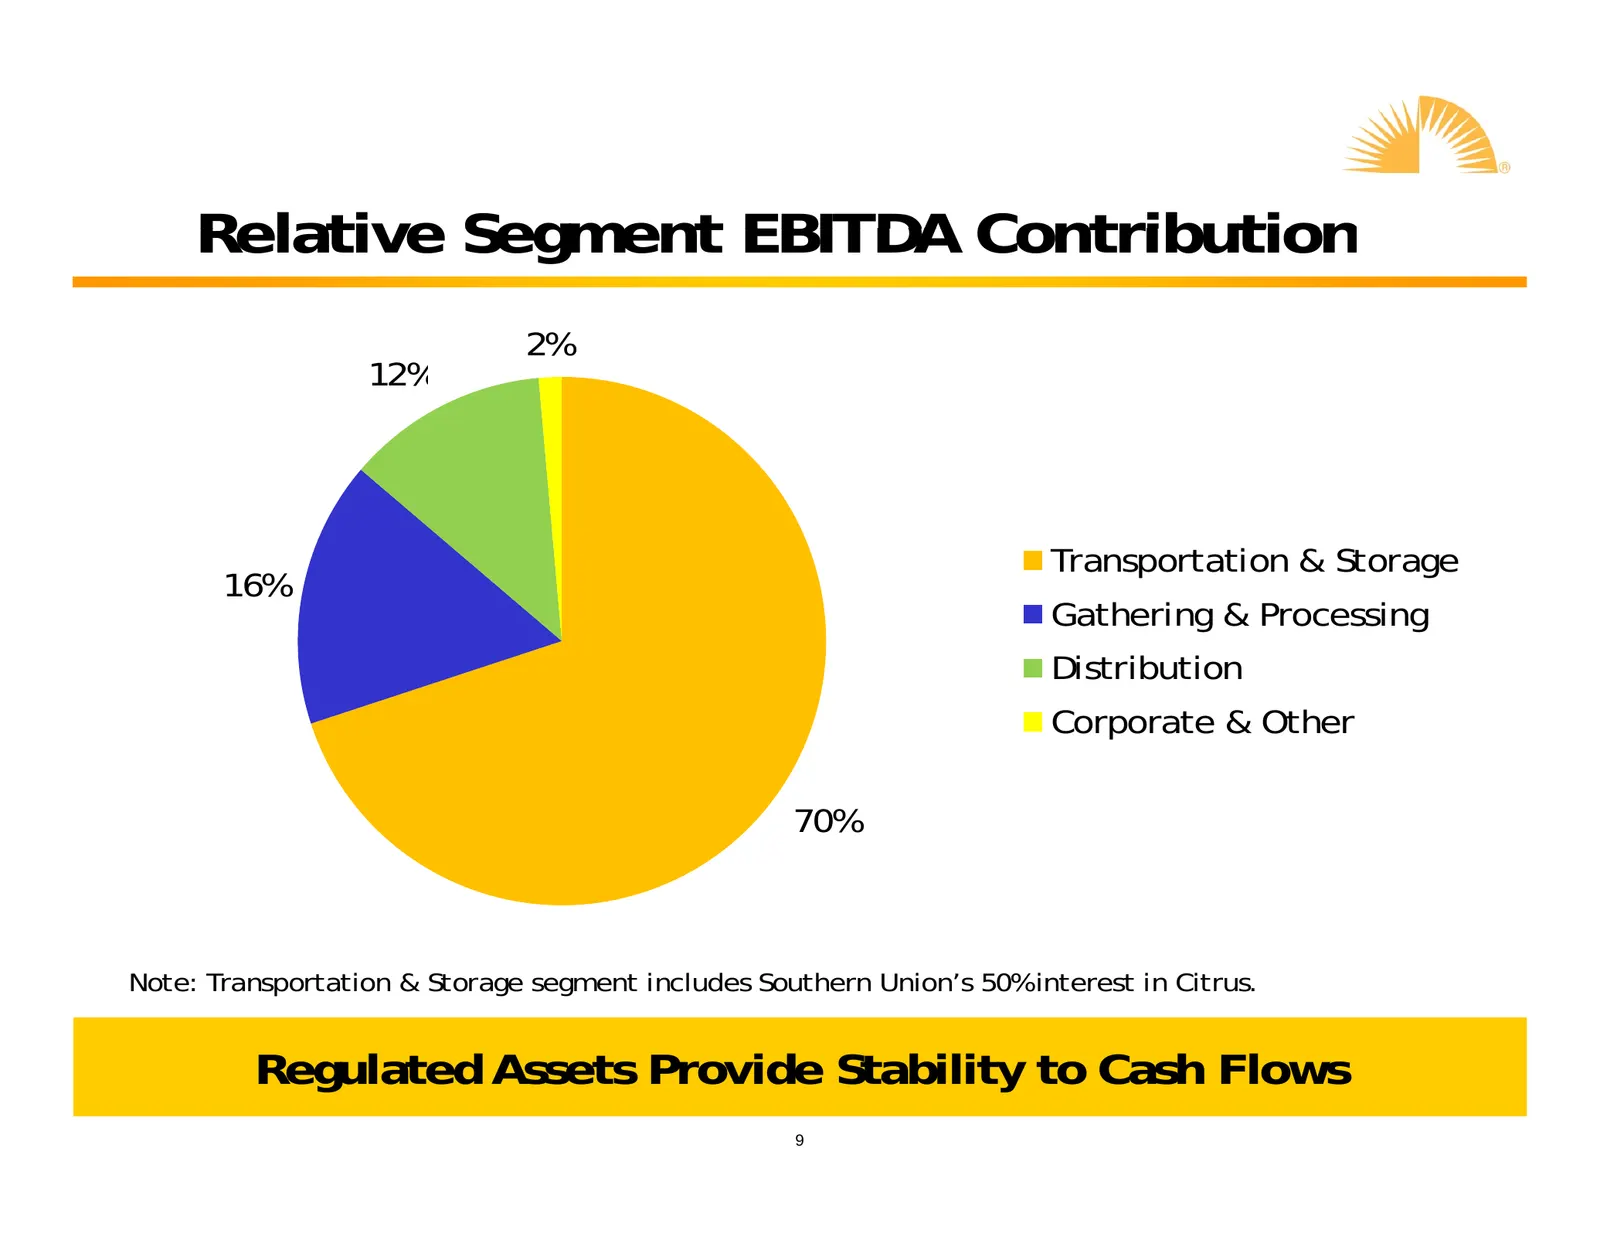
Relative Segment EBITDA Contribution 2% 12% Transportation & Storage 16% Gathering & Processing Distribution Corporate & Other 70% Note: Transportation & Storage segment includes Southern Union’s 50% interest in Citrus. Regulated Assets Provide Stability to Cash Flows 9
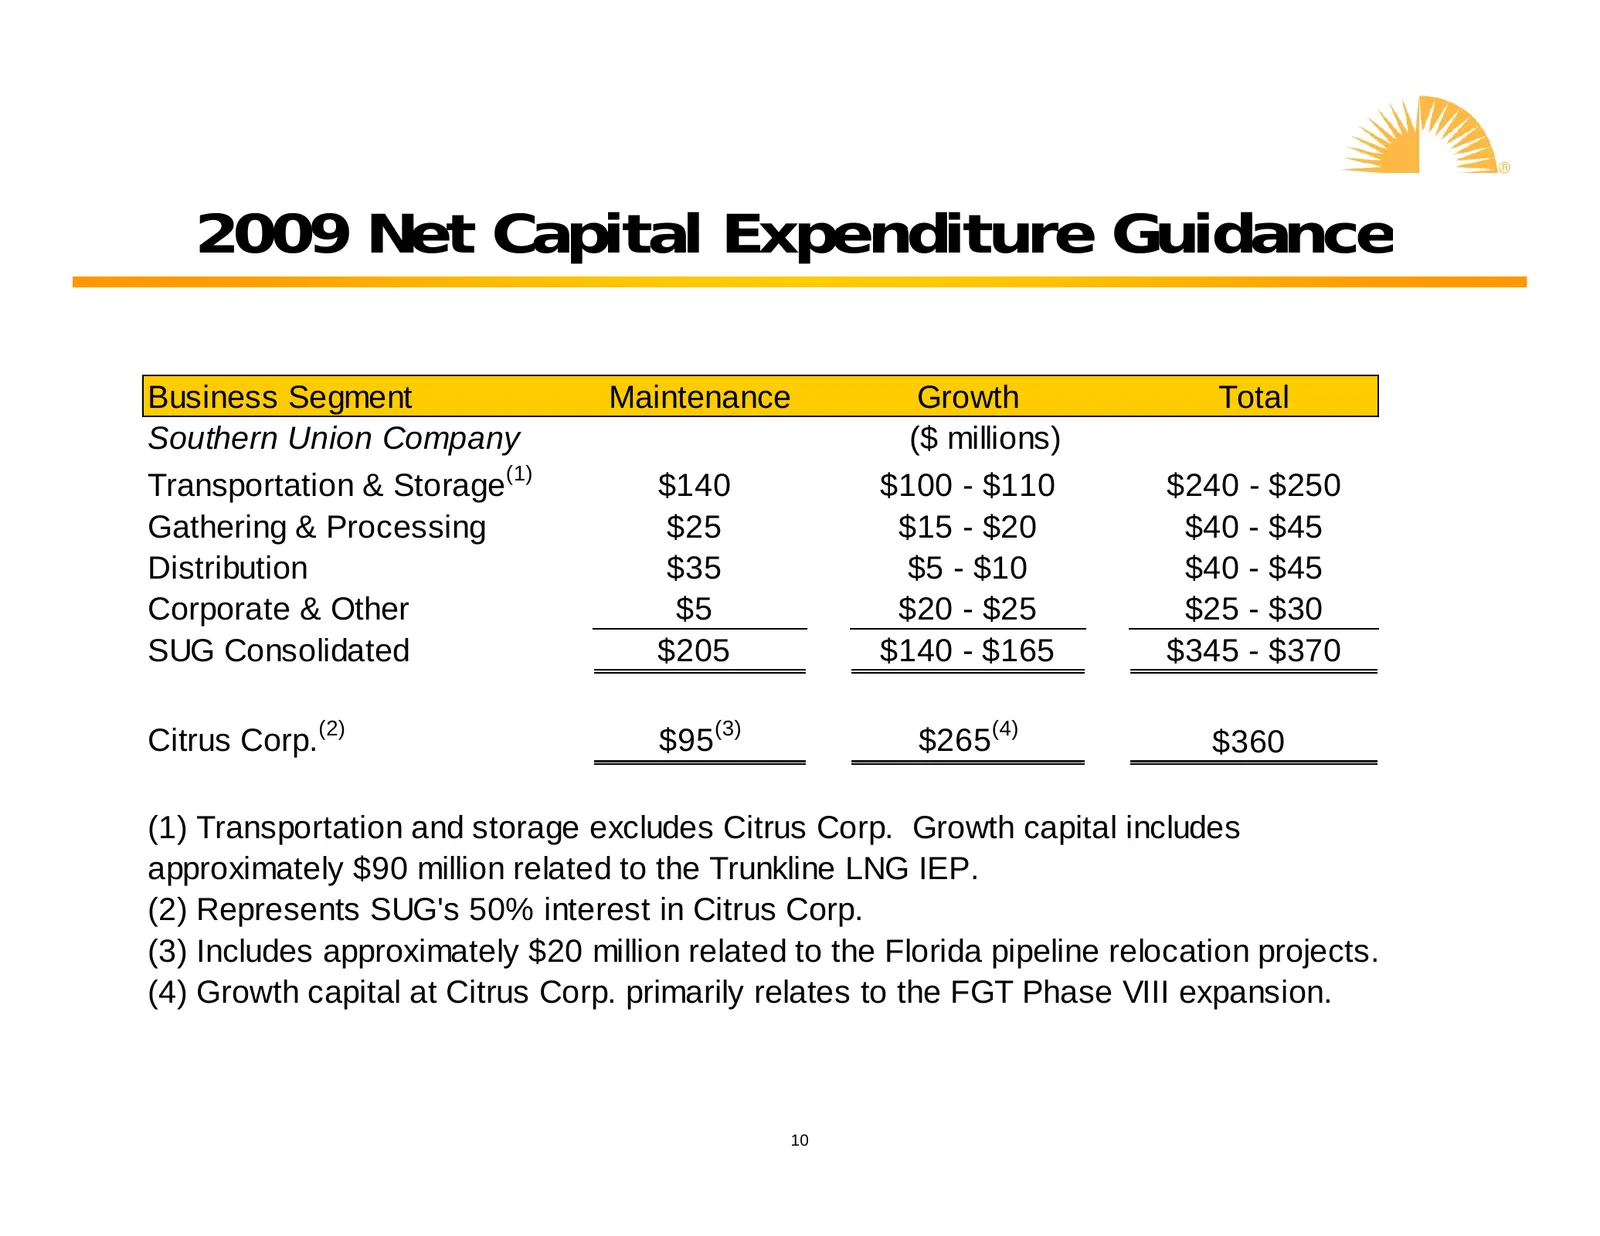
Slide 10: 2009 Net Capital Expenditure Guidance
2009 Net Capital Expenditure Guidance Business Segment Maintenance Growth Total Southern Union Company ($ millions) Transportation & Storage(1) $140 $100 - $110 $240 - $250 Gathering g & Processing g $25 $ $15 - $ $ $20 $40 - $ $ $45 Distribution $35 $5 - $10 $40 - $45 Corporate & Other $5 $20 - $25
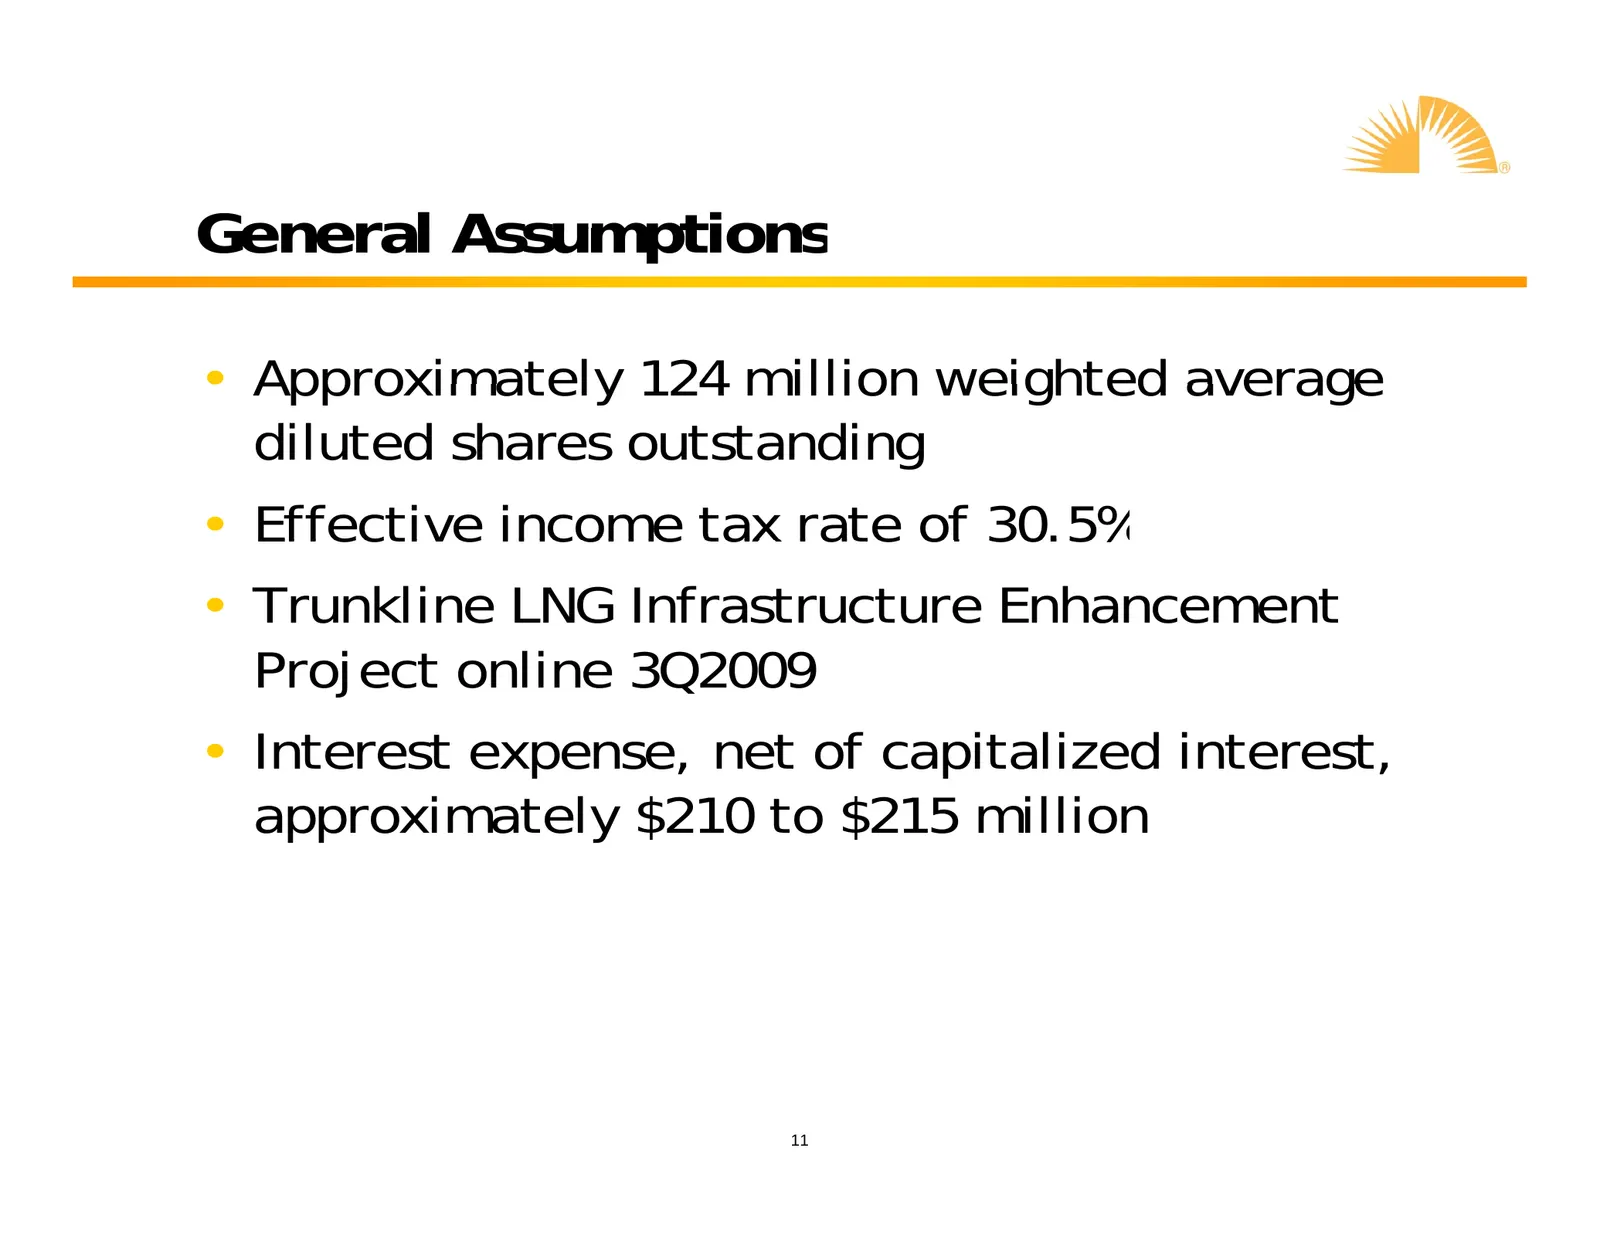
Slide 11: General Assumptions
General Assumptions • Approximately 124 million weighted average diluted shares outstanding • Effective income tax rate of 30.5% • Trunkline LNG Infrastructure Enhancement j Project online 3Q2009 Q • Interest expense, net of capitalized interest, approximately $210 to $215 million 11
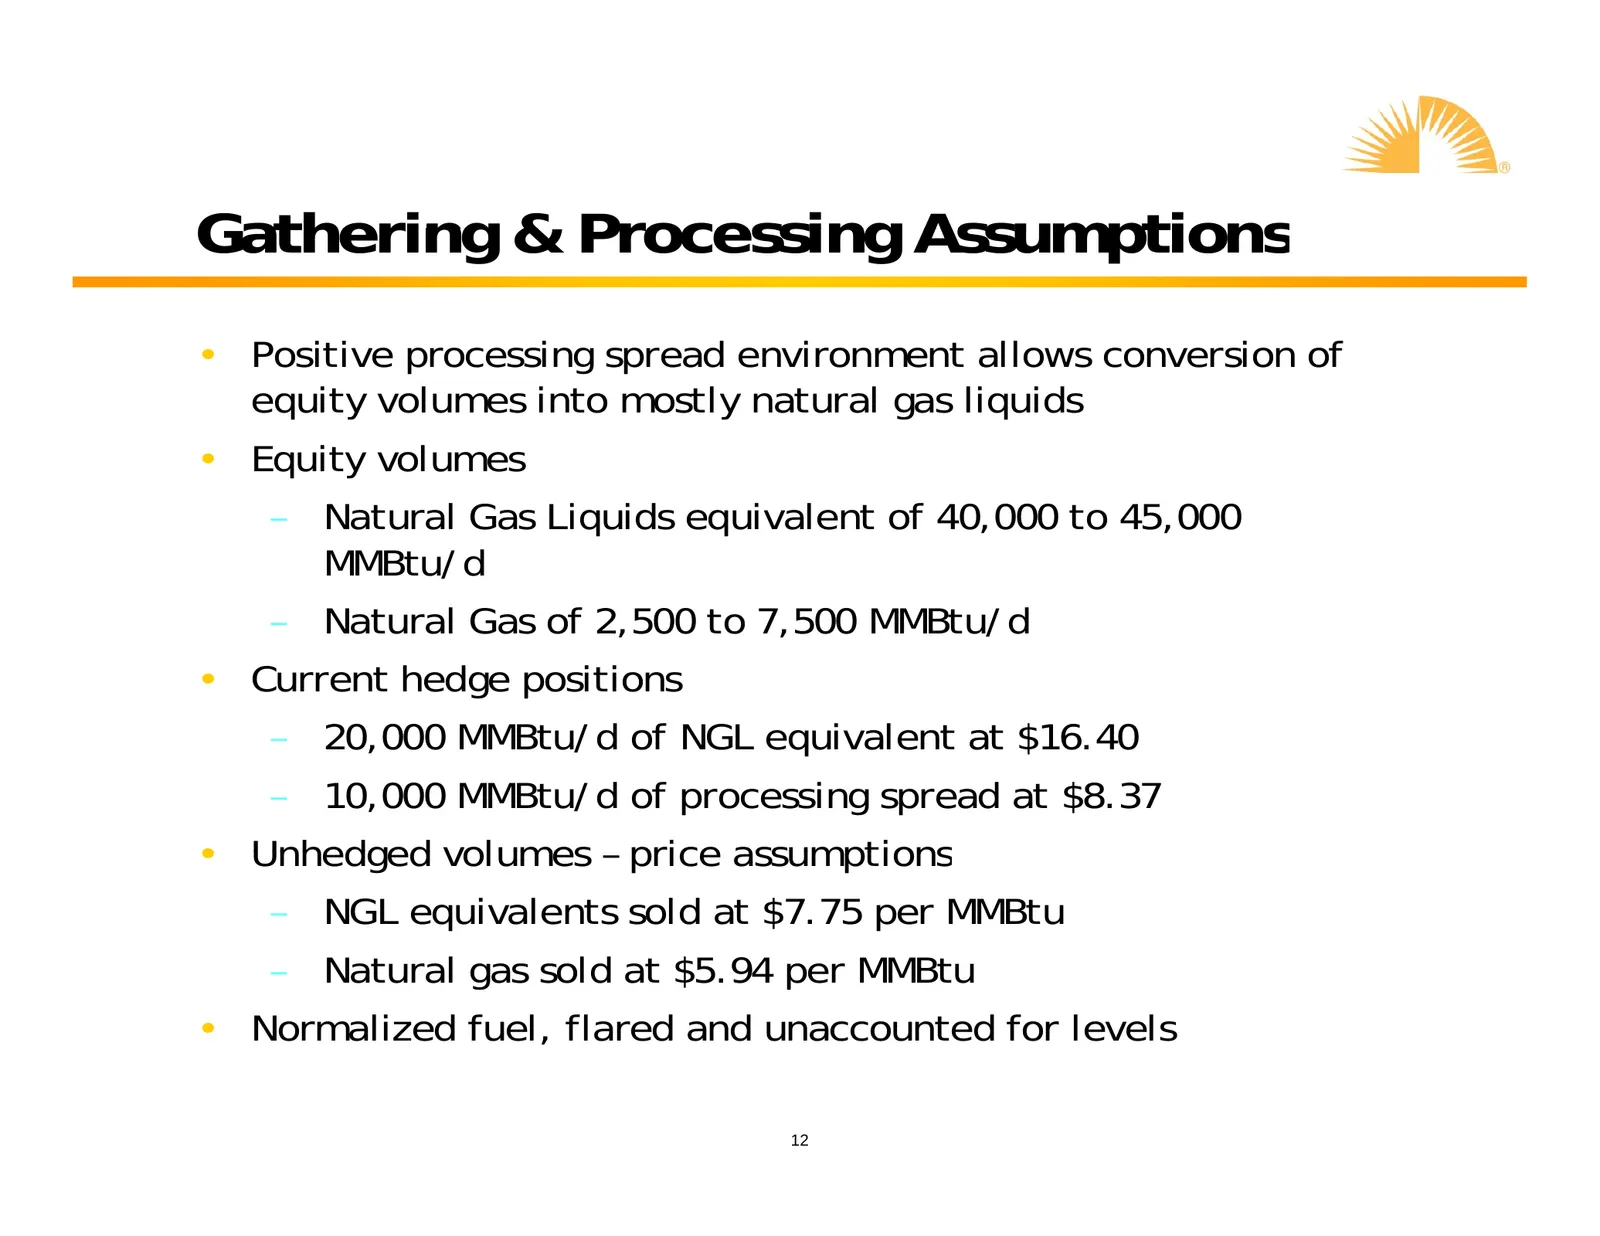
Slide 12: Gathering & Processing Assumptions
Gathering & Processing Assumptions • Positive processing spread environment allows conversion of equity volumes l into mostly l naturall gas liquids l d • Equity volumes – Natural Gas Liquids equivalent of 40,000 to 45,000 MMBtu/d – Natural Gas of 2,500 to 7,500 MMBtu/d • Current hedge g positions p
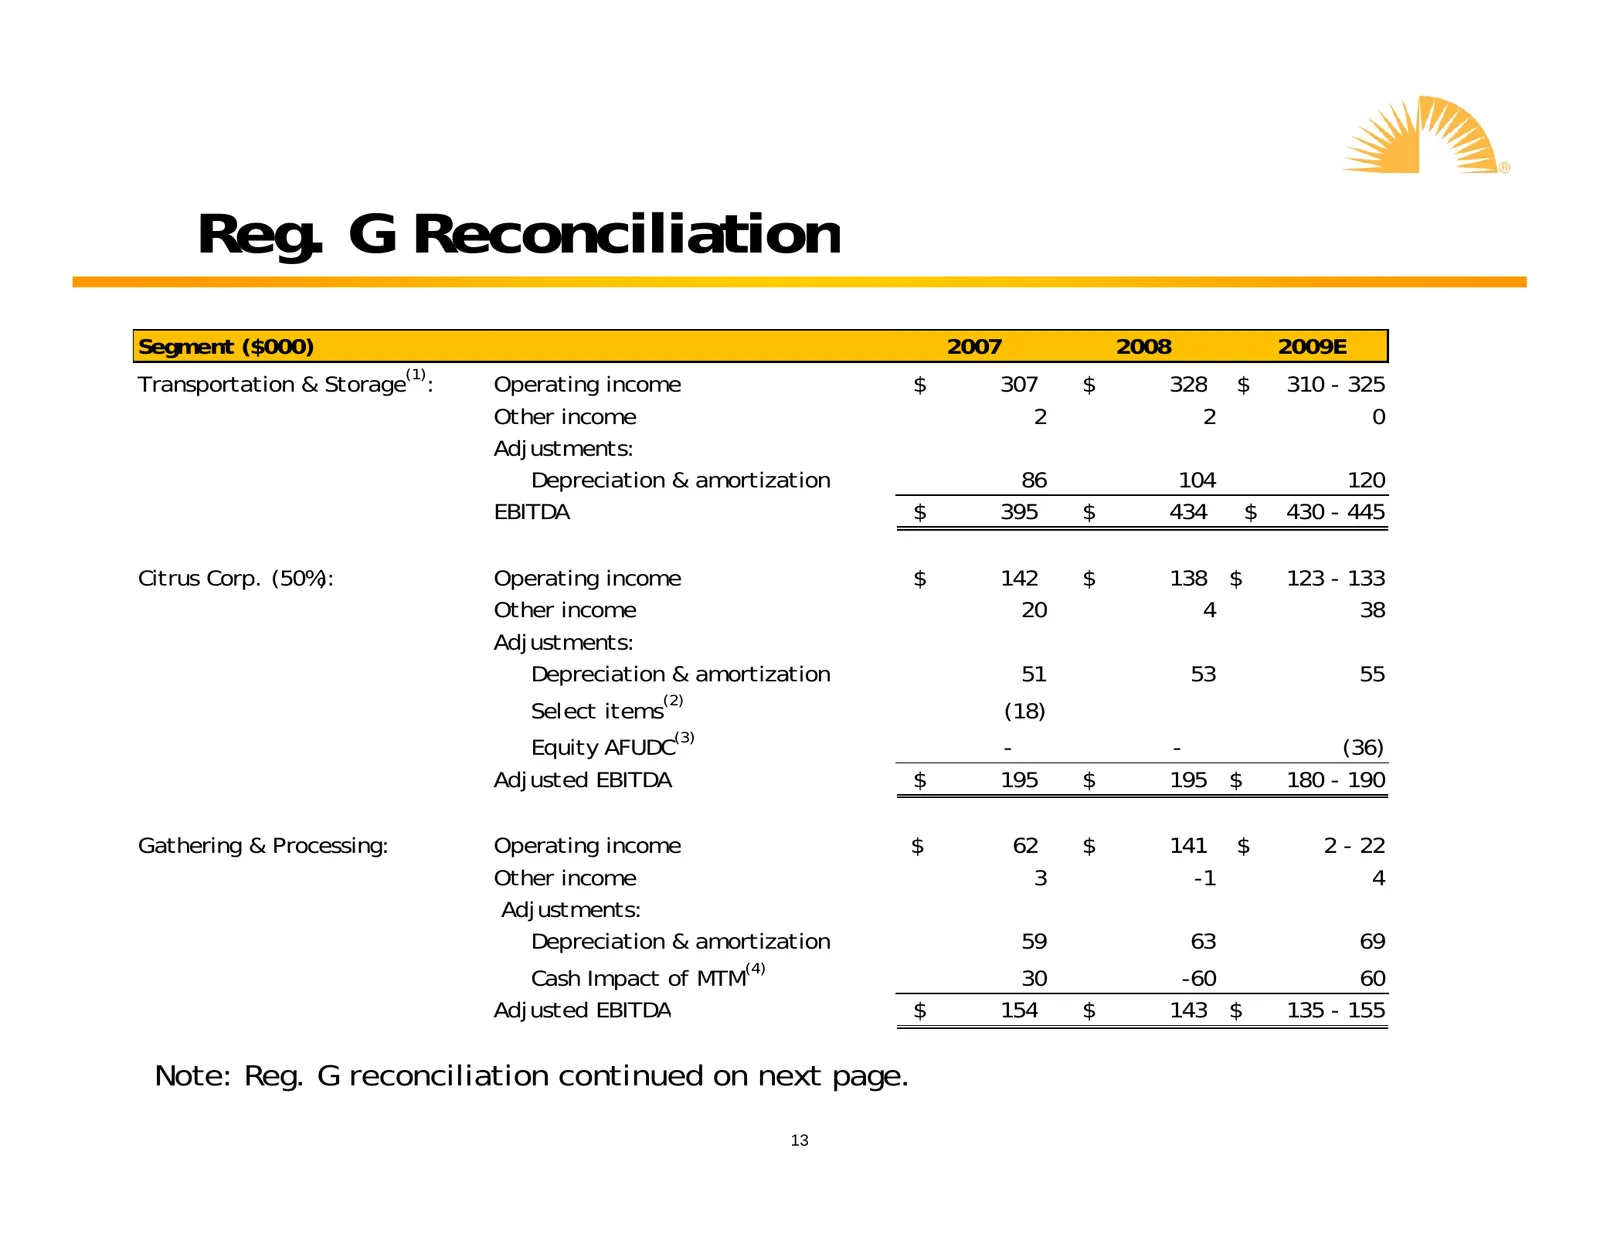
Slide 13: Reg G Reconciliation
Reg G Reconciliation Reg. Segment ($000) 2007 2008 2009E (1) Transportation & Storage : Operating income $ 307 $ 328 $ 310 - 325 Other income 2 2 0 Adjustments: Depreciation & amortization 86 104 120 EBITDA $ 395 $ 434 $ 430 - 445 Citrus Corp. (50%): Operating income $ 142 $ 138 $ 123 - 133 Other in
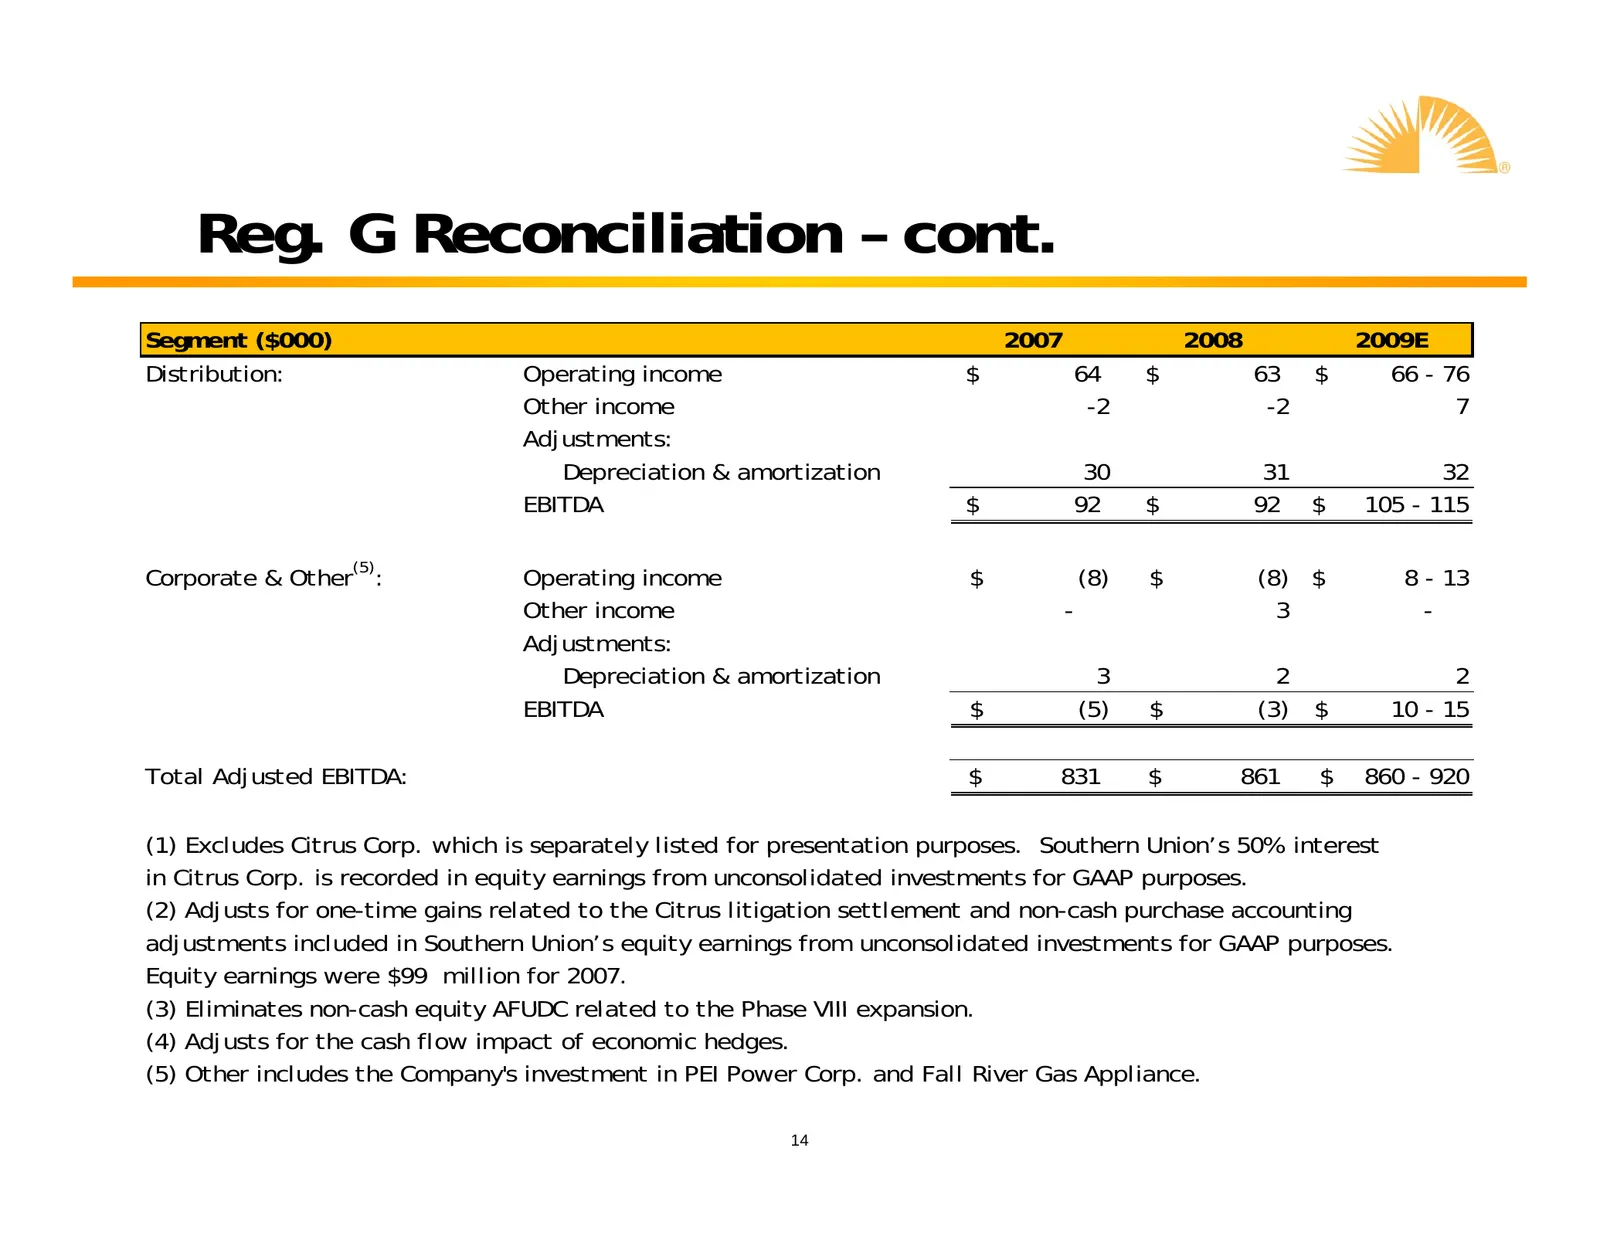
Slide 14: Reg G Reconciliation – cont.
Reg G Reconciliation – cont. Reg. cont Segment ($000) 2007 2008 2009E Distribution: Operating p g income $ 64 $ 63 $ 66 - 76 Other income -2 -2 7 Adjustments: Depreciation & amortization 30 31 32 EBITDA $ 92 $ 92 $ 105 - 115 (5) Corporate & Other : Operating income $ (8) $ (8) $ 8 - 13 Other income
Source: SEC EDGAR · 8-K filed Feb 26, 2009
More decks from Southern Union Co
 Barclays Capital Investment Grade Energy and Pipeline Conference 201232 slides · Mar 8, 2012
 Debt Investor Presentation (February 2012)33 slides · Feb 22, 2012
 Merger or Acquisition (July 2011)11 slides · Jul 5, 2011
 Merger or Acquisition (June 2011)22 slides · Jun 16, 2011
 Investor Presentation (February 2011)37 slides · Feb 25, 2011
 BMO Capital Markets 2010 Utilities and Pipelines Day23 slides · Nov 30, 2010