Spirit Realty Capital — Q1 2021 Earnings Presentation
32 slides from Spirit Realty Capital's earnings presentation, May 5, 2021
Slide 1: Q1 2021 Investor Presentation
May 2021 Q1 2021 Investor Presentation Exhibit 99.3
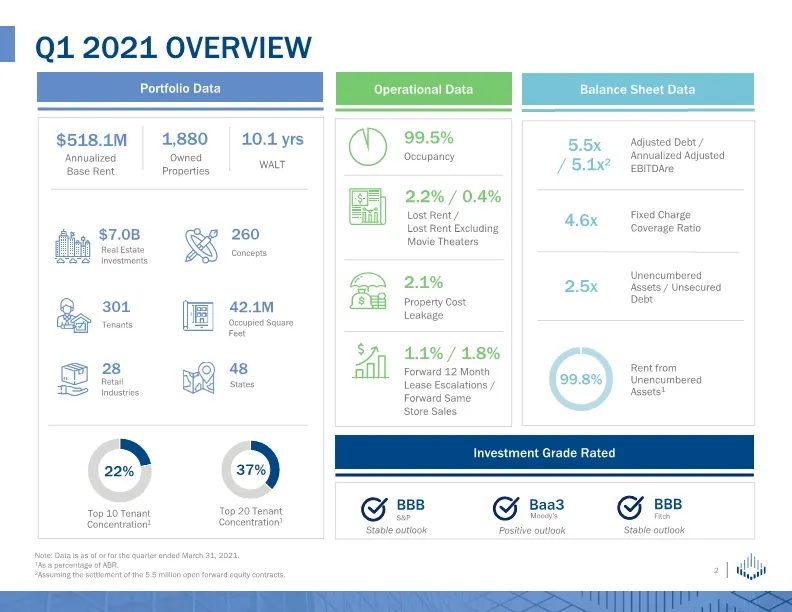
Slide 2: Q1 2021 Overview
Q1 2021 Overview Portfolio Data Operational Data Balance Sheet Data $518.1M 37% Top 10 Tenant Concentration1 22% Investment Grade Rated Baa3 Moody’s Annualized Base Rent Top 20 Tenant Concentration1 5.5x / 5.1x2 Adjusted Debt / Annualized Adjusted EBITDAre 4.6x Fixed Charge Coverage Ratio Concepts 2
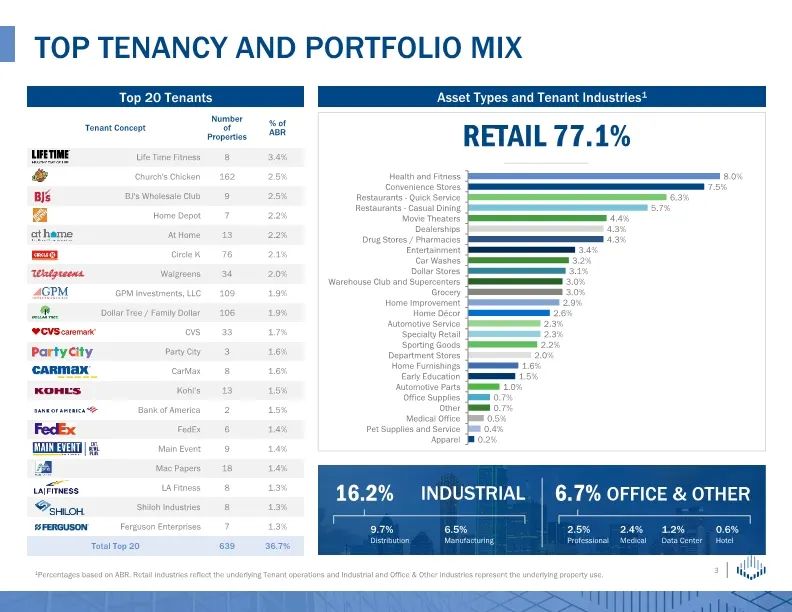
Slide 3: Top Tenancy and Portfolio Mix
Top 20 Tenants Asset Types and Tenant Industries1 RETAIL 77.1% INDUSTRIAL Top Tenancy and Portfolio Mix 16.2% 9.7% Distribution 6.5% Manufacturing OFFICE & OTHER 6.7% 2.5% Professional 2.4% Medical 1.2% Data Center 0.6% Hotel 1Percentages based on ABR. Retail industries reflect the underlying Tenant
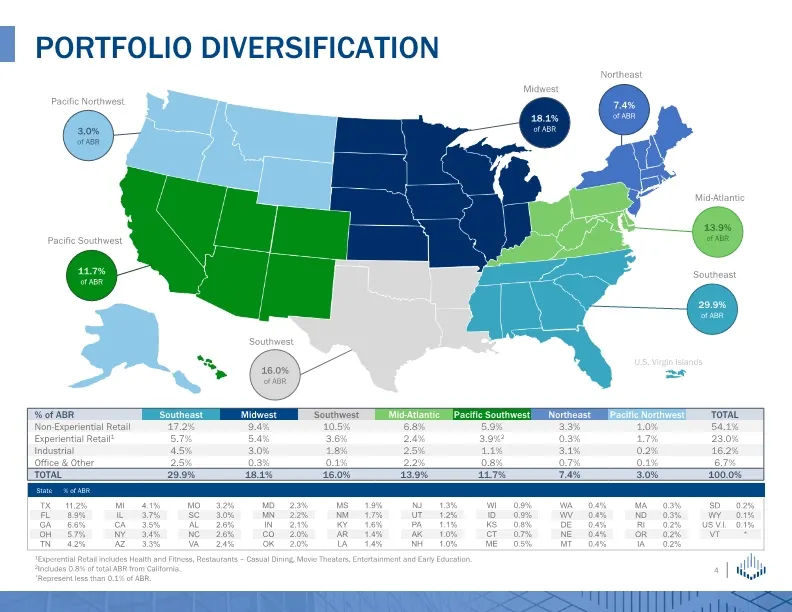
Slide 4: Portfolio Diversification
PORTFOLIO DIVERSIFICATION 1Experential Retail includes Health and Fitness, Restaurants – Casual Dining, Movie Theaters, Entertainment and Early Education. 2Includes 0.8% of total ABR from California. *Represent less than 0.1% of ABR. Southeast Mid-Atlantic Pacific Southwest Pacific Northwest 16.0% o
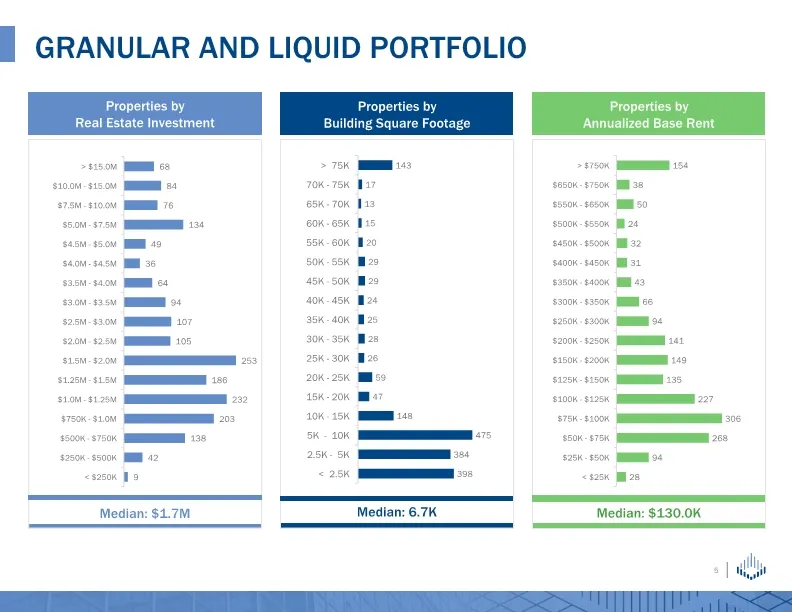
Slide 5: Granular and Liquid Portfolio
Granular and Liquid Portfolio
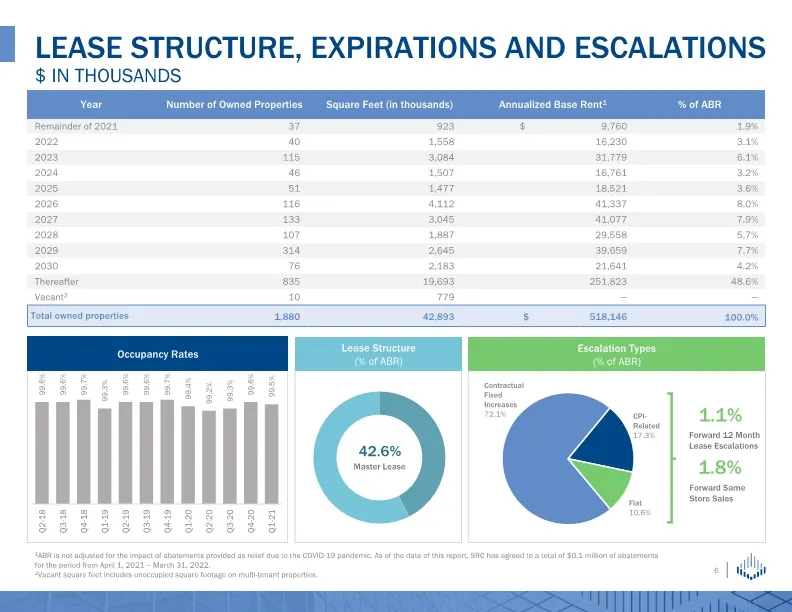
Slide 6: Lease Structure, Expirations and Escalations
LEASE STRUCTURE, EXPIRATIONS AND ESCALATIONS $ in thousands 1.8% Forward Same Store Sales Occupancy Rates Forward 12 Month Lease Escalations 1.1% Lease Structure (% of ABR) 42.6% Master Lease Escalation Types (% of ABR) 1ABR is not adjusted for the impact of abatements provided as relief due to the
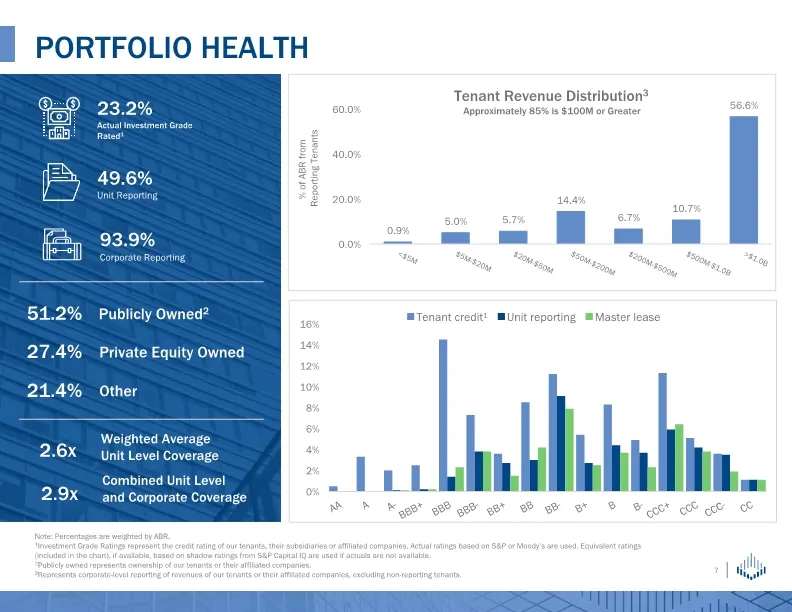
Slide 7: Portfolio Health
Portfolio Health % of ABR from Reporting Tenants Note: Percentages are weighted by ABR. 1Investment Grade Ratings represent the credit rating of our tenants, their subsidiaries or affiliated companies. Actual ratings based on S&P or Moody’s are used. Equivalent ratings (included in the chart), if av
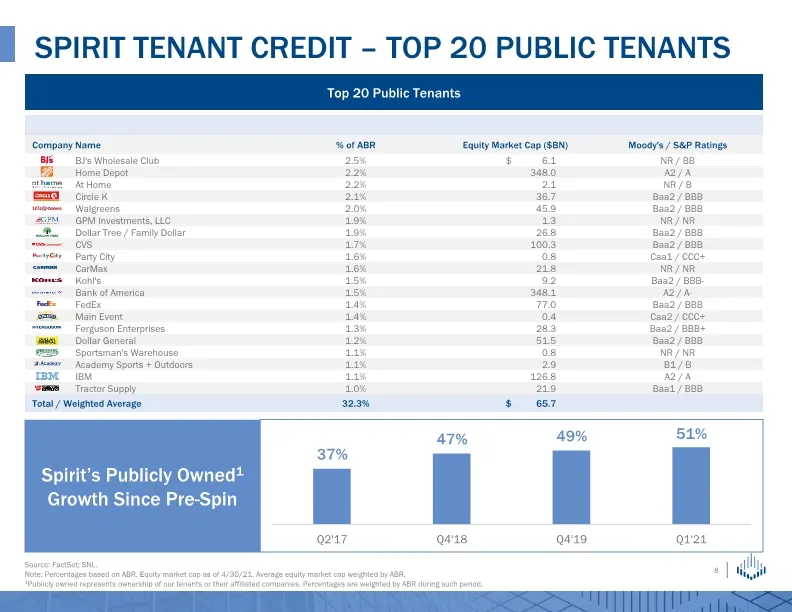
Slide 8: Spirit Tenant Credit – Top Public Tenants
Spirit tenant credit – top 20 public Tenants Source: FactSet; SNL. Note: Percentages based on ABR. Equity market cap as of 4/30/21. Average equity market cap weighted by ABR. 1Publicly owned represents ownership of our tenants or their affiliated companies. Percentages are weighted by ABR during suc
Slide 9: Movie Theater Tenant Update
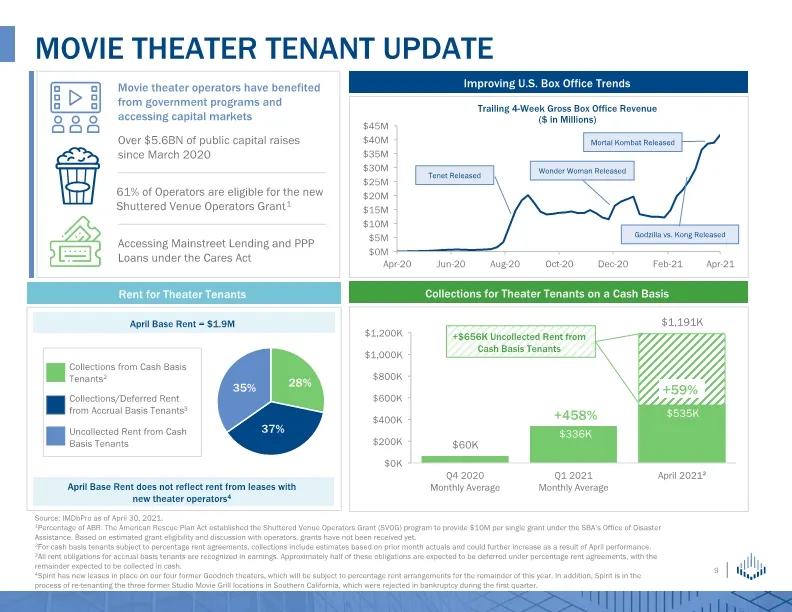
Movie theater tenant Update Source: IMDbPro as of April 30, 2021. 1Percentage of ABR. The American Rescue Plan Act established the Shuttered Venue Operators Grant (SVOG) program to provide $10M per single grant under the SBA’s Office of Disaster Assistance. Based on estimated grant eligibility and d
Slide 10: Net Investment Activity
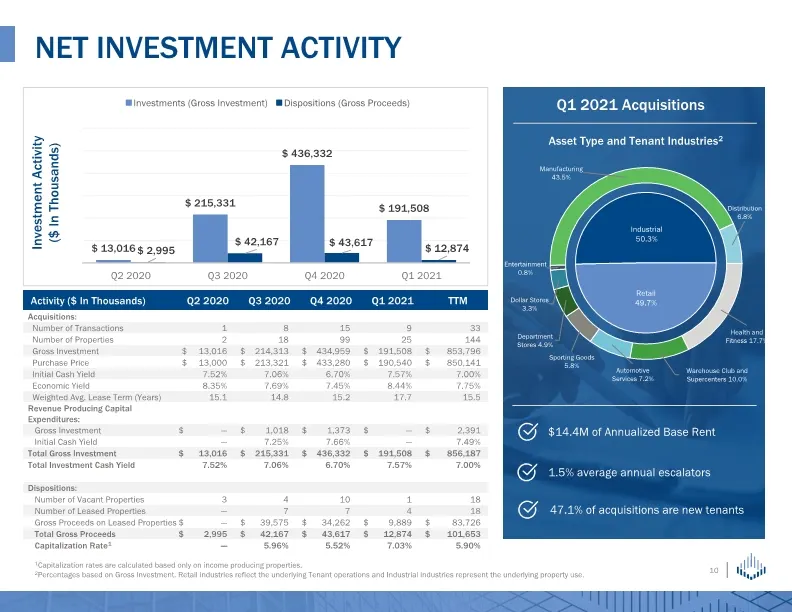
NET INVESTMENT ACTIVITY Asset Type and Tenant Industries2 1Capitalization rates are calculated based only on income producing properties. 2Percentages based on Gross Investment. Retail industries reflect the underlying Tenant operations and Industrial industries represent the underlying property use
Slide 11: Debt Summary and Market Capitalization
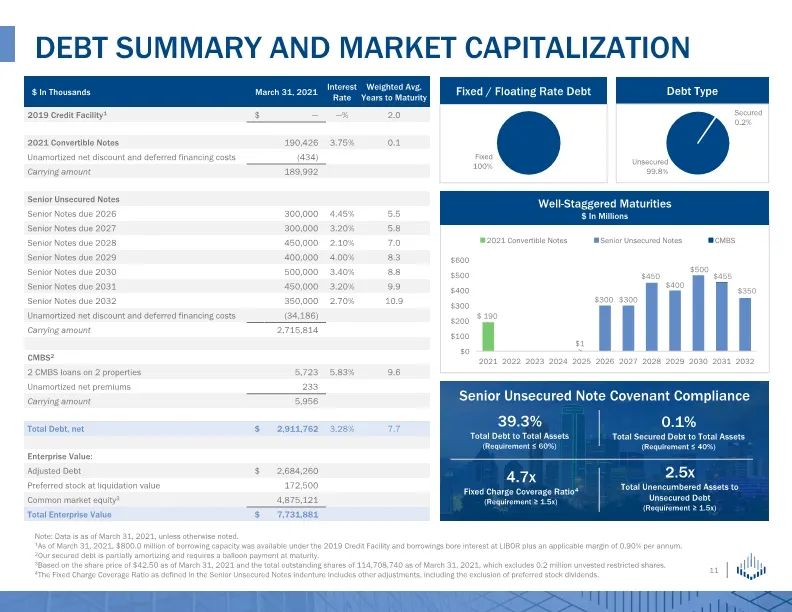
Debt Summary and Market Capitalization Note: Data is as of March 31, 2021, unless otherwise noted. 1As of March 31, 2021, $800.0 million of borrowing capacity was available under the 2019 Credit Facility and borrowings bore interest at LIBOR plus an applicable margin of 0.90% per annum. 2Our secured
Slide 12: Fixed income investors have re-rated Spirit's cost of debt
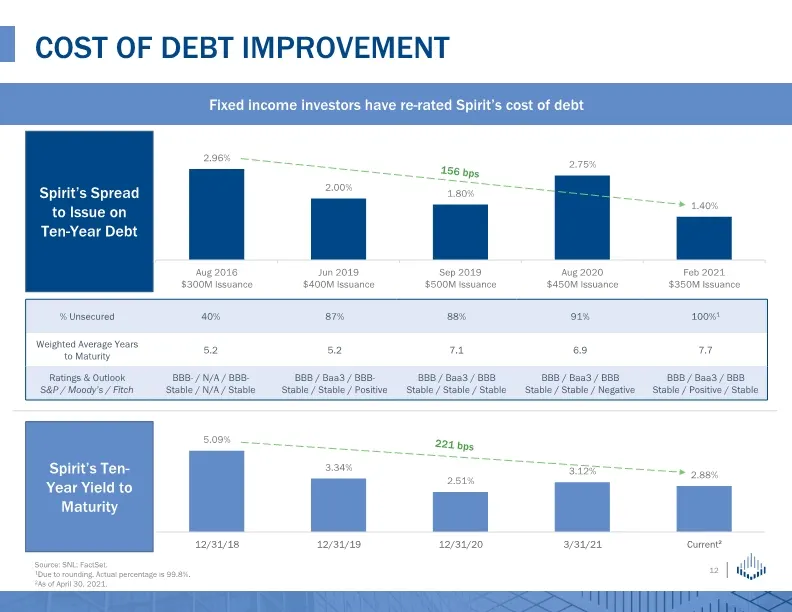
Fixed income investors have re-rated Spirit’s cost of debt 156 bps Cost of debt improvement Spirit’s Spread to Issue on Ten-Year Debt
Slide 13: Commitment to Environmental Sustainability
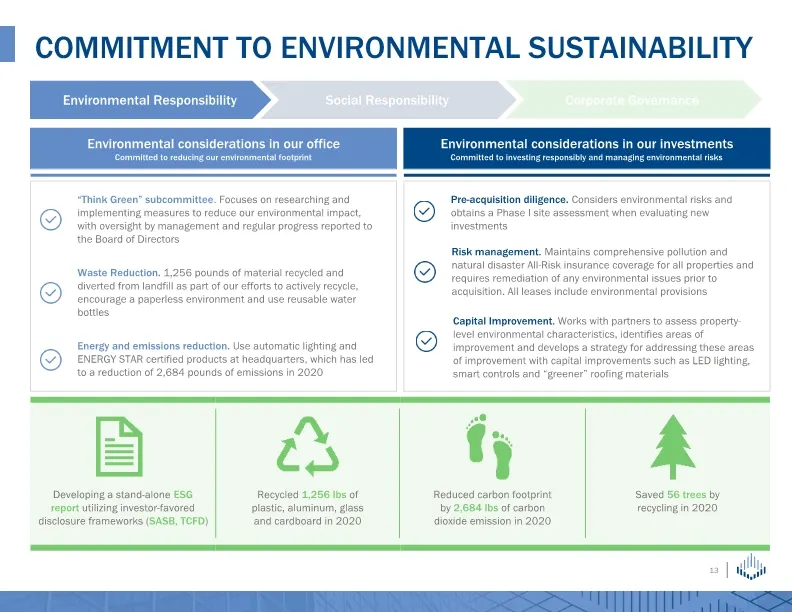
Commitment to Environmental Sustainability Environmental Responsibility Social Responsibility Corporate Governance Environmental considerations in our office Committed to reducing our environmental footprint Environmental considerations in our investments Committed to investing responsibly and manag
Slide 14: Commitment to Social Responsibility
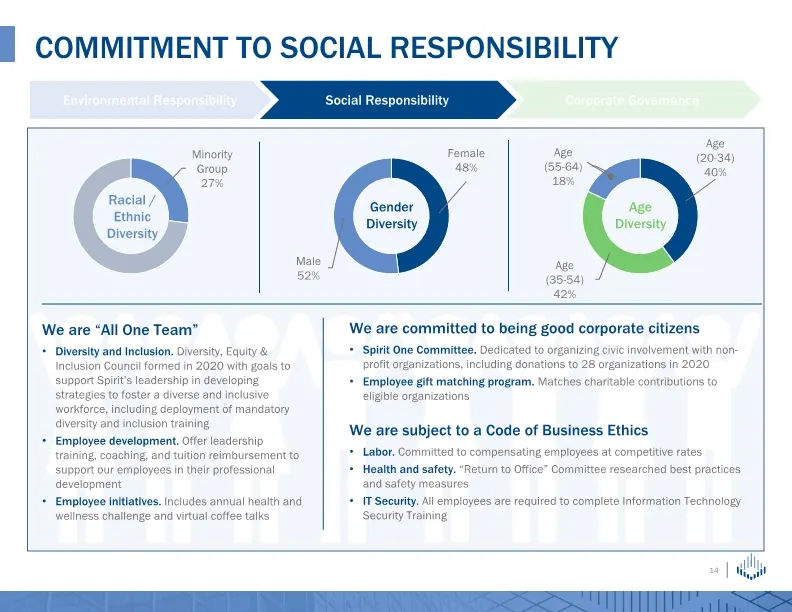
Commitment to social responsibility Environmental Responsibility Social Responsibility Corporate Governance We are “All One Team” Diversity and Inclusion. Diversity, Equity & Inclusion Council formed in 2020 with goals to support Spirit’s leadership in developing strategies to foster a diverse and i
Slide 15: Commitment to Strong Governance Practice
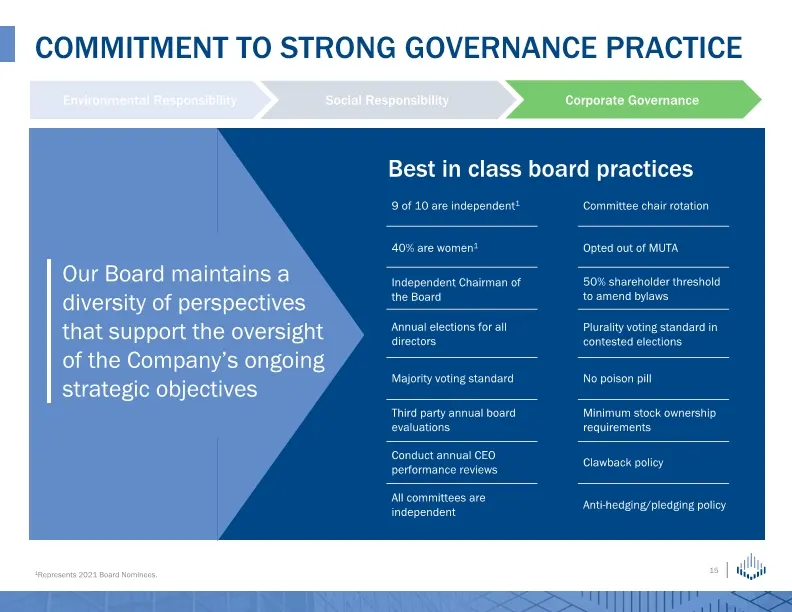
Commitment to strong governance practice 1Represents 2021 Board Nominees. Environmental Responsibility Social Responsibility Corporate Governance Our Board maintains a diversity of perspectives that support the oversight of the Company’s ongoing strategic objectives Best in class board practices 9 o
Slide 16: Spirit's Platform
Spirit’s Platform
Slide 17: Spirit's Platform
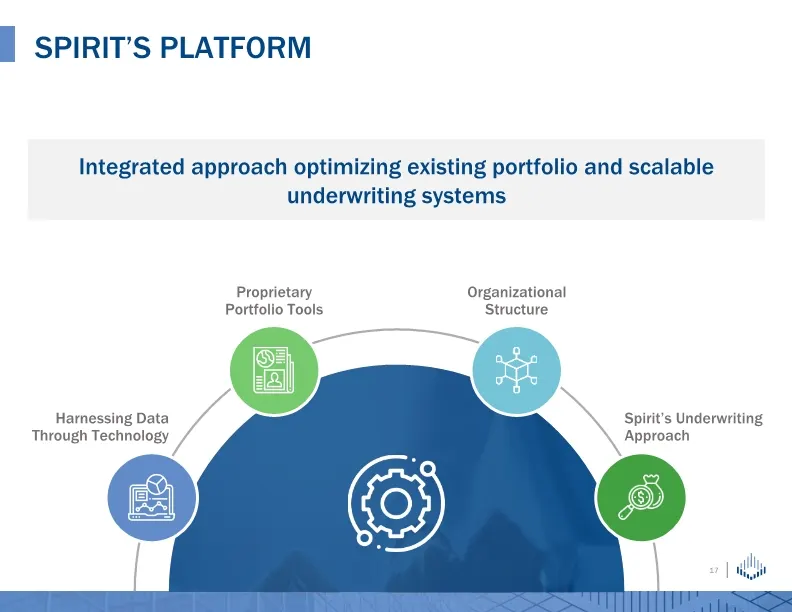
Spirit’s platform Integrated approach optimizing existing portfolio and scalable underwriting systems Harnessing Data Through Technology Proprietary Portfolio Tools Organizational Structure Spirit’s Underwriting Approach
Slide 18: Proprietary Portfolio Tools
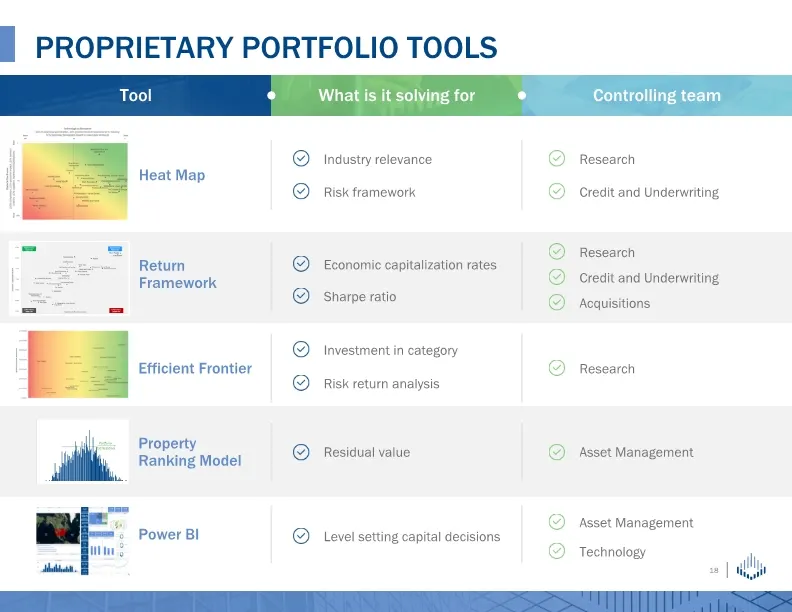
Proprietary portfolio tools Power BI Heat Map Efficient Frontier Return Framework Property Ranking Model Industry relevance Risk framework Economic capitalization rates Sharpe ratio Investment in category Risk return analysis Residual value Level setting capital decisions Research Credit and Underwr
Slide 19: Spirit's Updated Efficient Frontier
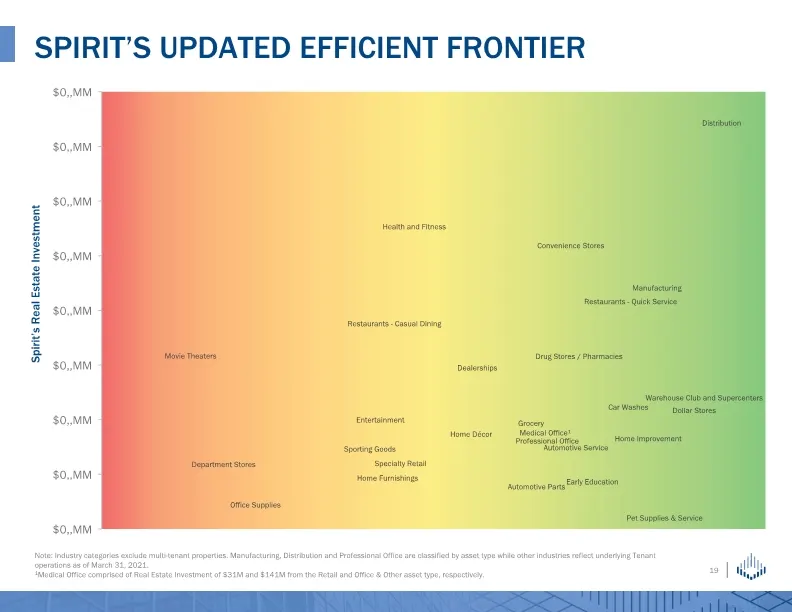
Spirit’s Updated Efficient frontier Note: Industry categories exclude multi-tenant properties. Manufacturing, Distribution and Professional Office are classified by asset type while other industries reflect underlying Tenant operations as of March 31, 2021. 1Medical Office comprised of Real Estate I
Slide 20: Spirit's Heat Map
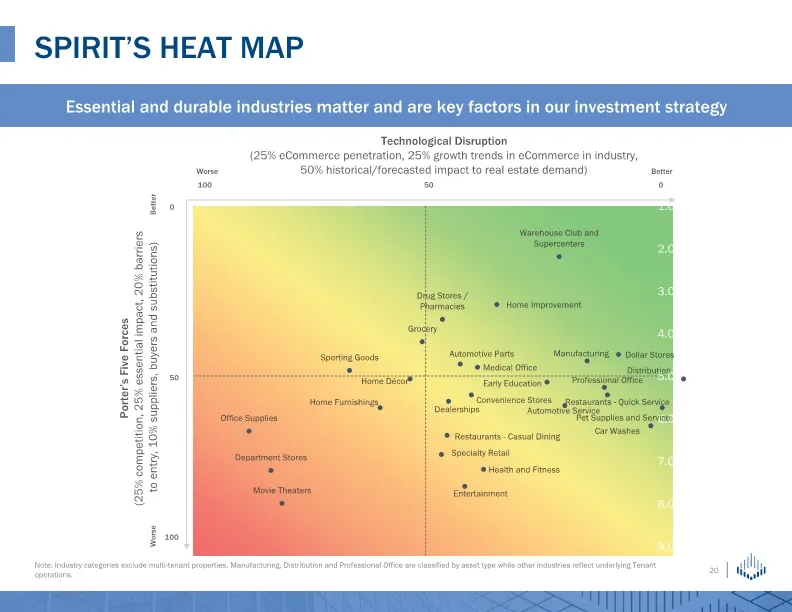
Spirit’s heat map Note: Industry categories exclude multi-tenant properties. Manufacturing, Distribution and Professional Office are classified by asset type while other industries reflect underlying Tenant operations. Essential and durable industries matter and are key factors in our investment str
Slide 21: Property Ranking Model
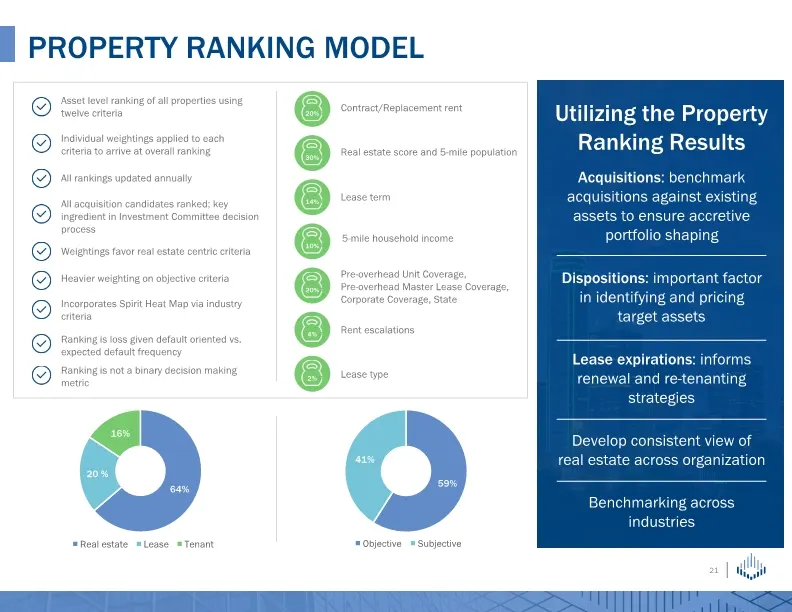
property ranking model Asset level ranking of all properties using twelve criteria Contract/Replacement rent Real estate score and 5-mile population Lease term 5-mile household income Pre-overhead Unit Coverage, Pre-overhead Master Lease Coverage, Corporate Coverage, State Rent escalations Lease typ
Slide 22: Spirit's Underwriting Approach
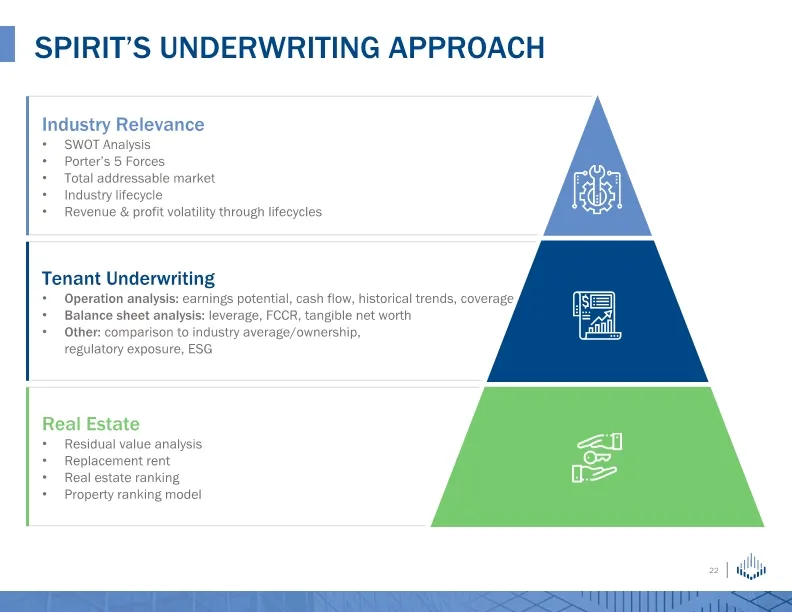
Spirit’s underwriting approach Industry Relevance SWOT Analysis Porter’s 5 Forces Total addressable market Industry lifecycle Revenue & profit volatility through lifecycles Tenant Underwriting Operation analysis: earnings potential, cash flow, historical trends, coverage Balance sheet analysis: leve
Slide 23: Financial Presentation and Non-GAAP Reconciliations
Financial Presentation and Non-GAAP Reconciliations
Slide 24: Net Asset Value (NAV) Components
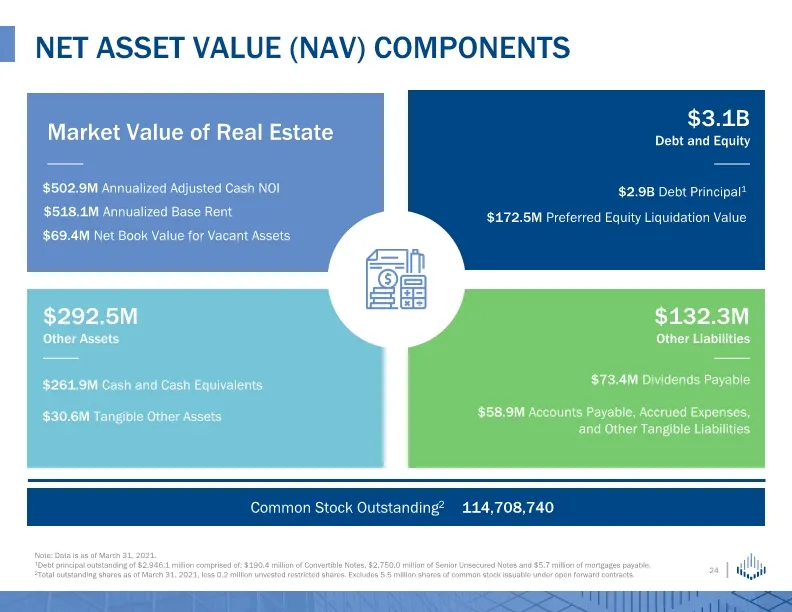
Net Asset Value (NAV) Components Market Value of Real Estate $3.1B Debt and Equity $292.5M Other Assets $132.3M Other Liabilities $518.1M Annualized Base Rent $69.4M Net Book Value for Vacant Assets $2.9B Debt Principal1 $172.5M Preferred Equity Liquidation Value $261.9M Cash and Cash Equivalents $3
Slide 25: Consolidated Statements of Operations
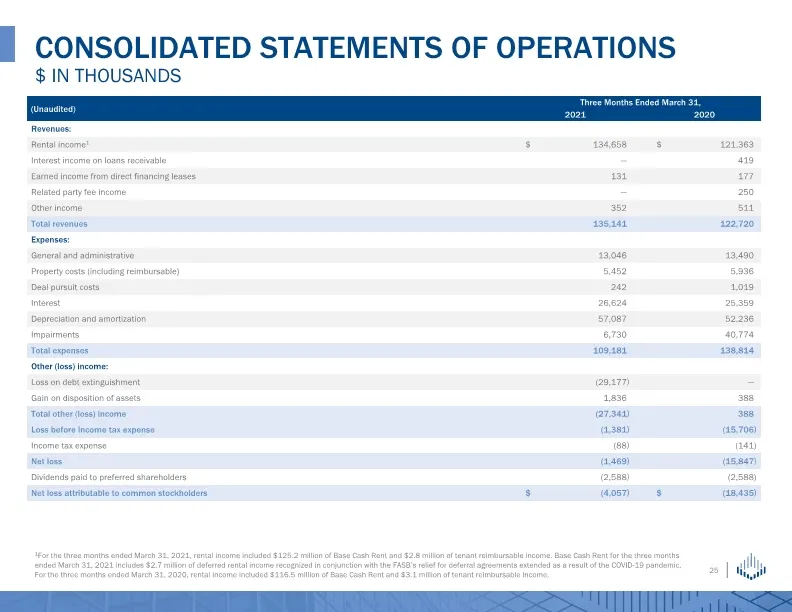
CONSOLIDATED STATEMENTS OF OPERATIONS $ IN THOUSANDS 1For the three months ended March 31, 2021, rental income included $125.2 million of Base Cash Rent and $2.8 million of tenant reimbursable income. Base Cash Rent for the three months ended March 31, 2021 includes $2.7 million of deferred rental i
Slide 26: Consolidated Balance Sheets
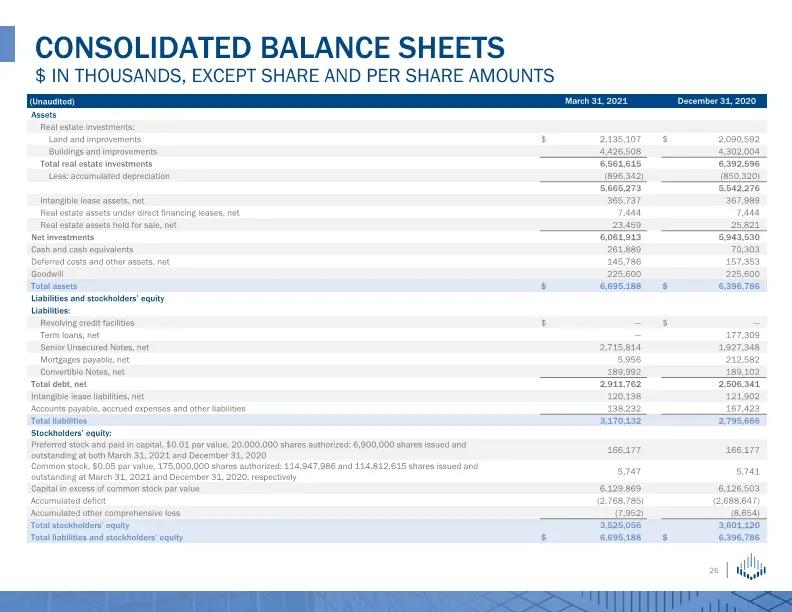
CONSOLIDATED BALANCE SHEETS $ IN THOUSANDS, EXCEPT SHARE AND PER SHARE AMOUNTS
Slide 27: Funds and Adjusted Funds from Operations
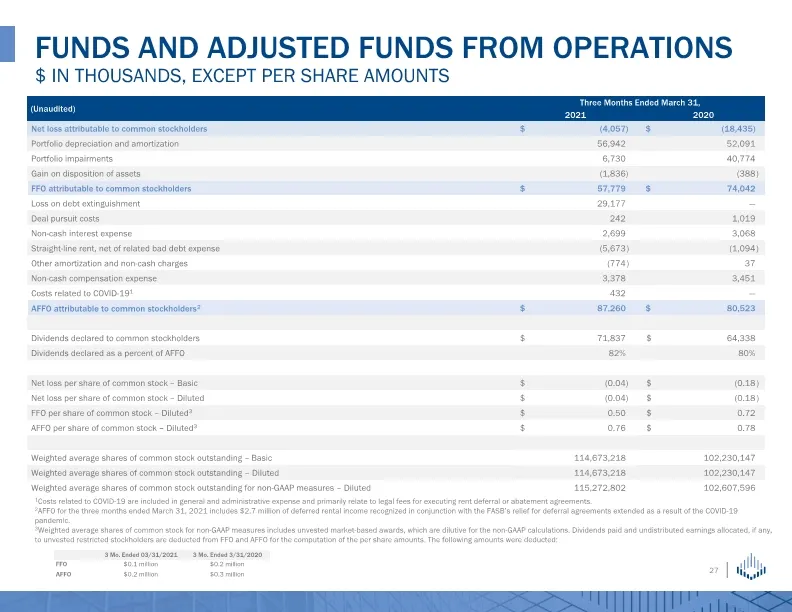
FUNDS AND ADJUSTED FUNDS FROM OPERATIONS $ IN THOUSANDS, EXCEPT PER SHARE AMOUNTS 1Costs related to COVID-19 are included in general and administrative expense and primarily relate to legal fees for executing rent deferral or abatement agreements. 2AFFO for the three months ended March 31, 2021 incl
Slide 28: Other Non-GAAP Reconciliations
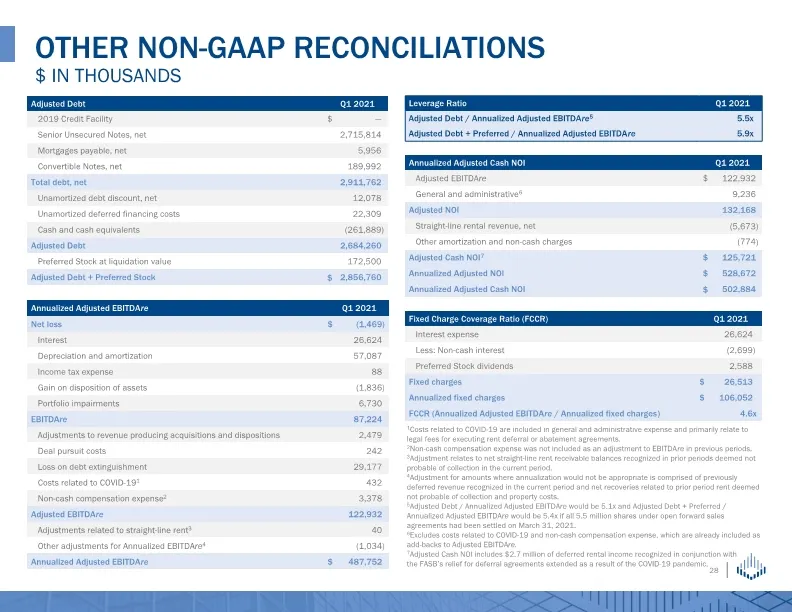
Other NON-GAAP RECONCILIATIONS $ in thousands 1Costs related to COVID-19 are included in general and administrative expense and primarily relate to legal fees for executing rent deferral or abatement agreements. 2Non-cash compensation expense was not included as an adjustment to EBITDAre in previous
Slide 29: Appendix
Appendix
Slide 30: Non-GAAP Definitions and Explanations
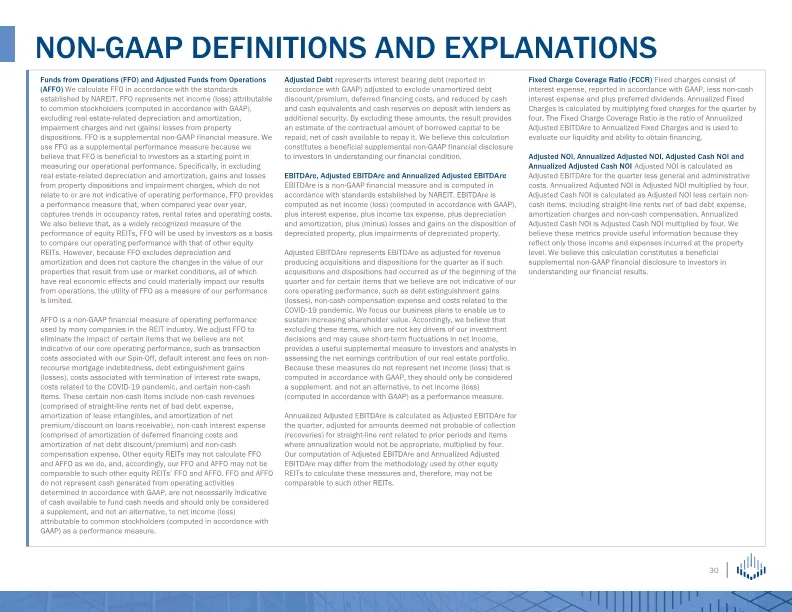
NON-GAAP DEFINITIONS AND EXPLANATIONS
Slide 31: Other Definitions and Explanations
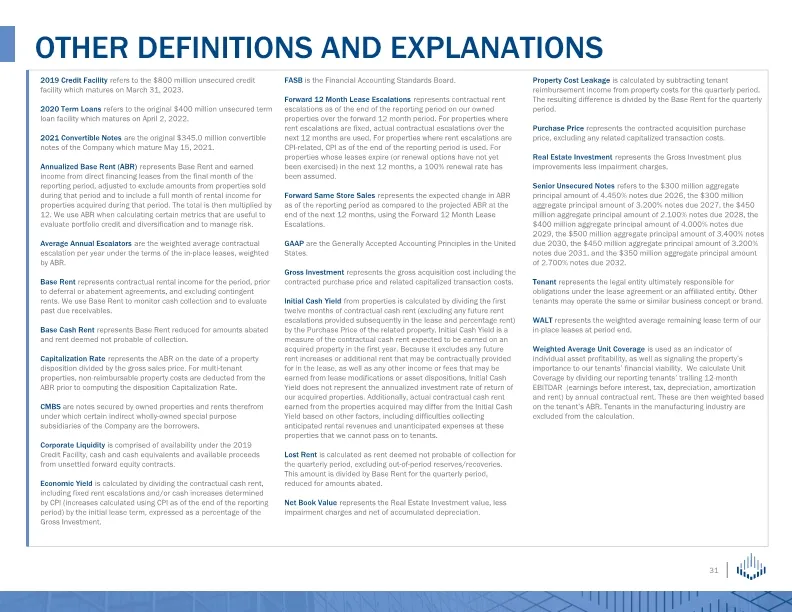
OTHER DEFINITIONS AND EXPLANATIONS
Slide 32: Forward-Looking Statements and Risk Factors
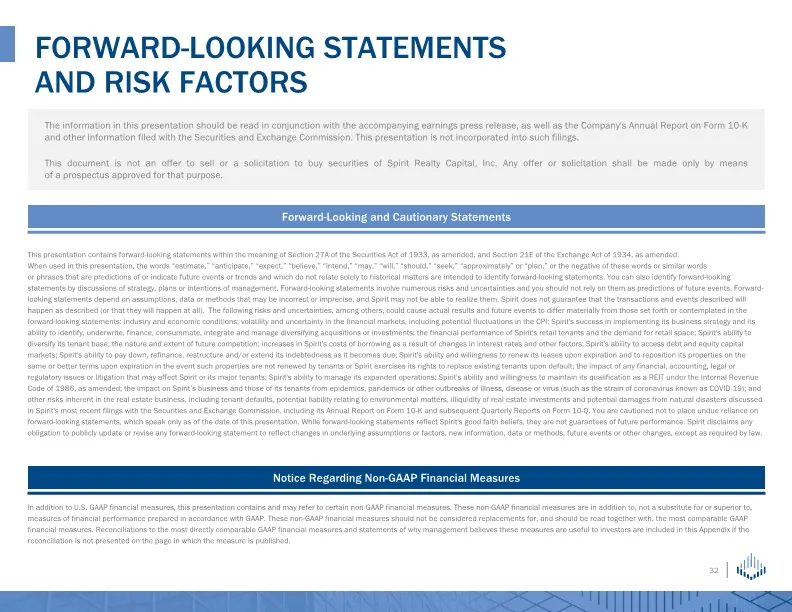
FORWARD-LOOKING STATEMENTS AND RISK FACTORS The information in this presentation should be read in conjunction with the accompanying earnings press release, as well as the Company's Annual Report on Form 10-K and other information filed with the Securities and Exchange Commission. This presentation
Source: SEC EDGAR · 8-K filed May 5, 2021
More decks from Spirit Realty Capital Inc
 Q3 2023 Earnings Presentation28 slides · Nov 2, 2023
 Merger or Acquisition (October 2023)20 slides · Oct 30, 2023
 Q2 2023 Earnings Presentation26 slides · Aug 7, 2023
 Q2 2023 Earnings Presentation26 slides · August 2023
 Q1 2023 Earnings Presentation27 slides · May 3, 2023
 Q4 2022 Earnings Presentation31 slides · Feb 28, 2023