Florida East Coast Industries Inc
Florida East Coast Industries — Investor Presentation (May 2004)
45 slides from Florida East Coast Industries's investor presentation, May 14, 2004
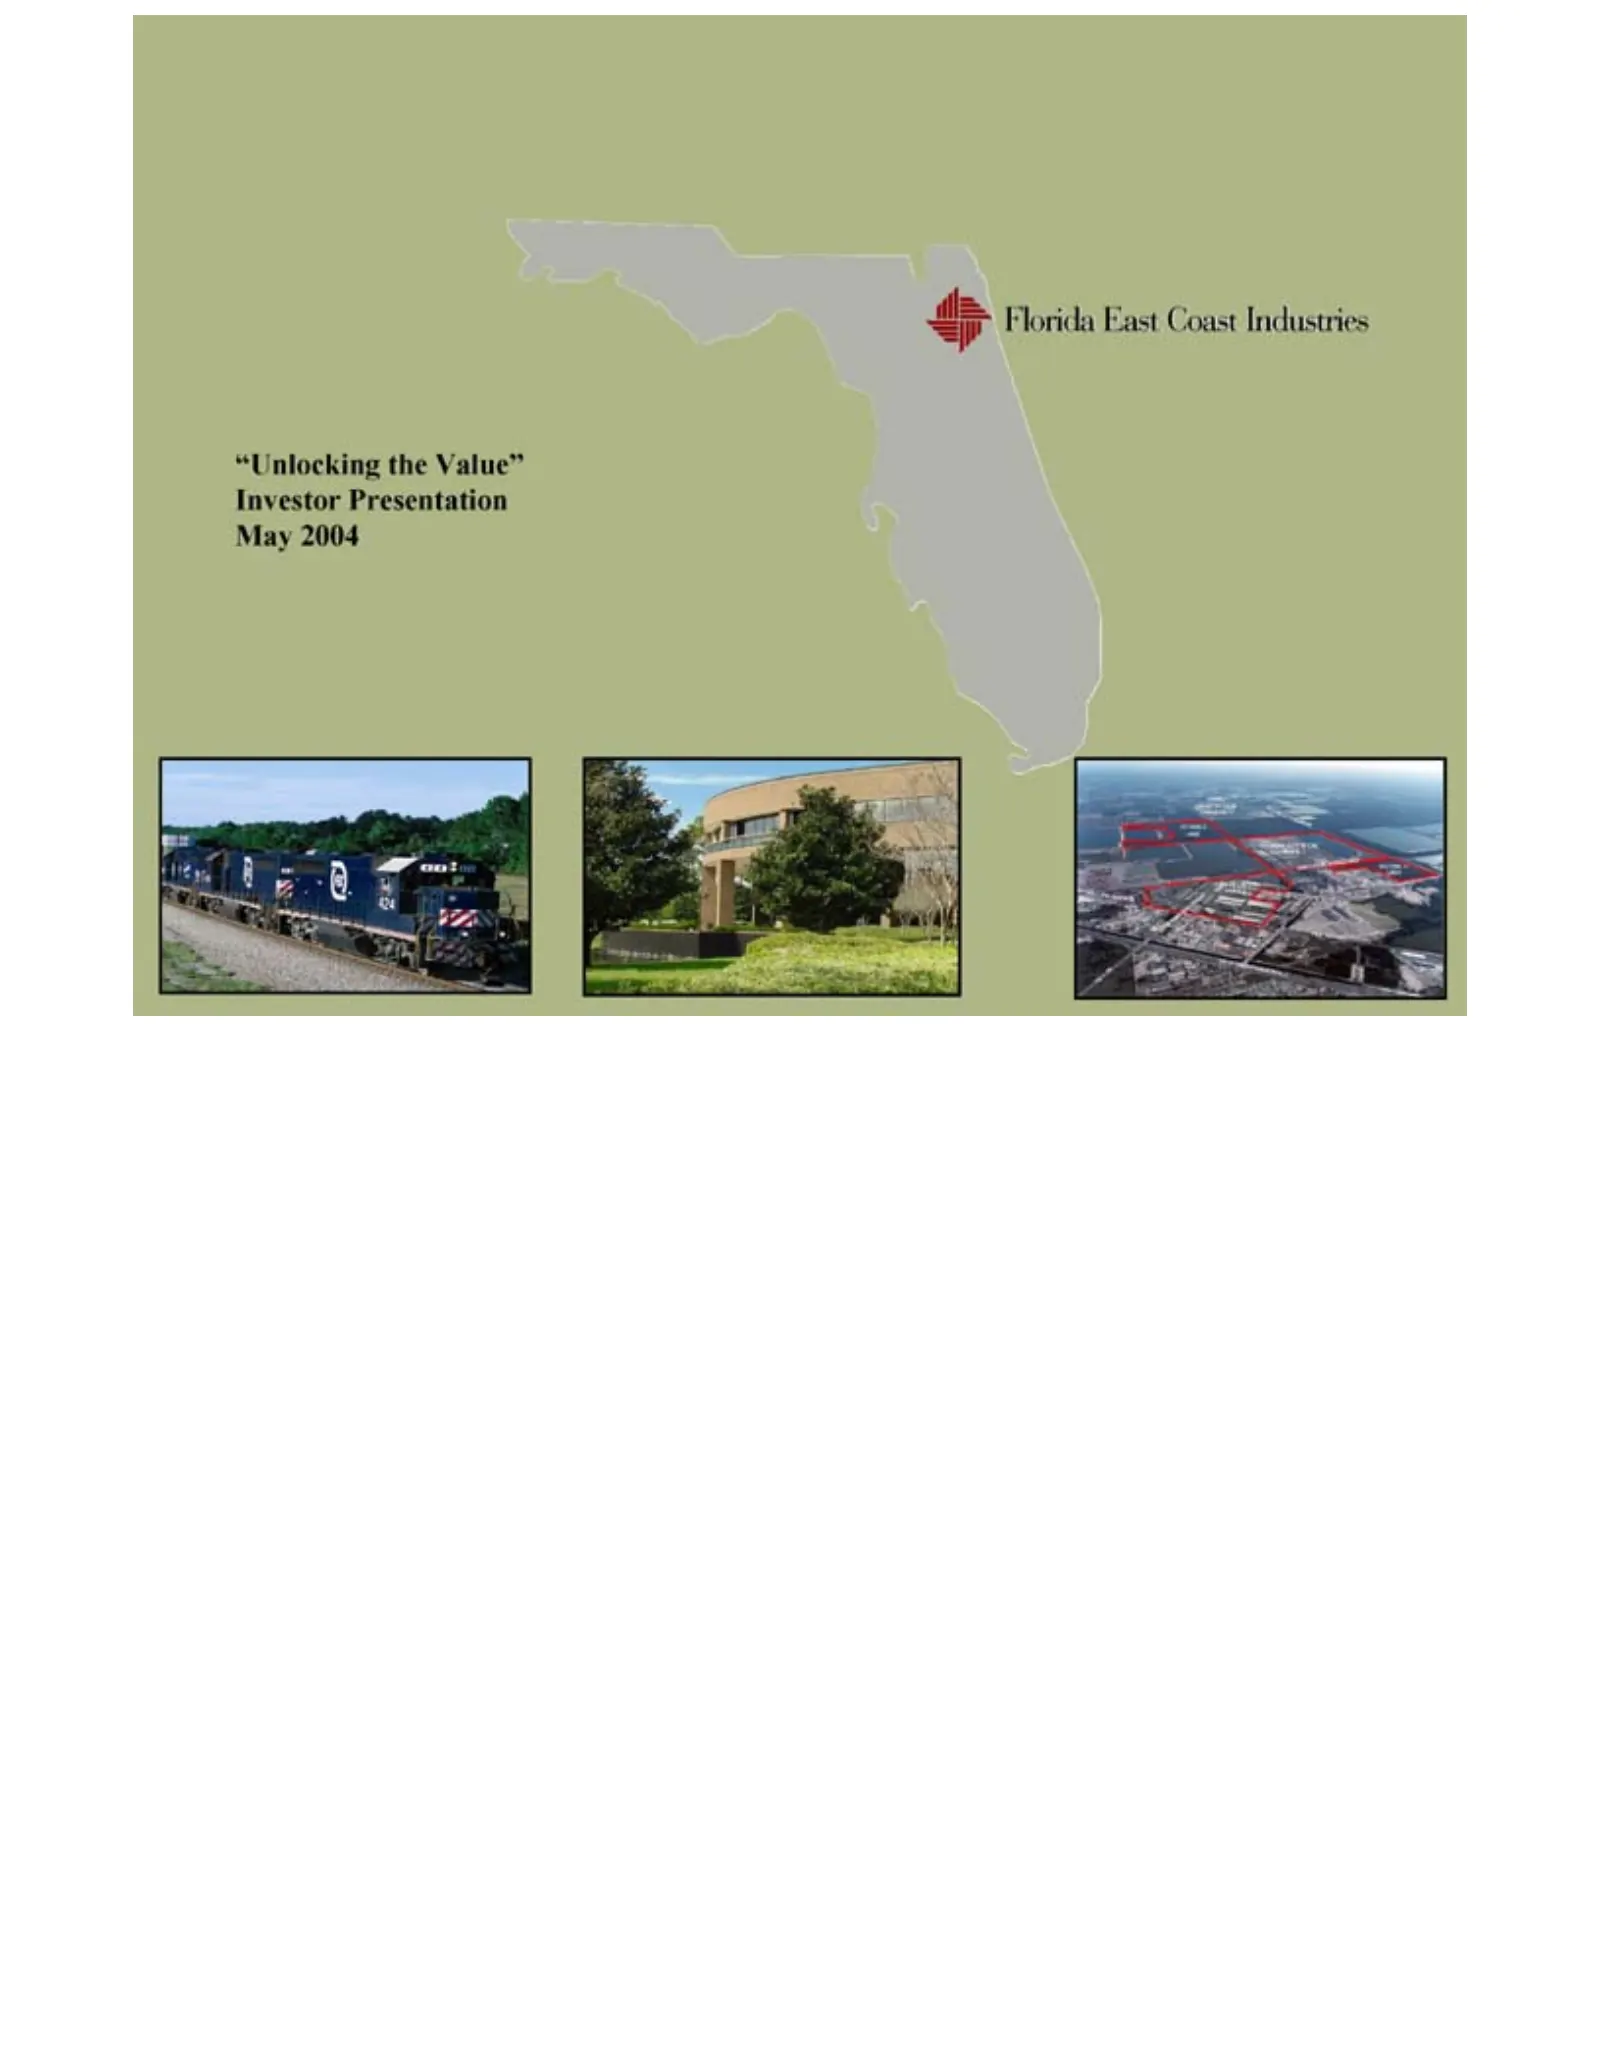
Slide 1: Unlocking the Value – Investor Presentation May 2004
“Unlocking the Value” Investor Presentation May 2004
Slide 2: Important Information / Forward-looking statements
Florida This amended. "expect," statements statements. the in information 2 the state presentation Company's East of"aim," These are Florida, Important contained Coast necessarily forward-looking "believe," contains filings Industries thefactors insoutheast with this based forward-looking "project,"
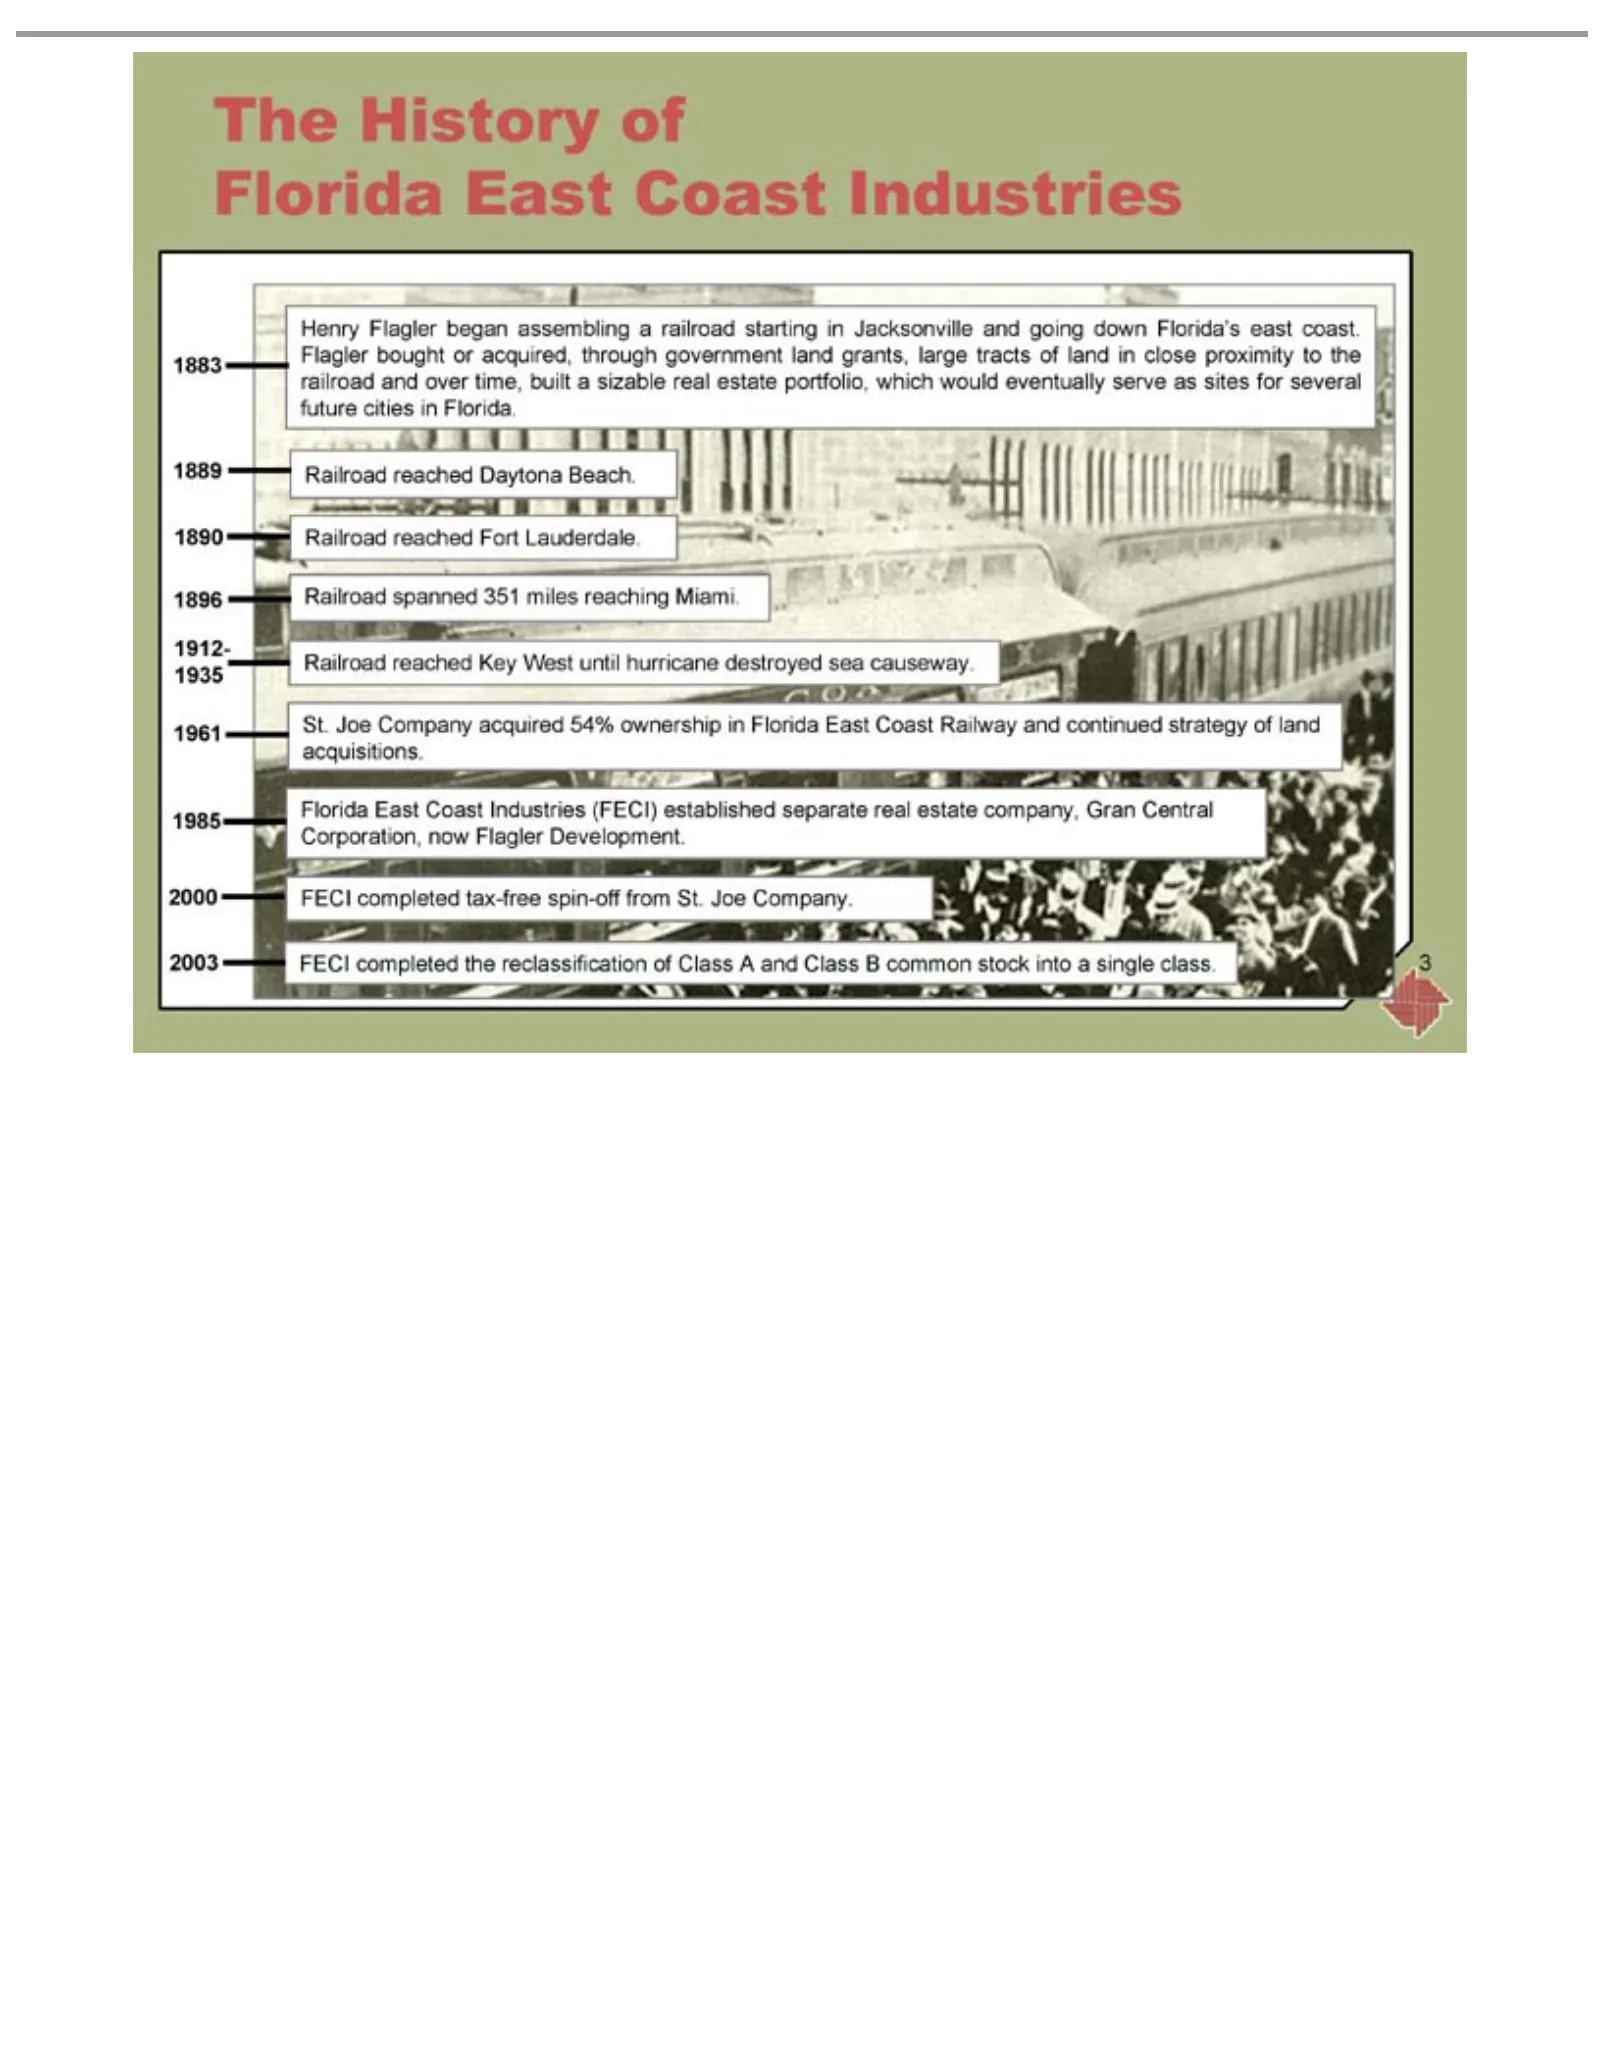
Slide 3: The History
The History Henry proximity 1883 1889 1890 1896 Railroad 1912- 1961 1935 Florida Corporation, 1985 2000 2003 3 railroad Railroad St. FECI Flagler East Joe reached tocompleted of Coast Company the now and began reached spanned Key over Flagler Industries assembling West tax-free the Daytona Fort acqu
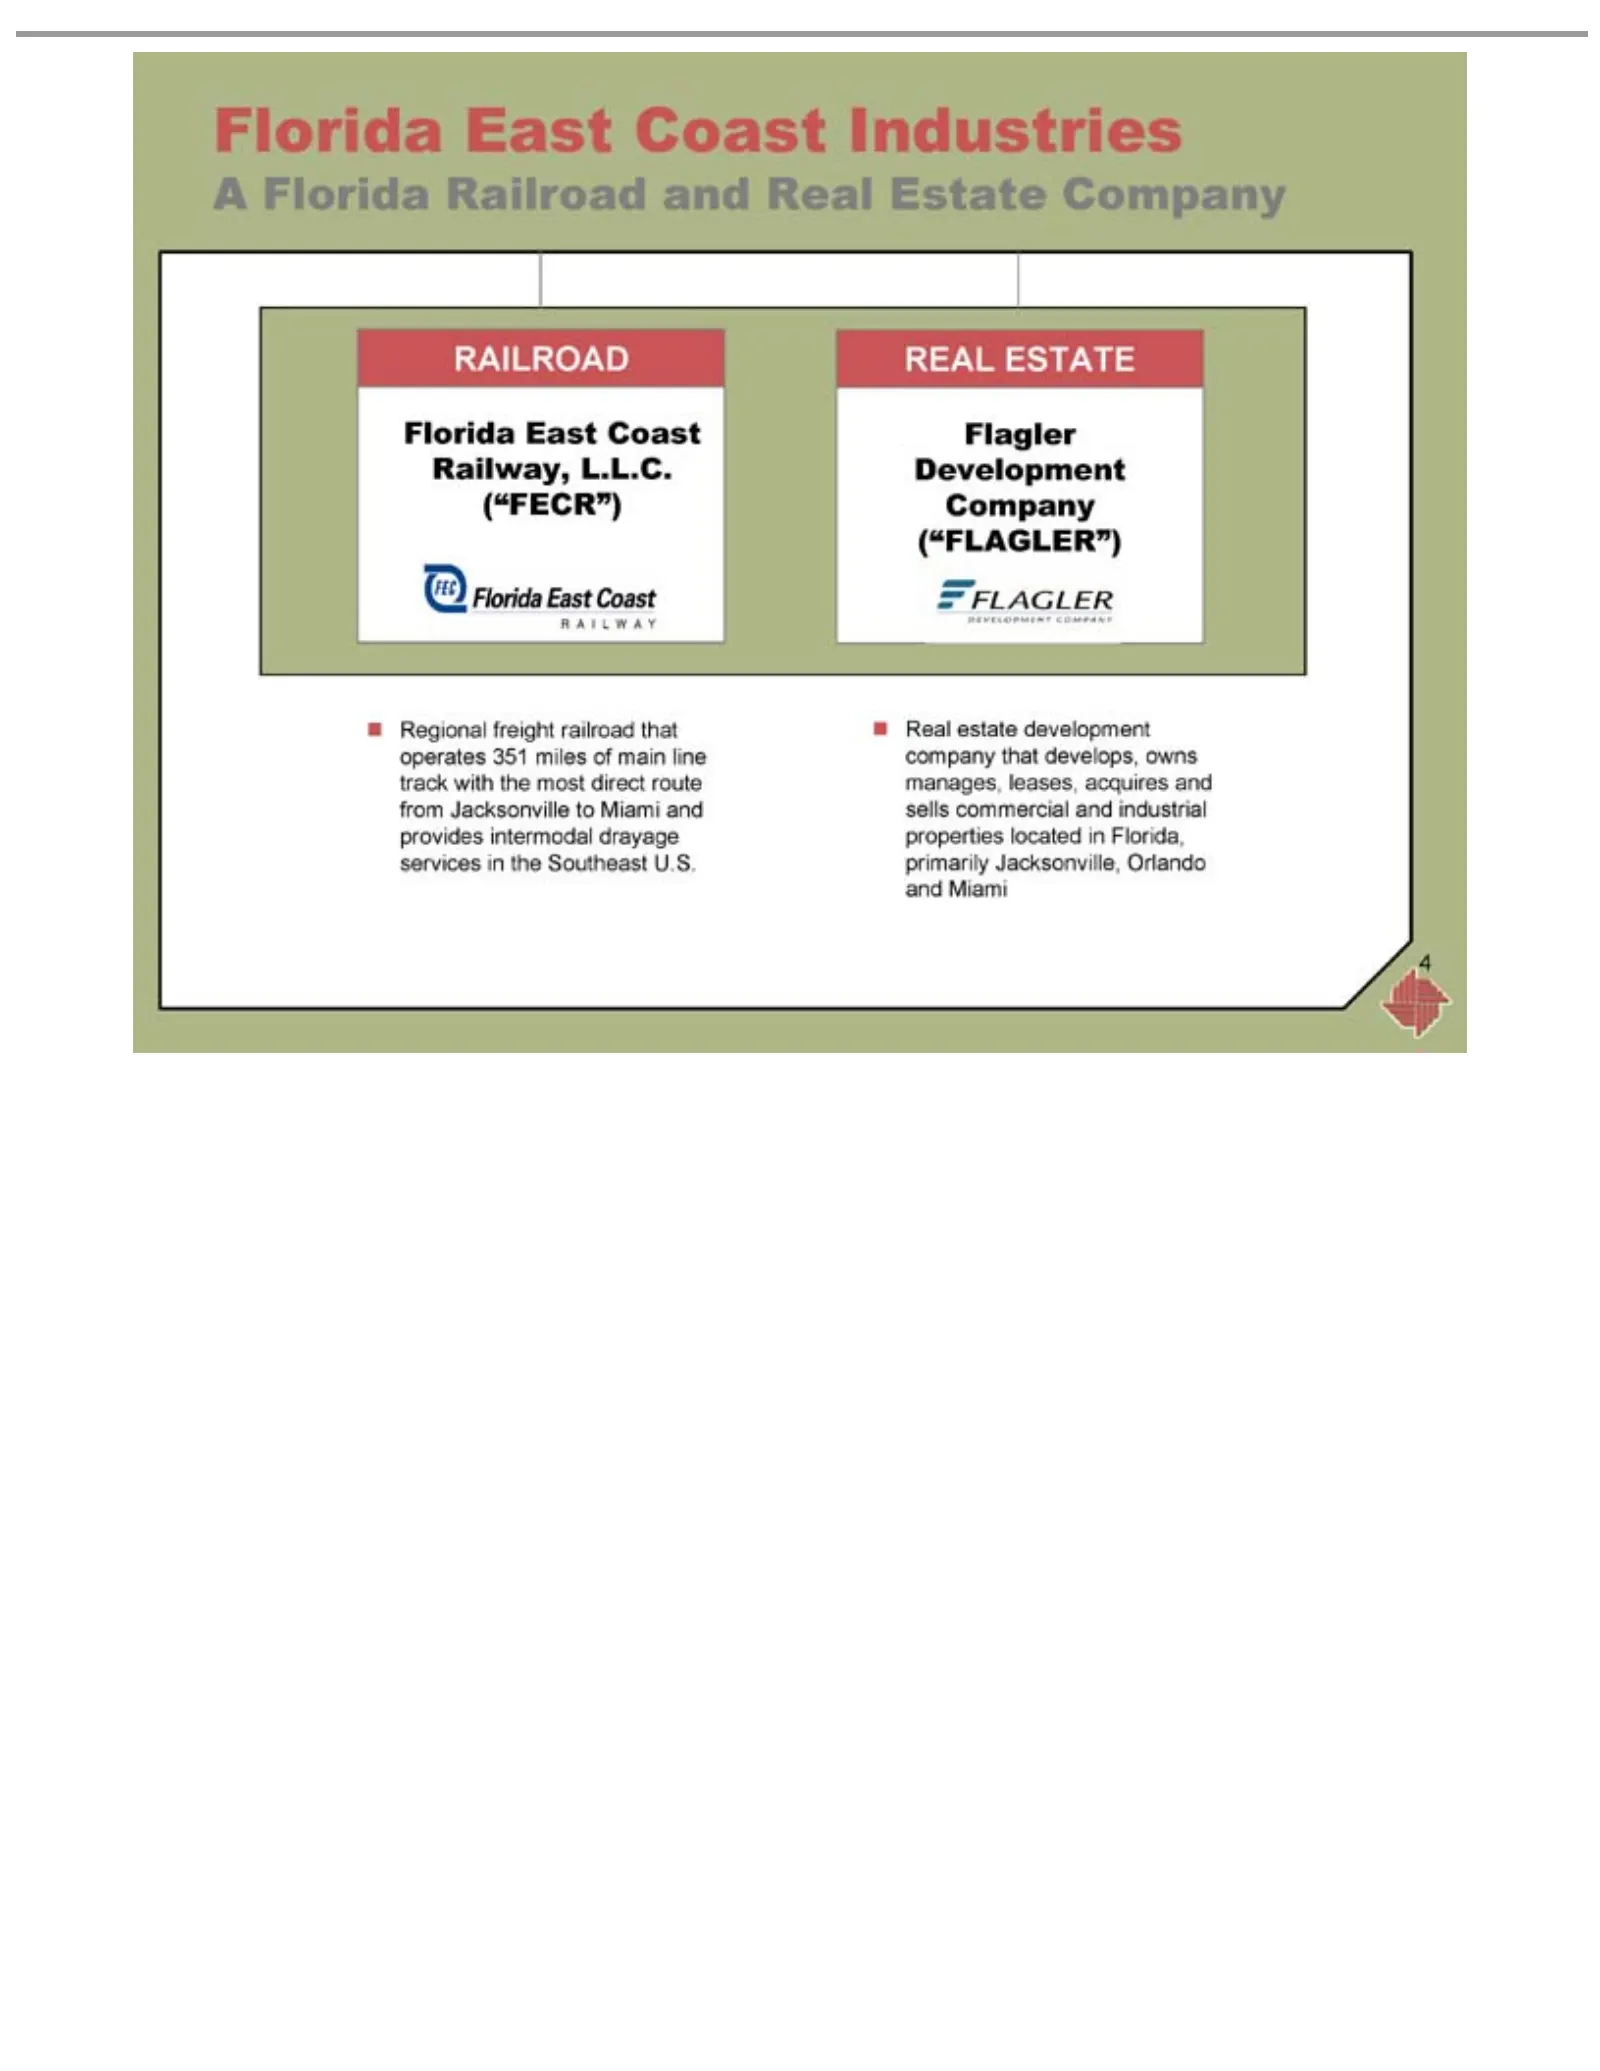
Slide 4: A Real Florida Railroad and Real Estate Company
AReal Florida RAILROAD (“FECR”) REAL ?Flagler 4 Regional Florida estate ESTATE Development East Railroad freight Coast development railroad Industries Railway, andCompany Real company that L.L.C. Estate operates (“FLAGLER”) Company that351 develops, miles of owns main manages, line track leases, wit
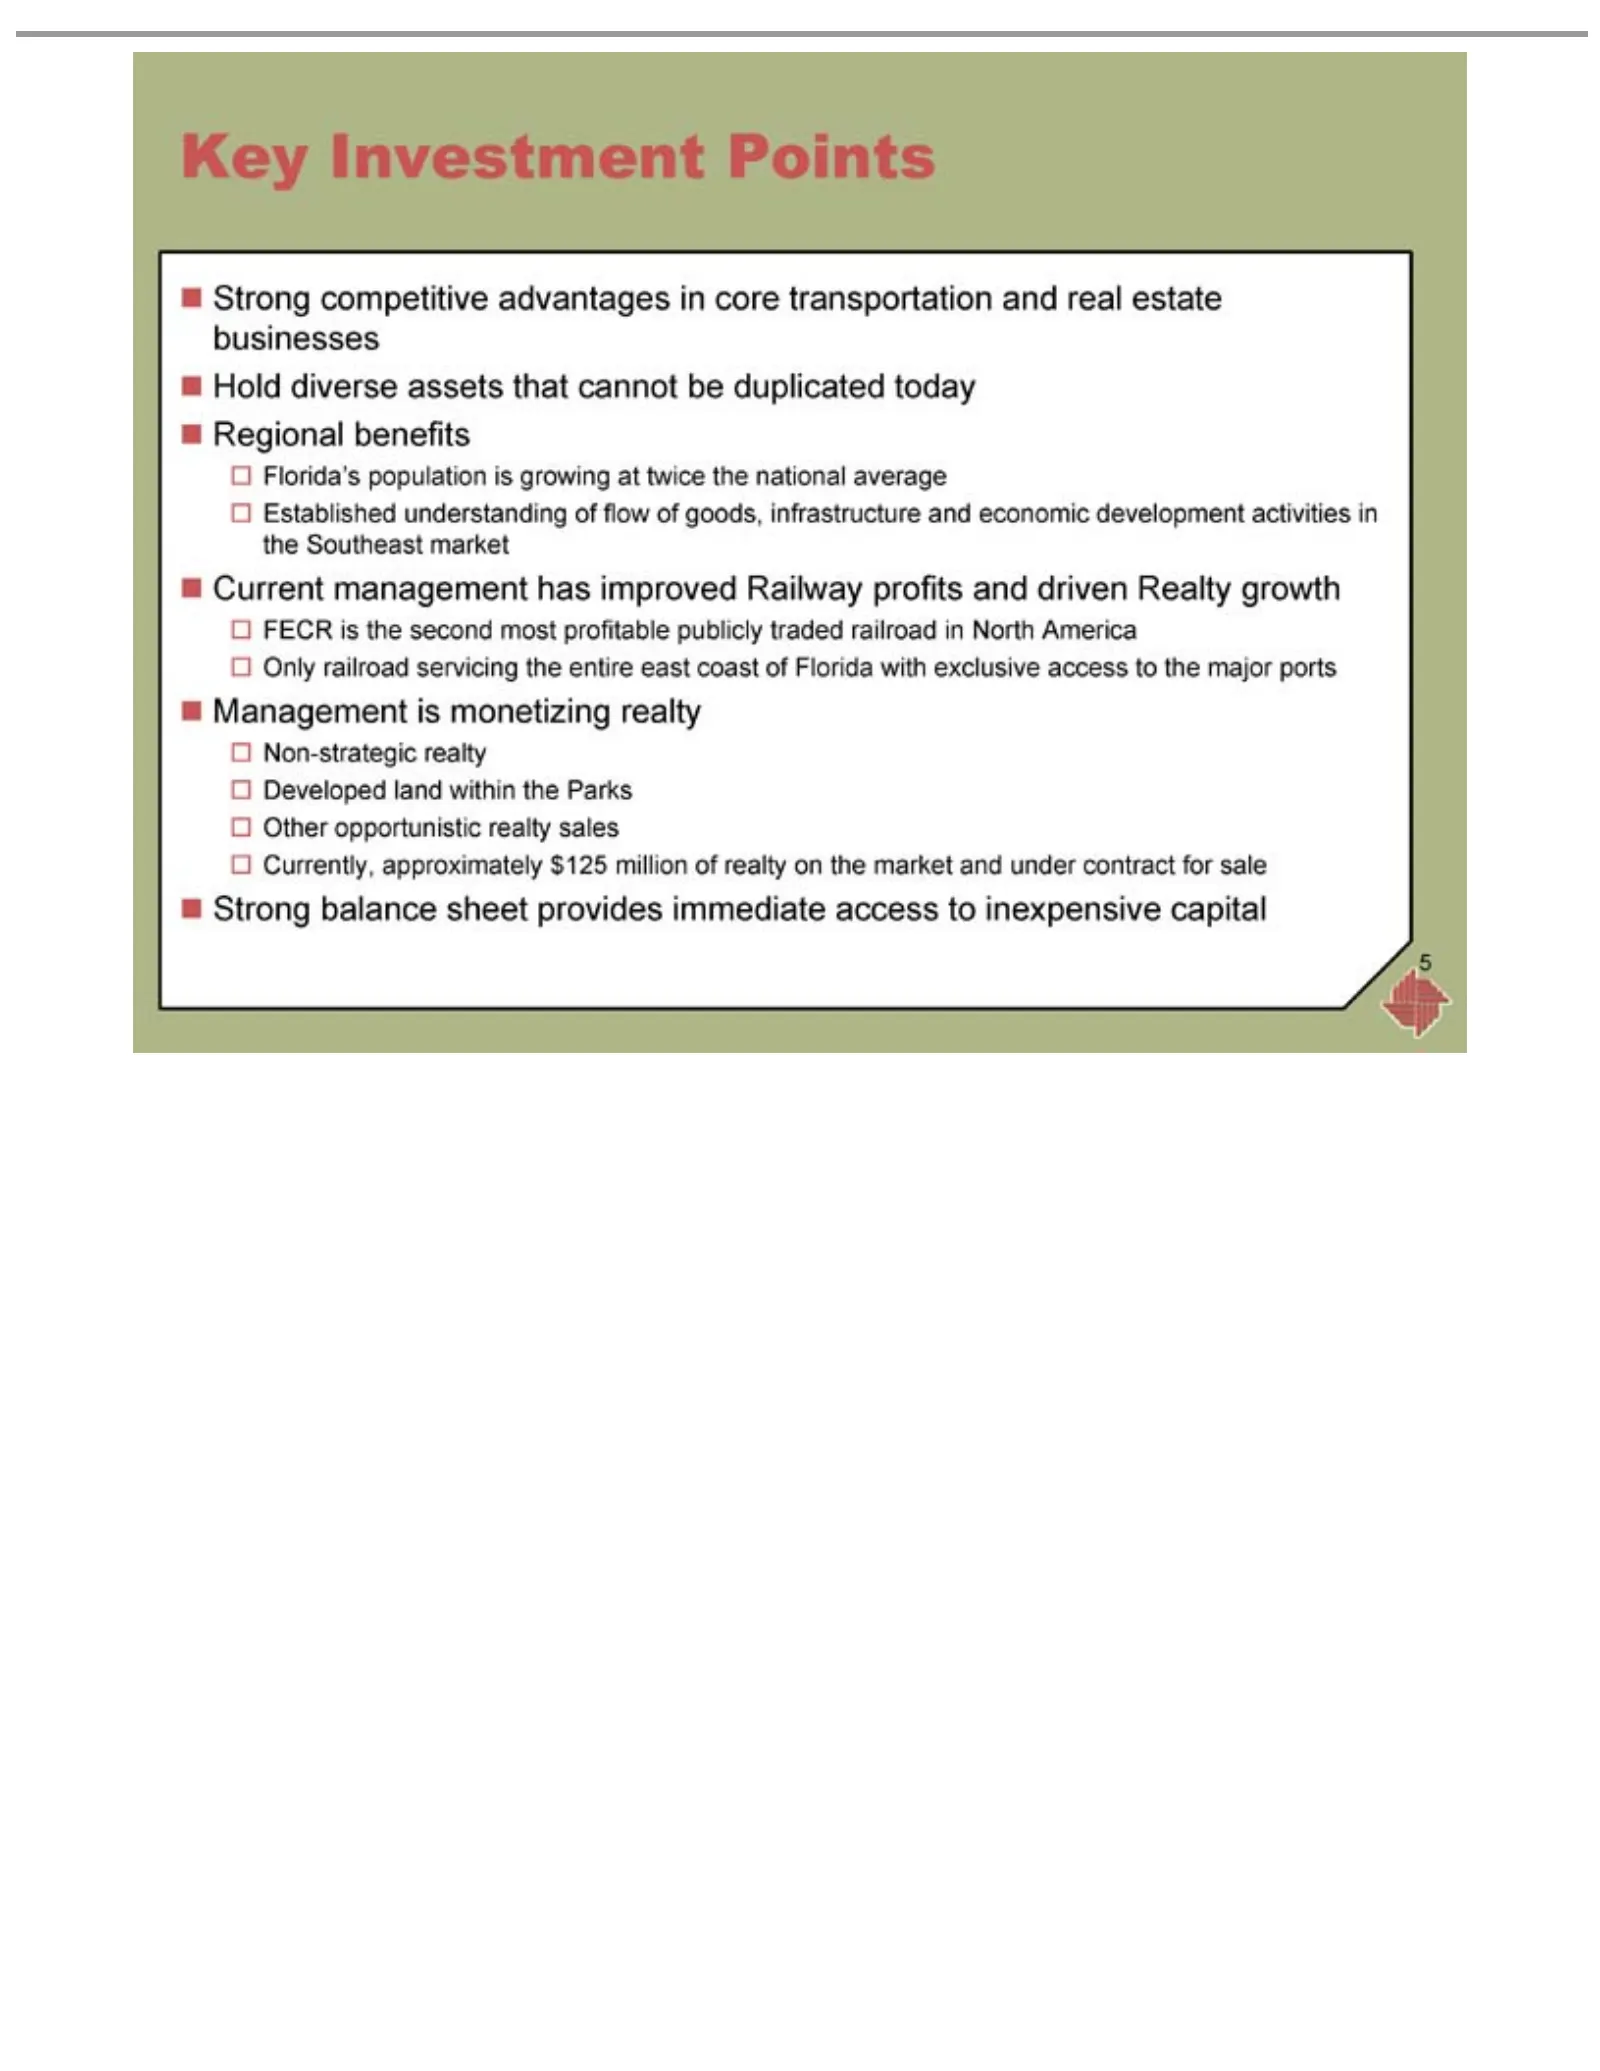
Slide 5: Key Investment Points
?Key 5 Hold Regional Florida’s Established Current FECR Only Management Non-strategic Developed Other Currently, Strong Investment diverse railroad opportunistic is competitive balance management the population benefits approximately land understanding second assets is servicing realty Points sheet
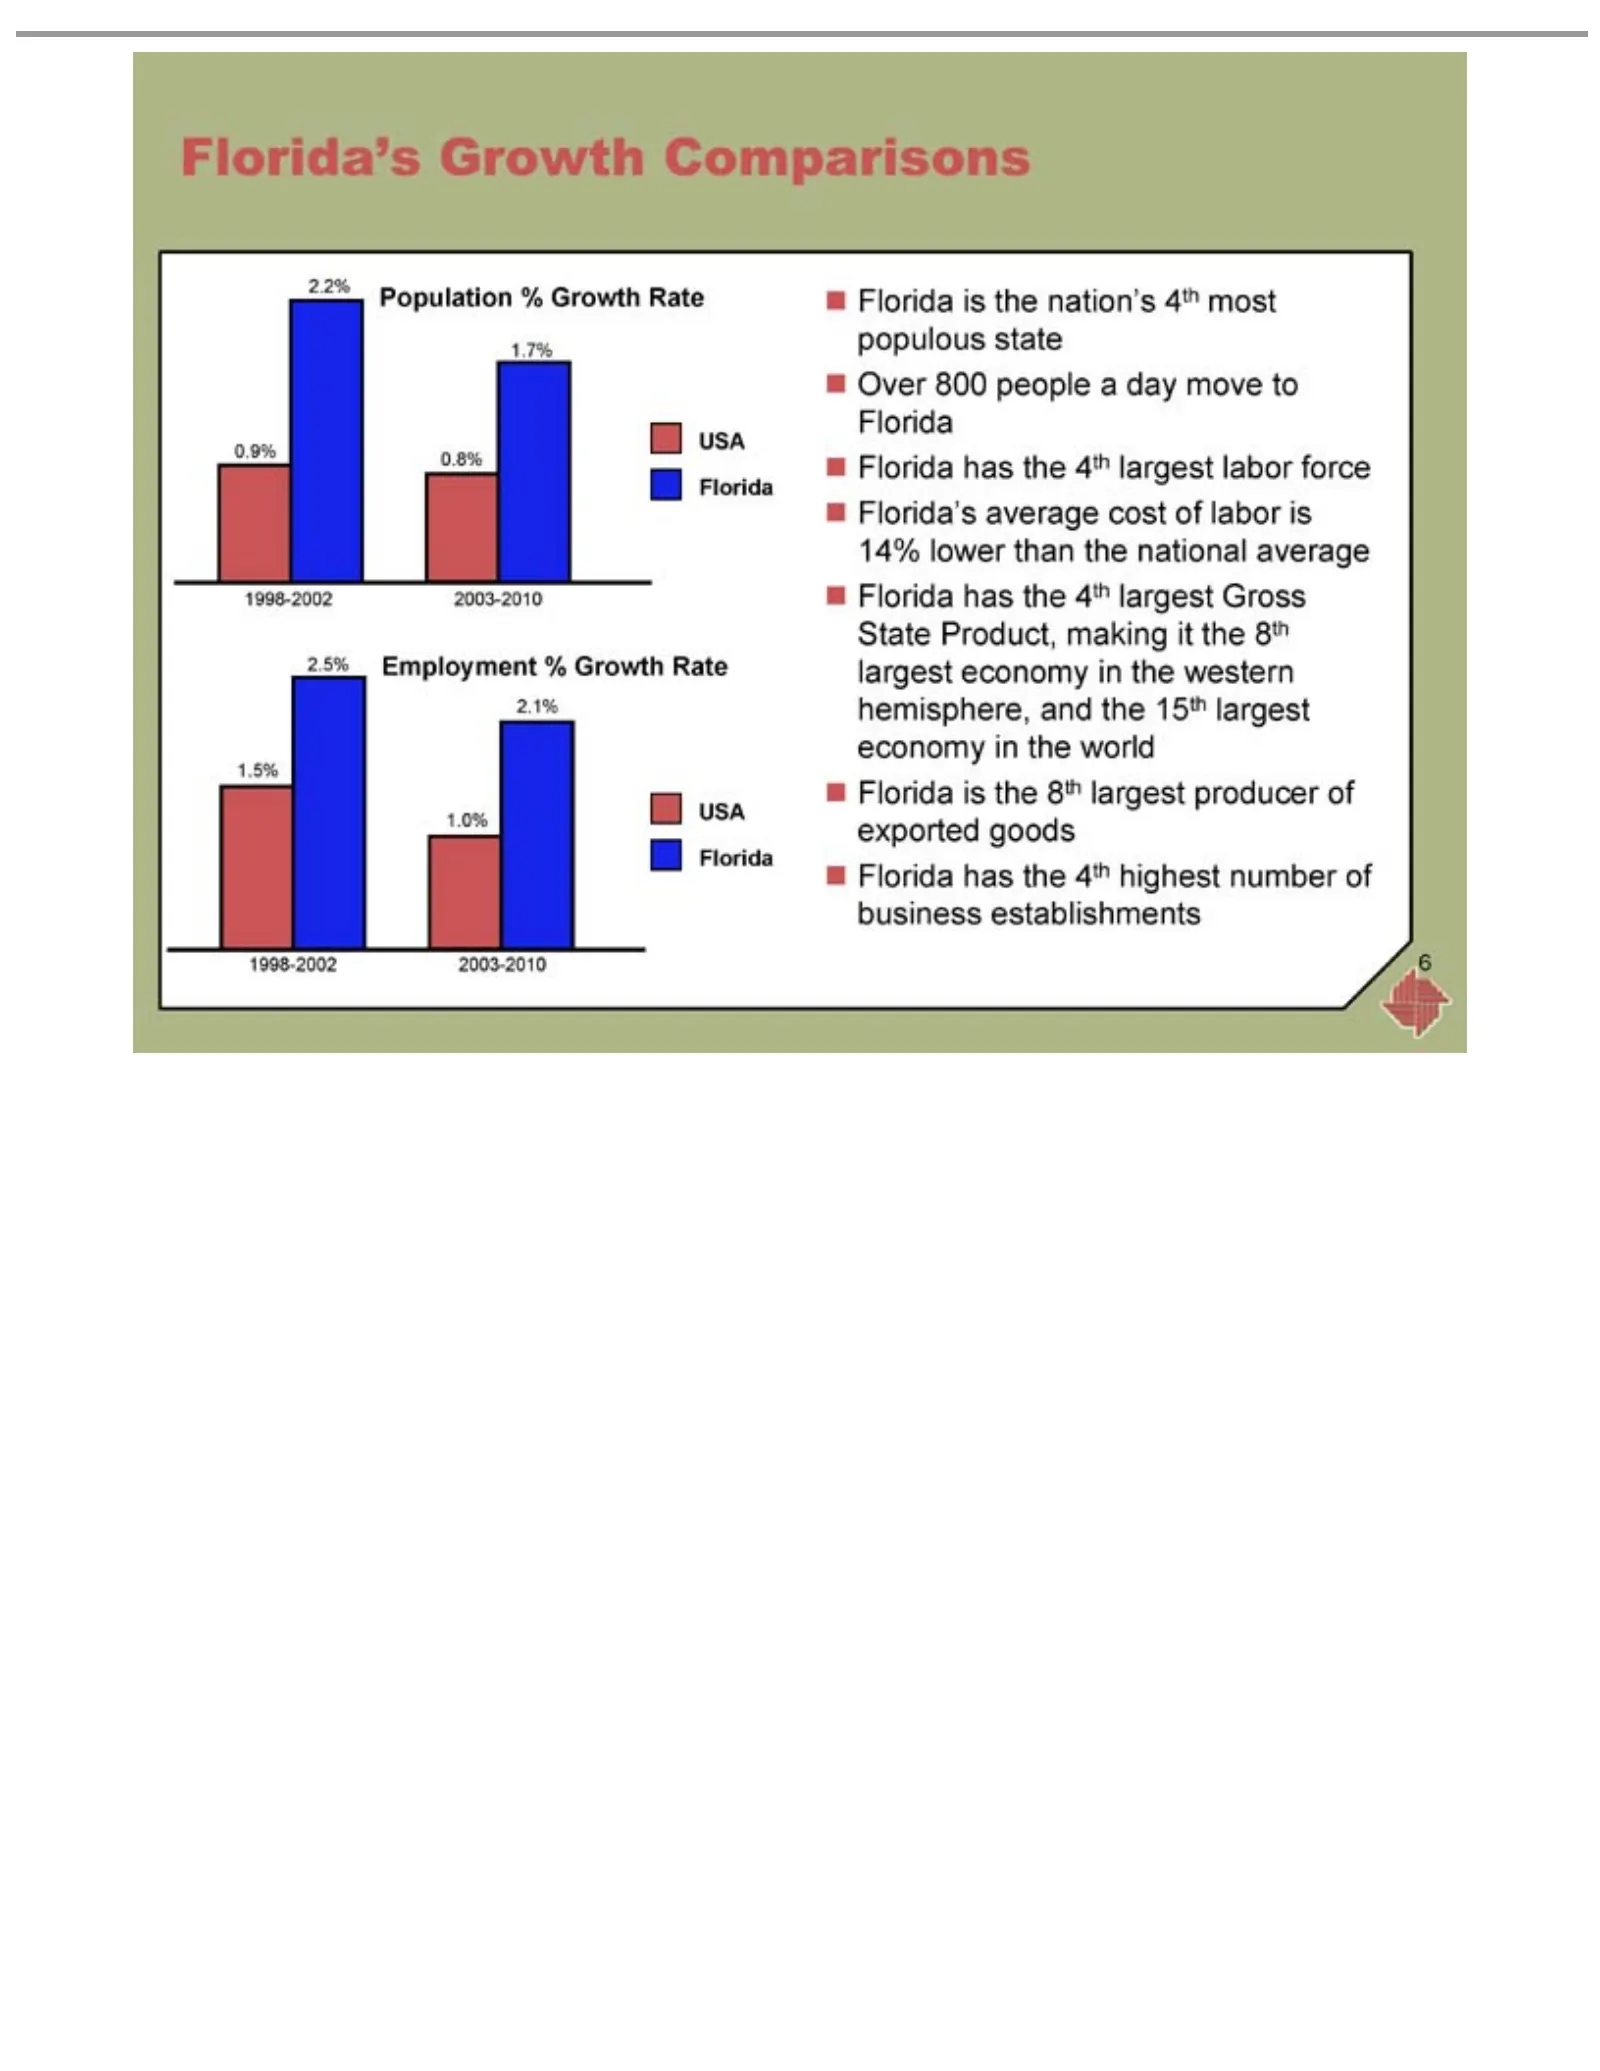
Slide 6: Florida's Growth Comparisons vs USA
Florida’s 2.2% 0.9% USA 1.7% 2.5% 1.0% 1.5% 2.1% 1998-2002 ?Florida 6 OverUSA Florida’s Florida Population 0.8% Employment 800 Growth isaverage has 2003-2010 people the the8th nation’s 4th Comparisons alargest cost day largest highest %%4th of Growth move Growth producer labor most labor Gross numbe
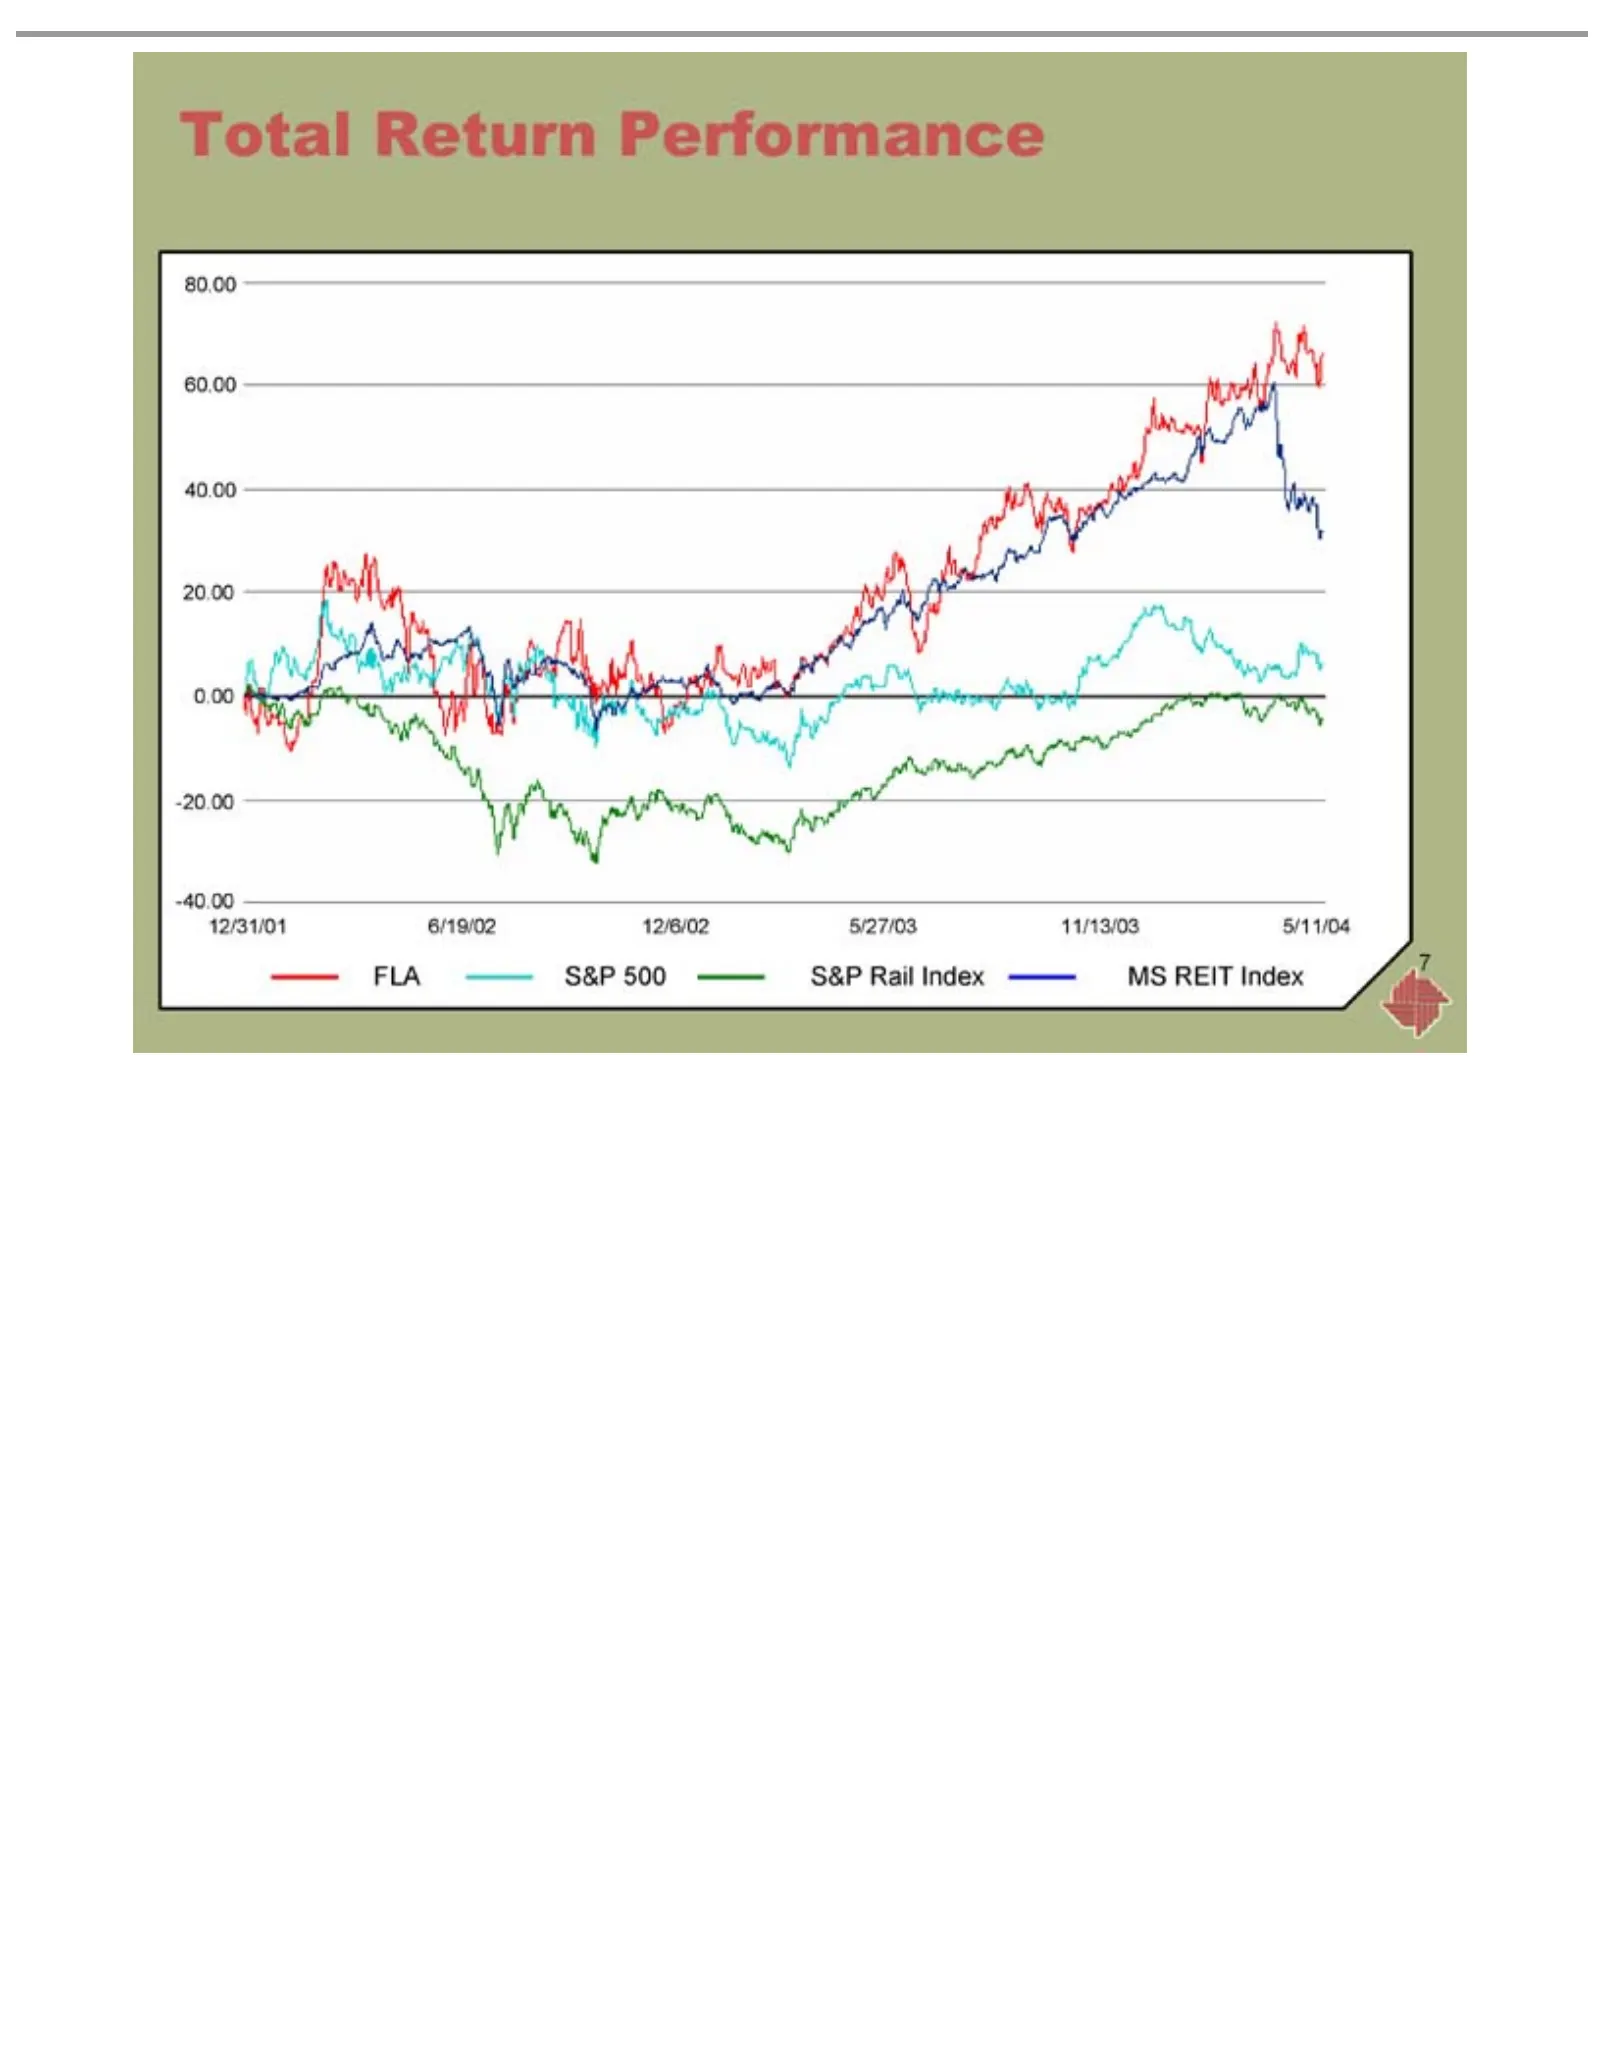
Slide 7: Total Return Performance
Total 12/31/01 -40.00 -20.00 0.00 20.00 40.00 60.00 80.00 F 7 LA S&P Return 6/19/02 500Performance S&P12/6/02 Rail Index 5/27/03 MS11/13/03 REIT Index 5/11/04
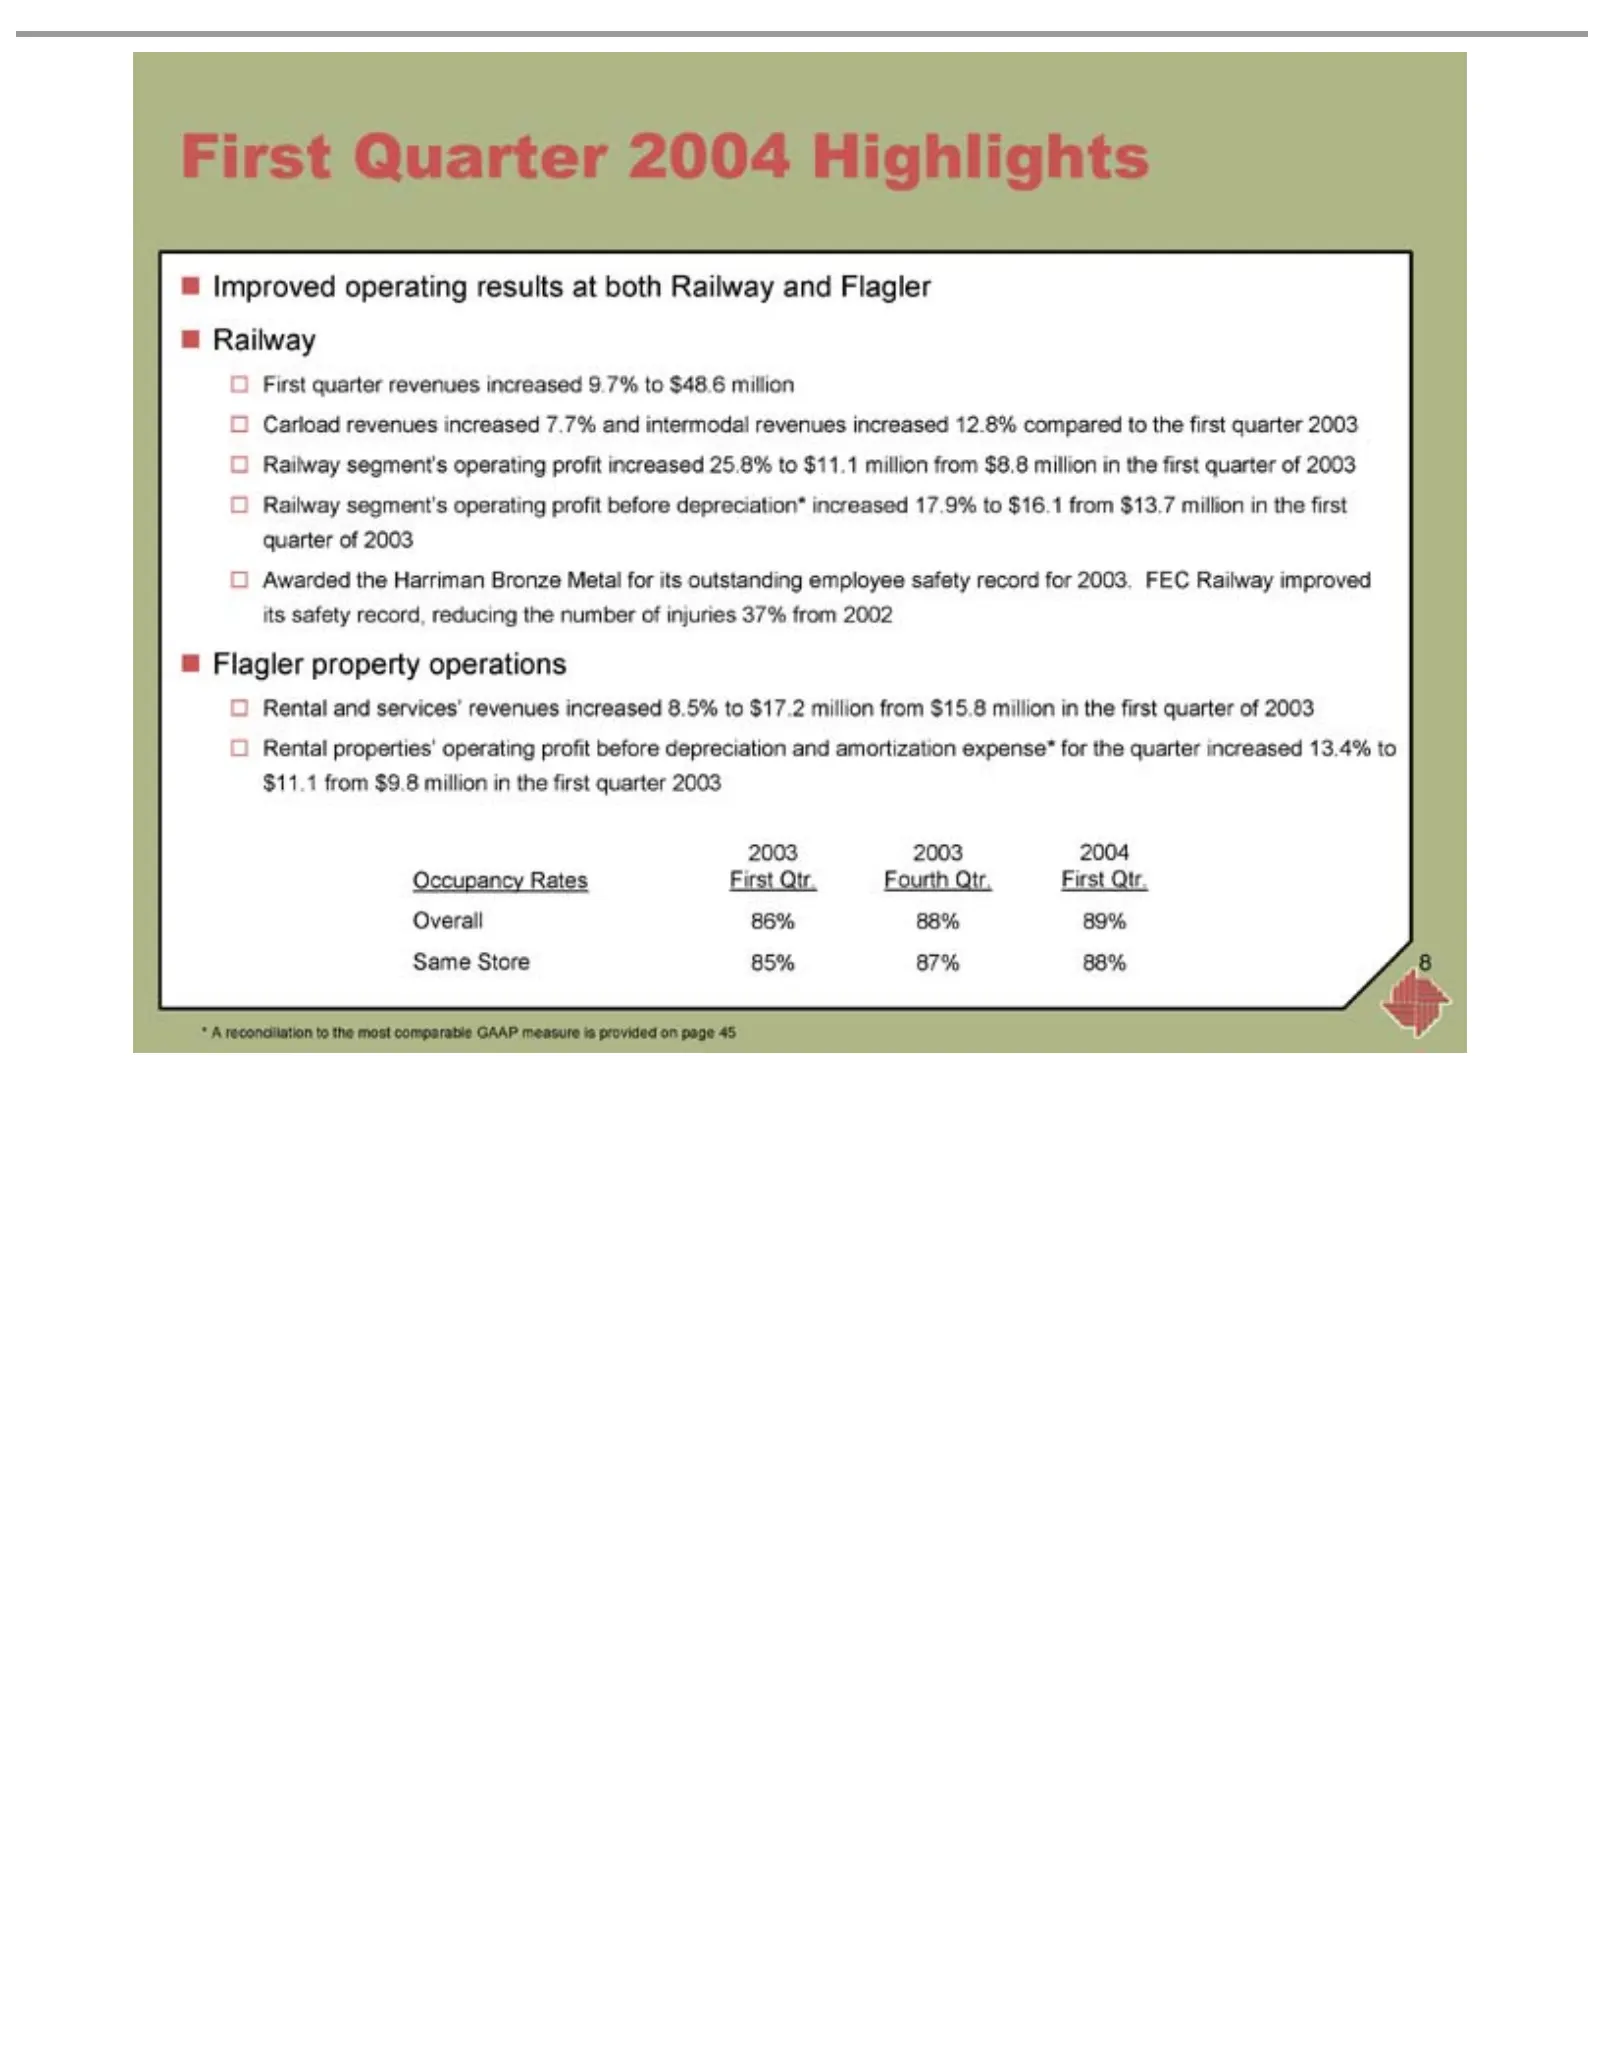
Slide 8: First Quarter 2004 Highlights
?First 2003 Occupancy Overall Same * 8 Awarded Improved First Carload Railway Flagler Rental A reconciliation Quarter 2003 Store quarter 86% and properties’ property revenues segment’s the 2004 Rates operating 85% services’ 88% 2004 revenues Harriman 87% First to operations 89% Highlights increased
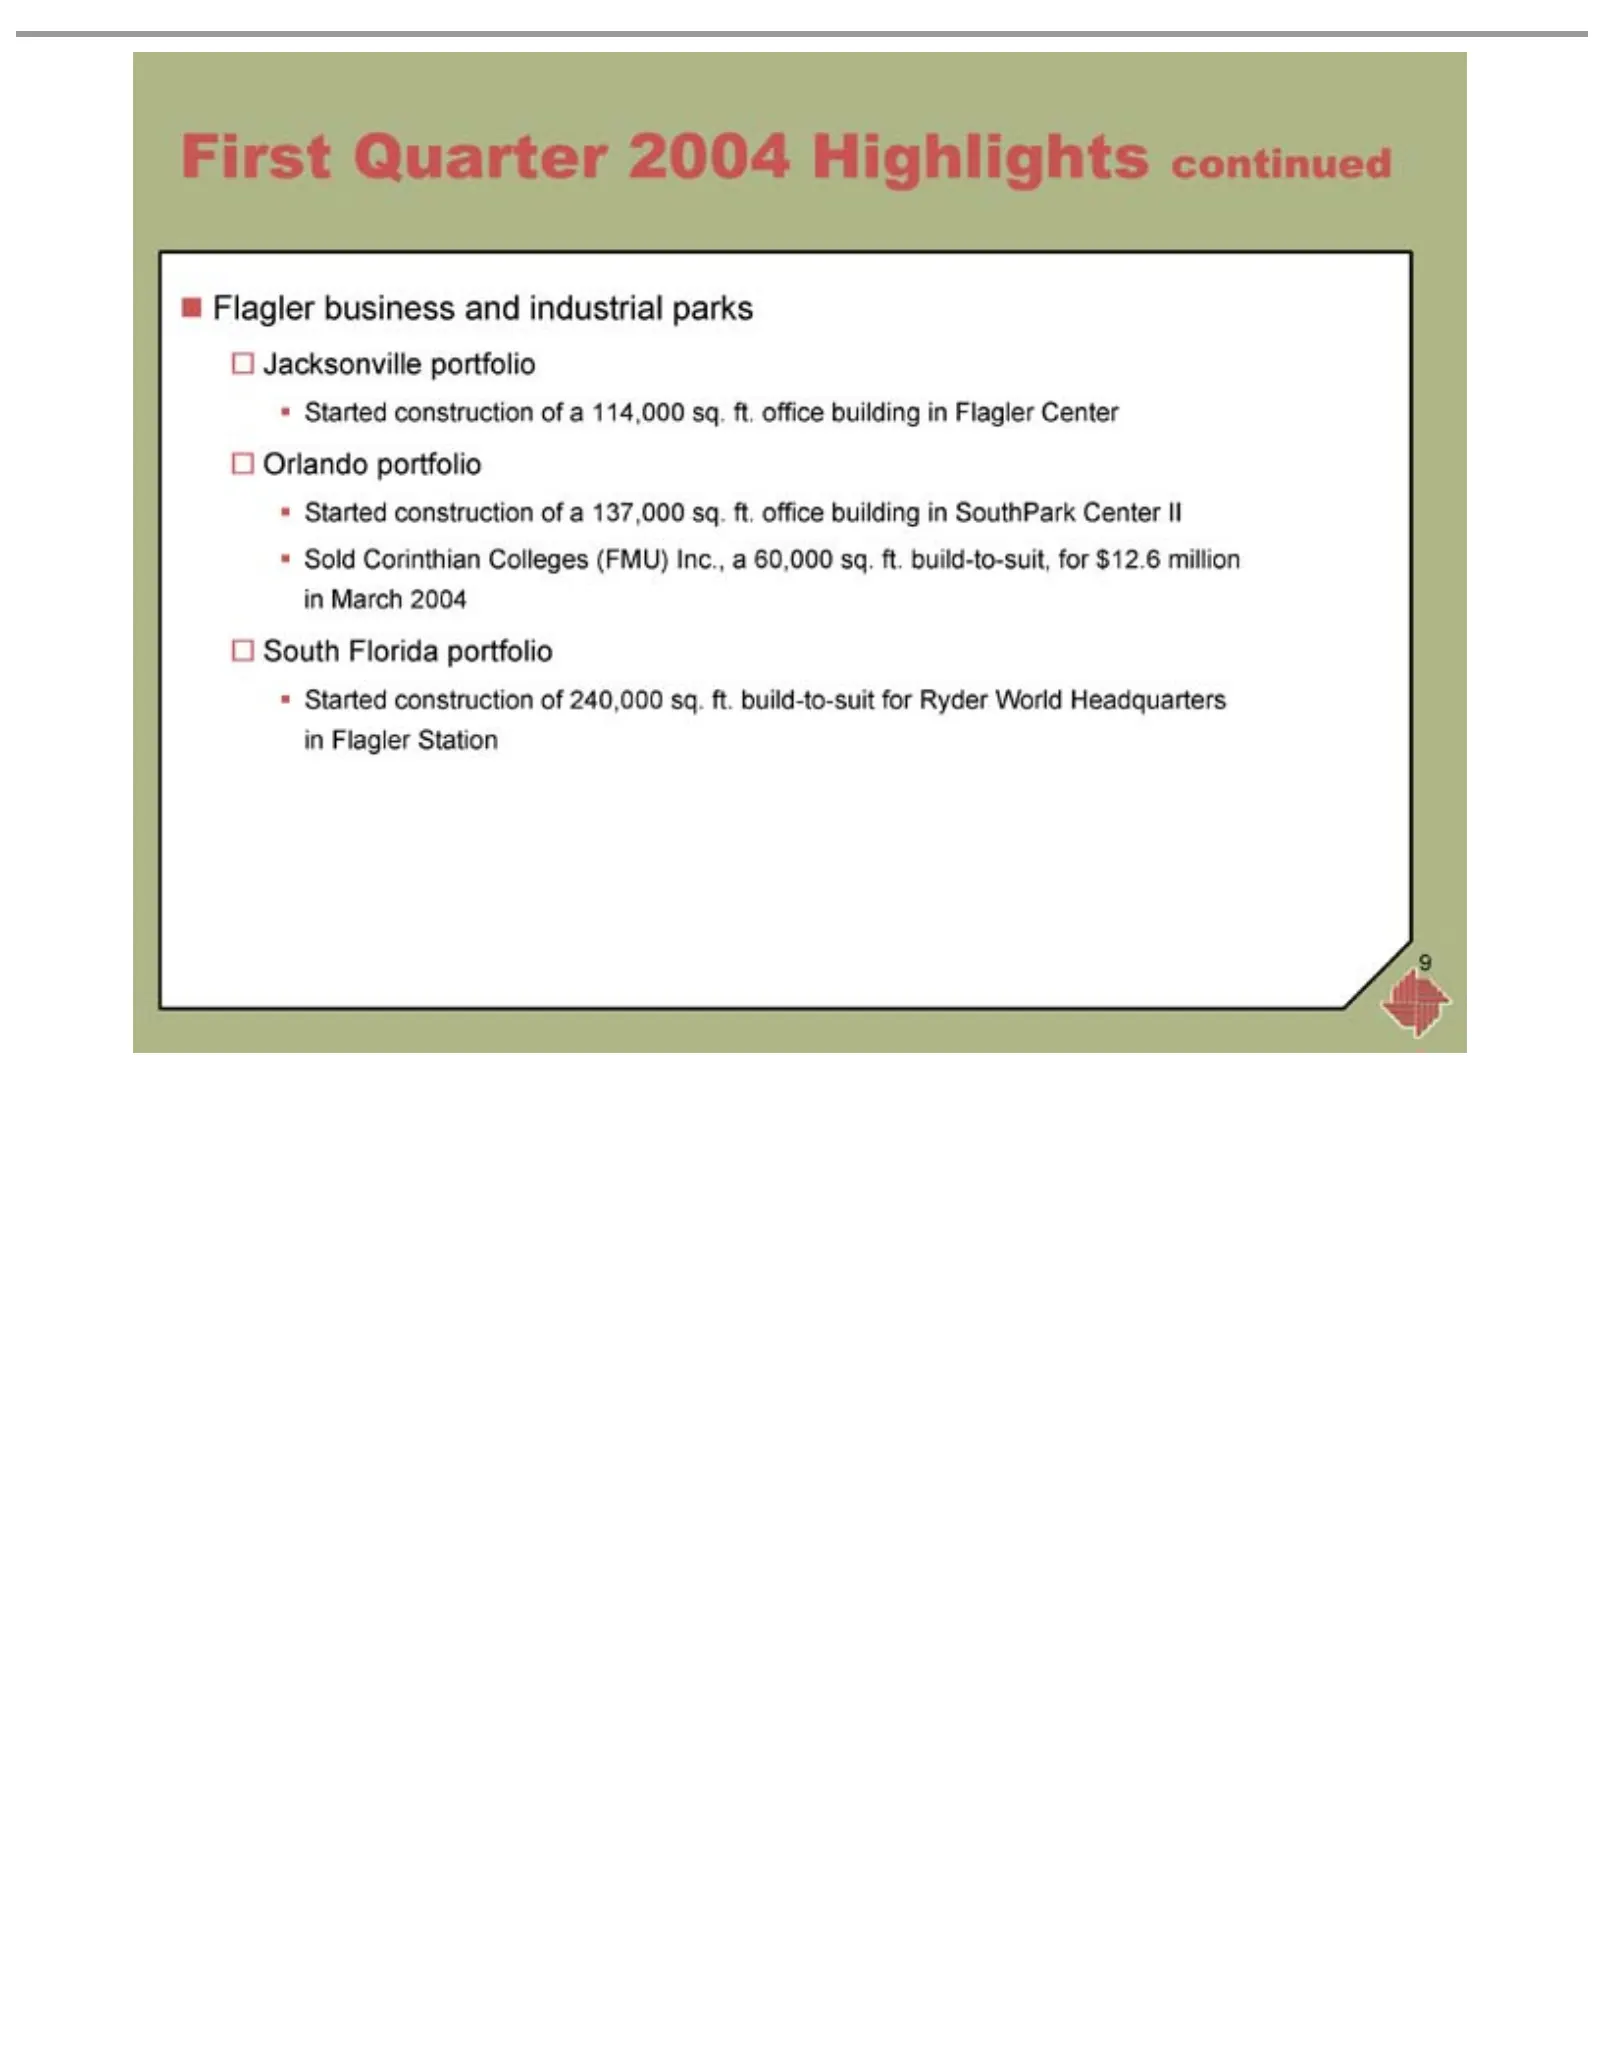
Slide 9: First Quarter 2004 Highlights – Flagler
?First ?Started 9 Flagler Jacksonville Orlando South Quarter Florida construction business portfolio 2004 portfolio portfolio and Highlights ofindustrial a 137,000 240,000 114,000 continued parks sq.sq.ft.ft.build-to-suit office building for Ryder in Flagler SouthPark WorldCenter Headquarters Center
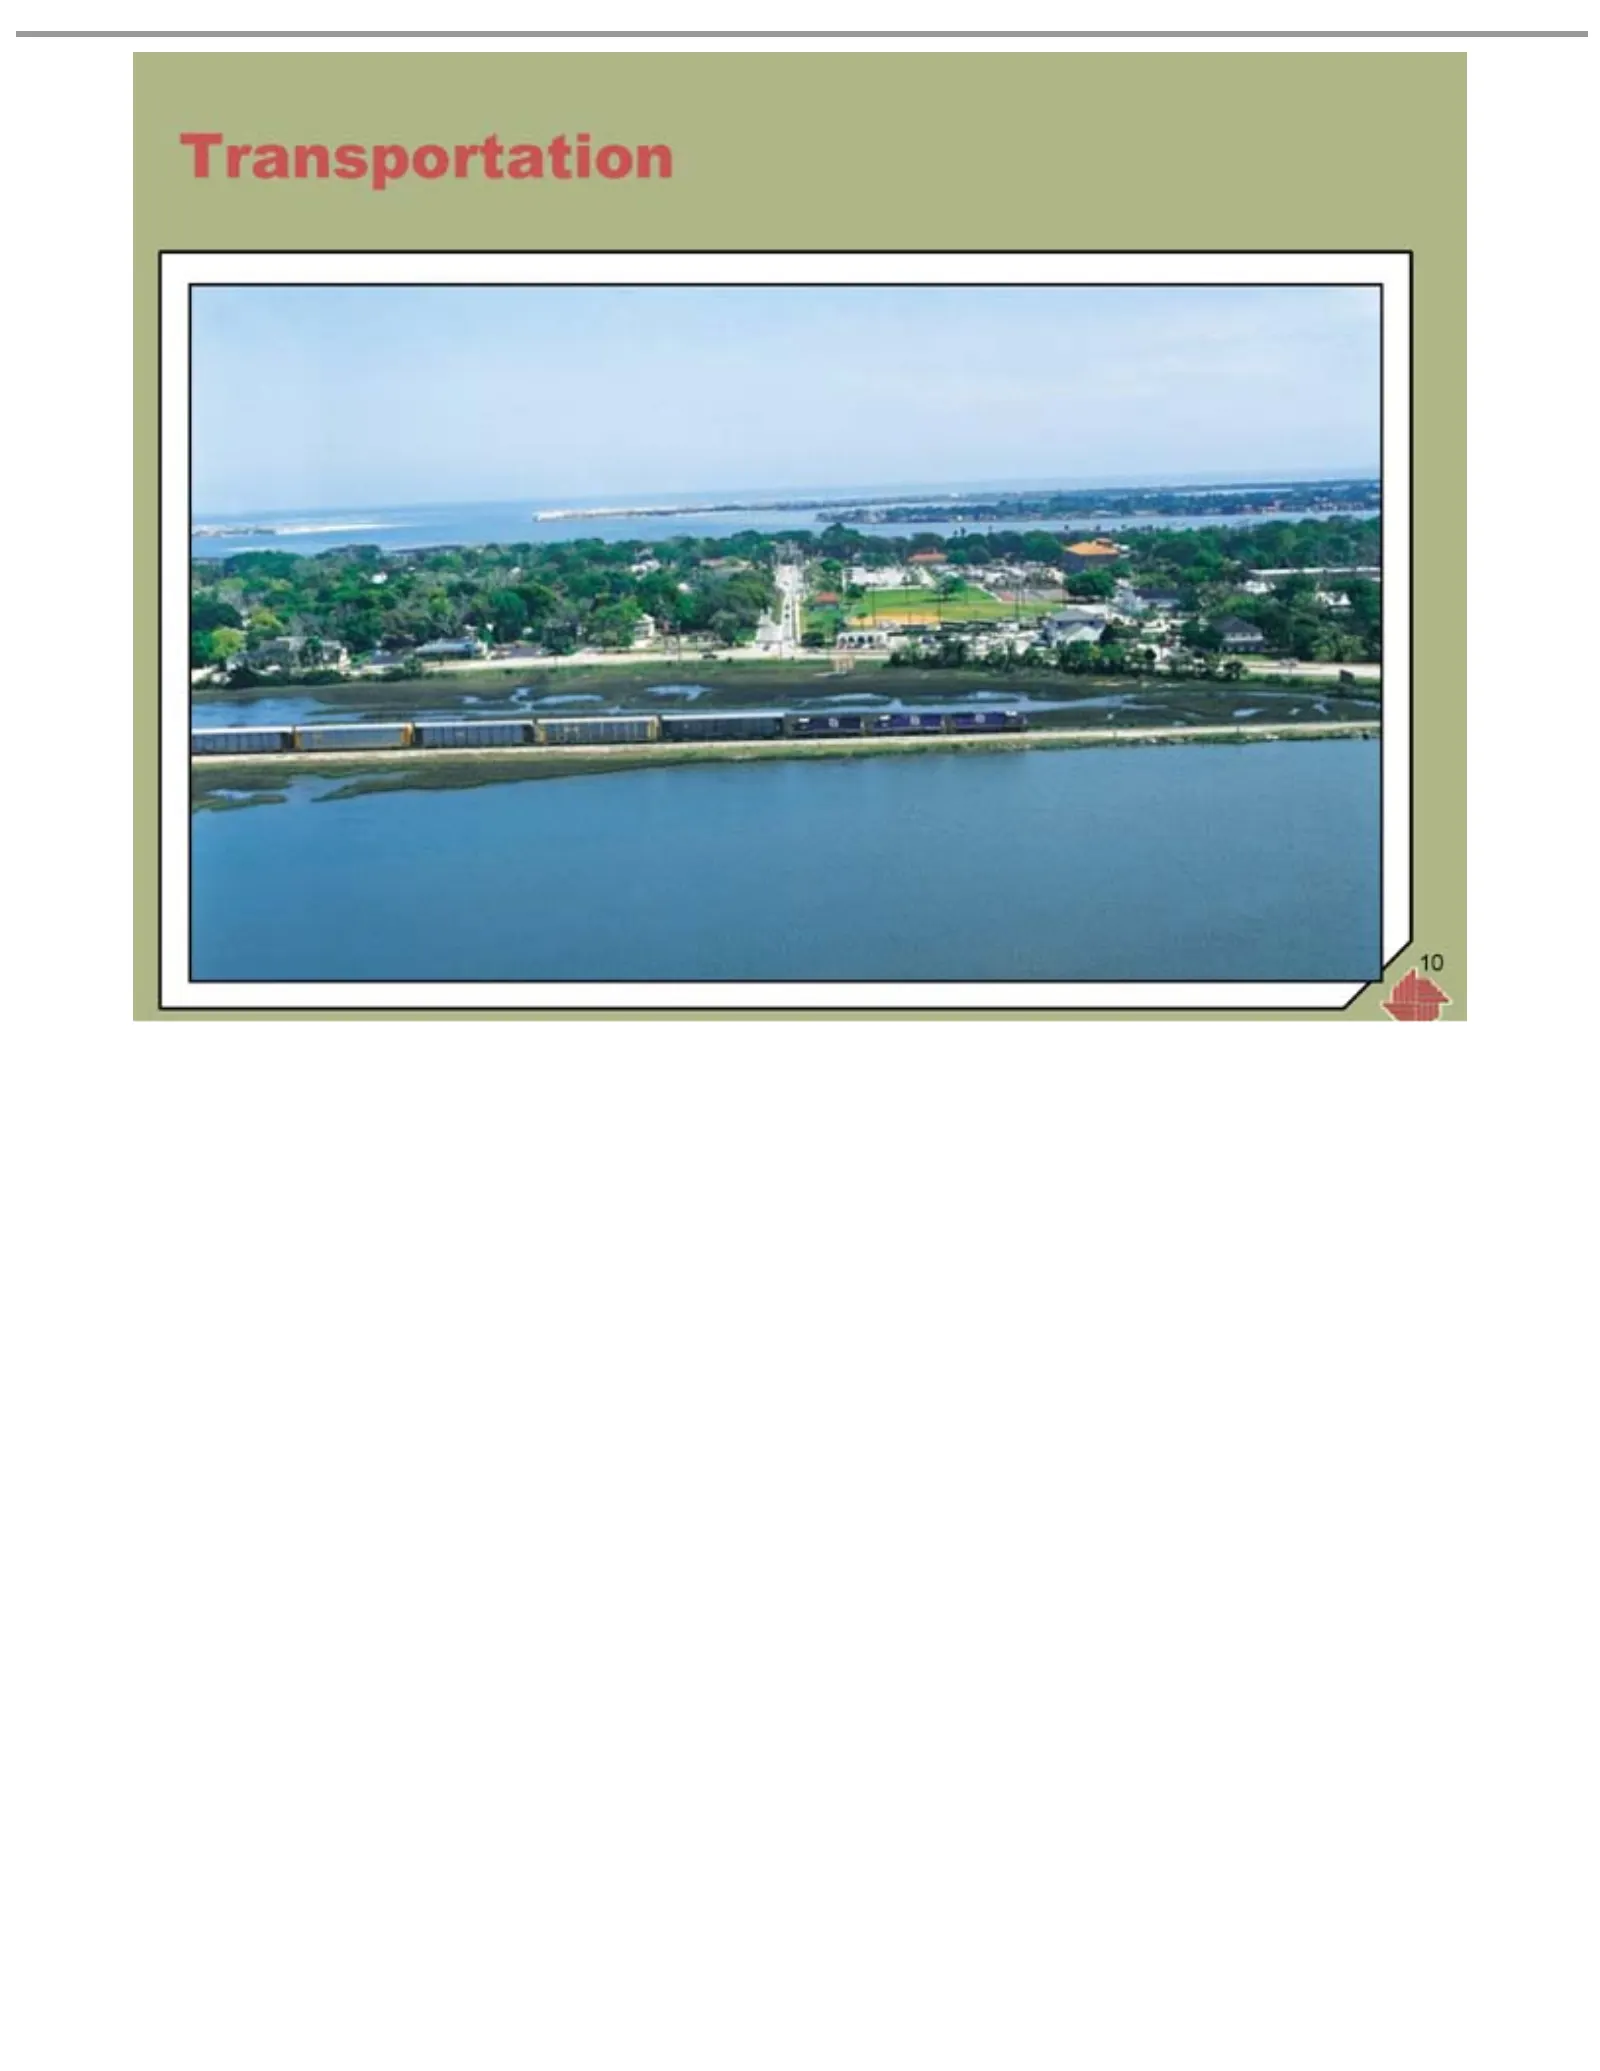
Slide 10: Transportation
10 Transportation
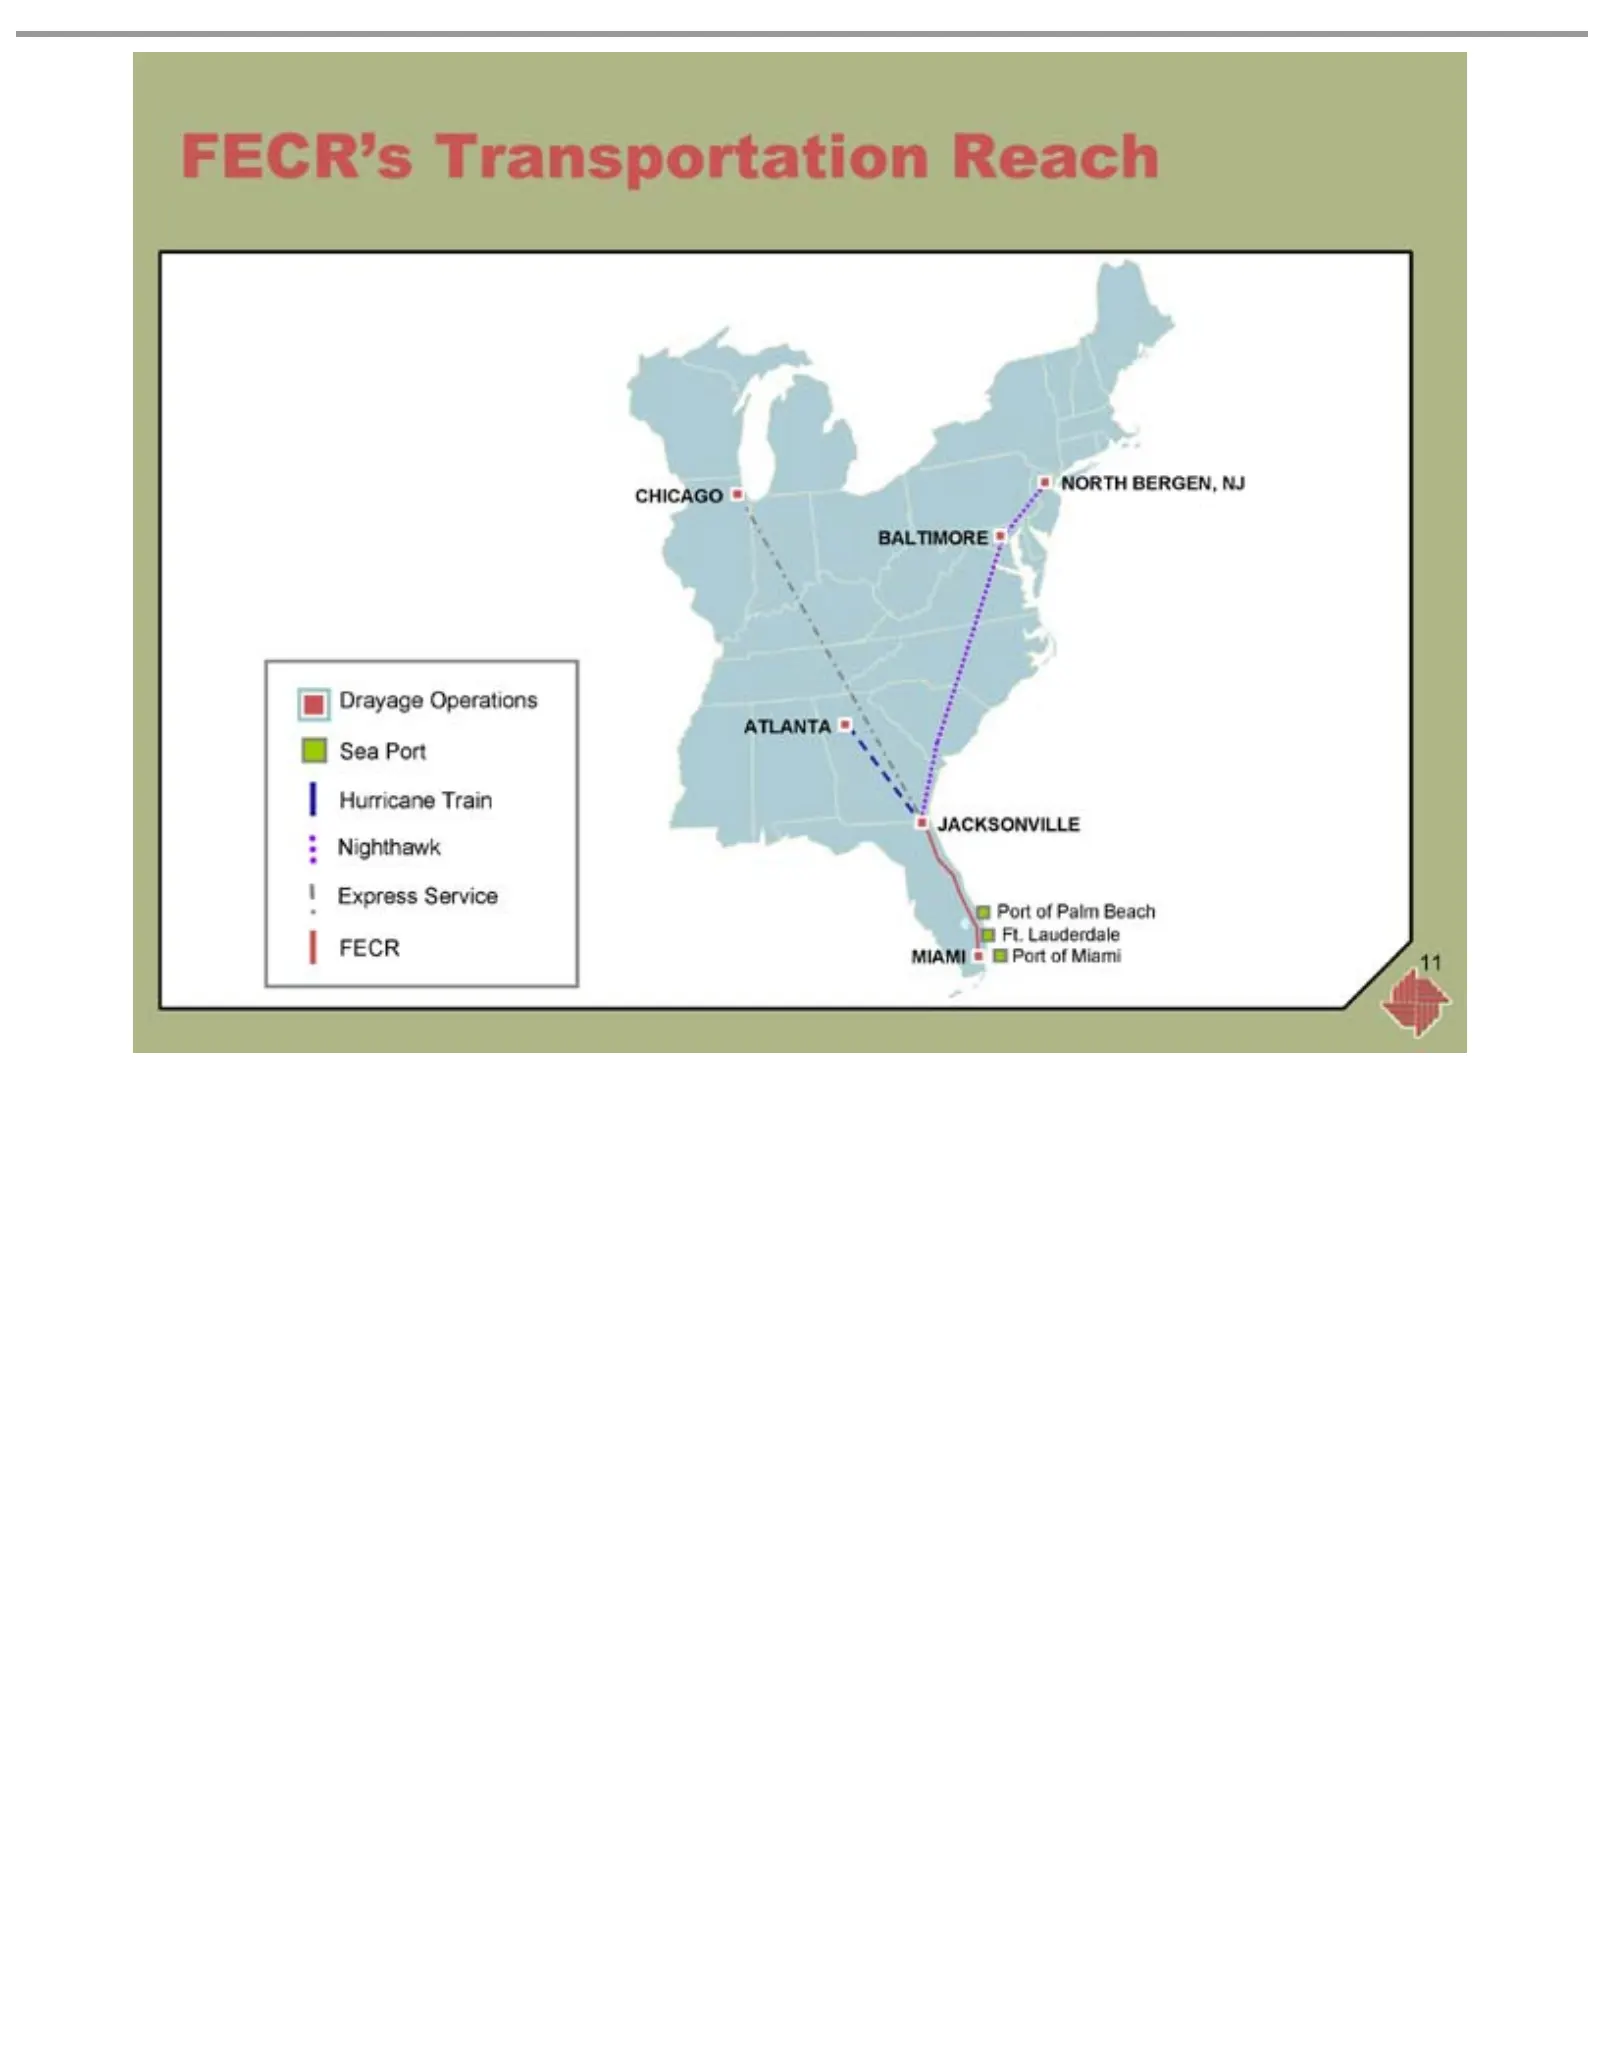
Slide 11: FECR's Operations
FECR’s NORTH CHICAGO Port JACKSONVILLE ATLANTA BALTIMORE Drayage 11 of Palm Transportation BERGEN, Operations Beach Ft. NJ SeaLauderdale Reach Port Hurricane MIAMITrain Port Nighthawk of MiamiExpress Service FECR
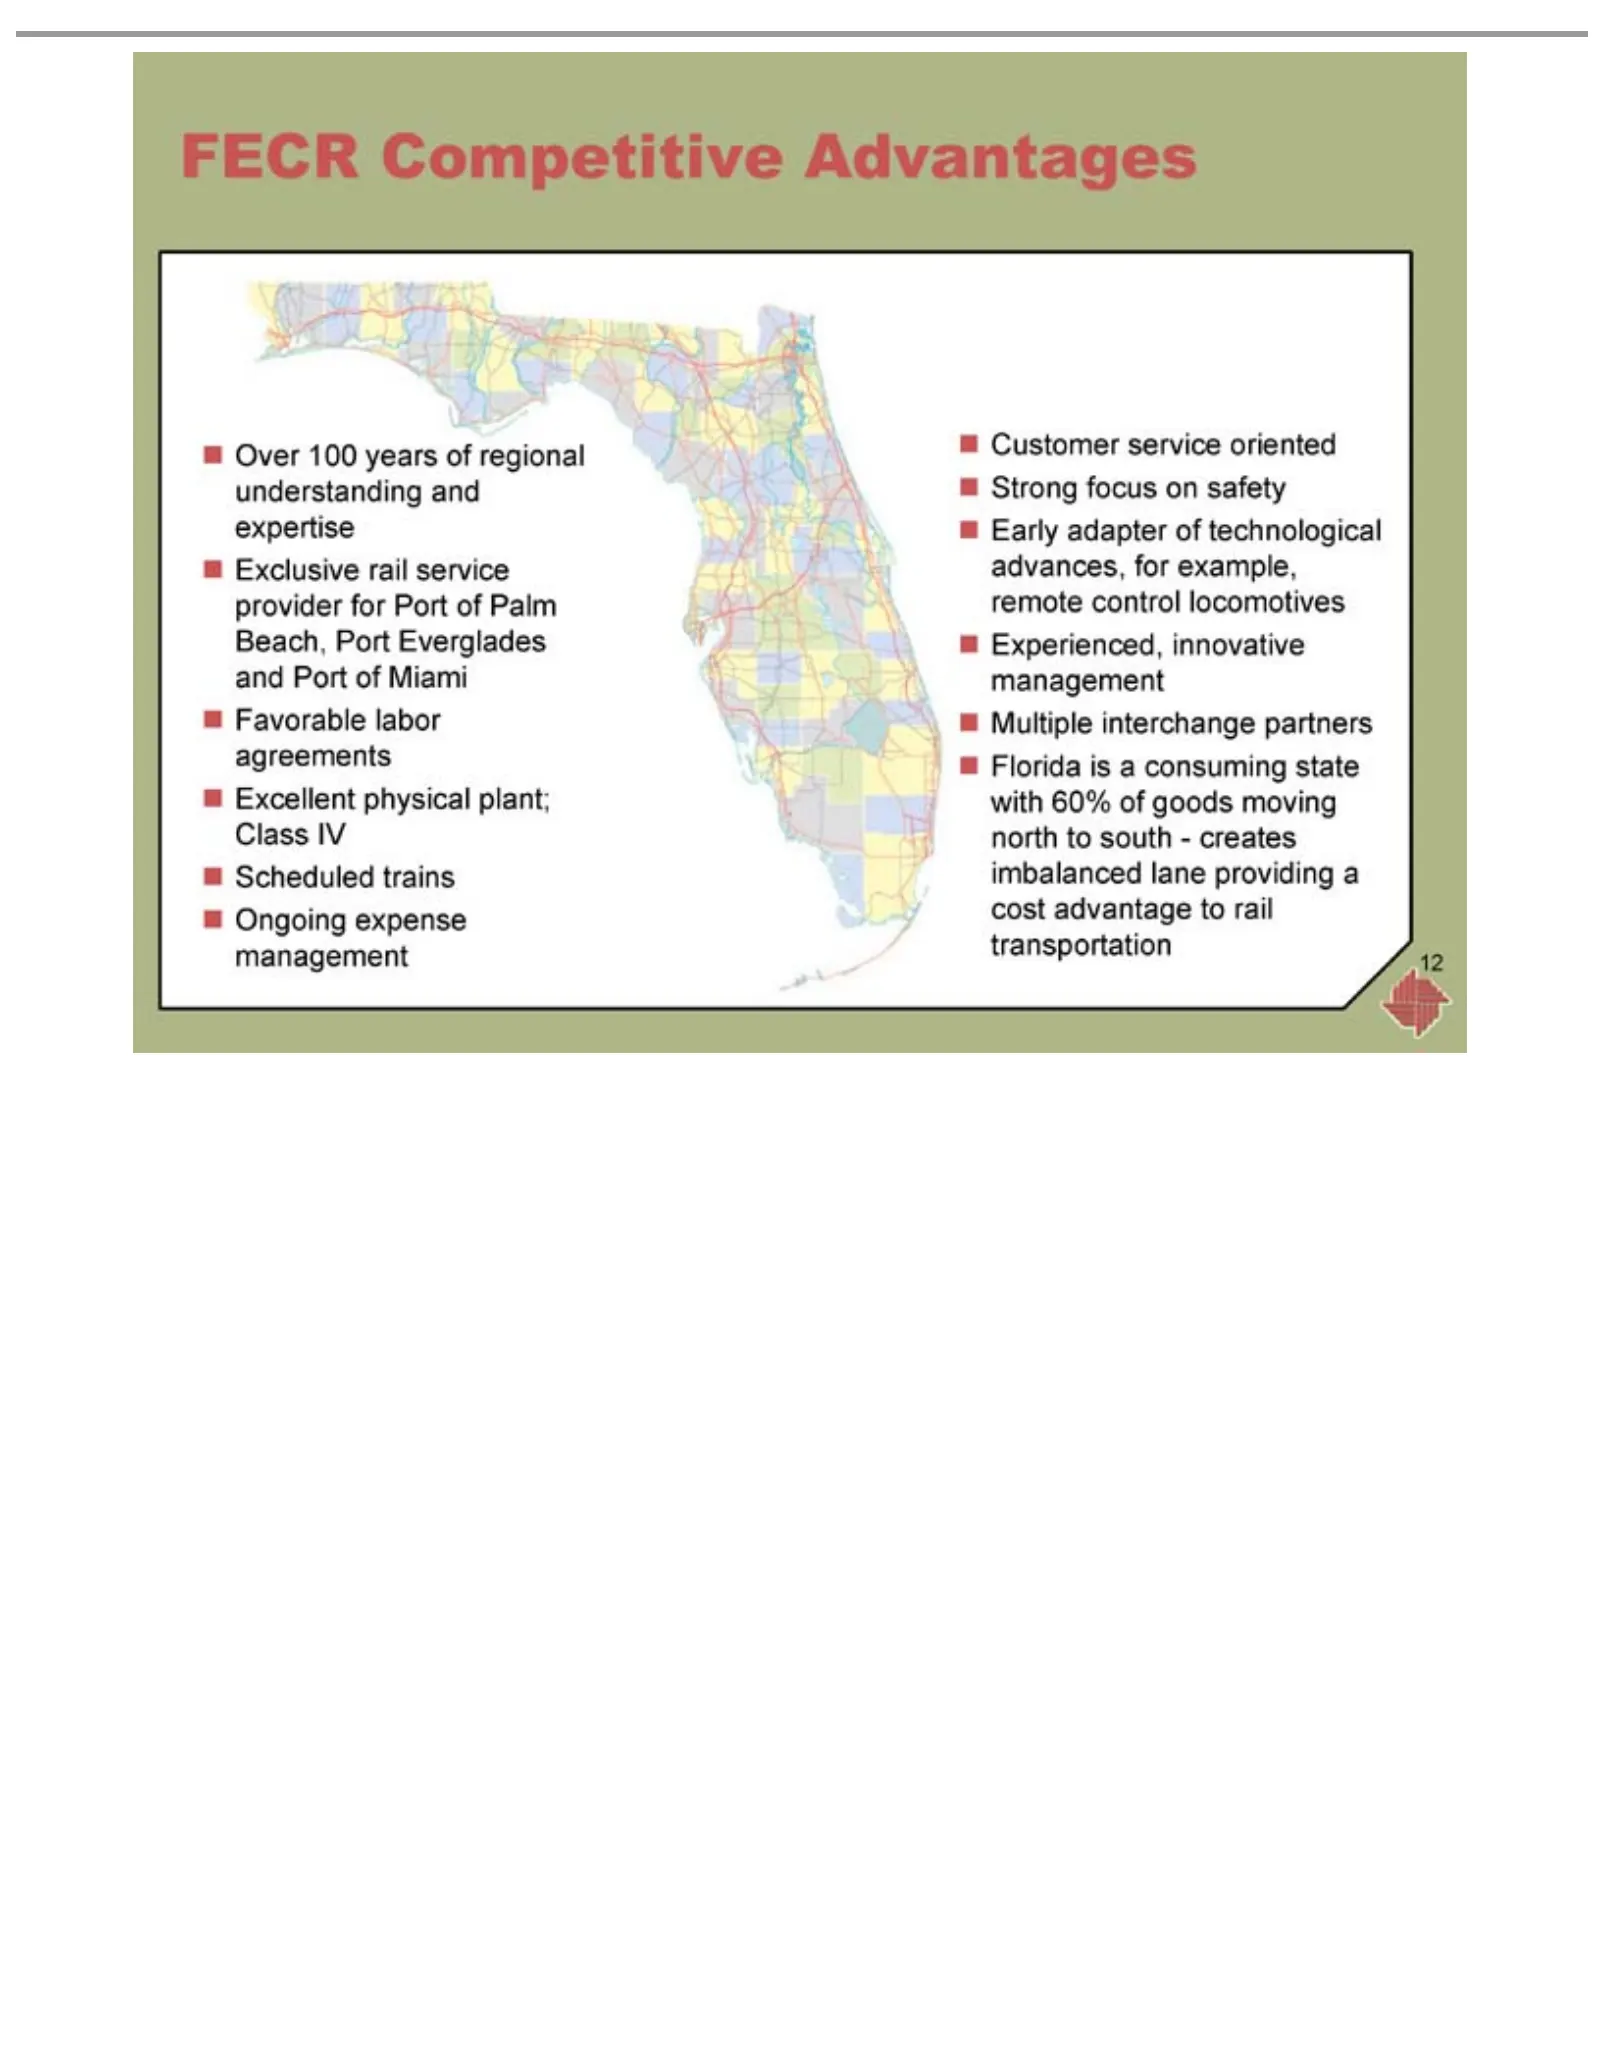
Slide 12: FECR Competitive Advantages
?FECR 12 Over Competitive Exclusive Favorable Excellent Scheduled Ongoing Customer Strong Early Experienced, Multiple Florida 100 adapter focus isinterchange expense years physical aservice rail labor trains consuming on innovative of service of agreements safety technological Advantages oriented ma
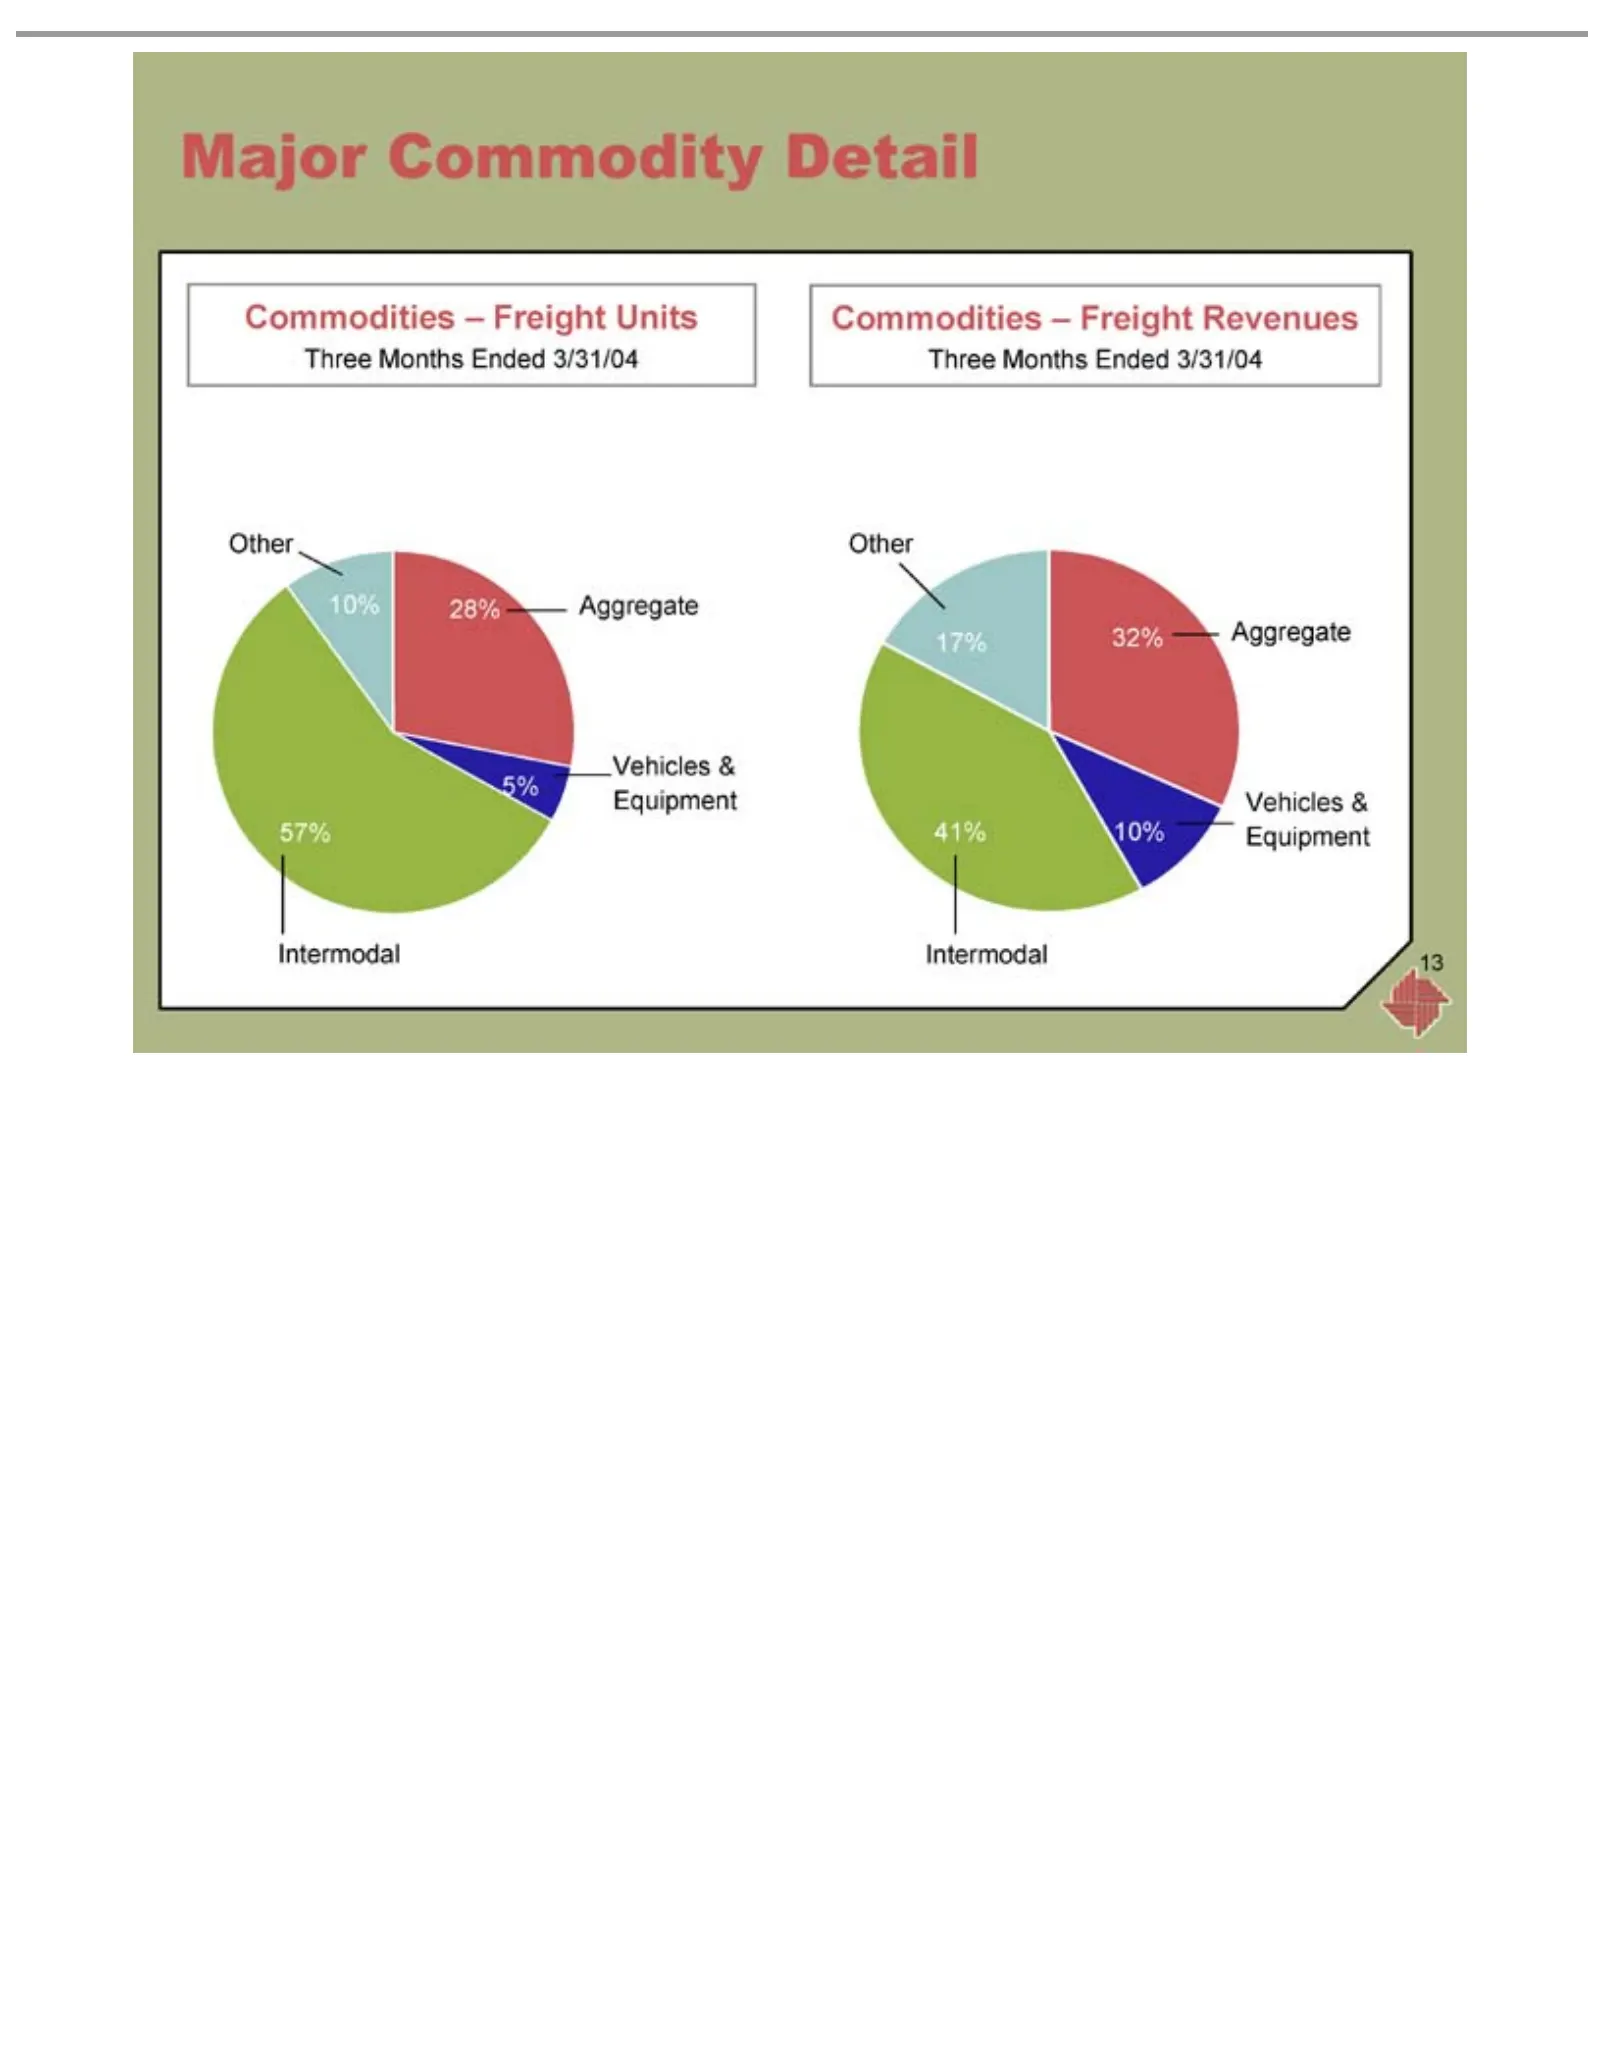
Slide 13: Major Commodities and Revenue Detail
MajorAggregate 28% 10% Commodities 57% Three 32% 17% Other Vehicles FECR 13 Intermodal 41% Months Commodity Moves & 10% 5%–Approximately Ended Equipment Freight Equipment Detail 3/31/04 Units 230,000 Automobiles and over 120,000 Carloads of Aggregate each Year* Revenues
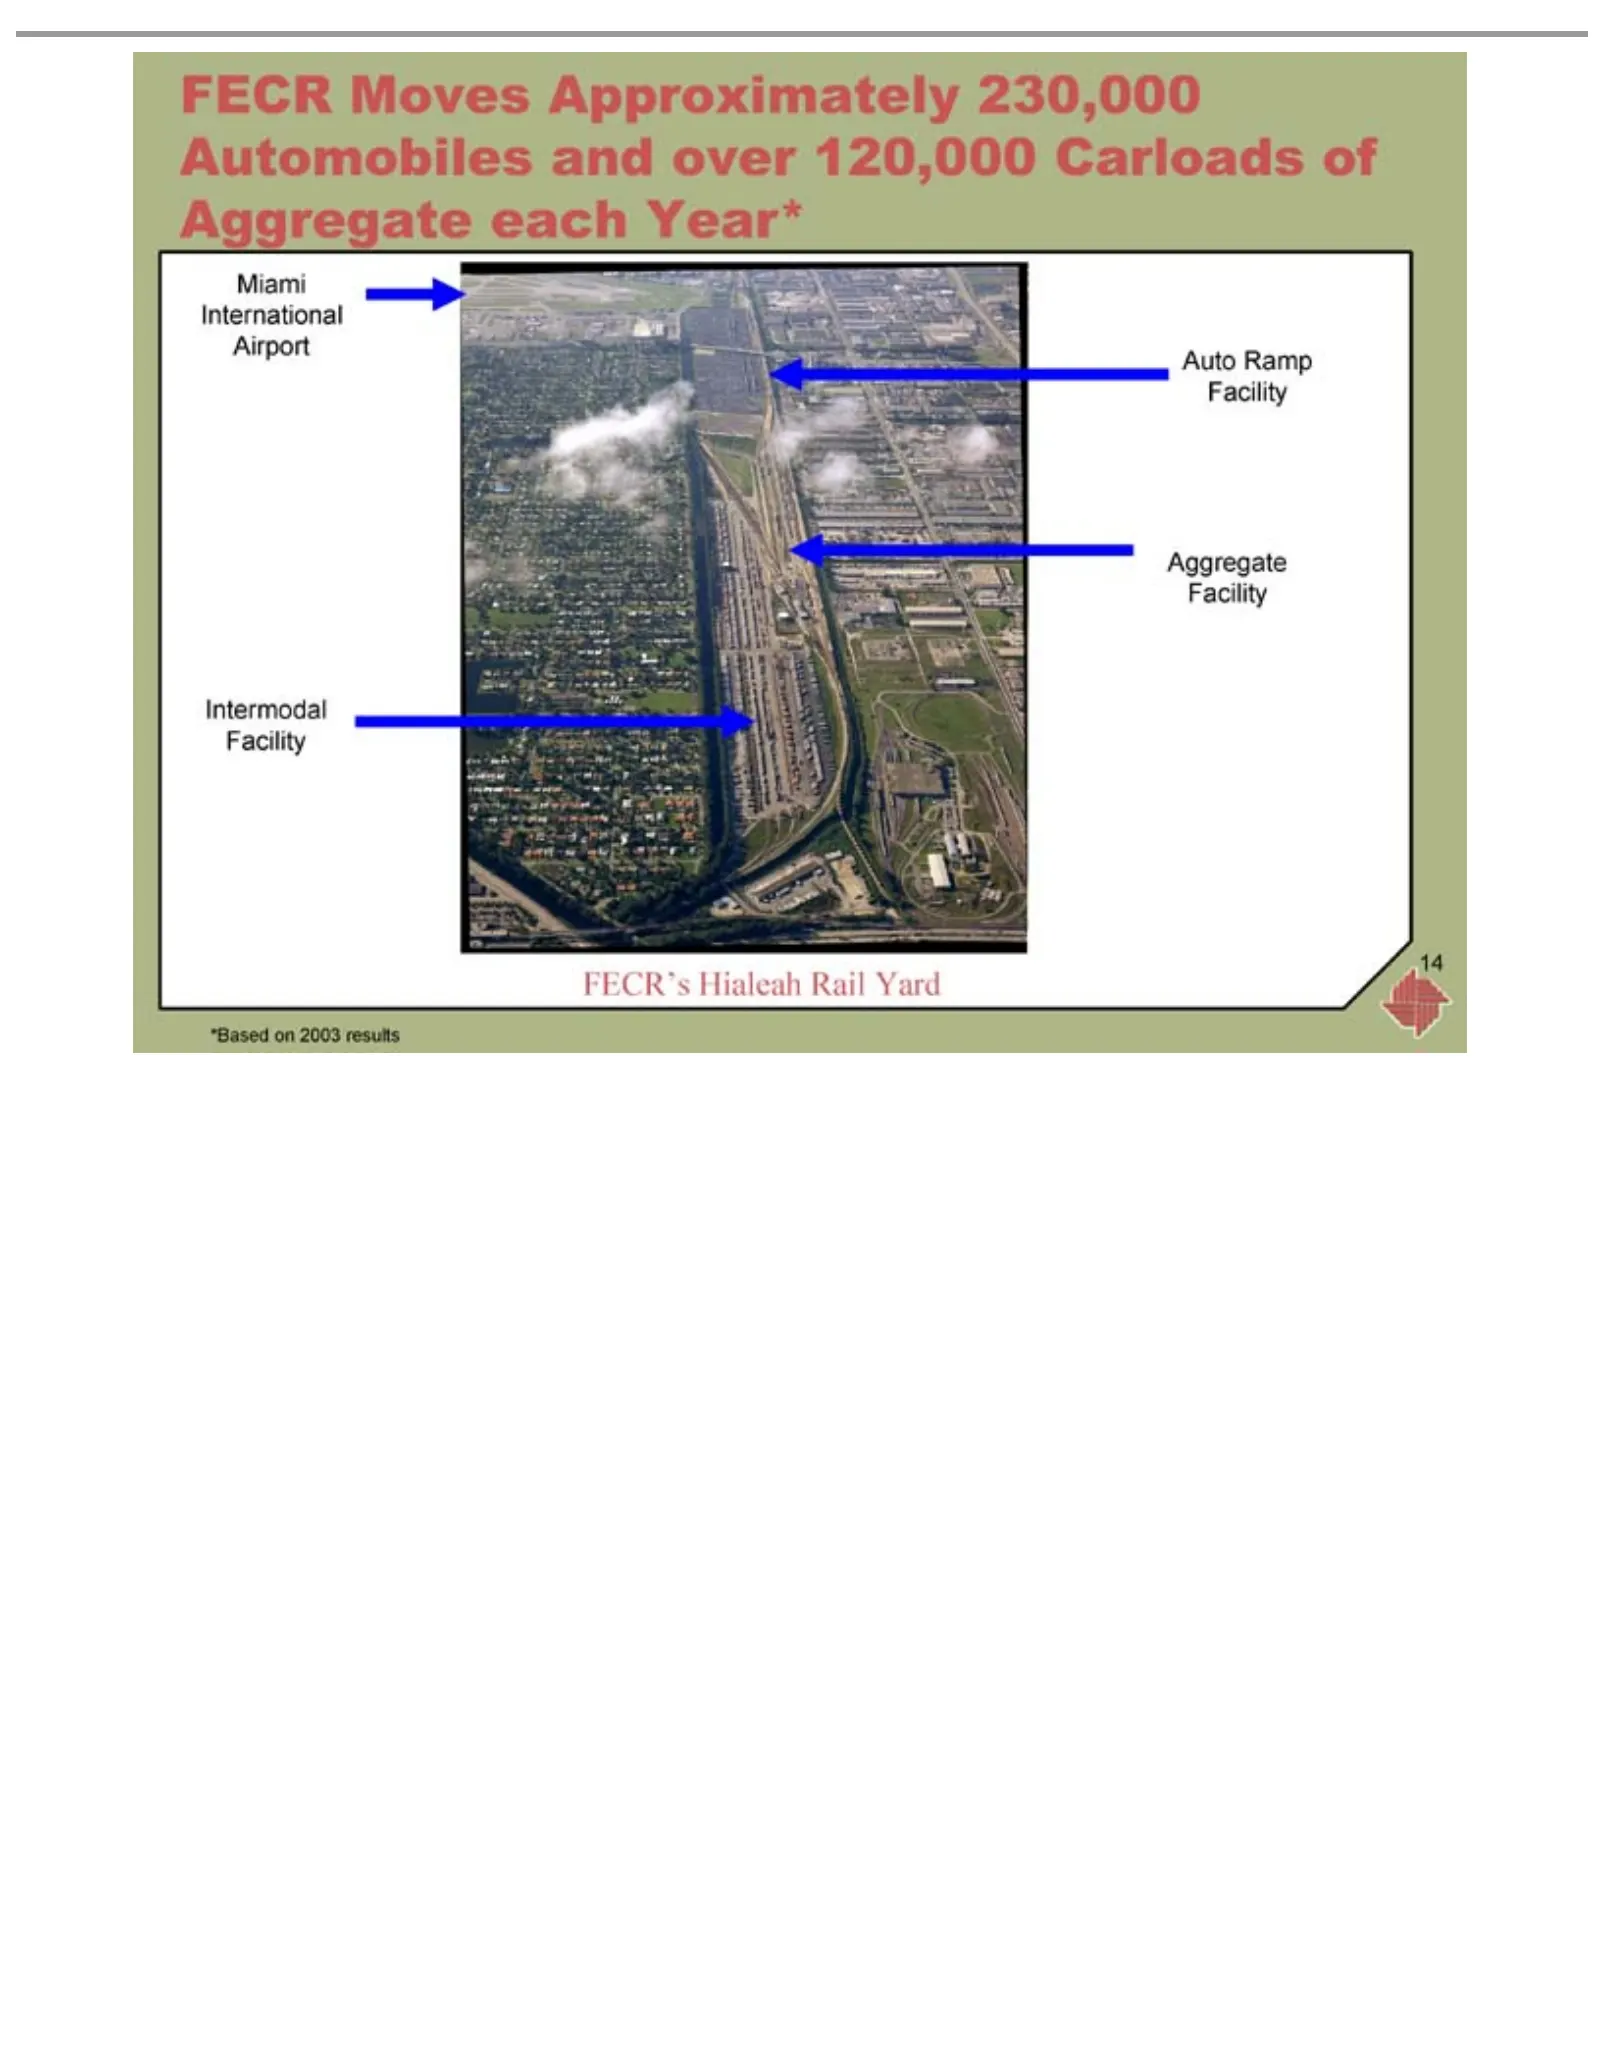
Slide 14: FECR Facilities
MiamiRamp Auto Aggregate Intermodal FECR’s *Based 14 International on Hialeah Facility 2003 Facility Facility results RailAirport Yard
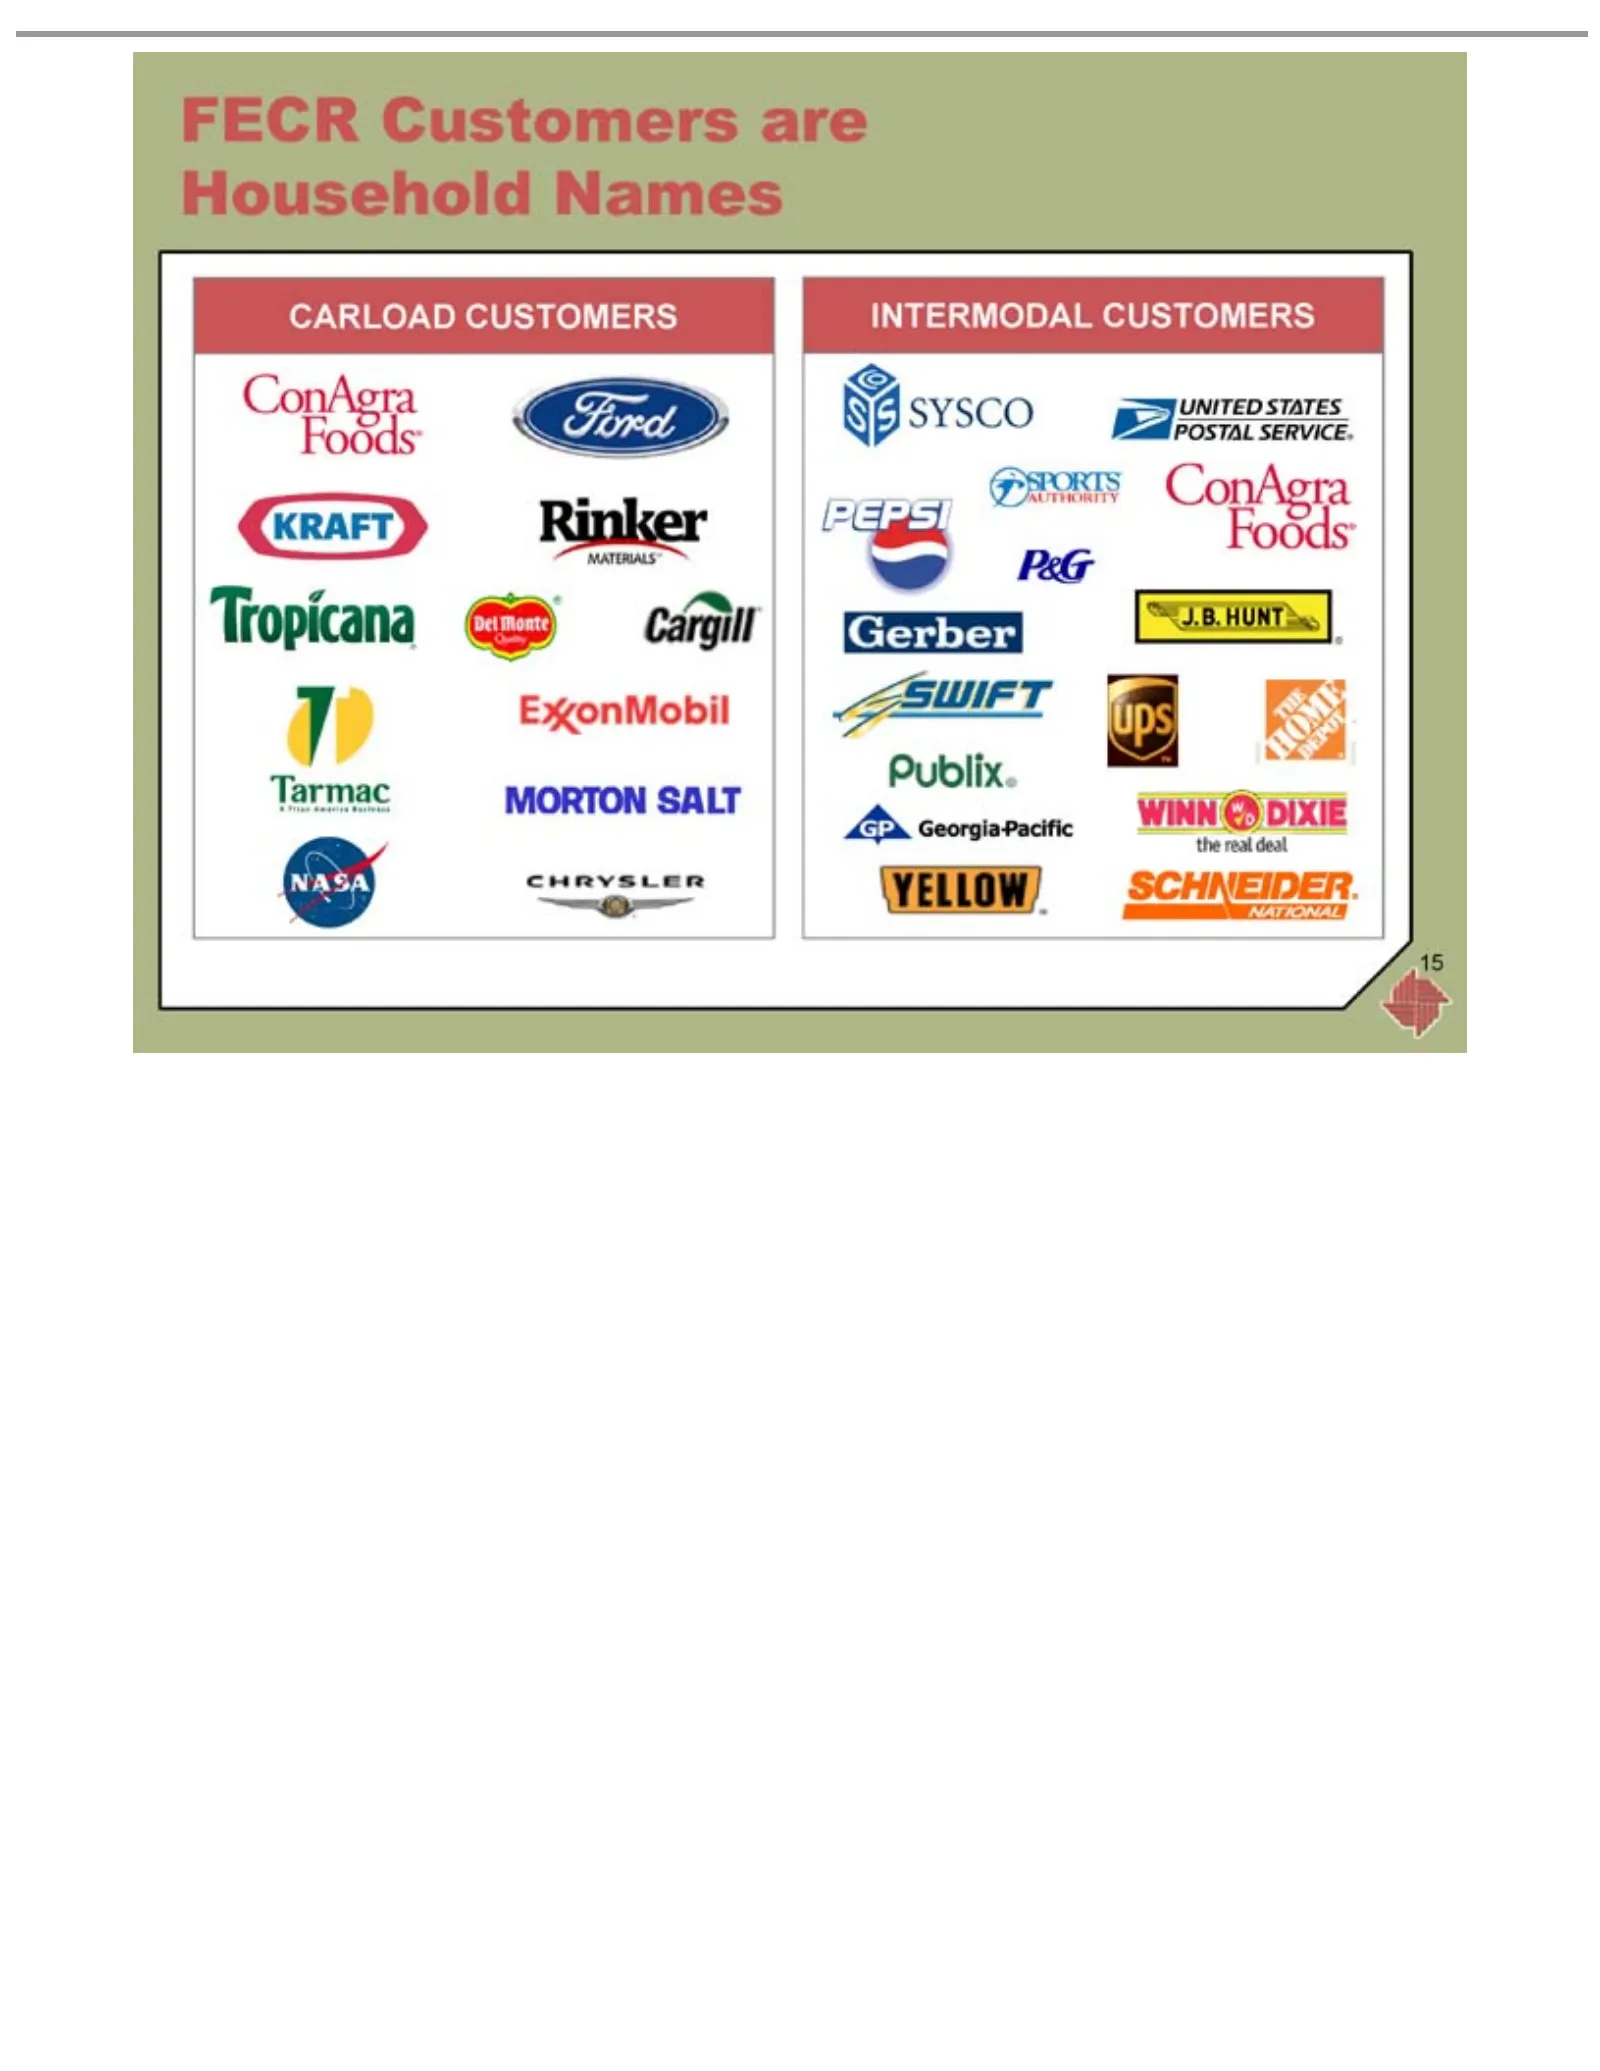
Slide 15: FECR Customers
FECR Customers CARLOAD INTERMODAL 15 CUSTOMERS CUSTOMERS are Household Names
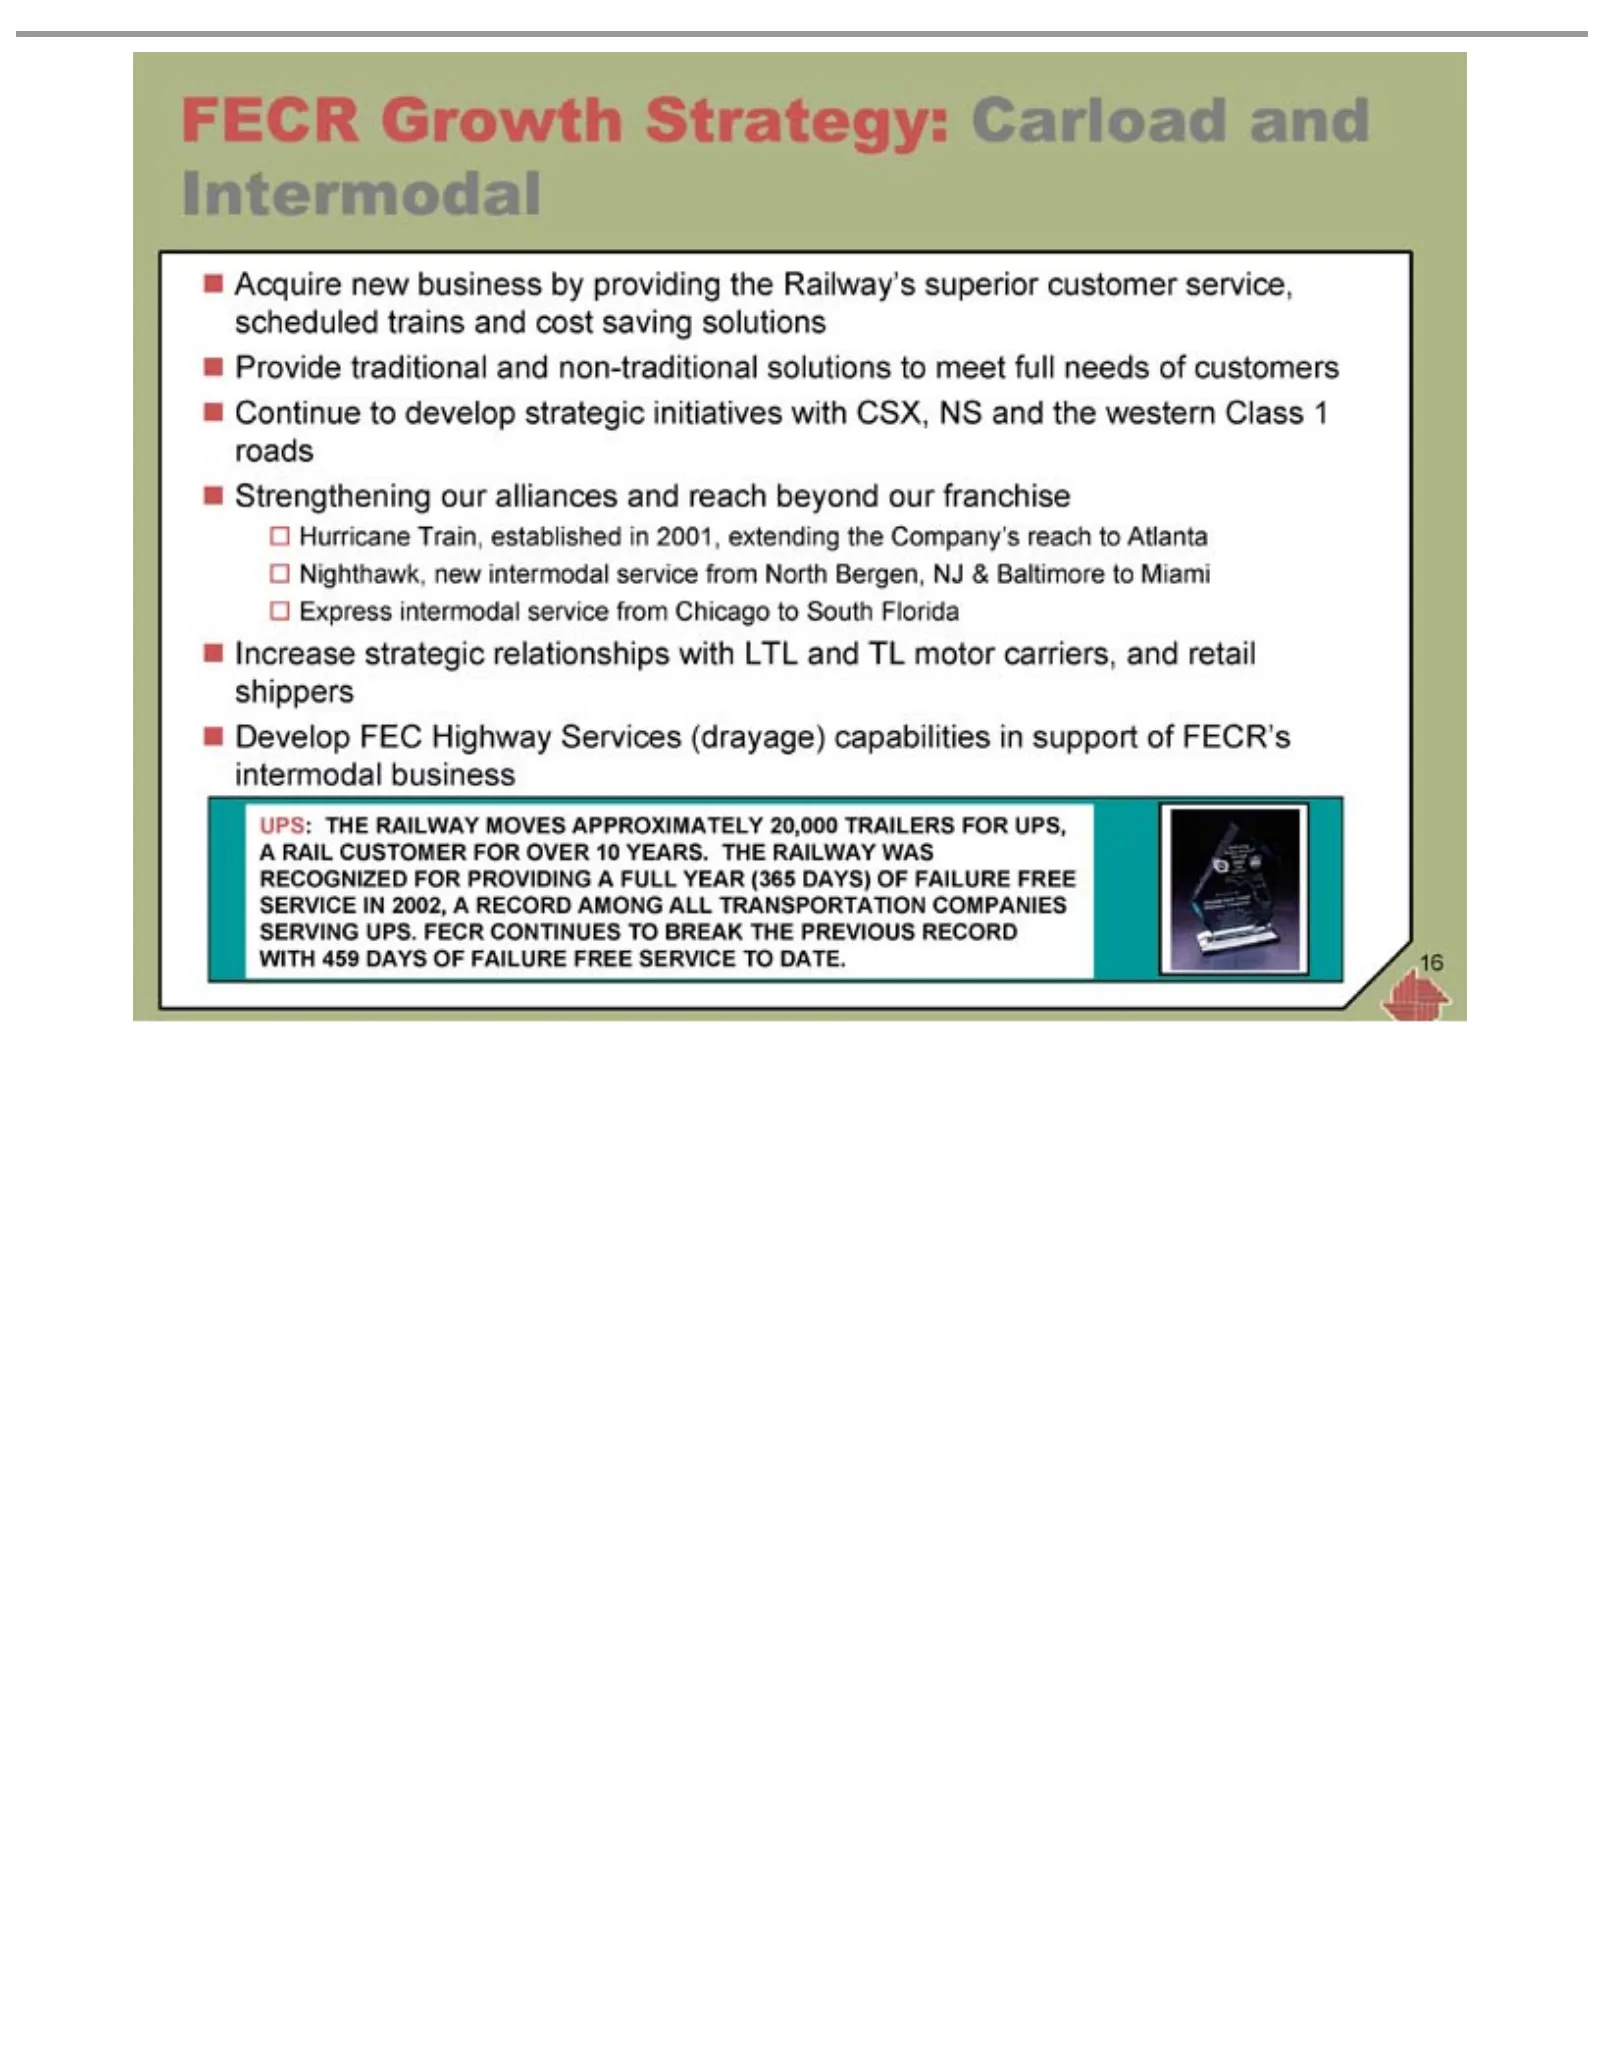
Slide 16: FECR Growth Strategy
?FECR UPS: RECOGNIZED CONTINUES WITH Acquire Provide Continue Strengthening Hurricane Nighthawk, Express Increase Develop THE Growth 459traditional new intermodal strategic FEC RAILWAY DAYS toTrain, new develop TO business Strategy: Highway our FORBREAK OF established intermodal relationships allian
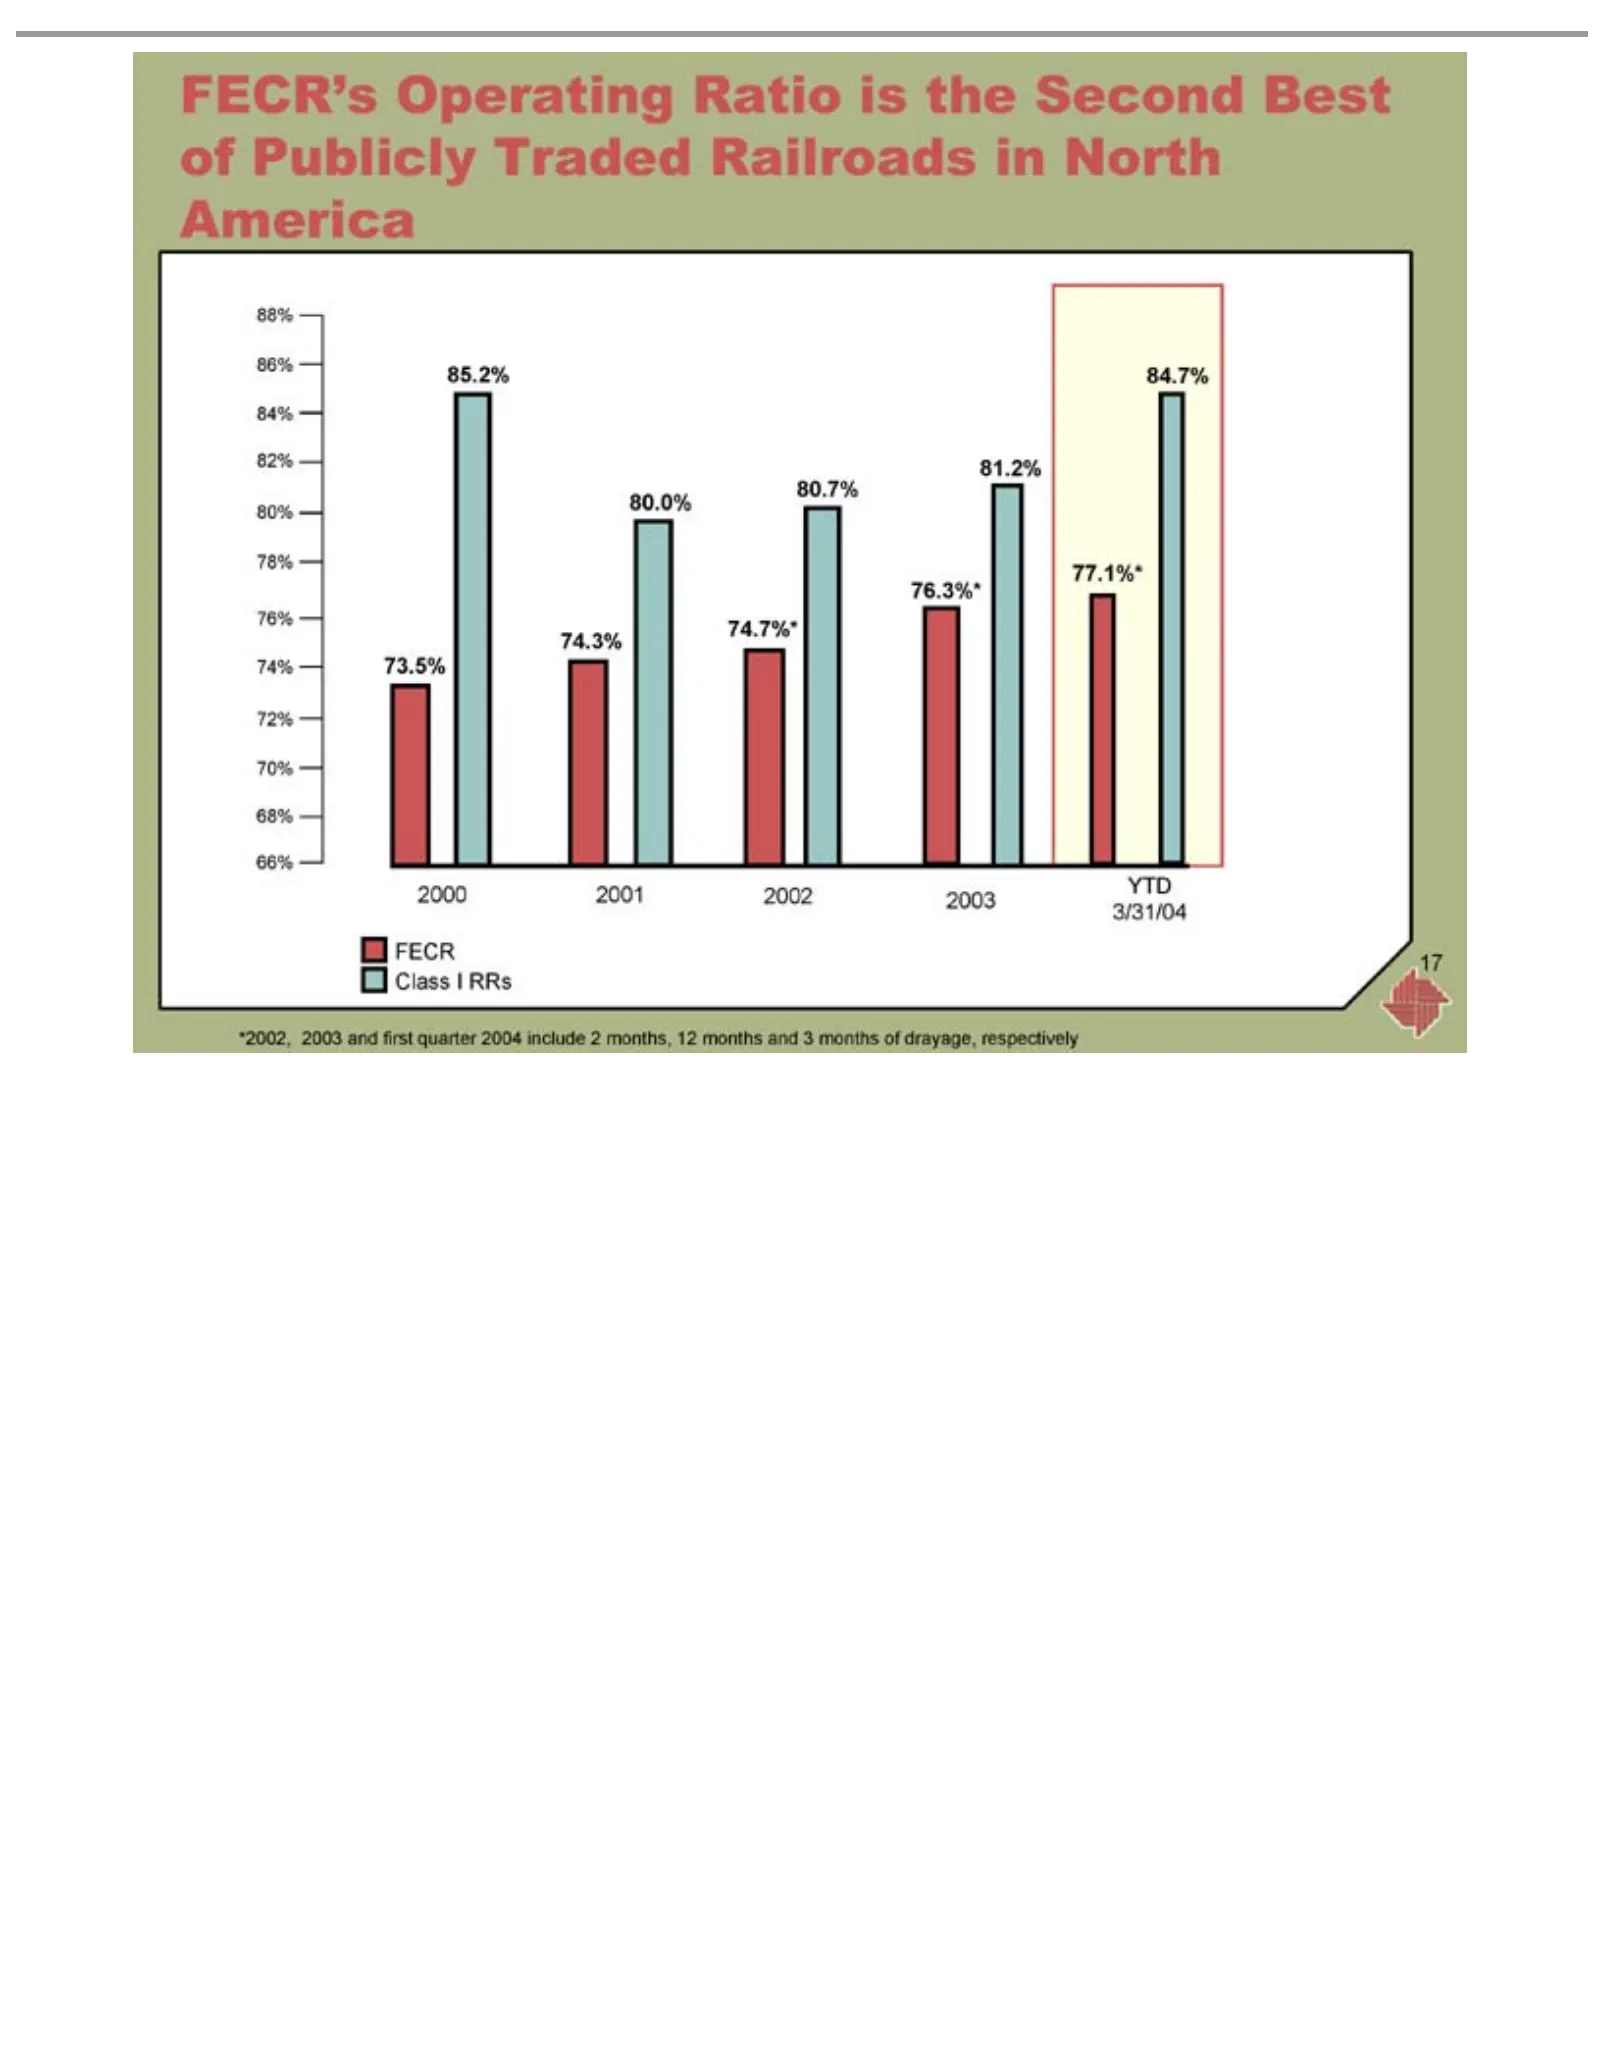
Slide 17: FECR's Operating Ratio
FECR’s 85.2% 81.2% 77.1%* 2000 FECR *2002, 17 2001 Class 84.7% 80.7% 2003 76.3%* Operating YTD Iand 80.0% RRs 74.7%* 2002 first Ratio quarter 2003 74.3% is the 3/31/04 2004 Second 73.5% include Best2ofmonths, Publicly 12Traded monthsRailroads and 3 months in North of drayage, Americarespectively
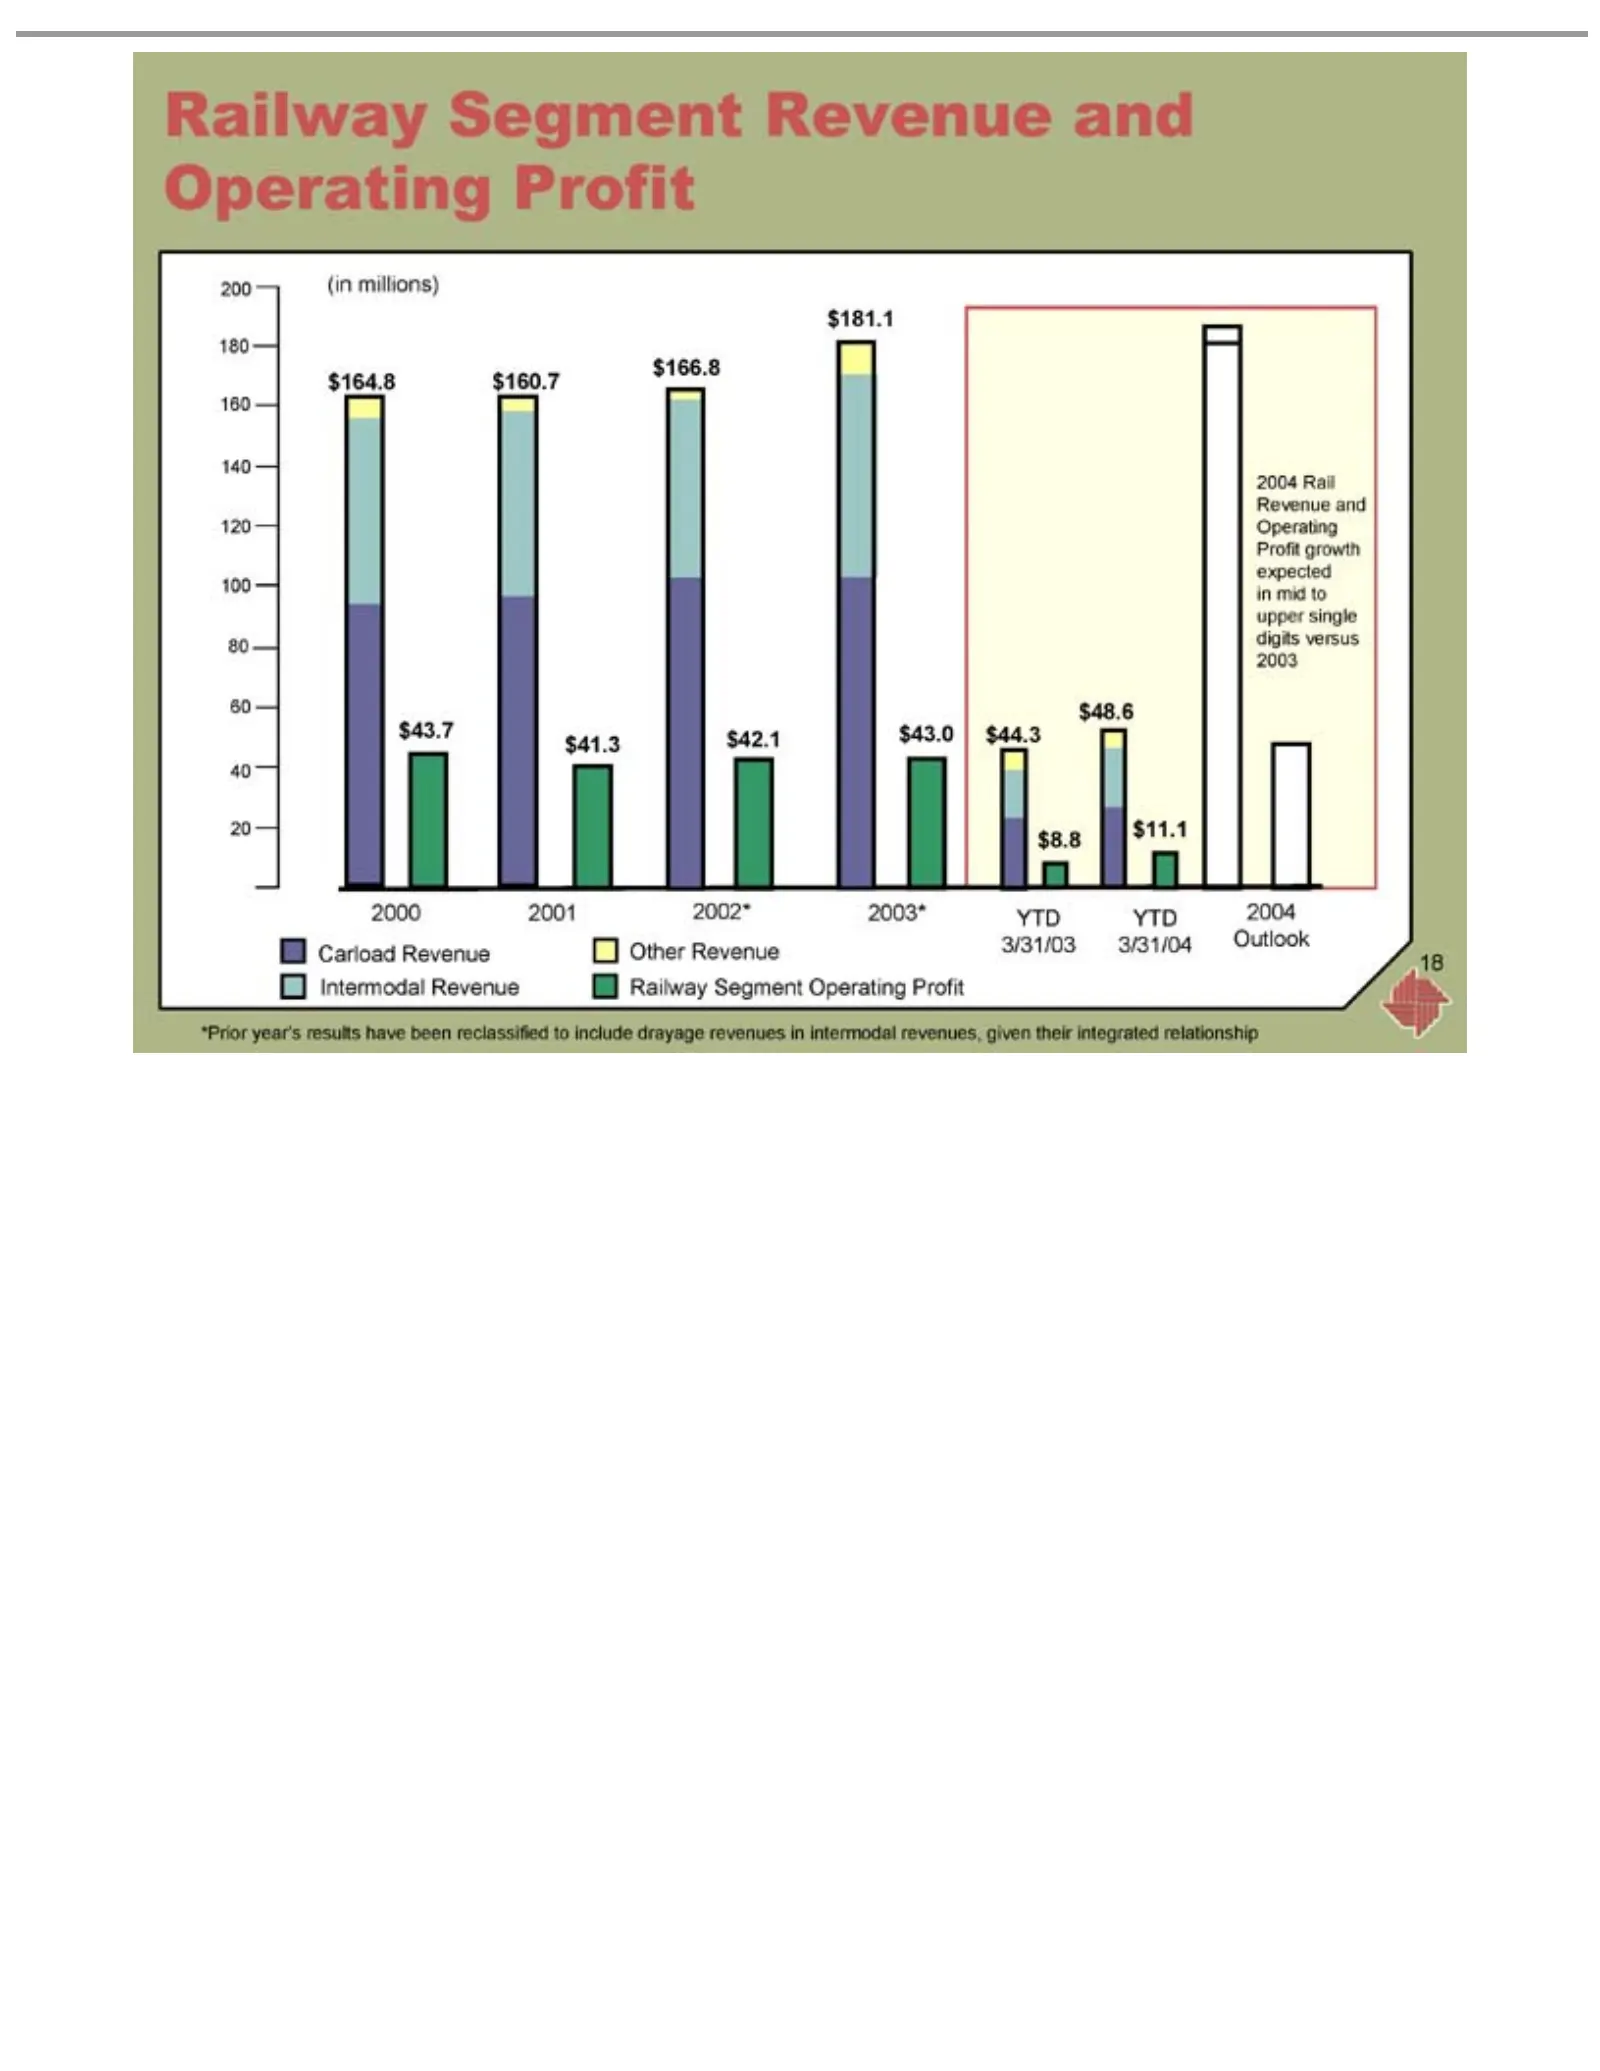
Slide 18: Railway Revenue and Operating Profit
Railway (in $ 2000 3/31/03 Carload 2004 Intermodal *Prior 181.1 166.8 164.8 48.6 43.7 41.3 11.1 8.8 millions) 2001 Rail year’s $$3/31/04 Revenue 42.1 Segment 160.7 Revenue 2002* Revenue results $ 43.0 Outlook Other 2003* Revenue and $have Railway 44.3 Operating Revenue YTD been and Segment YTD recla
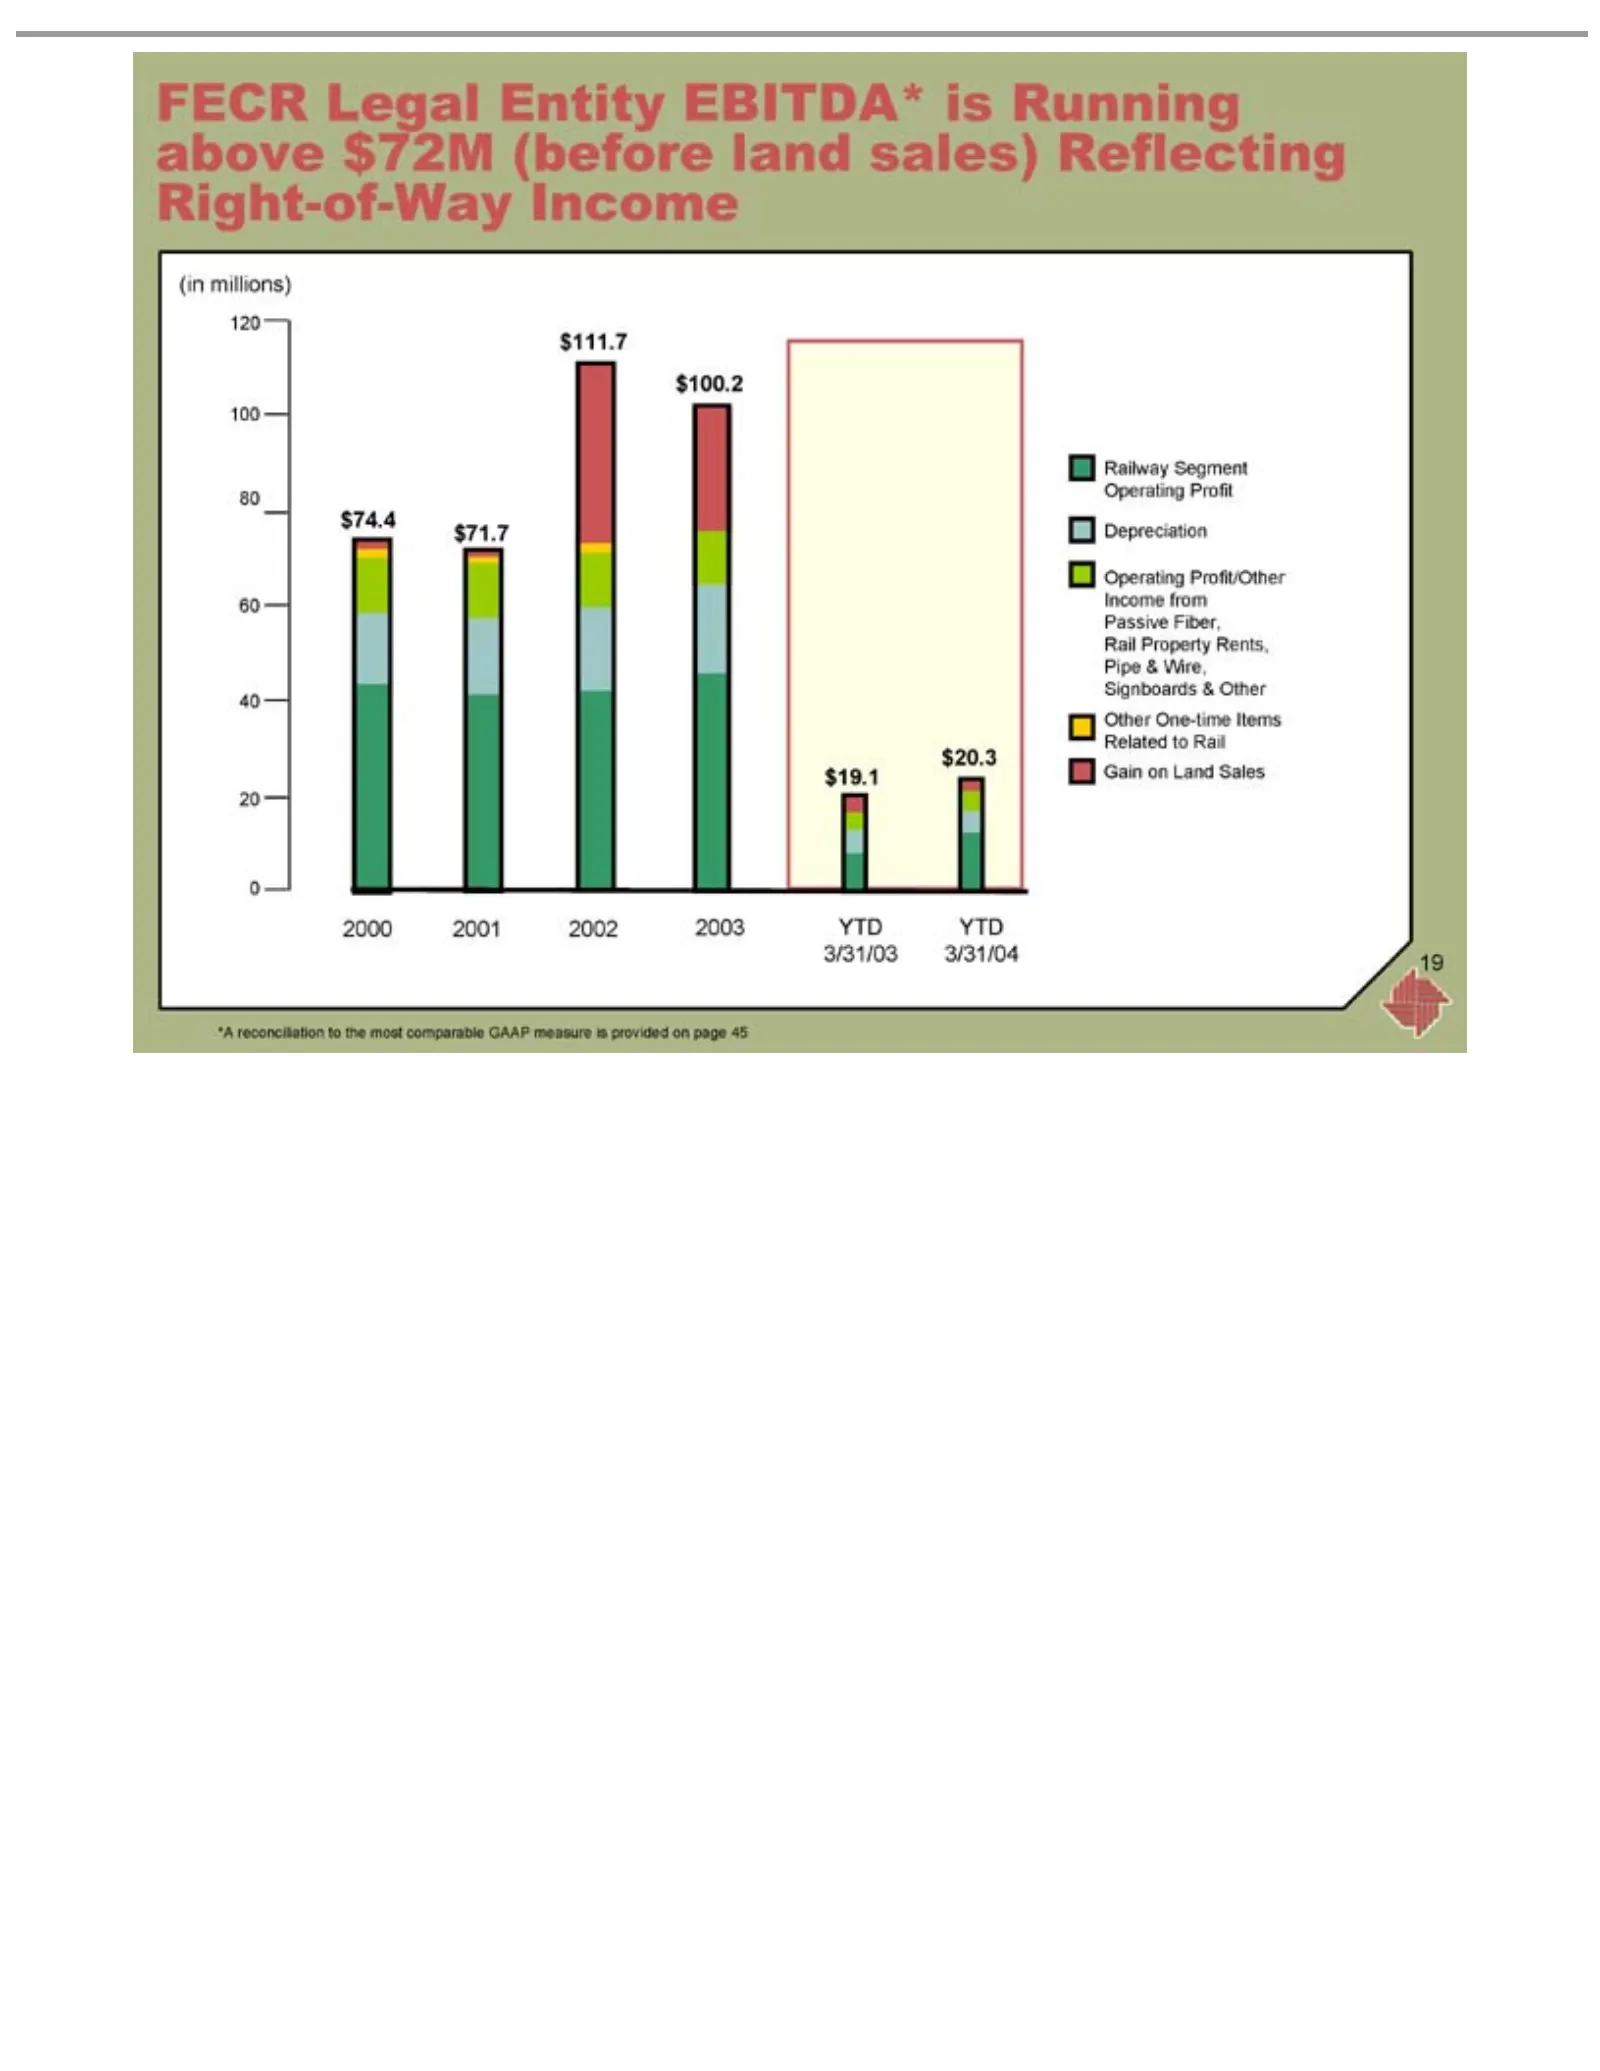
Slide 19: FECR Railway Operating Profit and EBITDA
FECR (in $ 2000 3/31/03 Railway Operating Depreciation *A 19111.7 100.2 74.4 71.7 20.3 19.1 millions) reconciliation 2001 Legal 3/31/04 Segment Profit/Other 2002 Entity 2003 to Operating EBITDA* theYTD Income mostYTD Profit comparable isfrom Running Passive GAAP above Fiber, $72M measure Rail(before
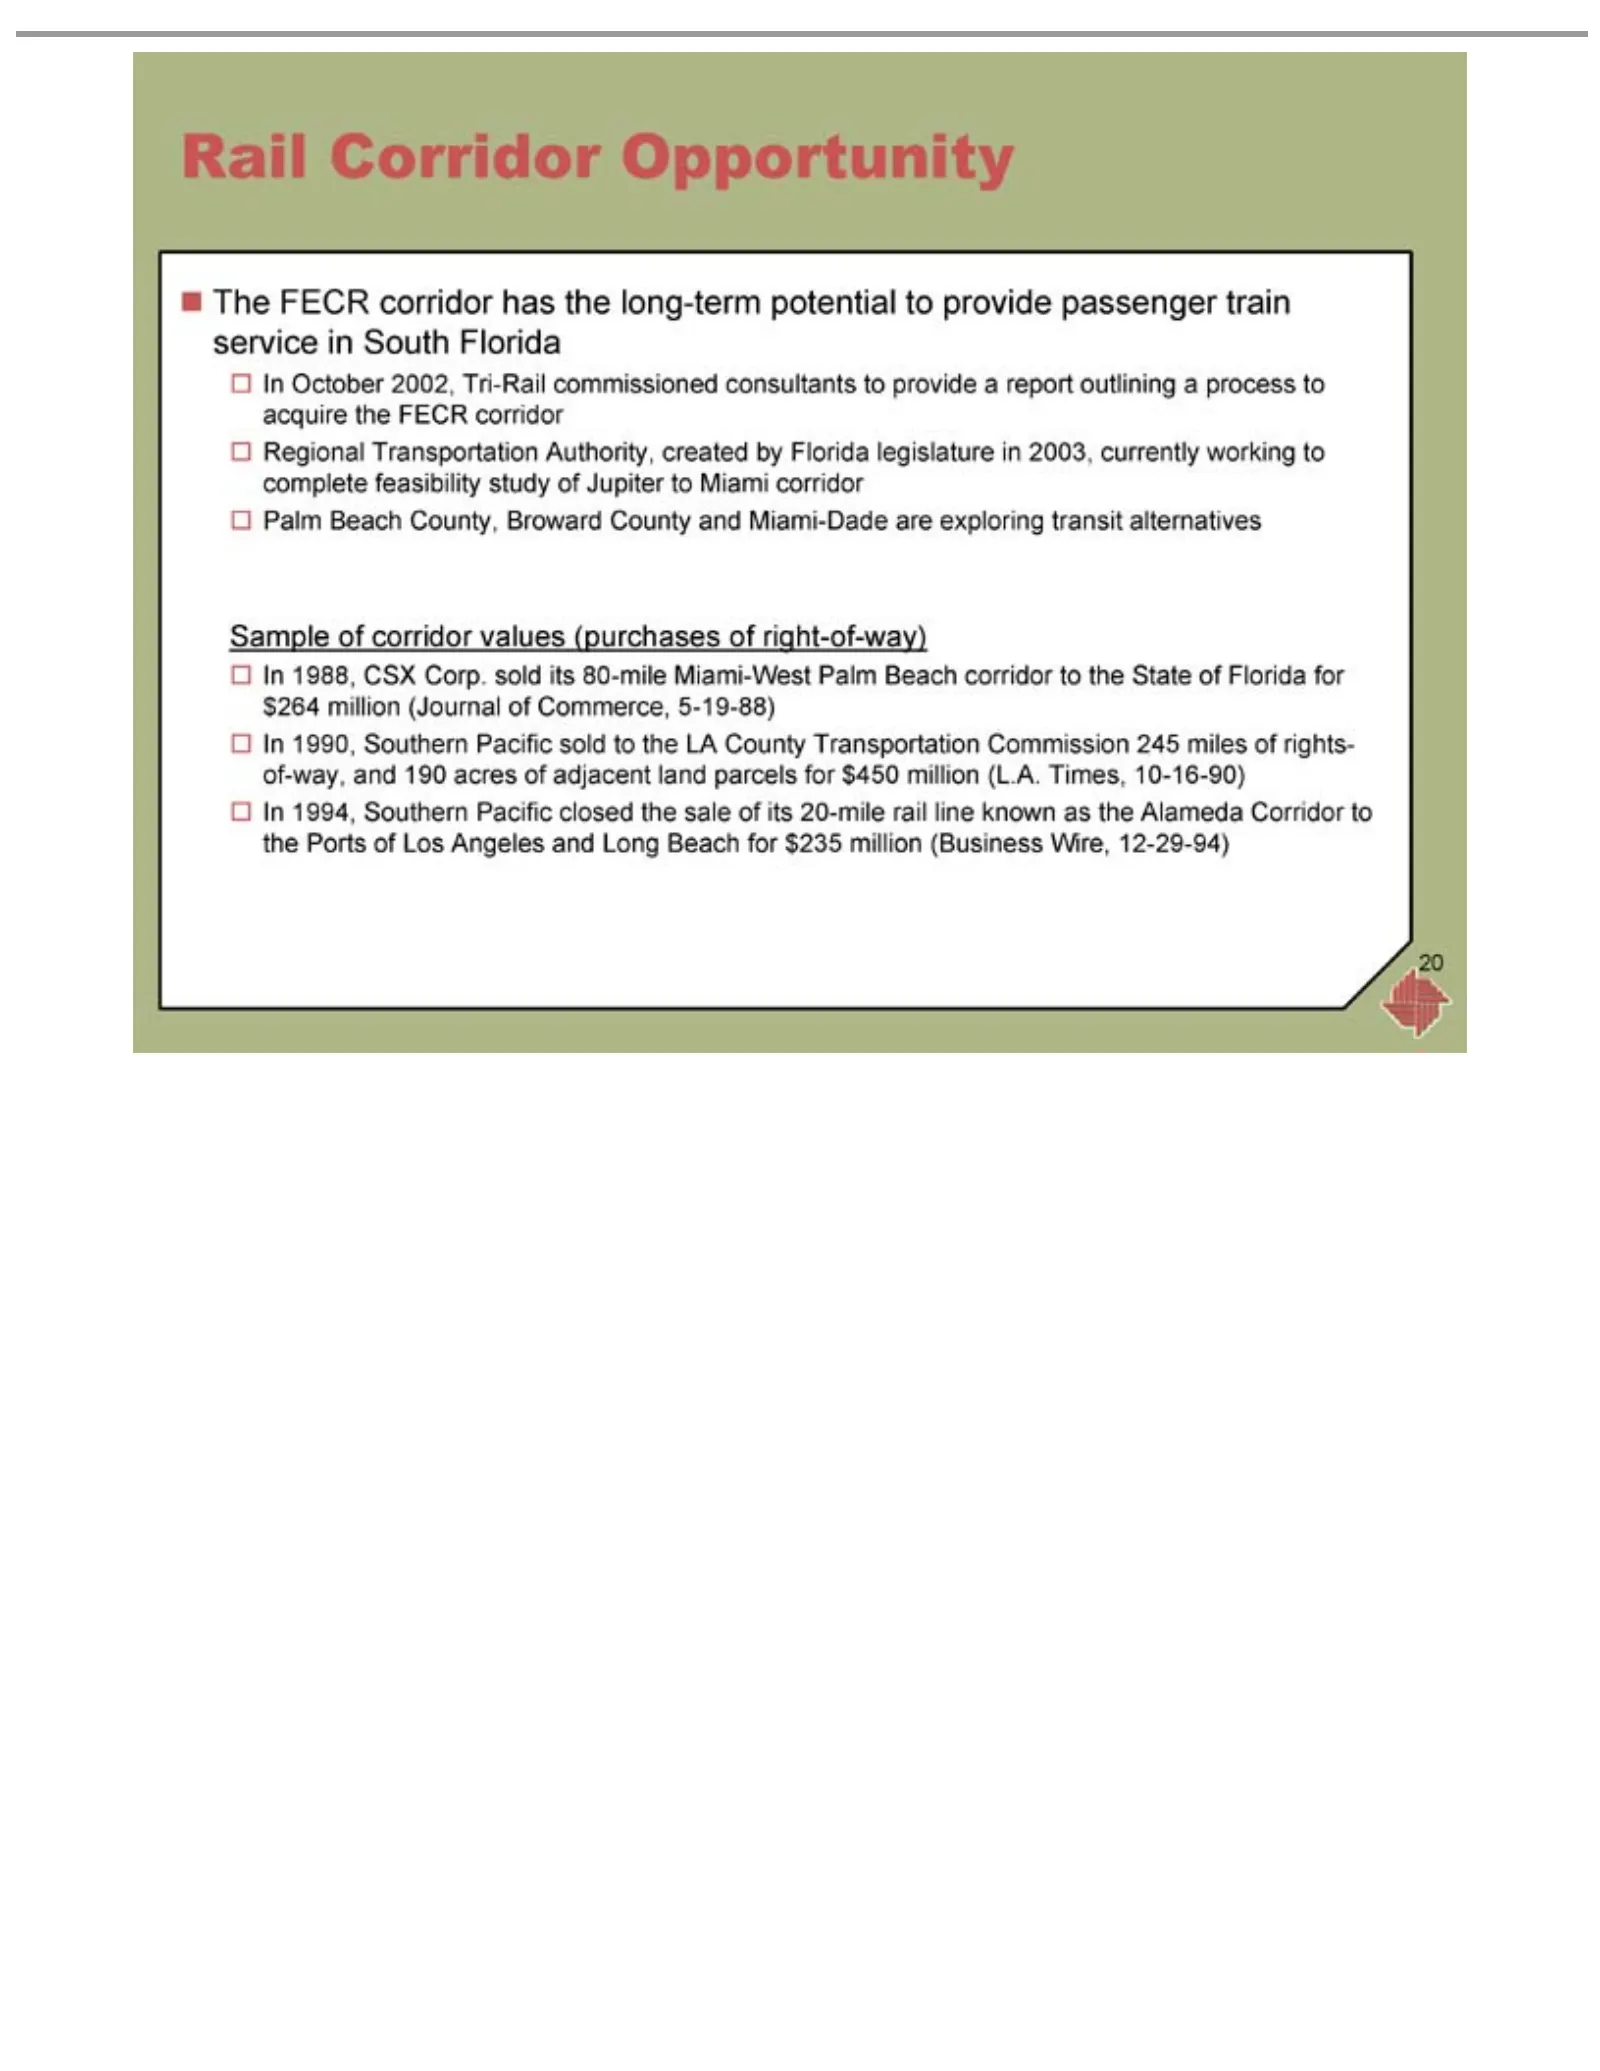
Slide 20: Rail Corridor Opportunity
Rail ?Sample 20 The Regional Palm In October 1988, 1990, 1994, Corridor FECR Beach of Southern CSX corridor Transportation corridor 2002, Opportunity County, Corp. Tri-Rail values Pacific has sold Broward the Authority, (purchases its sold closed commissioned long-term 80-mile County to the thecreat
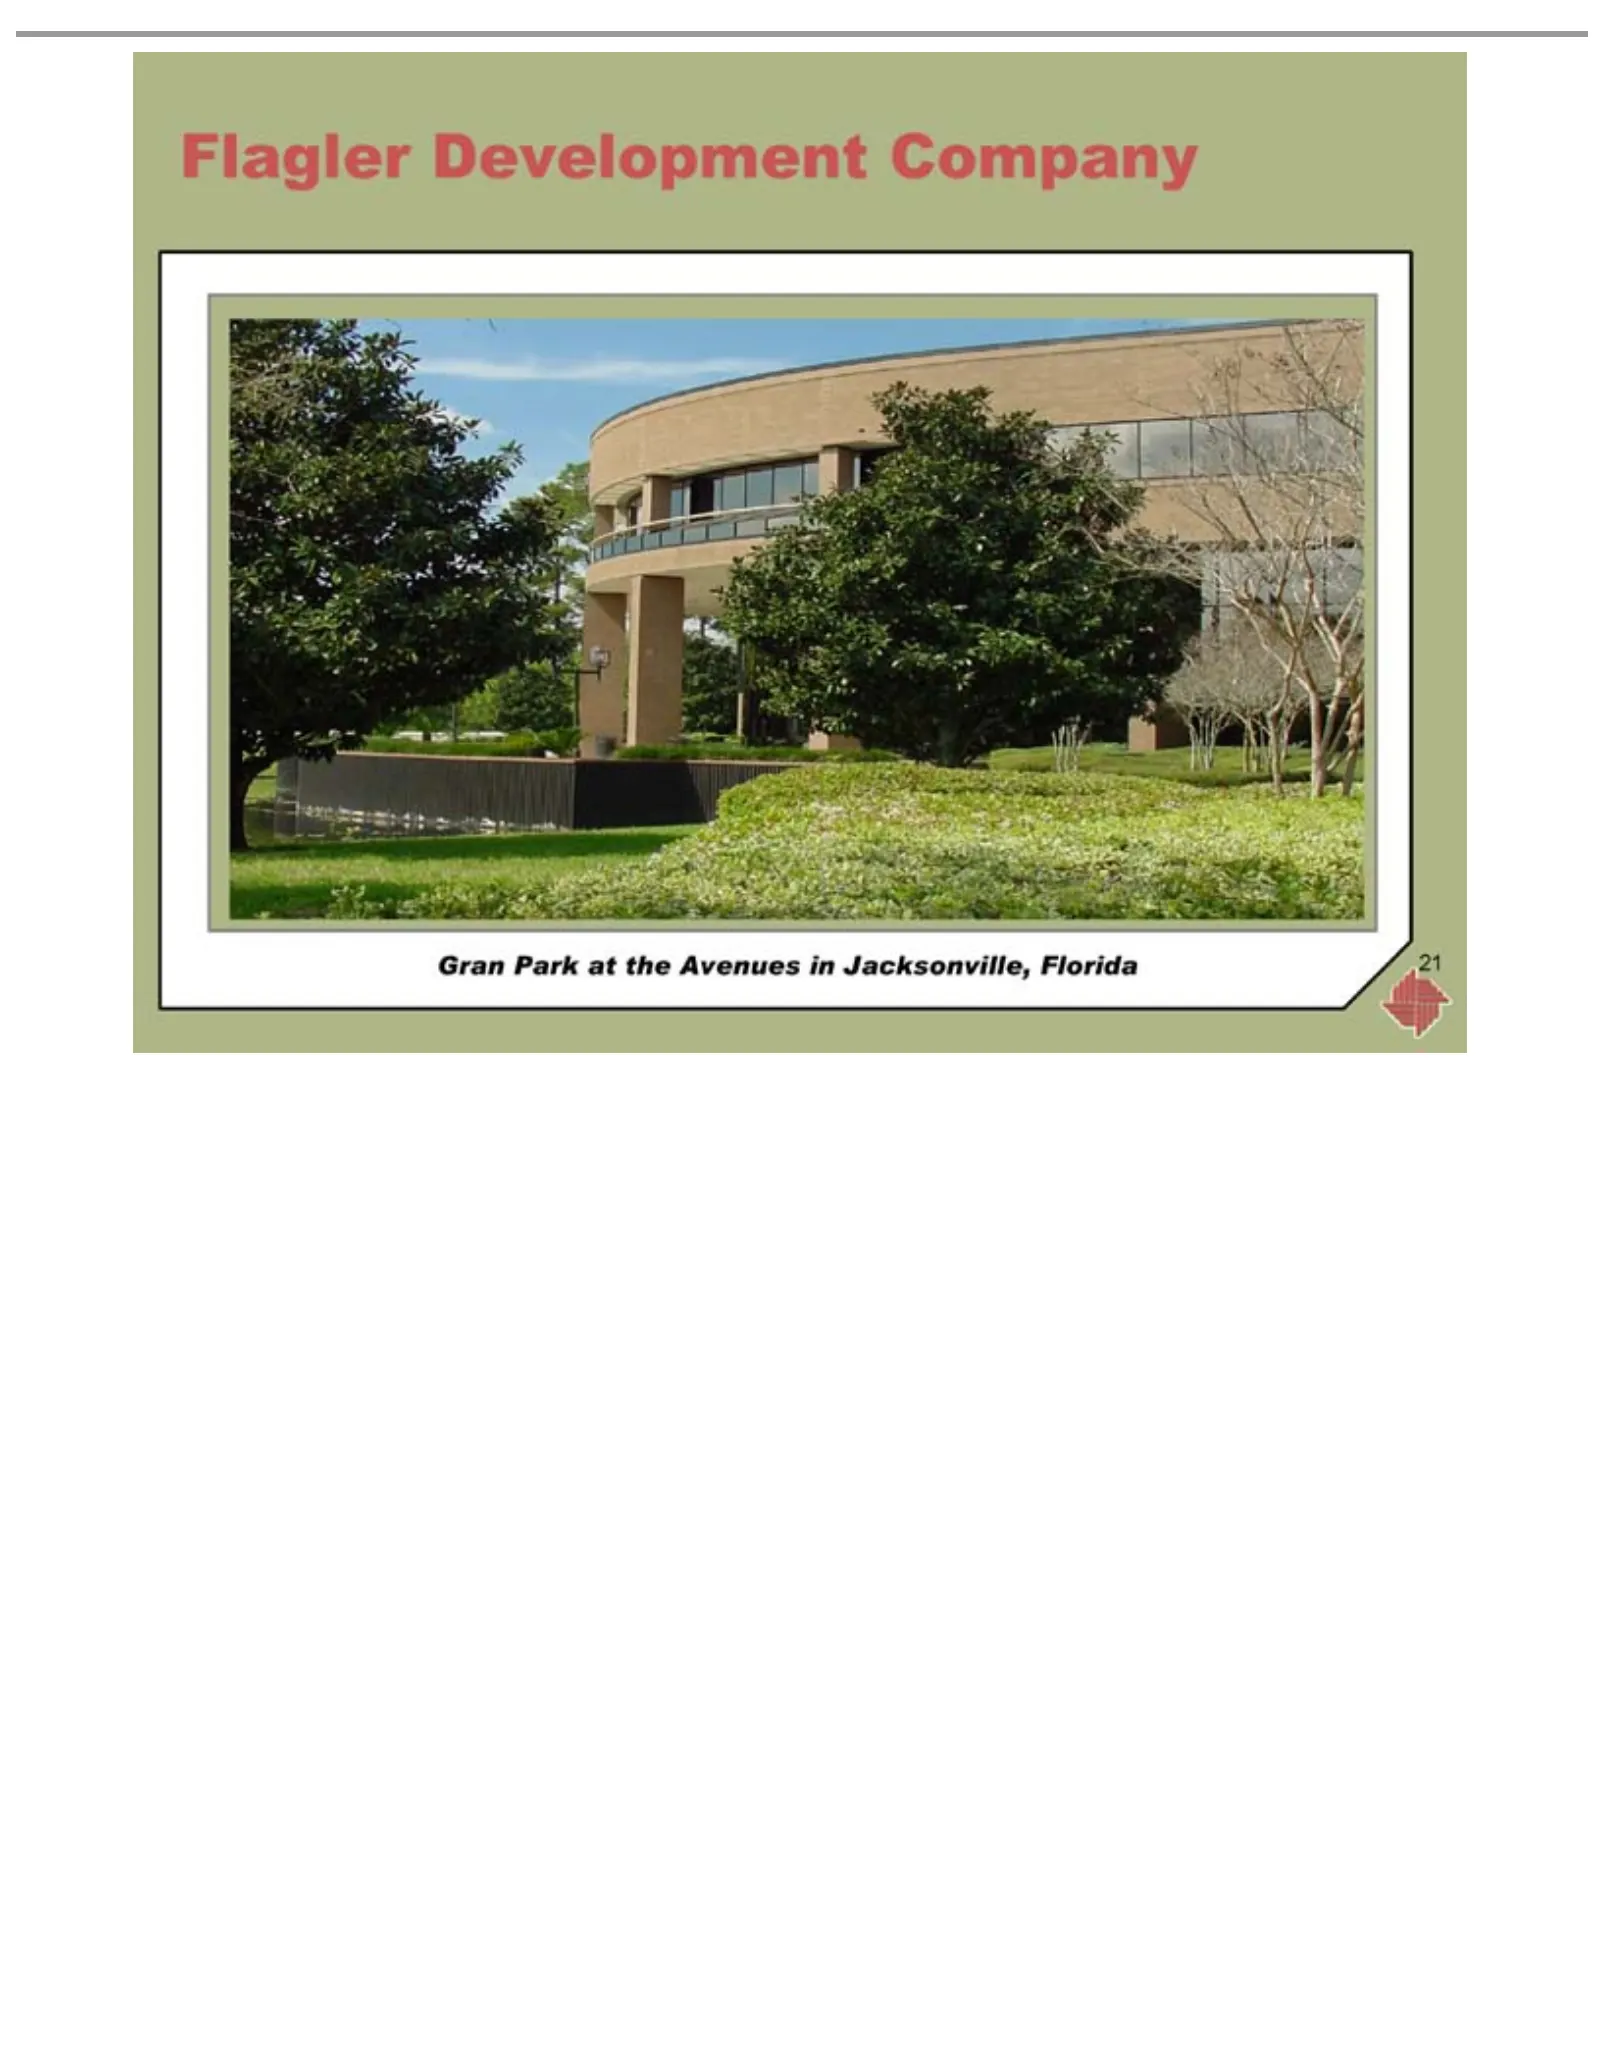
Slide 21: Flagler Development Company
Flagler Gran 21 Park Development at the Avenues Company in Jacksonville, Florida
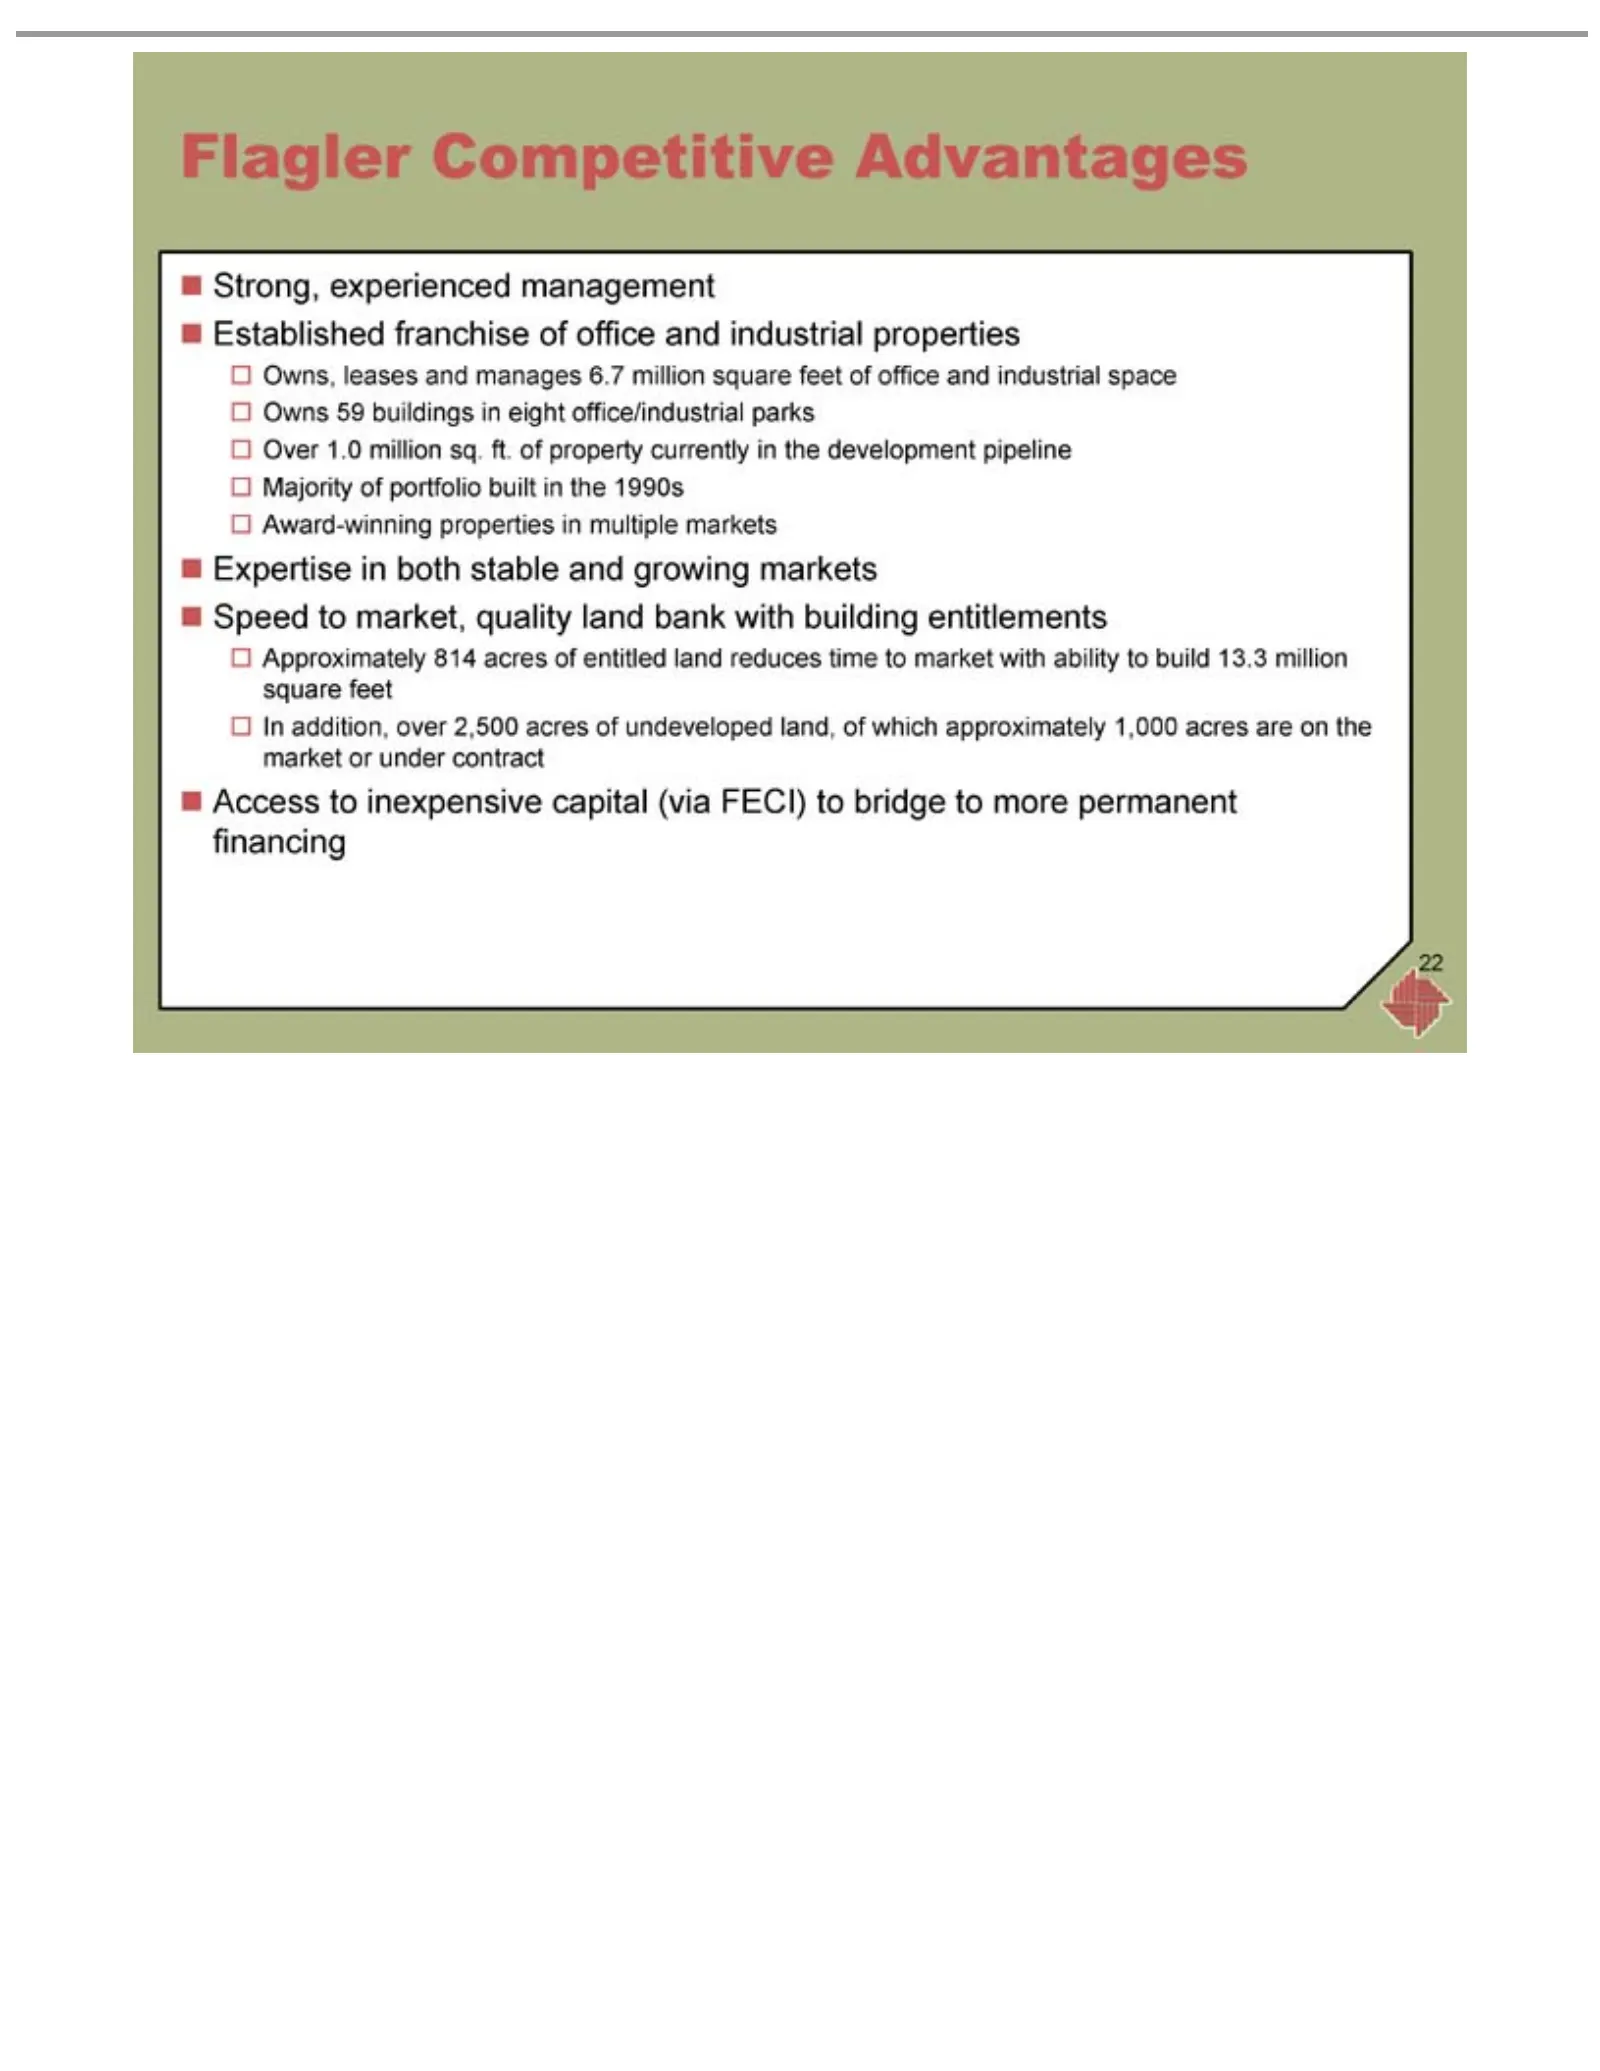
Slide 22: Flagler Competitive Advantages
?Flagler 22 Award-winning Approximately Access Strong, Established Owns, Owns Over Majority Expertise Speed In addition, 1.0 Competitive 59 to leases to experienced market, million of buildings in inexpensive portfolio over franchise both and 814 properties 2,500 sq. quality stable manages Advantage
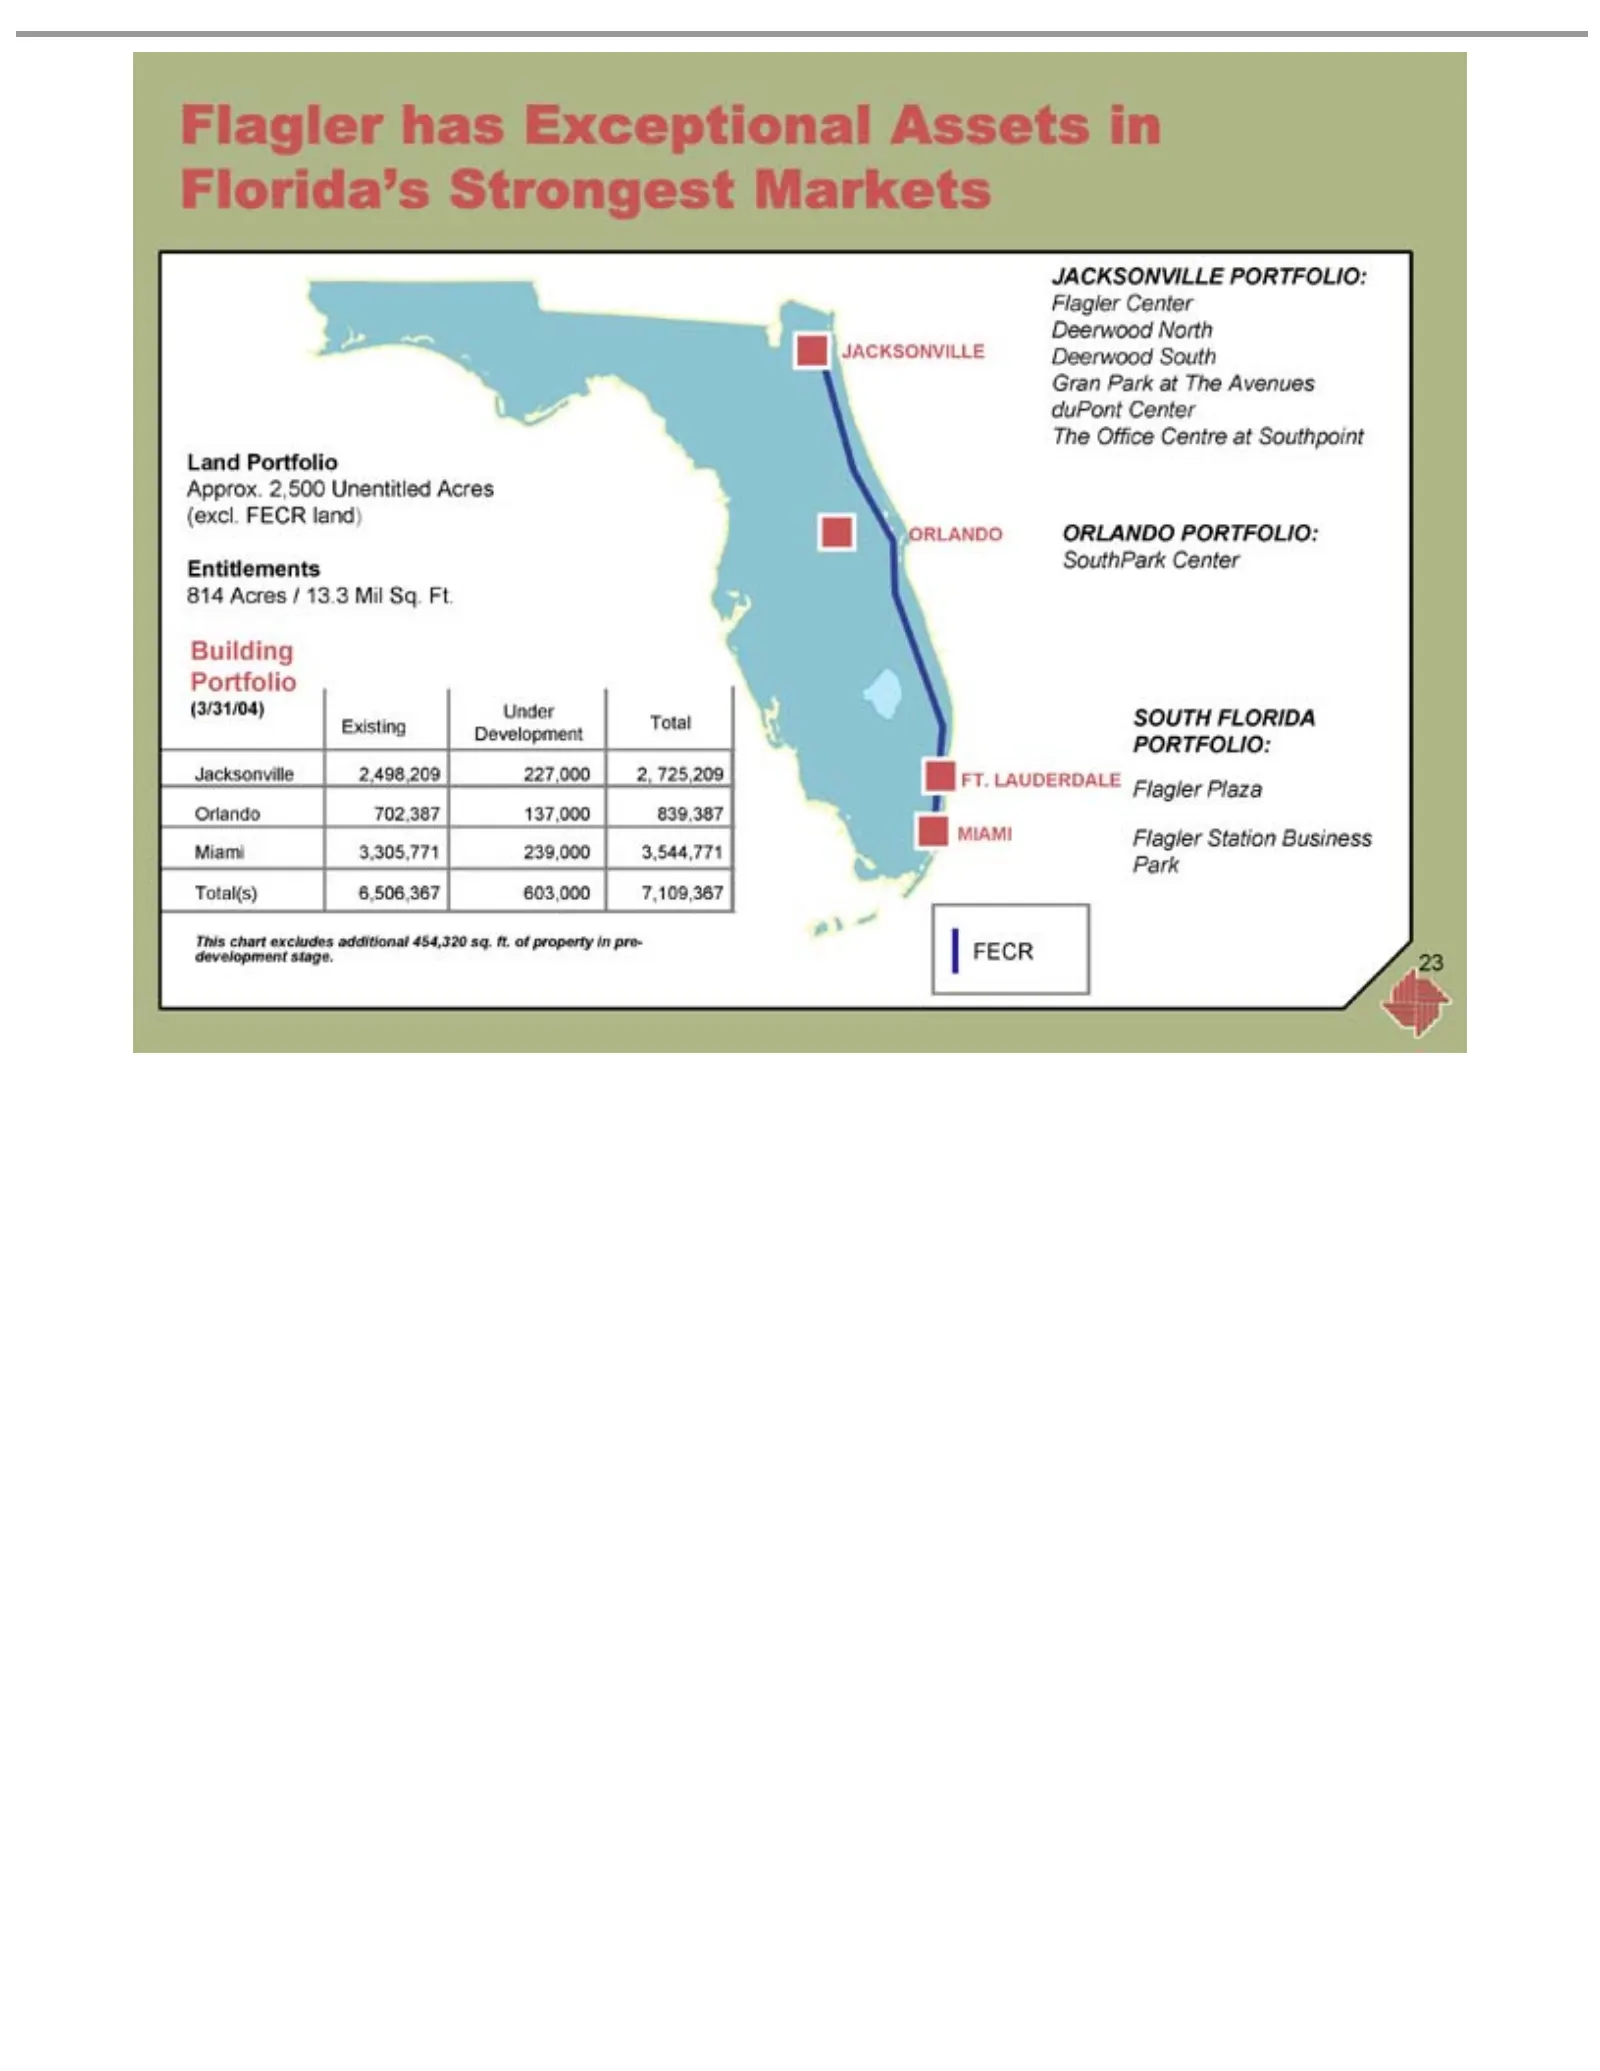
Slide 23: Flagler Land and Building Portfolio
LandLAUDERDALE Approx. 814 Entitlements (3/31/04) Portfolio Building Existing Jacksonville Development Orlando Miami Total(s) This development FT. JACKSONVILLE FECR MIAMI Gran ORLANDO SouthPark SOUTH Flagler 23 Acres chart Park Portfolio 3,305,771 has Center Plaza Station 6,506,367 702,387 2,500 Tot
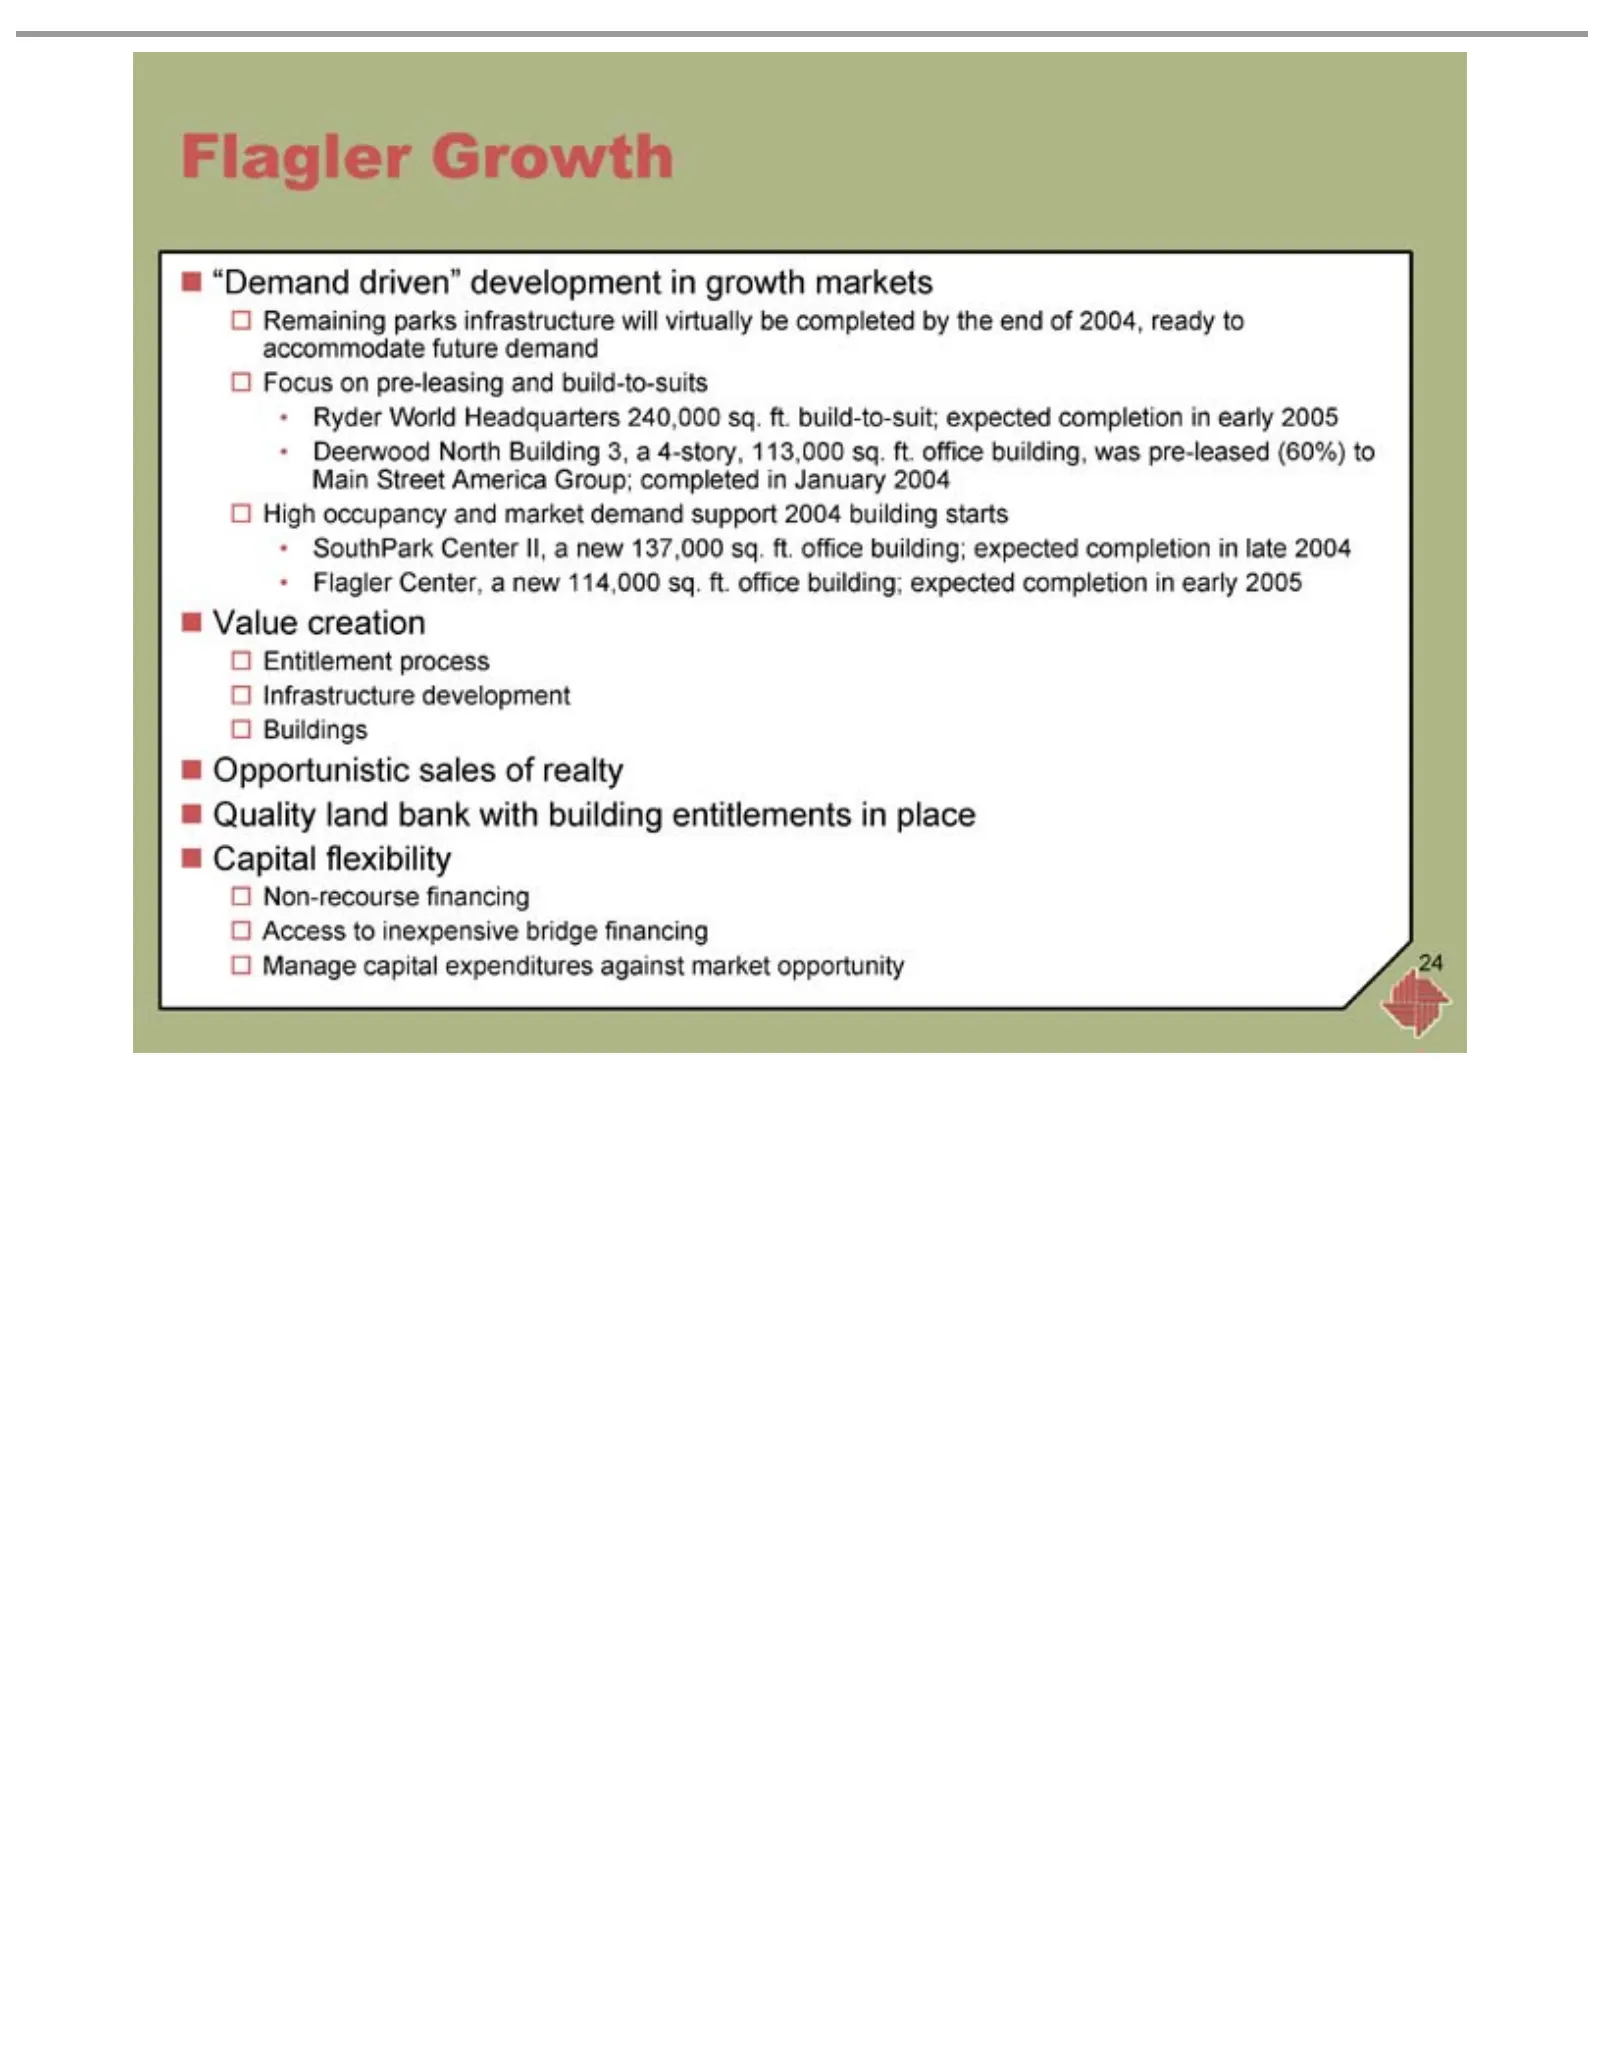
Slide 24: Flagler Strategy
?•Flagler Ryder Deerwood SouthPark Flagler Access Value “Demand Remaining Focus High Entitlement Infrastructure Buildings Opportunistic Quality Capital Non-recourse Manage occupancy Growth creation World on Center, to flexibility land capital pre-leasing inexpensive driven” North Center parks proces
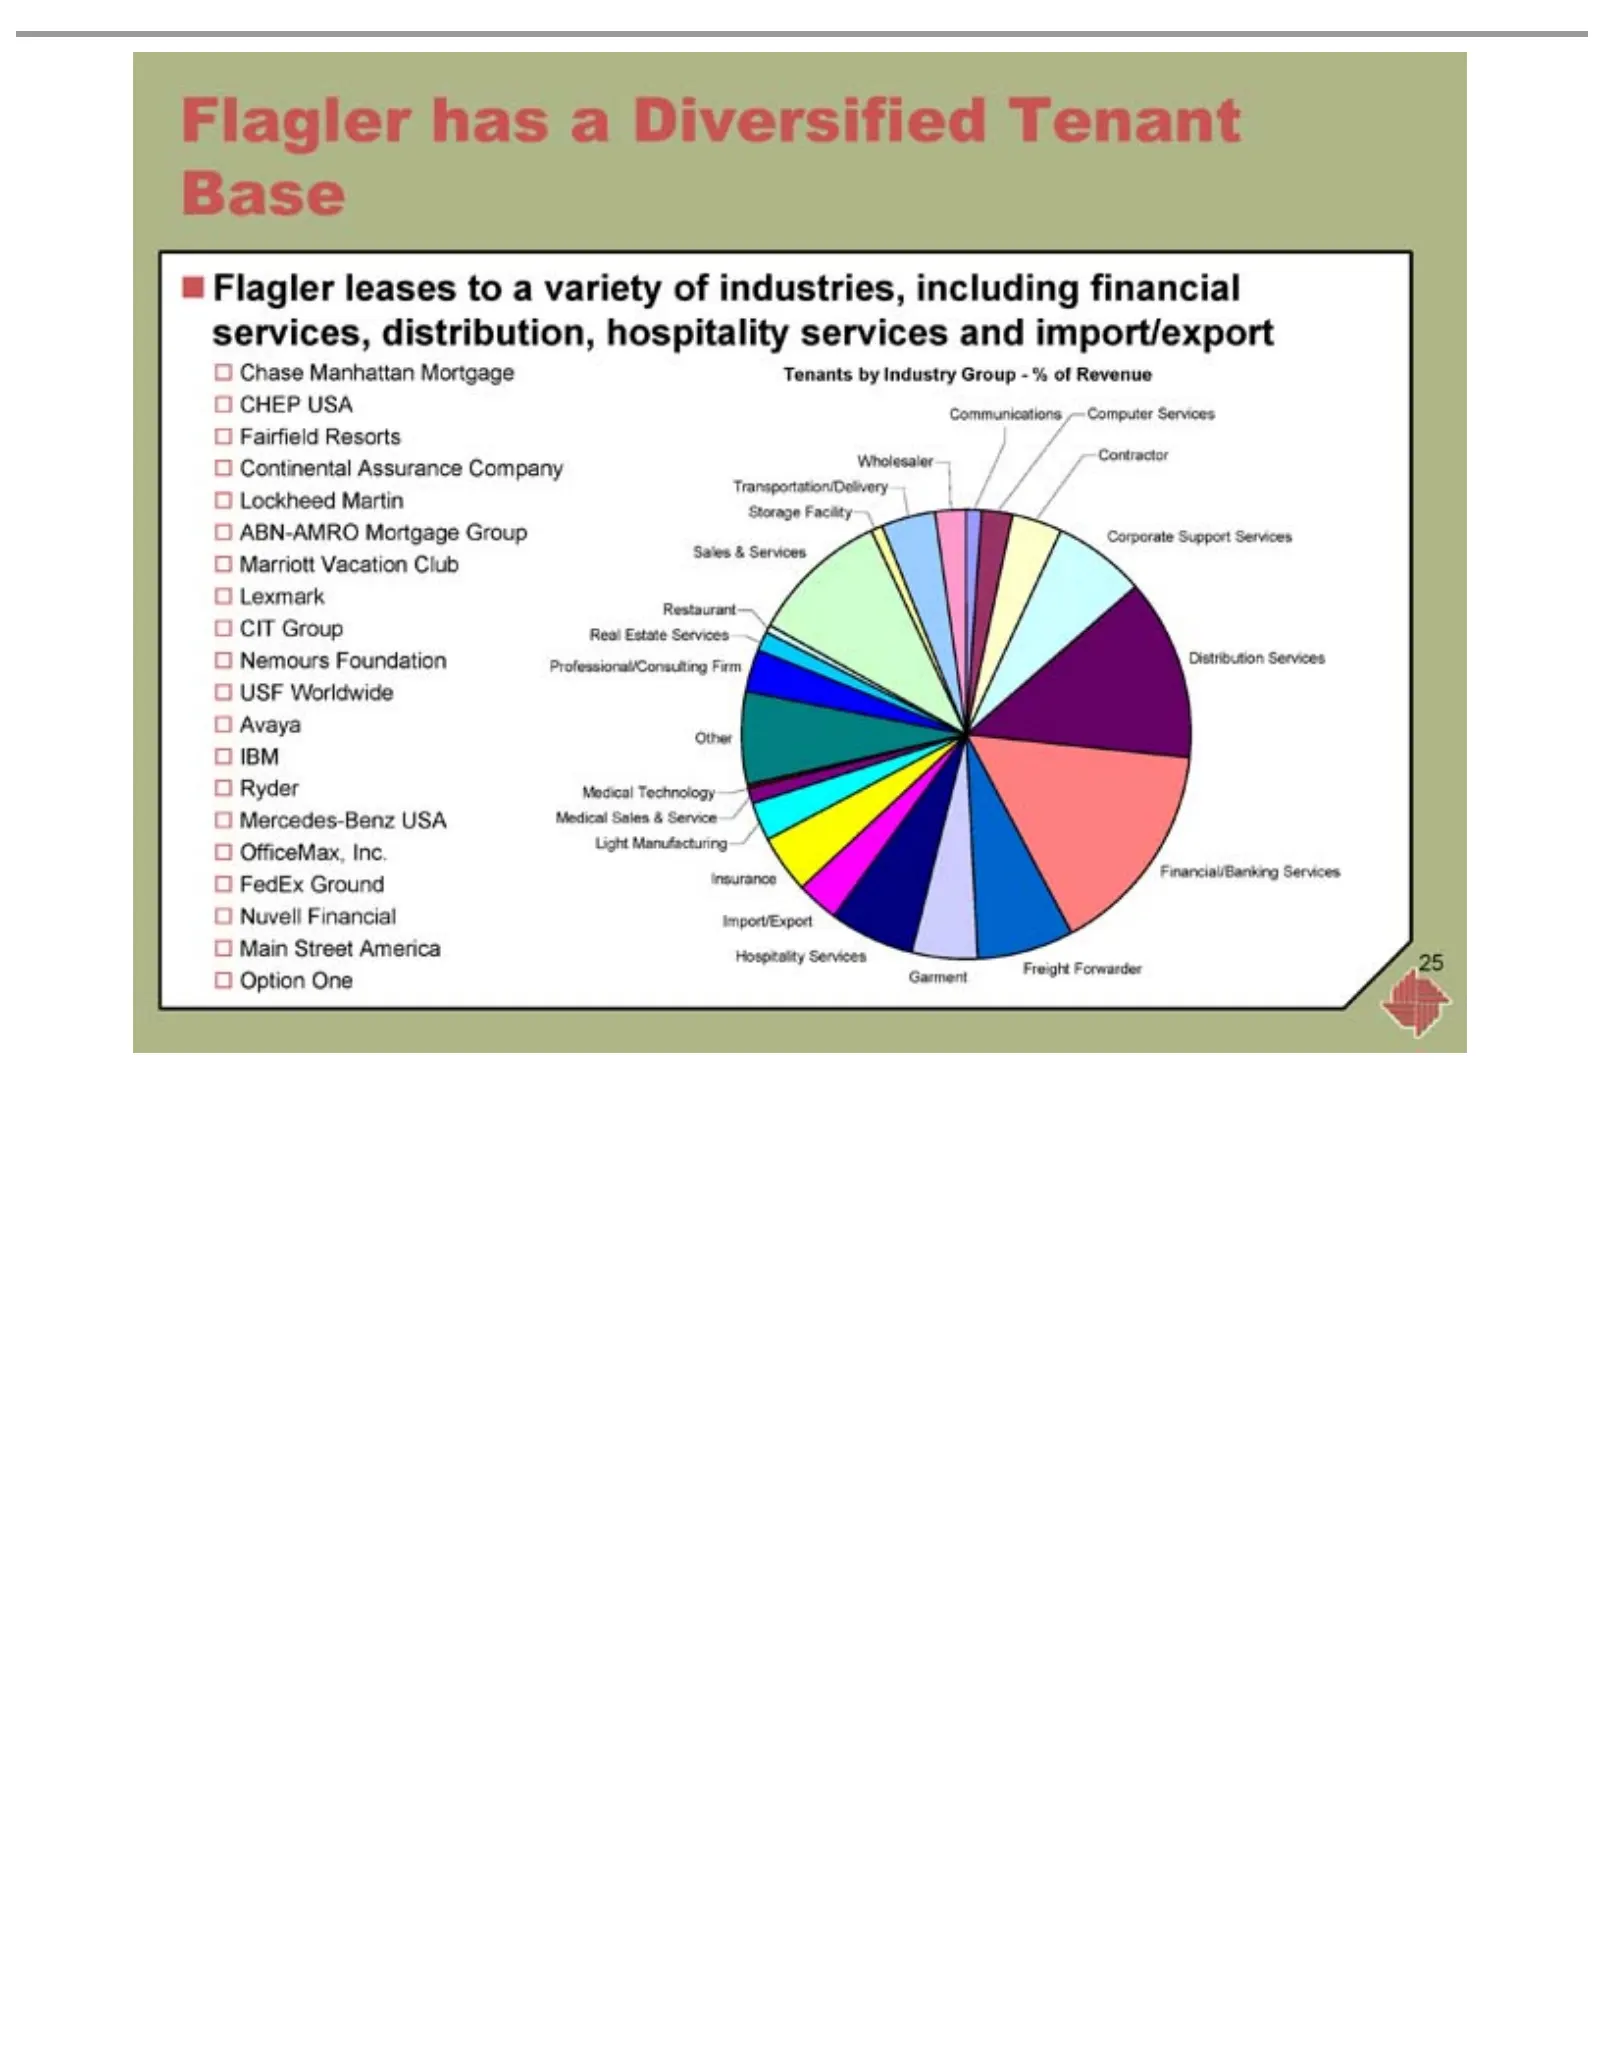
Slide 25: Flagler Tenants
?Flagler Tenants Storage Transportation/Delivery Wholesaler Communications Sales Real Restaurant Professional/Consulting Other Medical Hospitality Import/Export Insurance Freight Garment Financial/Banking Distribution Corporate Computer Contractor 25ABN-AMRO Avaya Flagler Chase CHEP Fairfield Contin
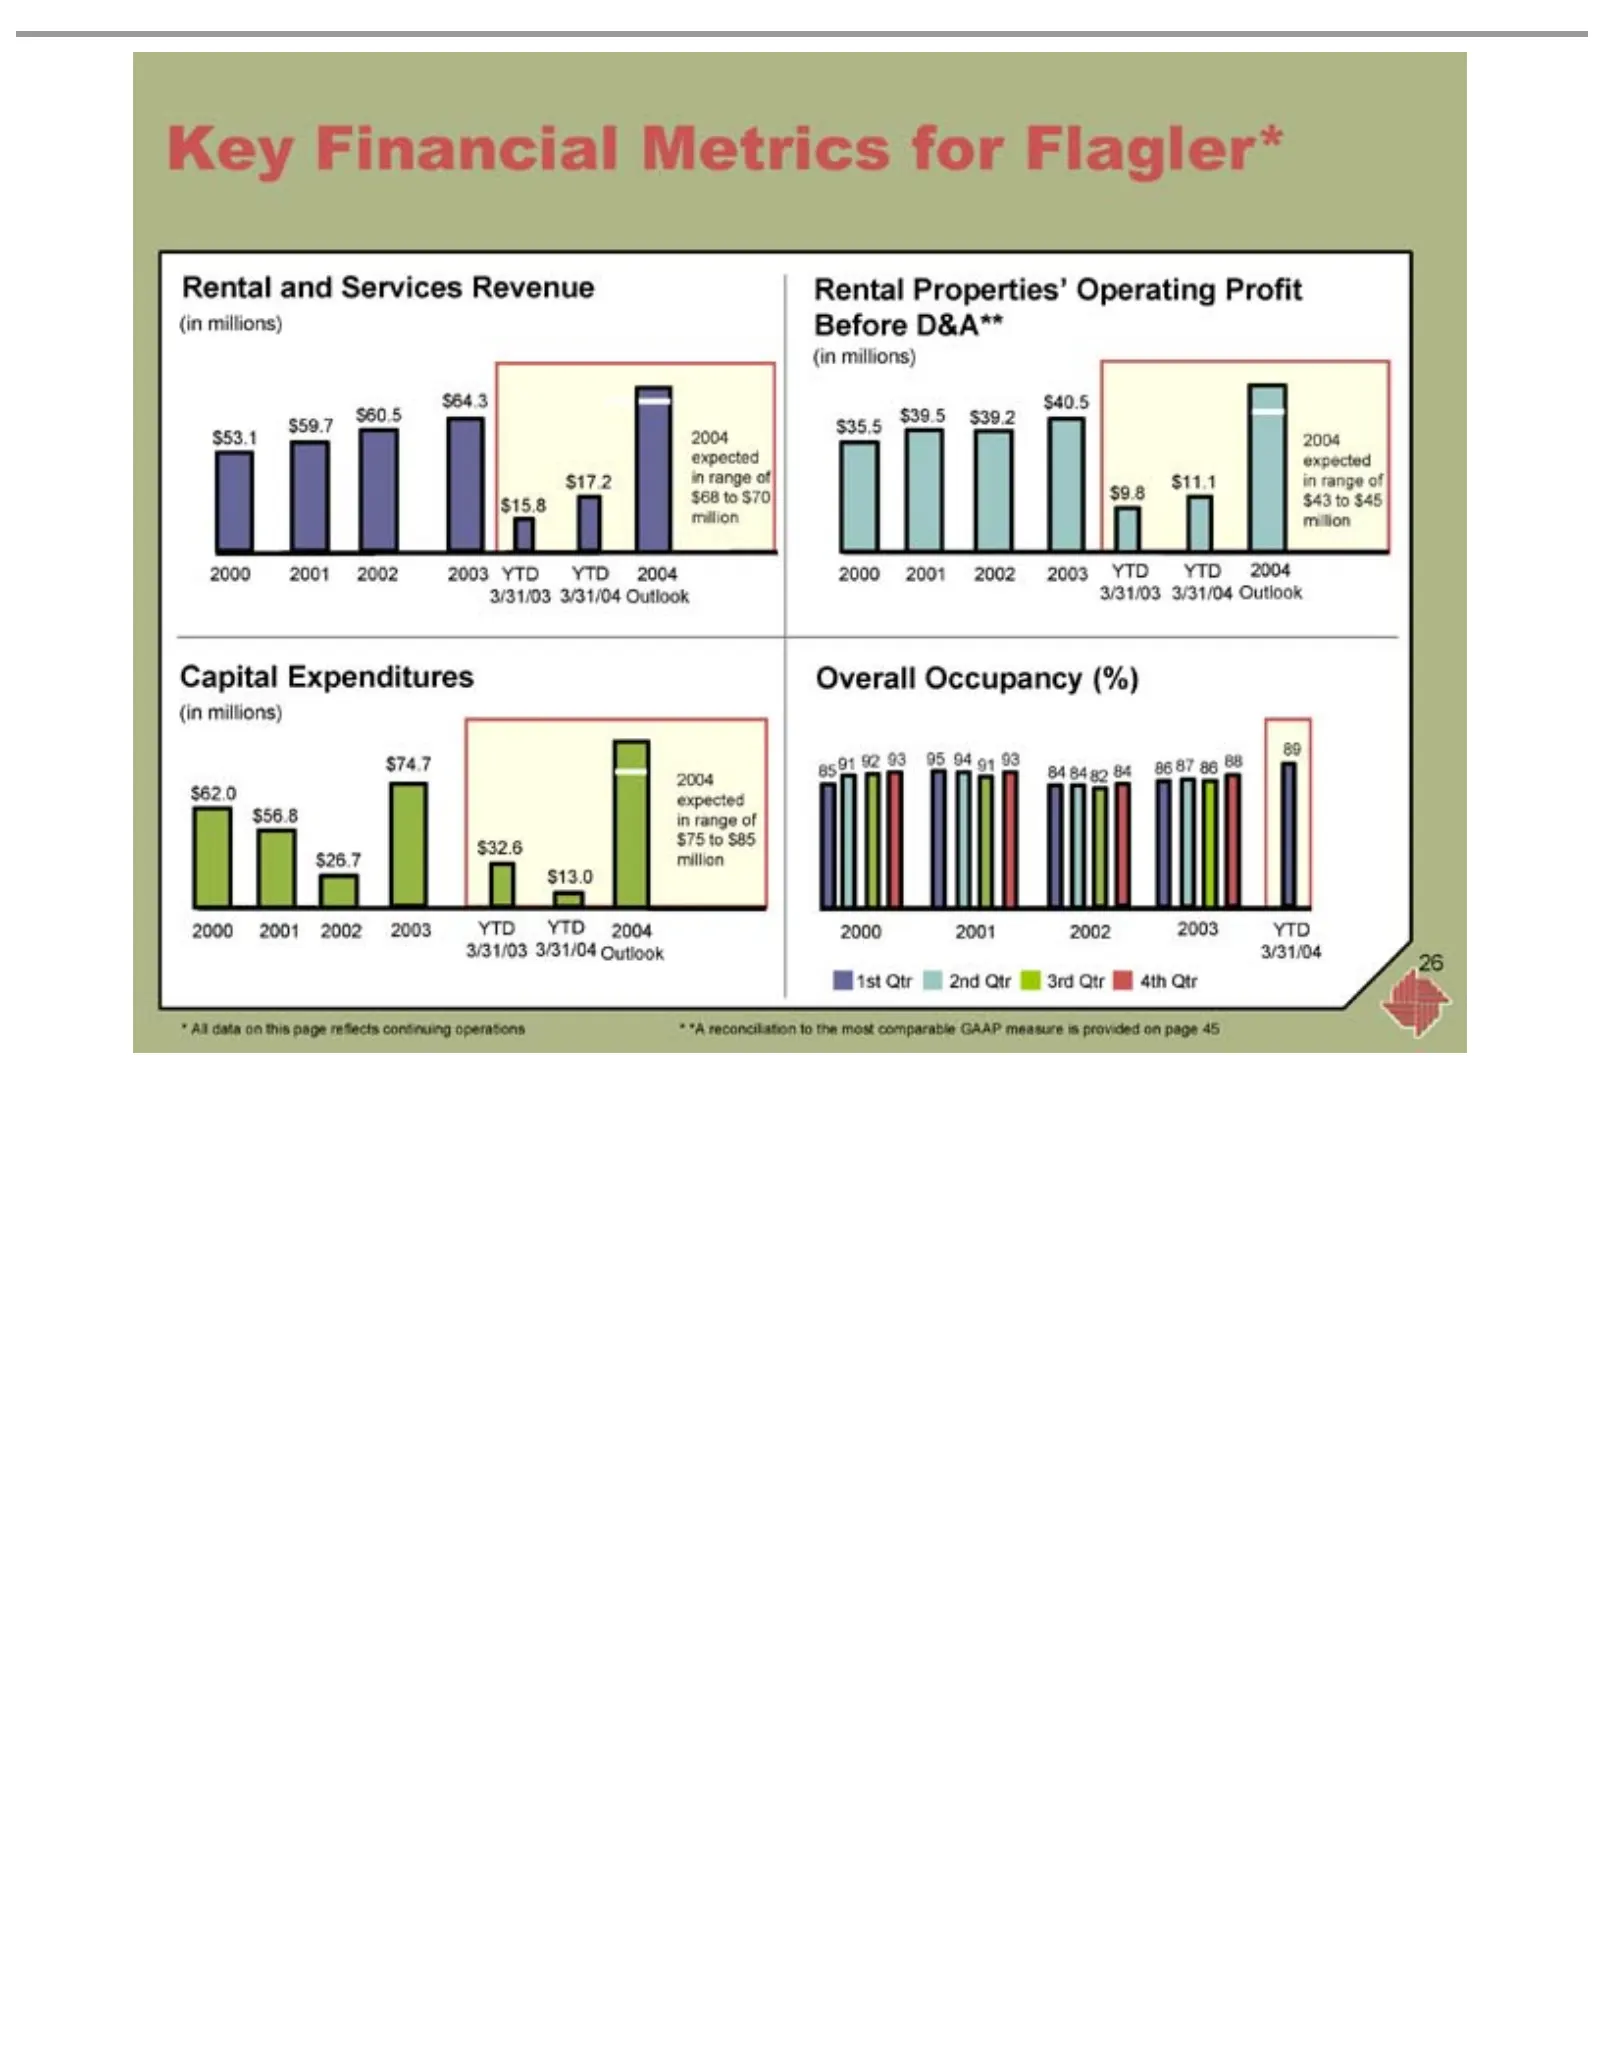
Slide 26: Flagler Rental Properties Financials and Capital Expenditures
Key Capital Rental (in expected 2004 $ million 3/31/03 Overall 8591 89 2000 8482 1st 3/31/04 * 26All 64.3 60.5 59.7 53.1 17.2 15.8 74.7 62.0 56.8 32.6 26.7 13.0 40.5 39.5 35.5 11.1 9.8 *Amillions) Qtr Financial reconciliation data $43 92 2001 in 2004 $68 expected $75 $million and Properties’ 2nd Exp
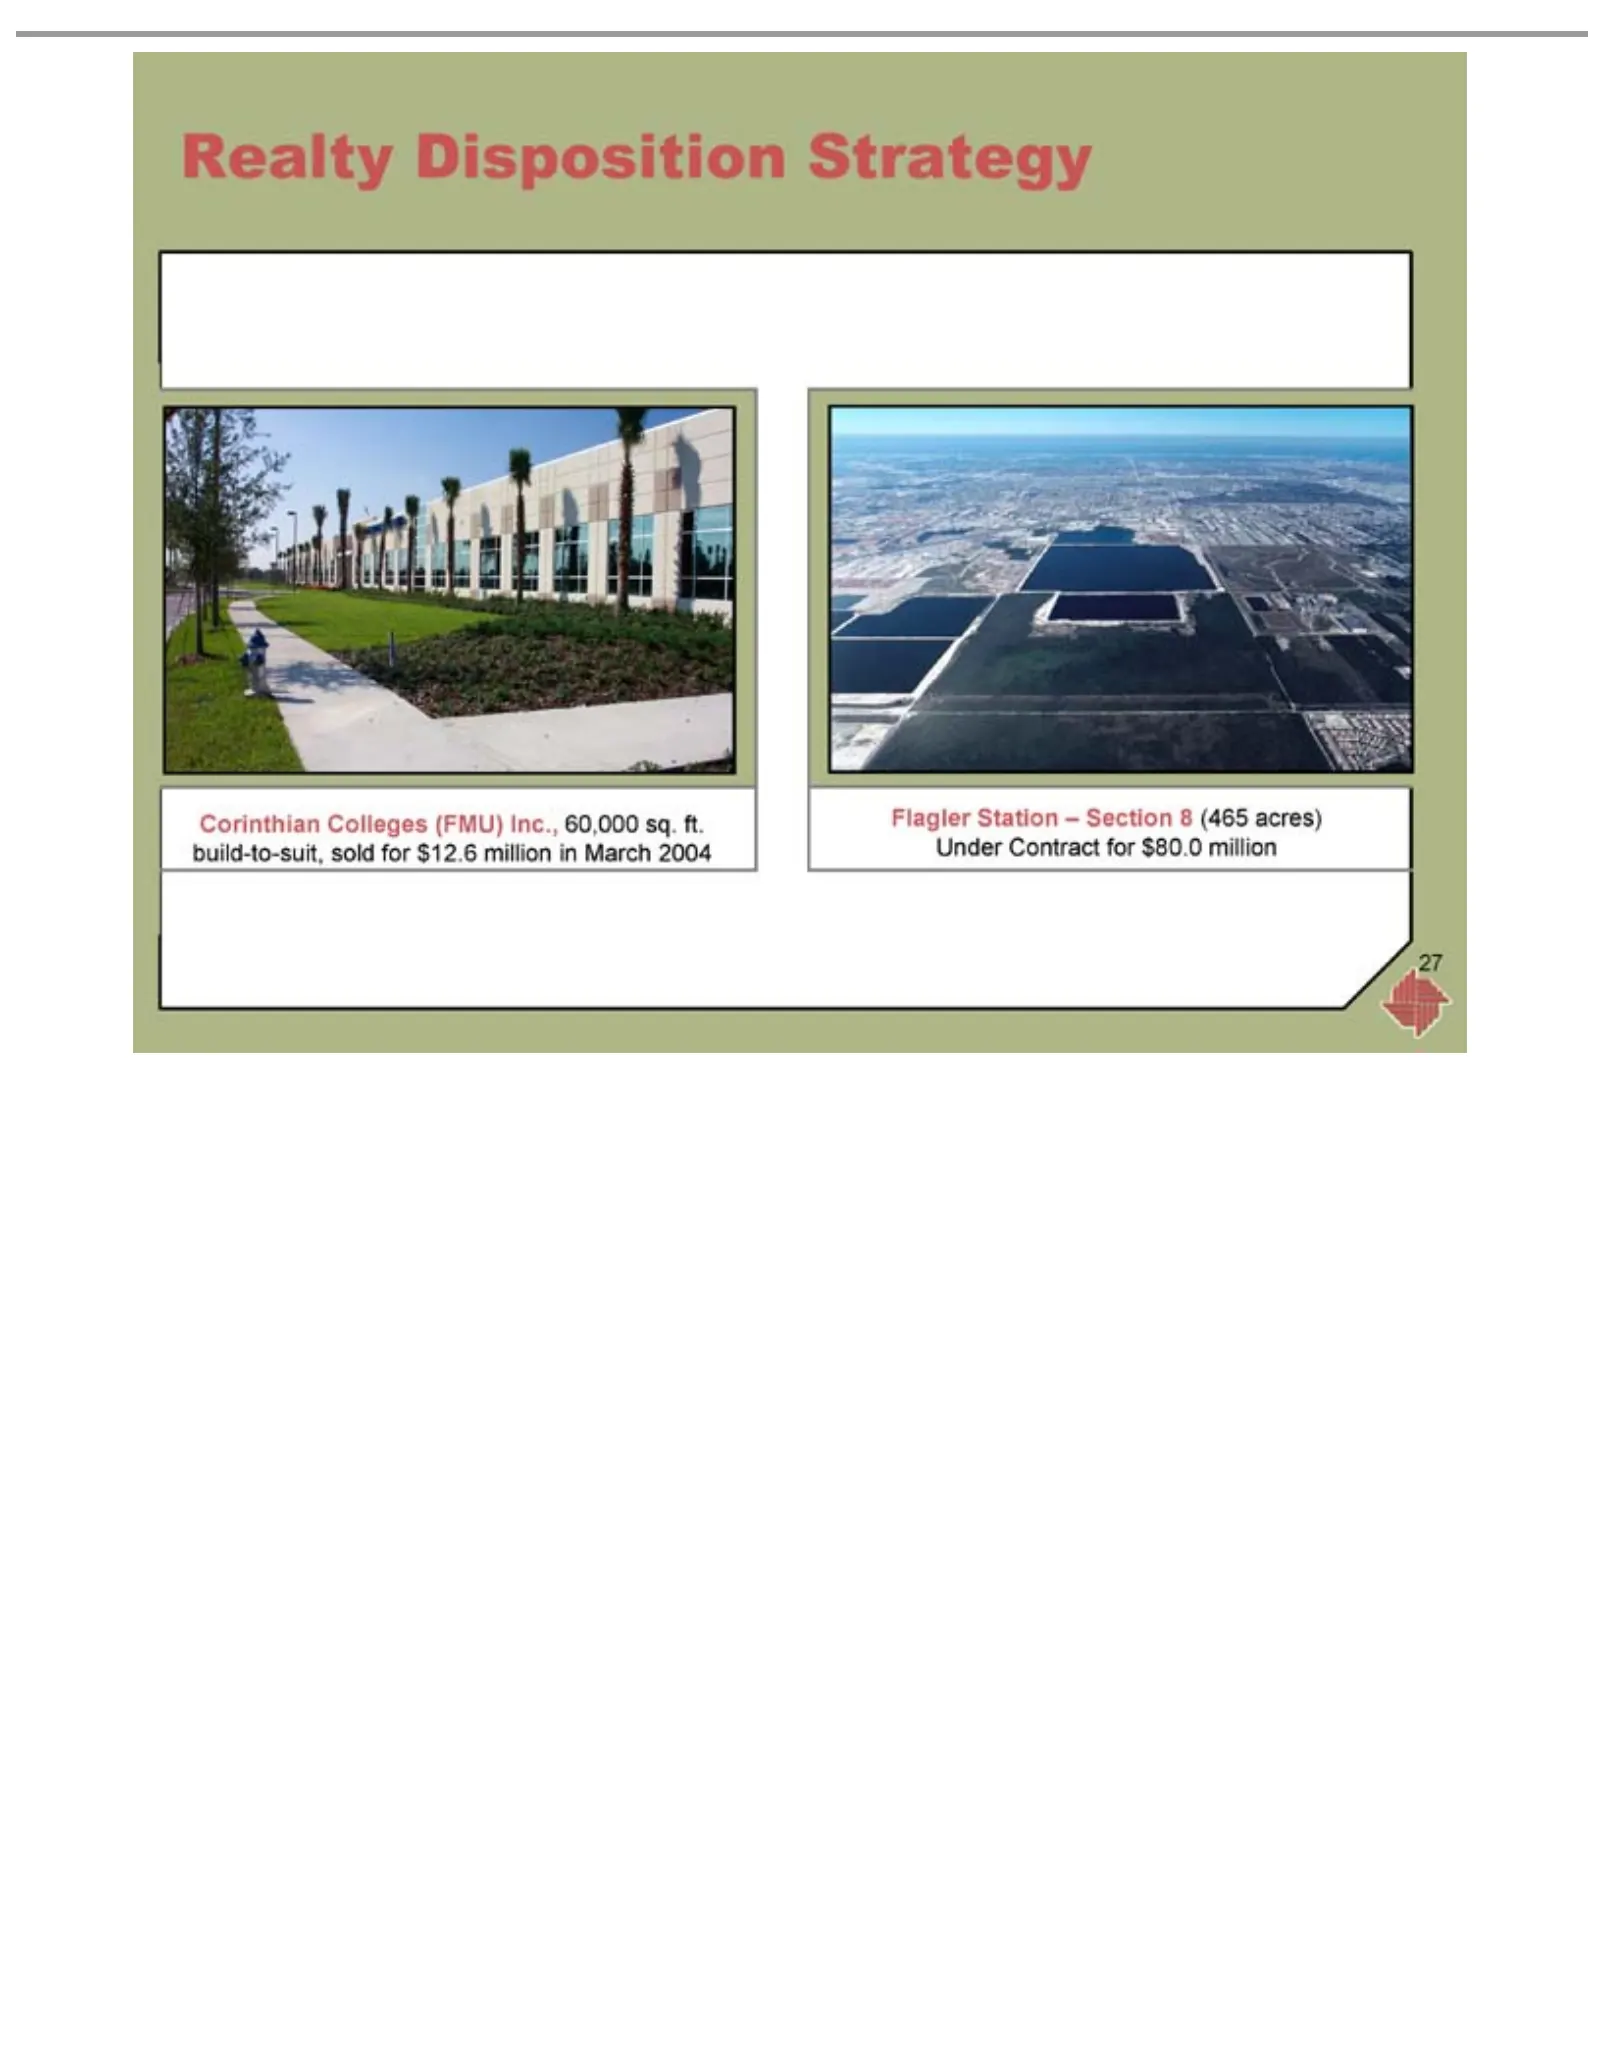
Slide 27: Realty Disposition Strategy – Section 8
Realty Disposition Corinthian Flagler 27 Station Colleges – Section Strategy (FMU)8 (465 Inc.,acres) 60,000Under sq. ft.Contract build-to-suit, for $80.0 soldmillion for $12.6 million in March 2004
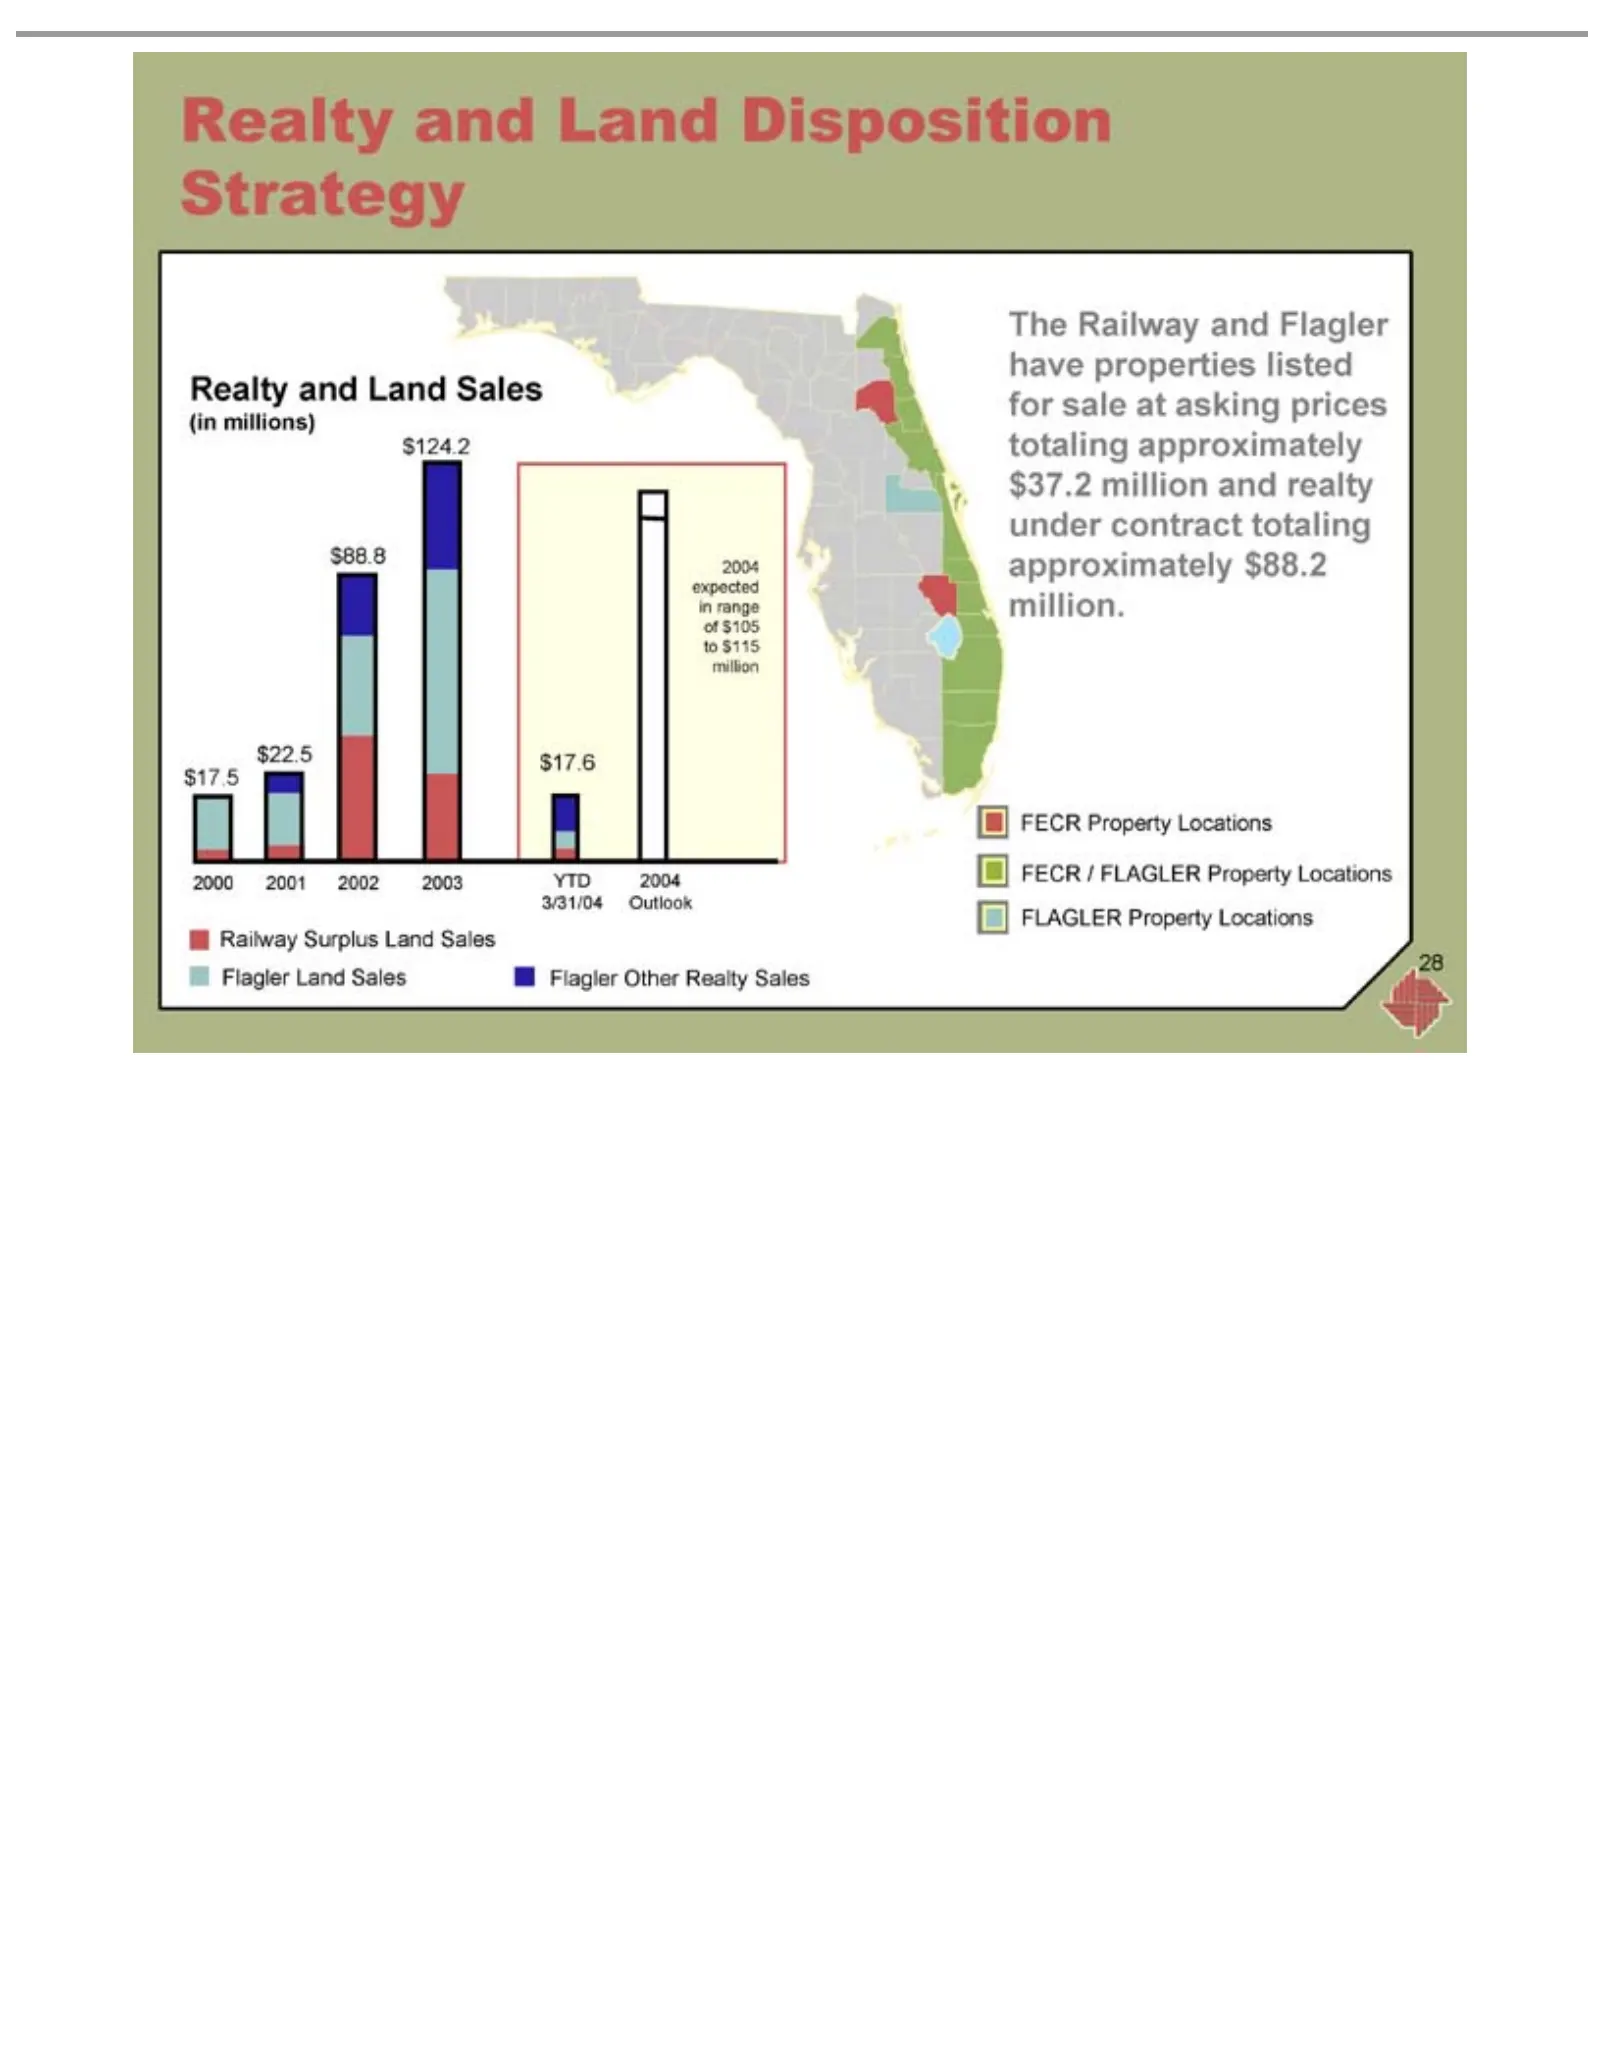
Slide 28: Realty Sales Results and Outlook
Realty (in in expected 2004 of to million $ 2000 3/31/04 Railway Flagler The FECR 124.2 88.8 22.5 17.5 range $millions) 115 Railway 105 2001 $/Property and Other FLAGLER Outlook 17.6 Surplus 2002 Land and Realty Locations 2003 Disposition Sales Land Flagler Property Sales YTD Sales have 2004 Flagler
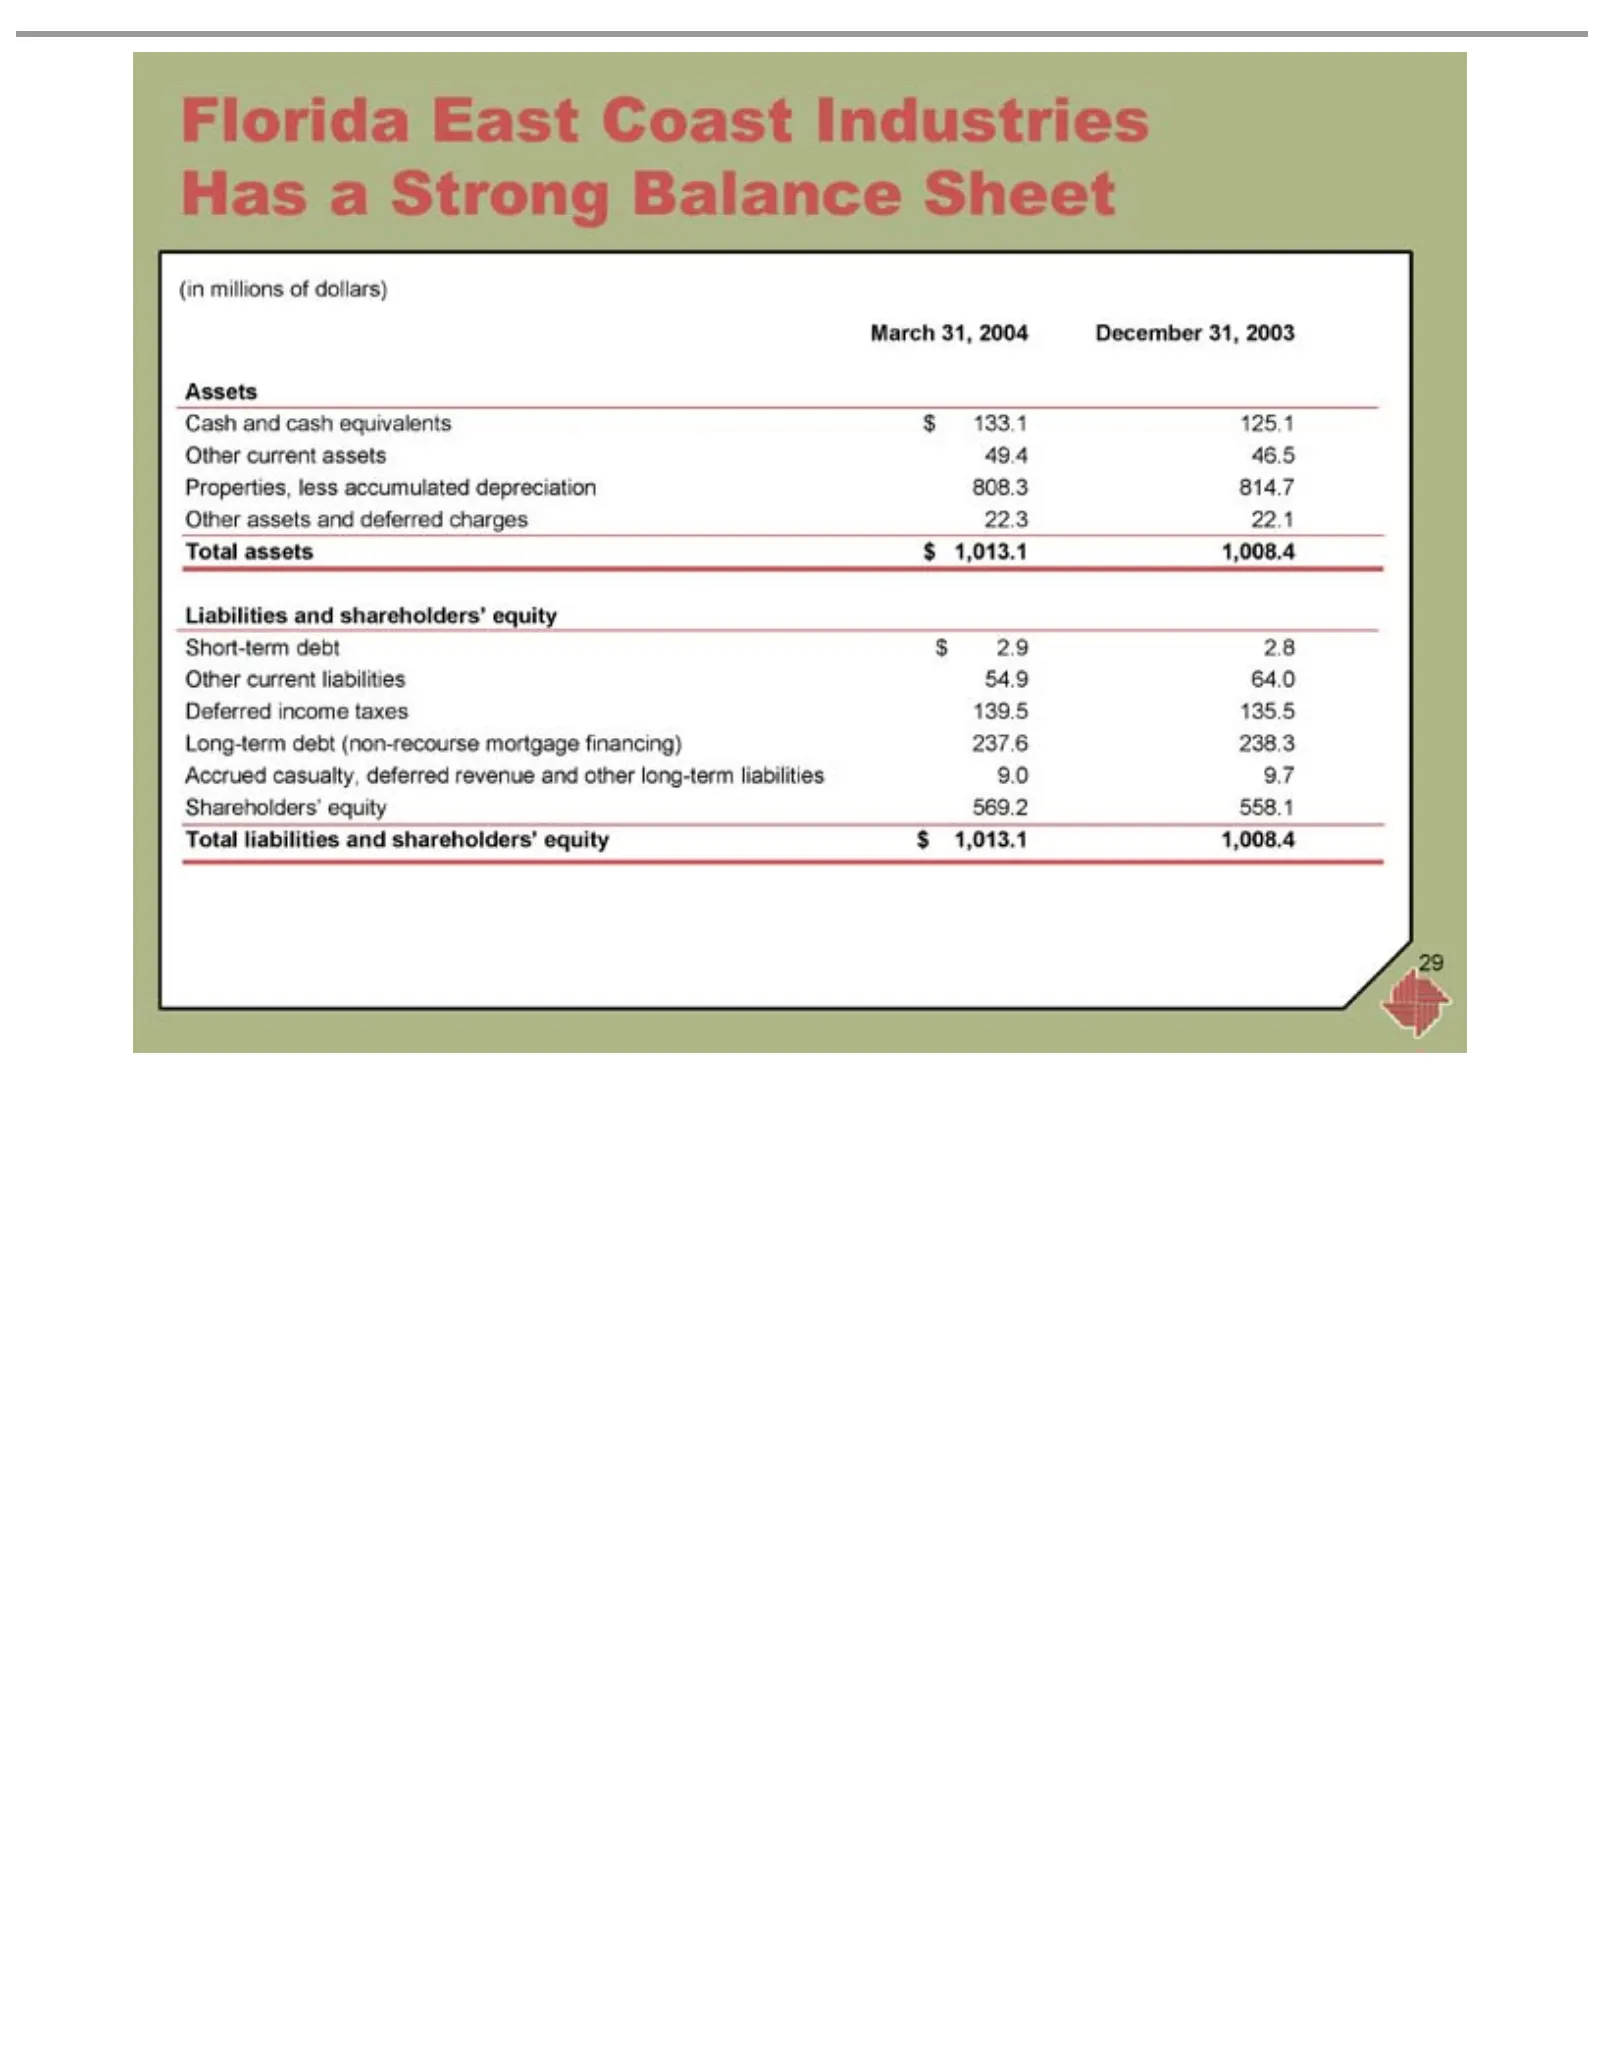
Slide 29: Florida East Coast Industries Has a Strong Balance Sheet
Florida (in March Cash Assets Properties, Liabilities Short-term Other Deferred Long-term Accrued Shareholders’ Total 29 millions and assets liabilities assets current 31, East casualty, income cash and 2004 debt less $of and Coast assets liabilities 1,013.1 equity equivalents dollars) shareholders’
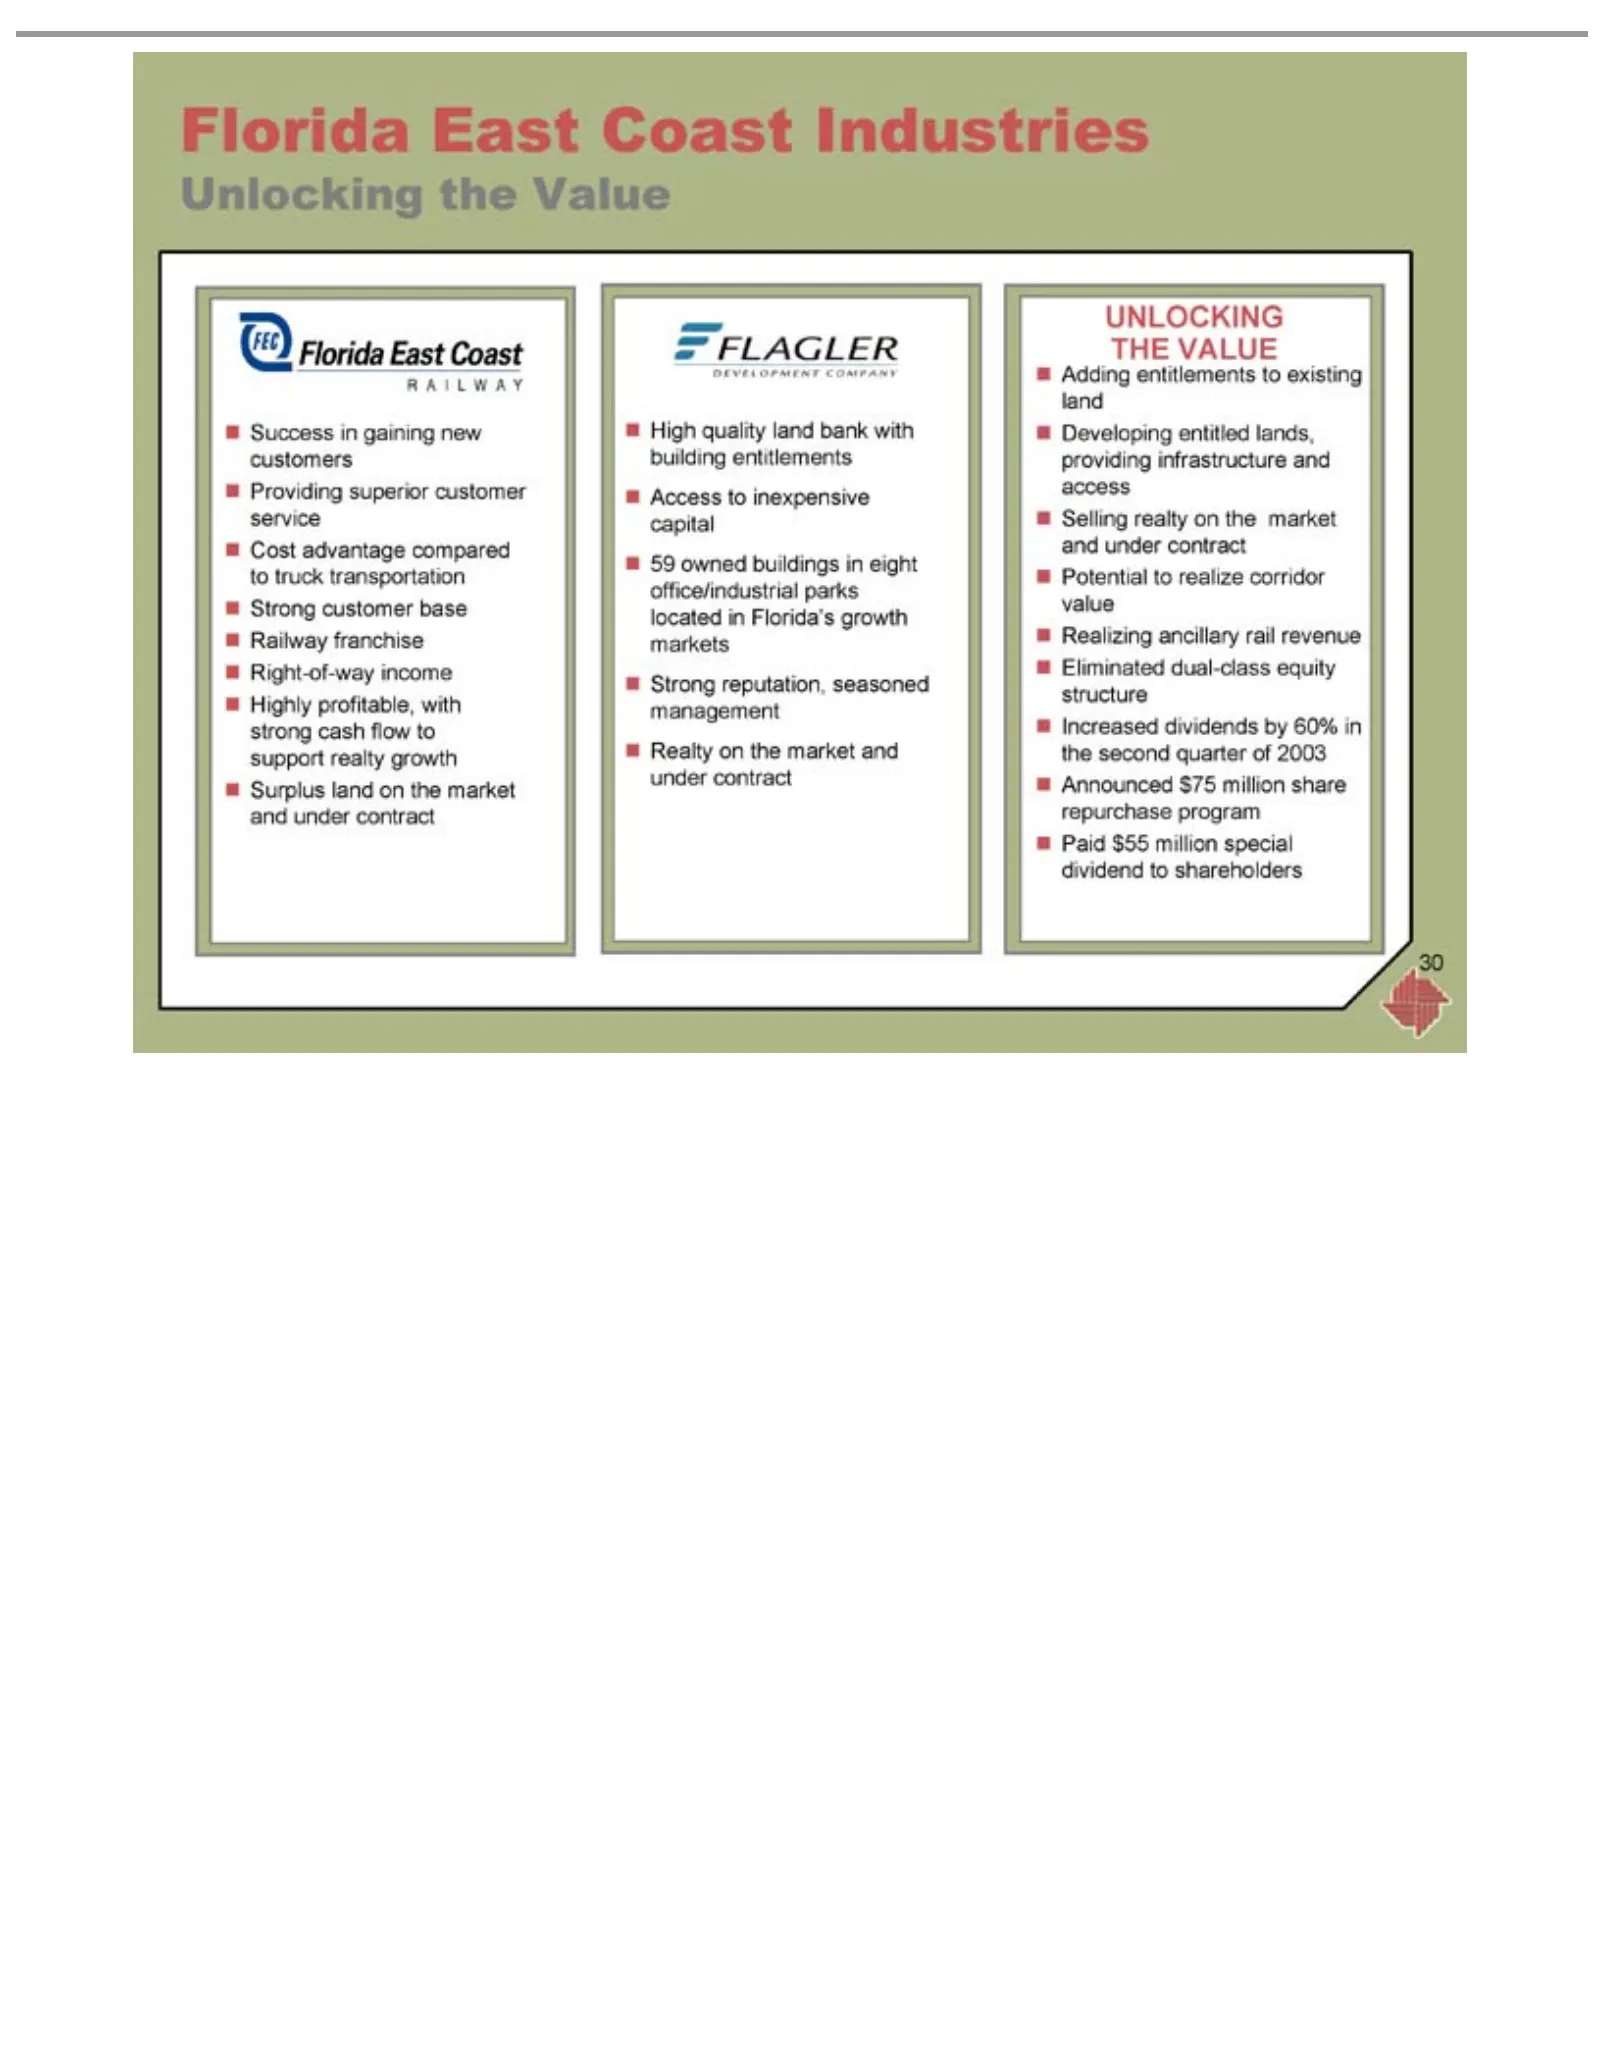
Slide 30: Unlocking the Value
Florida Unlocking Success profitable, High management ?UNLOCKING 30 Adding Announced Developing Selling Potential Realizing Eliminated Increased Paidquality $55 East inrealty entitlements with gaining the million to dividends ancillary Coast land dual-class Realty $75 realize entitled Value THE on s
Slide 31: Flagler Properties Jacksonville Portfolio
Flagler Properties Jacksonville 31 Portfolio
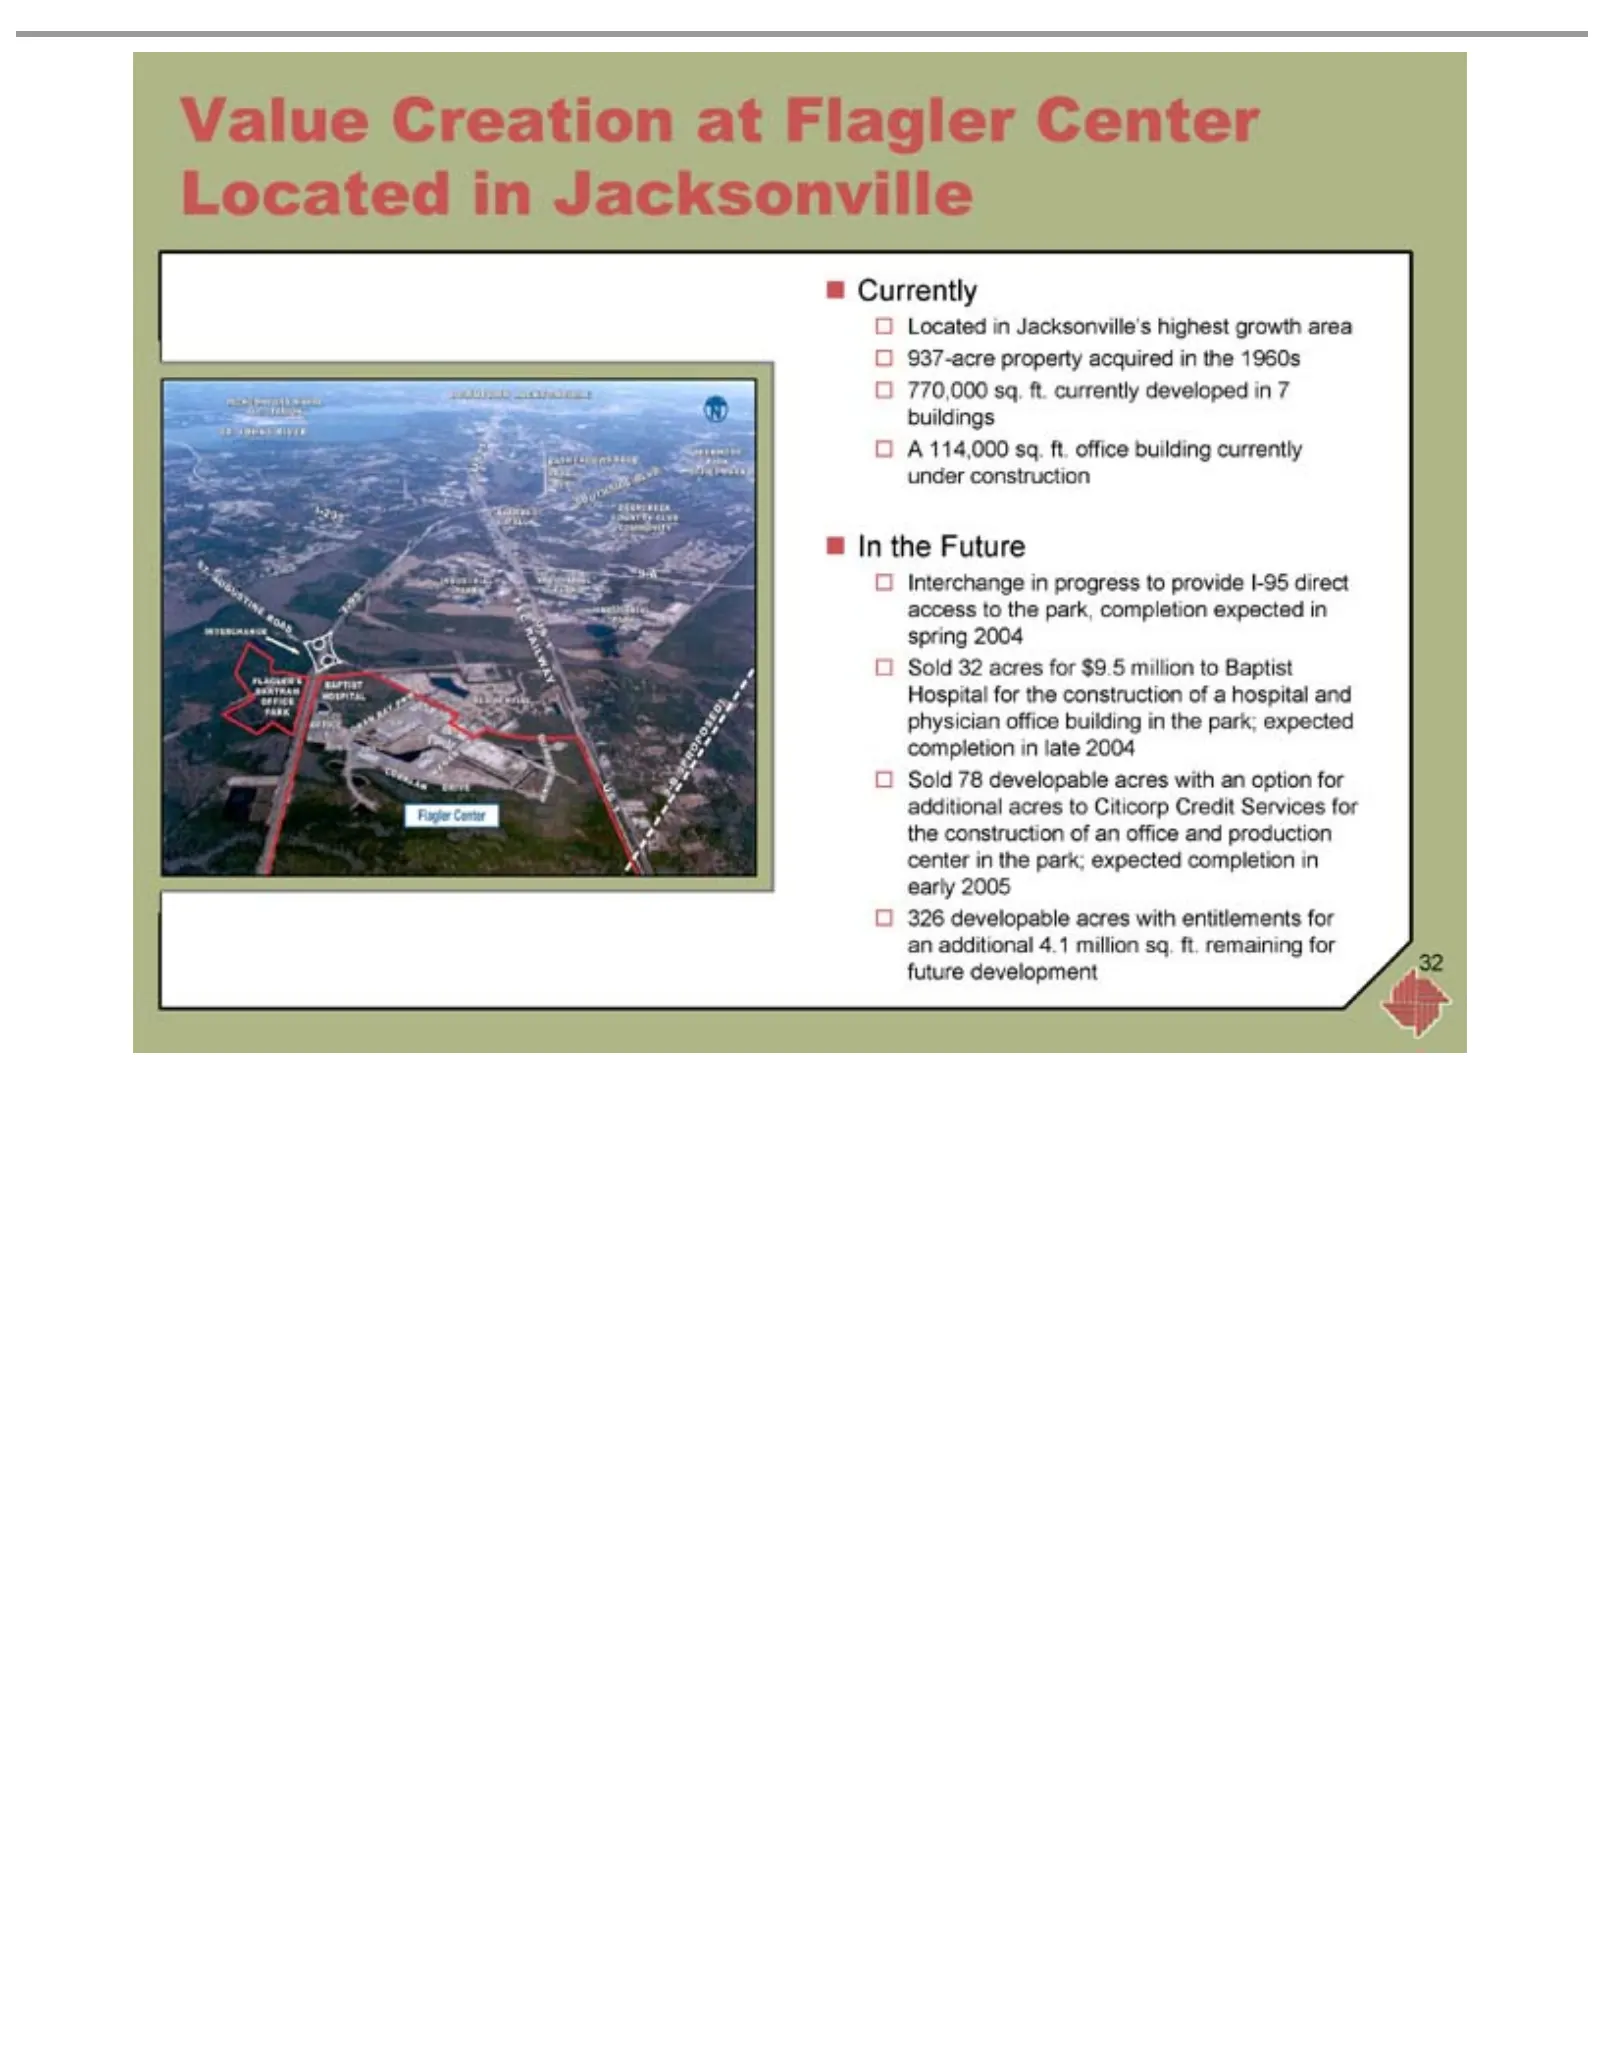
Slide 32: Value Creation – Flagler Center, Jacksonville
?Value 32 A Currently Located 937-acre 770,000 In Interchange Sold 326114,000 the developable Creation 32 78 Future acres developable in sq. property sq. Jacksonville’s ft. inat for ft. progress currently Flagler office acres $9.5 acquired acres million with building Center to developed highest prov
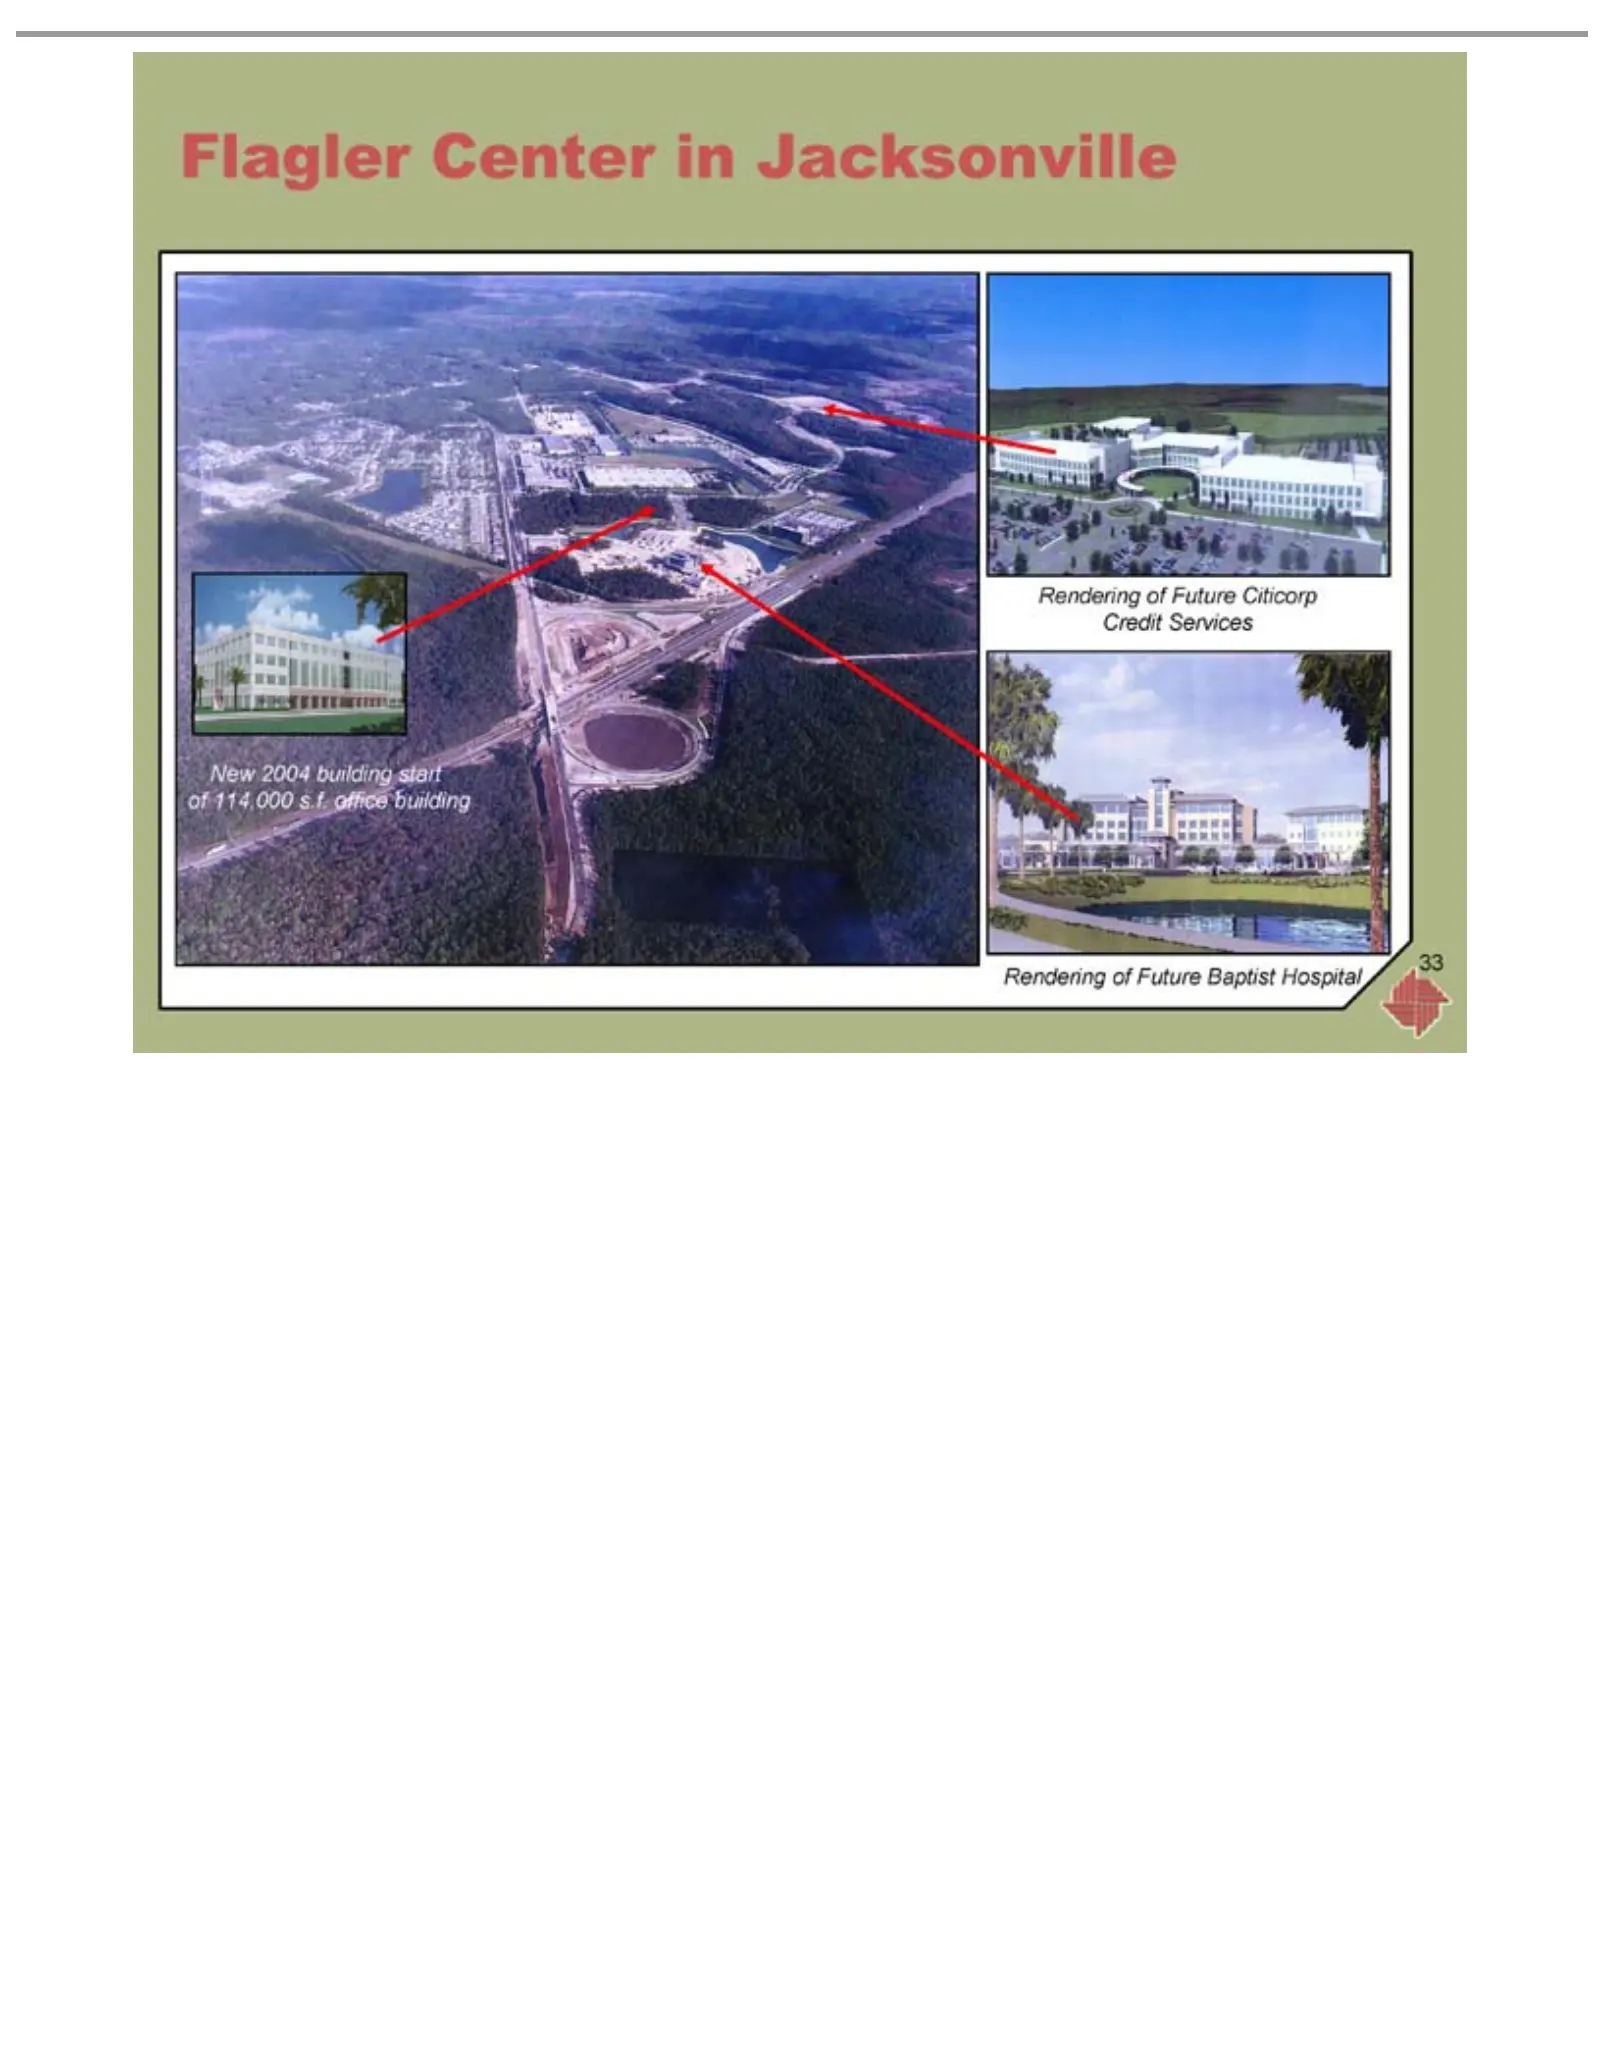
Slide 33: New Rendering of Future Buildings in Jacksonville
Flagler New Rendering 33 2004 Center building of Future in Jacksonville start Citicorp Baptist of 114,000 Hospital Credit s.f. Services office building
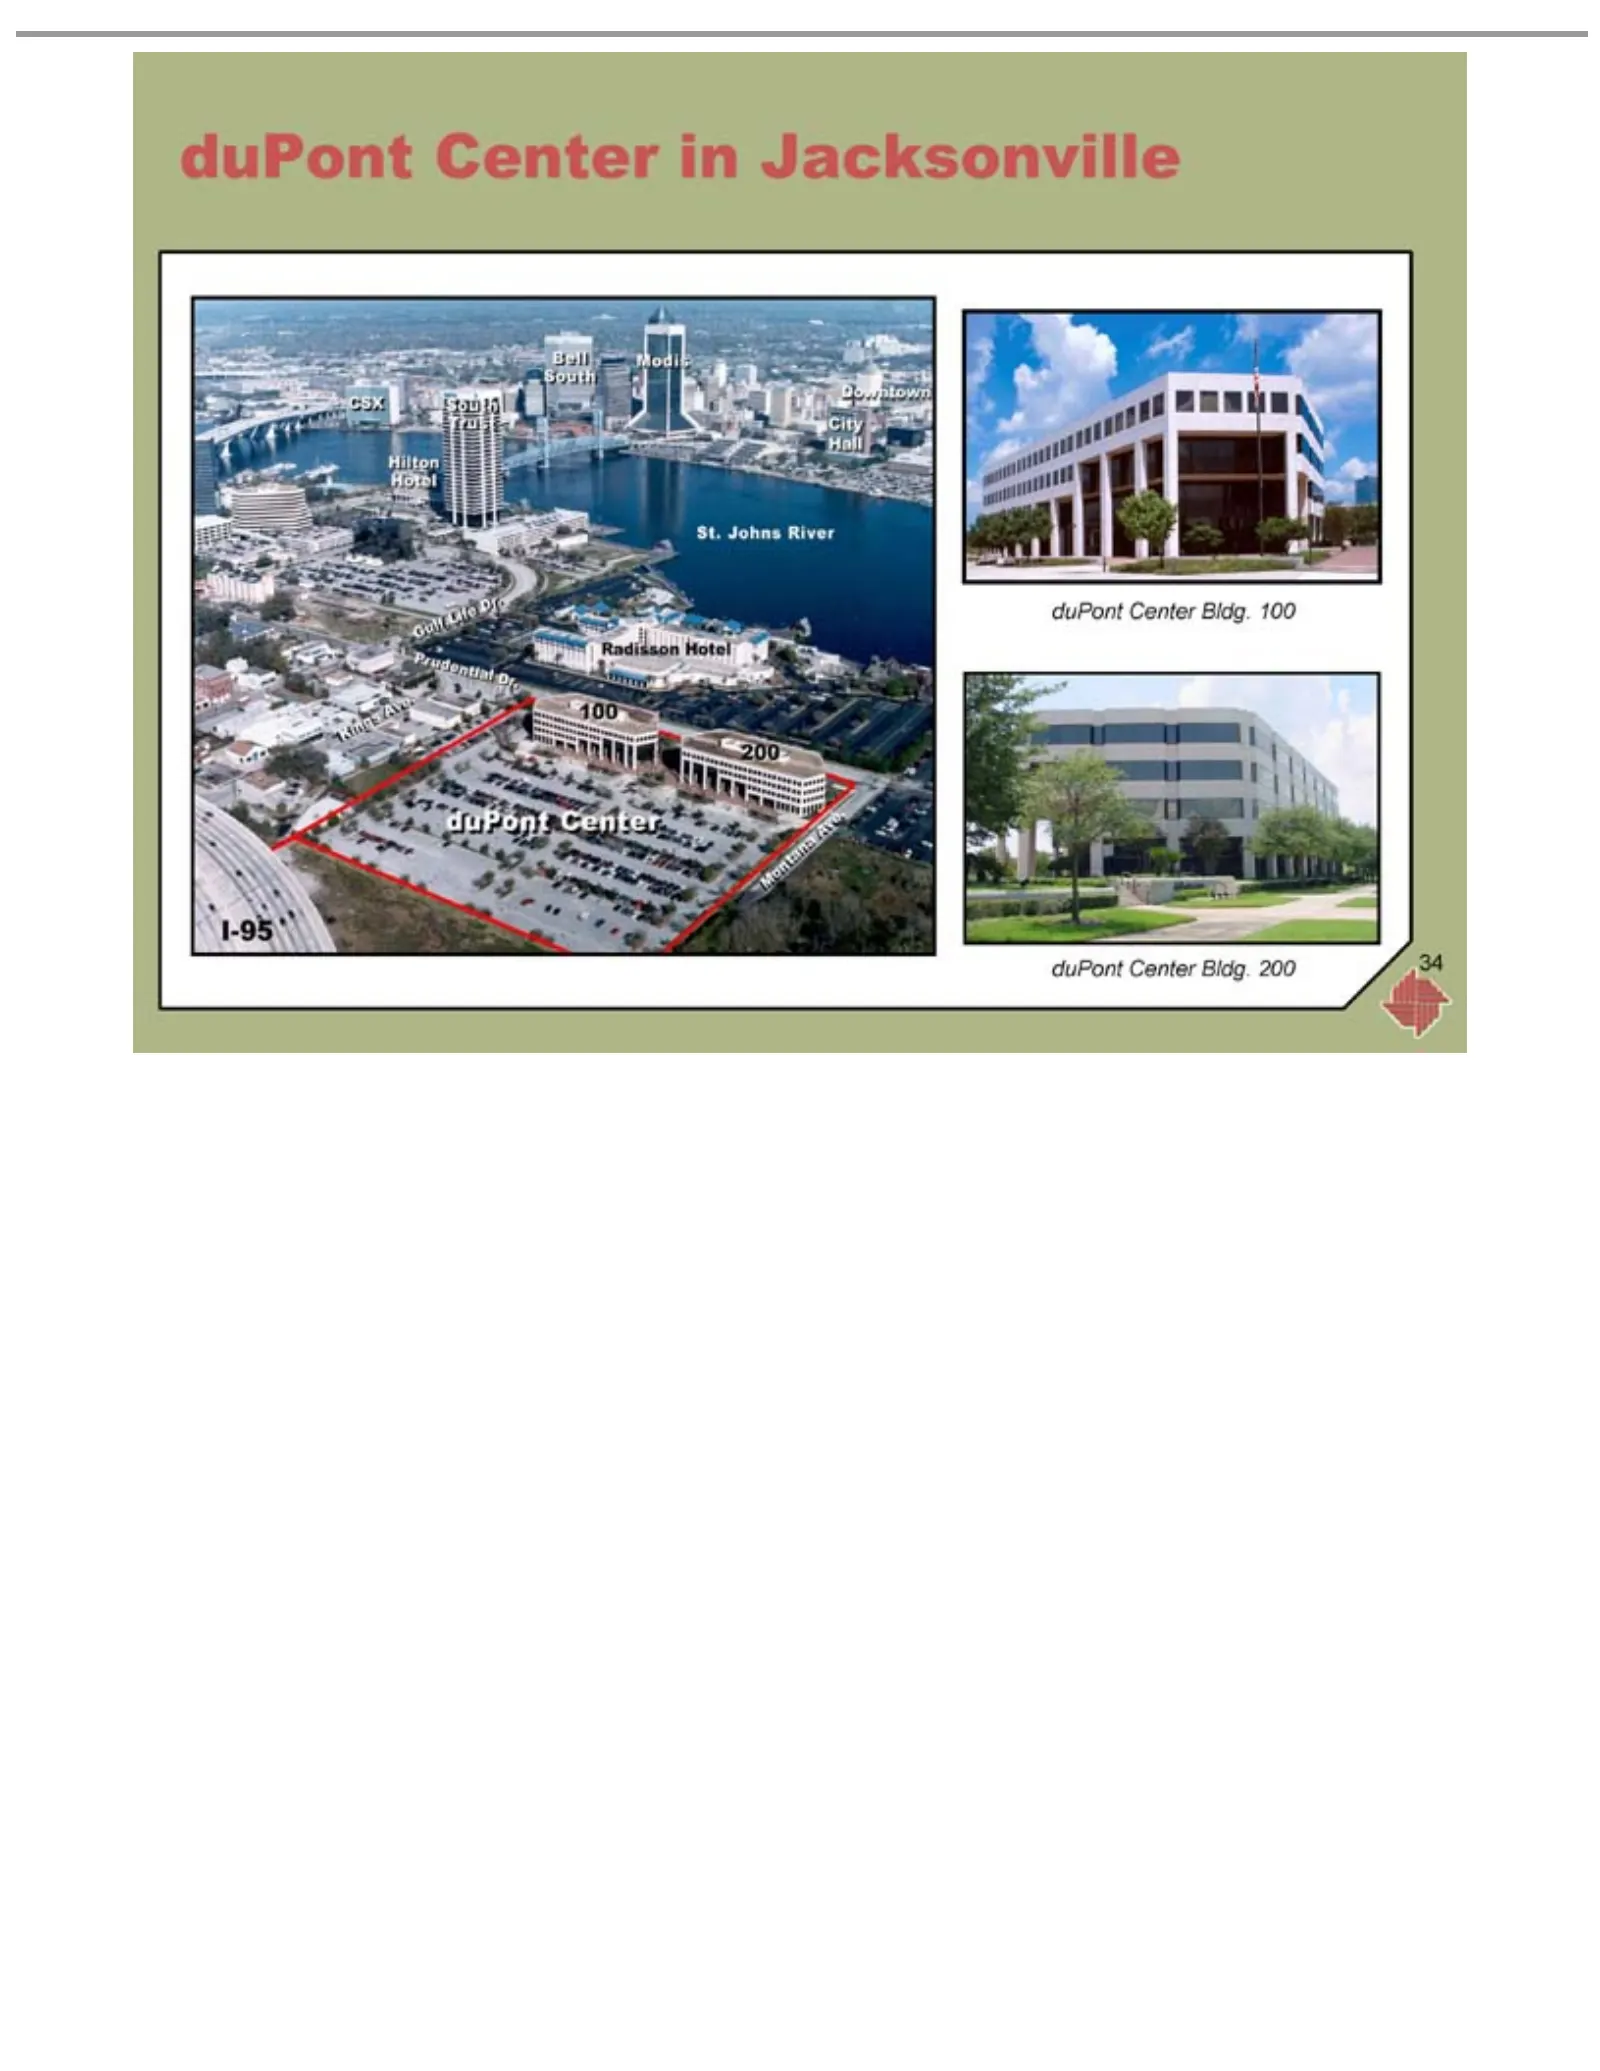
Slide 34: duPont Center in Jacksonville
duPont Center in Jacksonville duPont Center Bldg. 100 duPont Center Bldg. 200 34
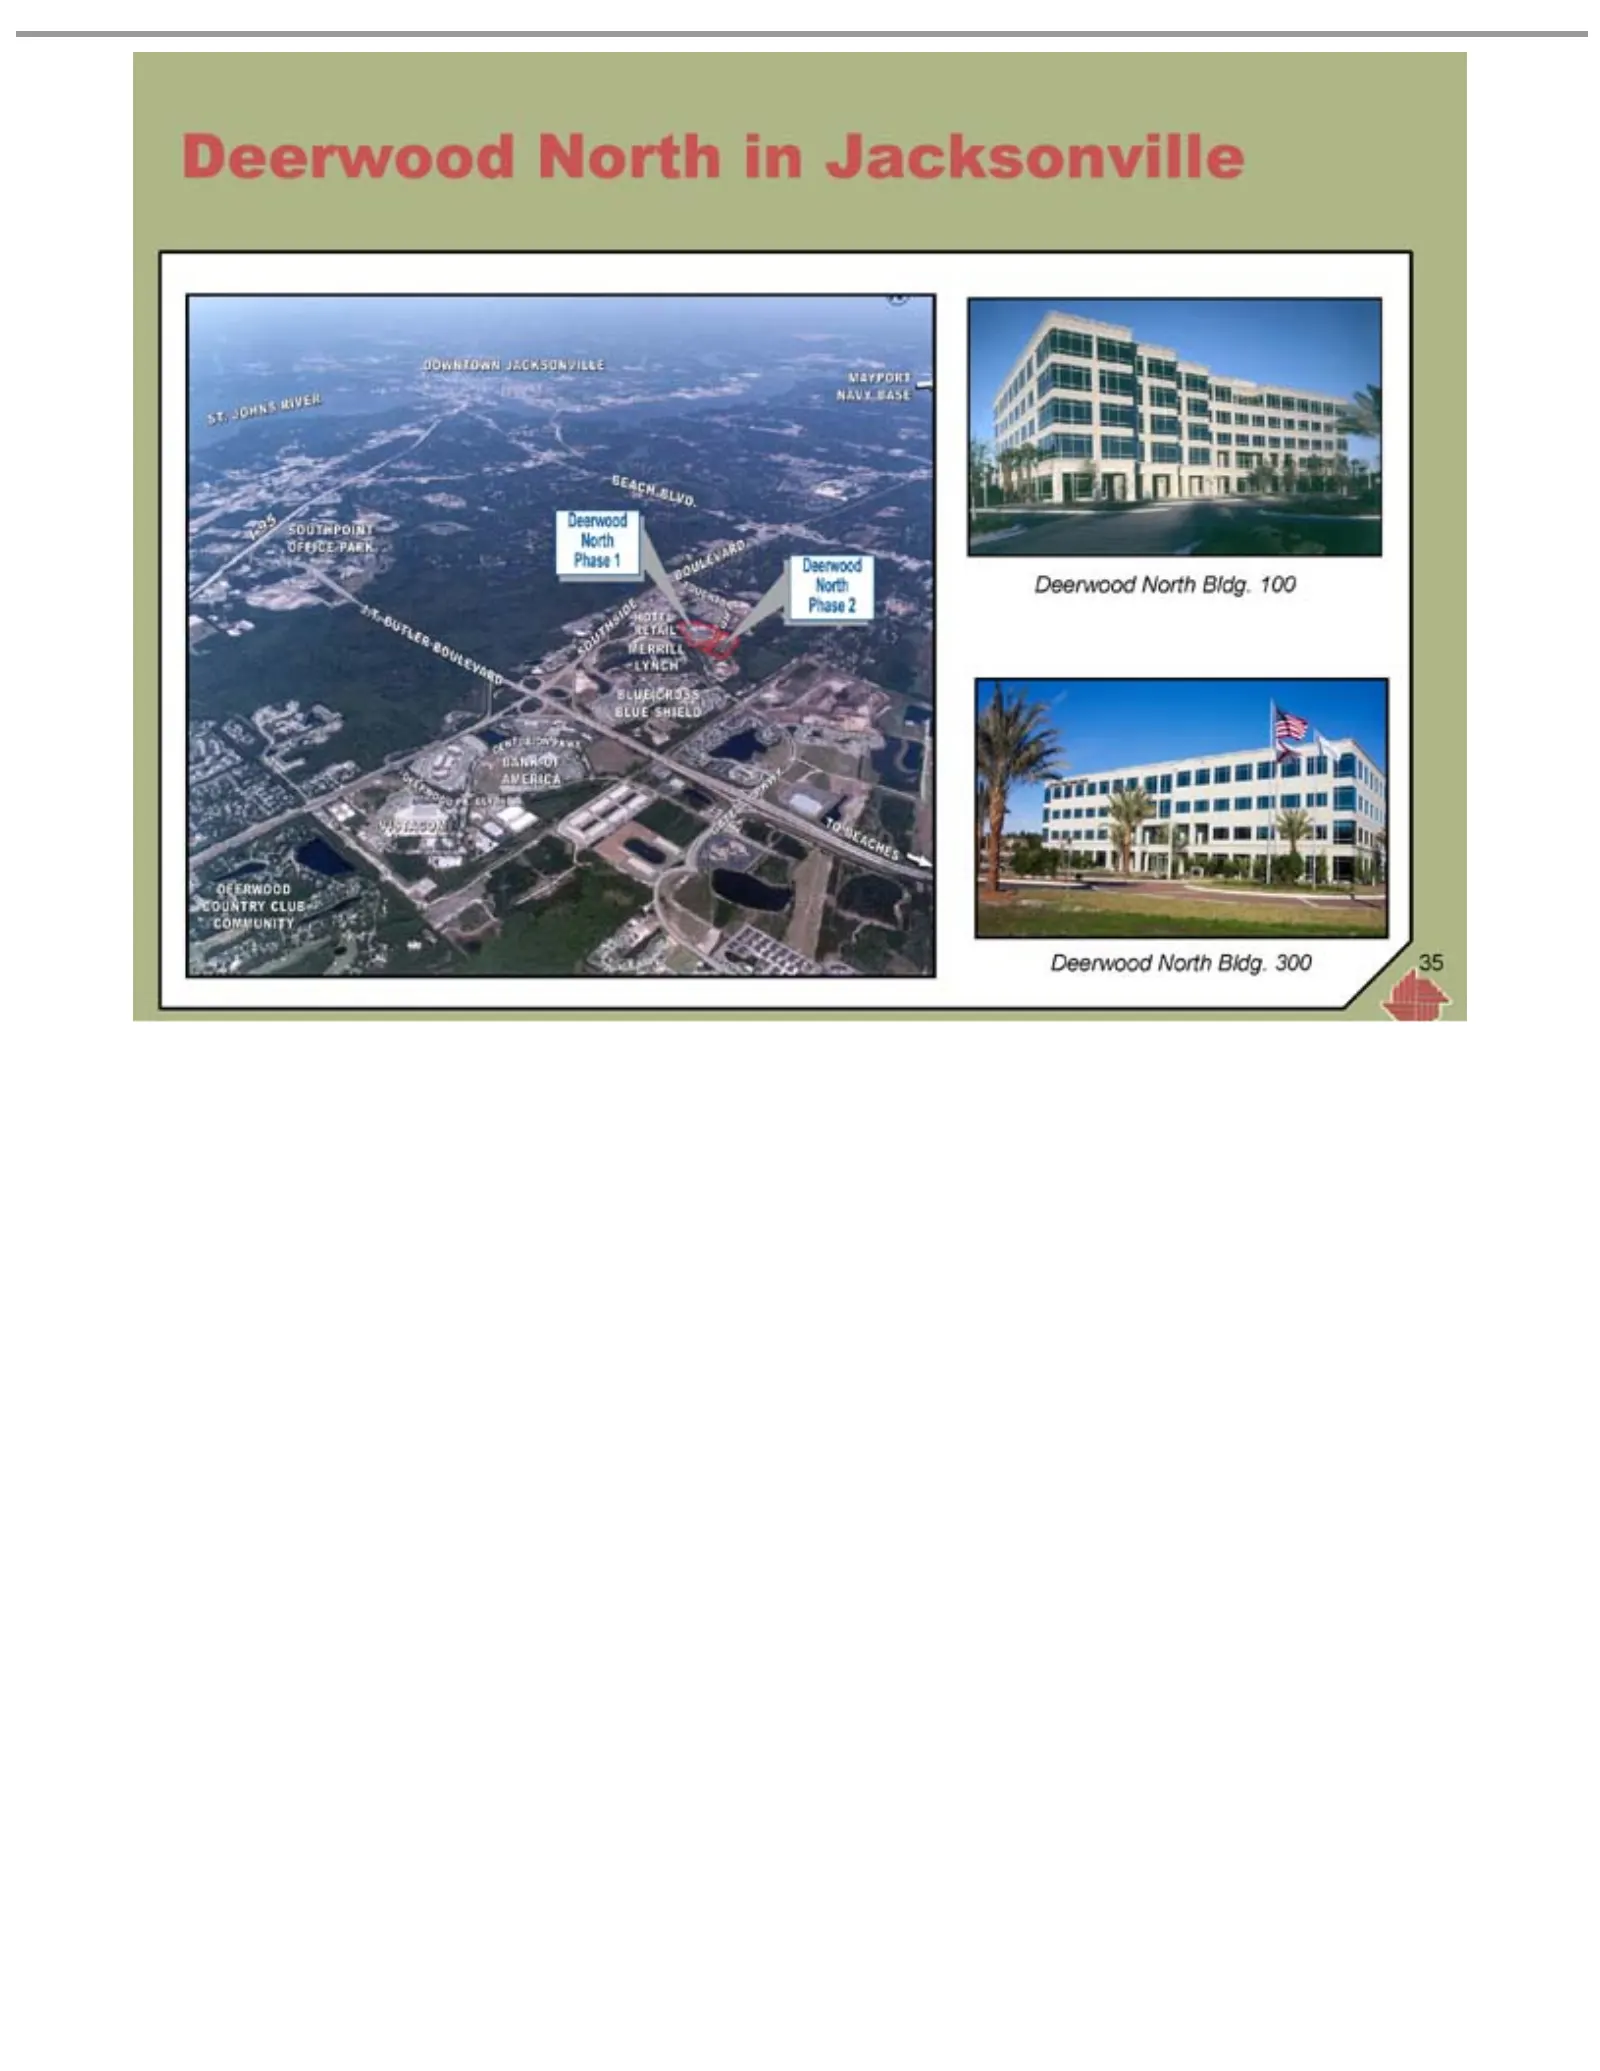
Slide 35: Deerwood North Bldg. in Jacksonville
Deerwood North Bldg. 35 in Jacksonville 100 300
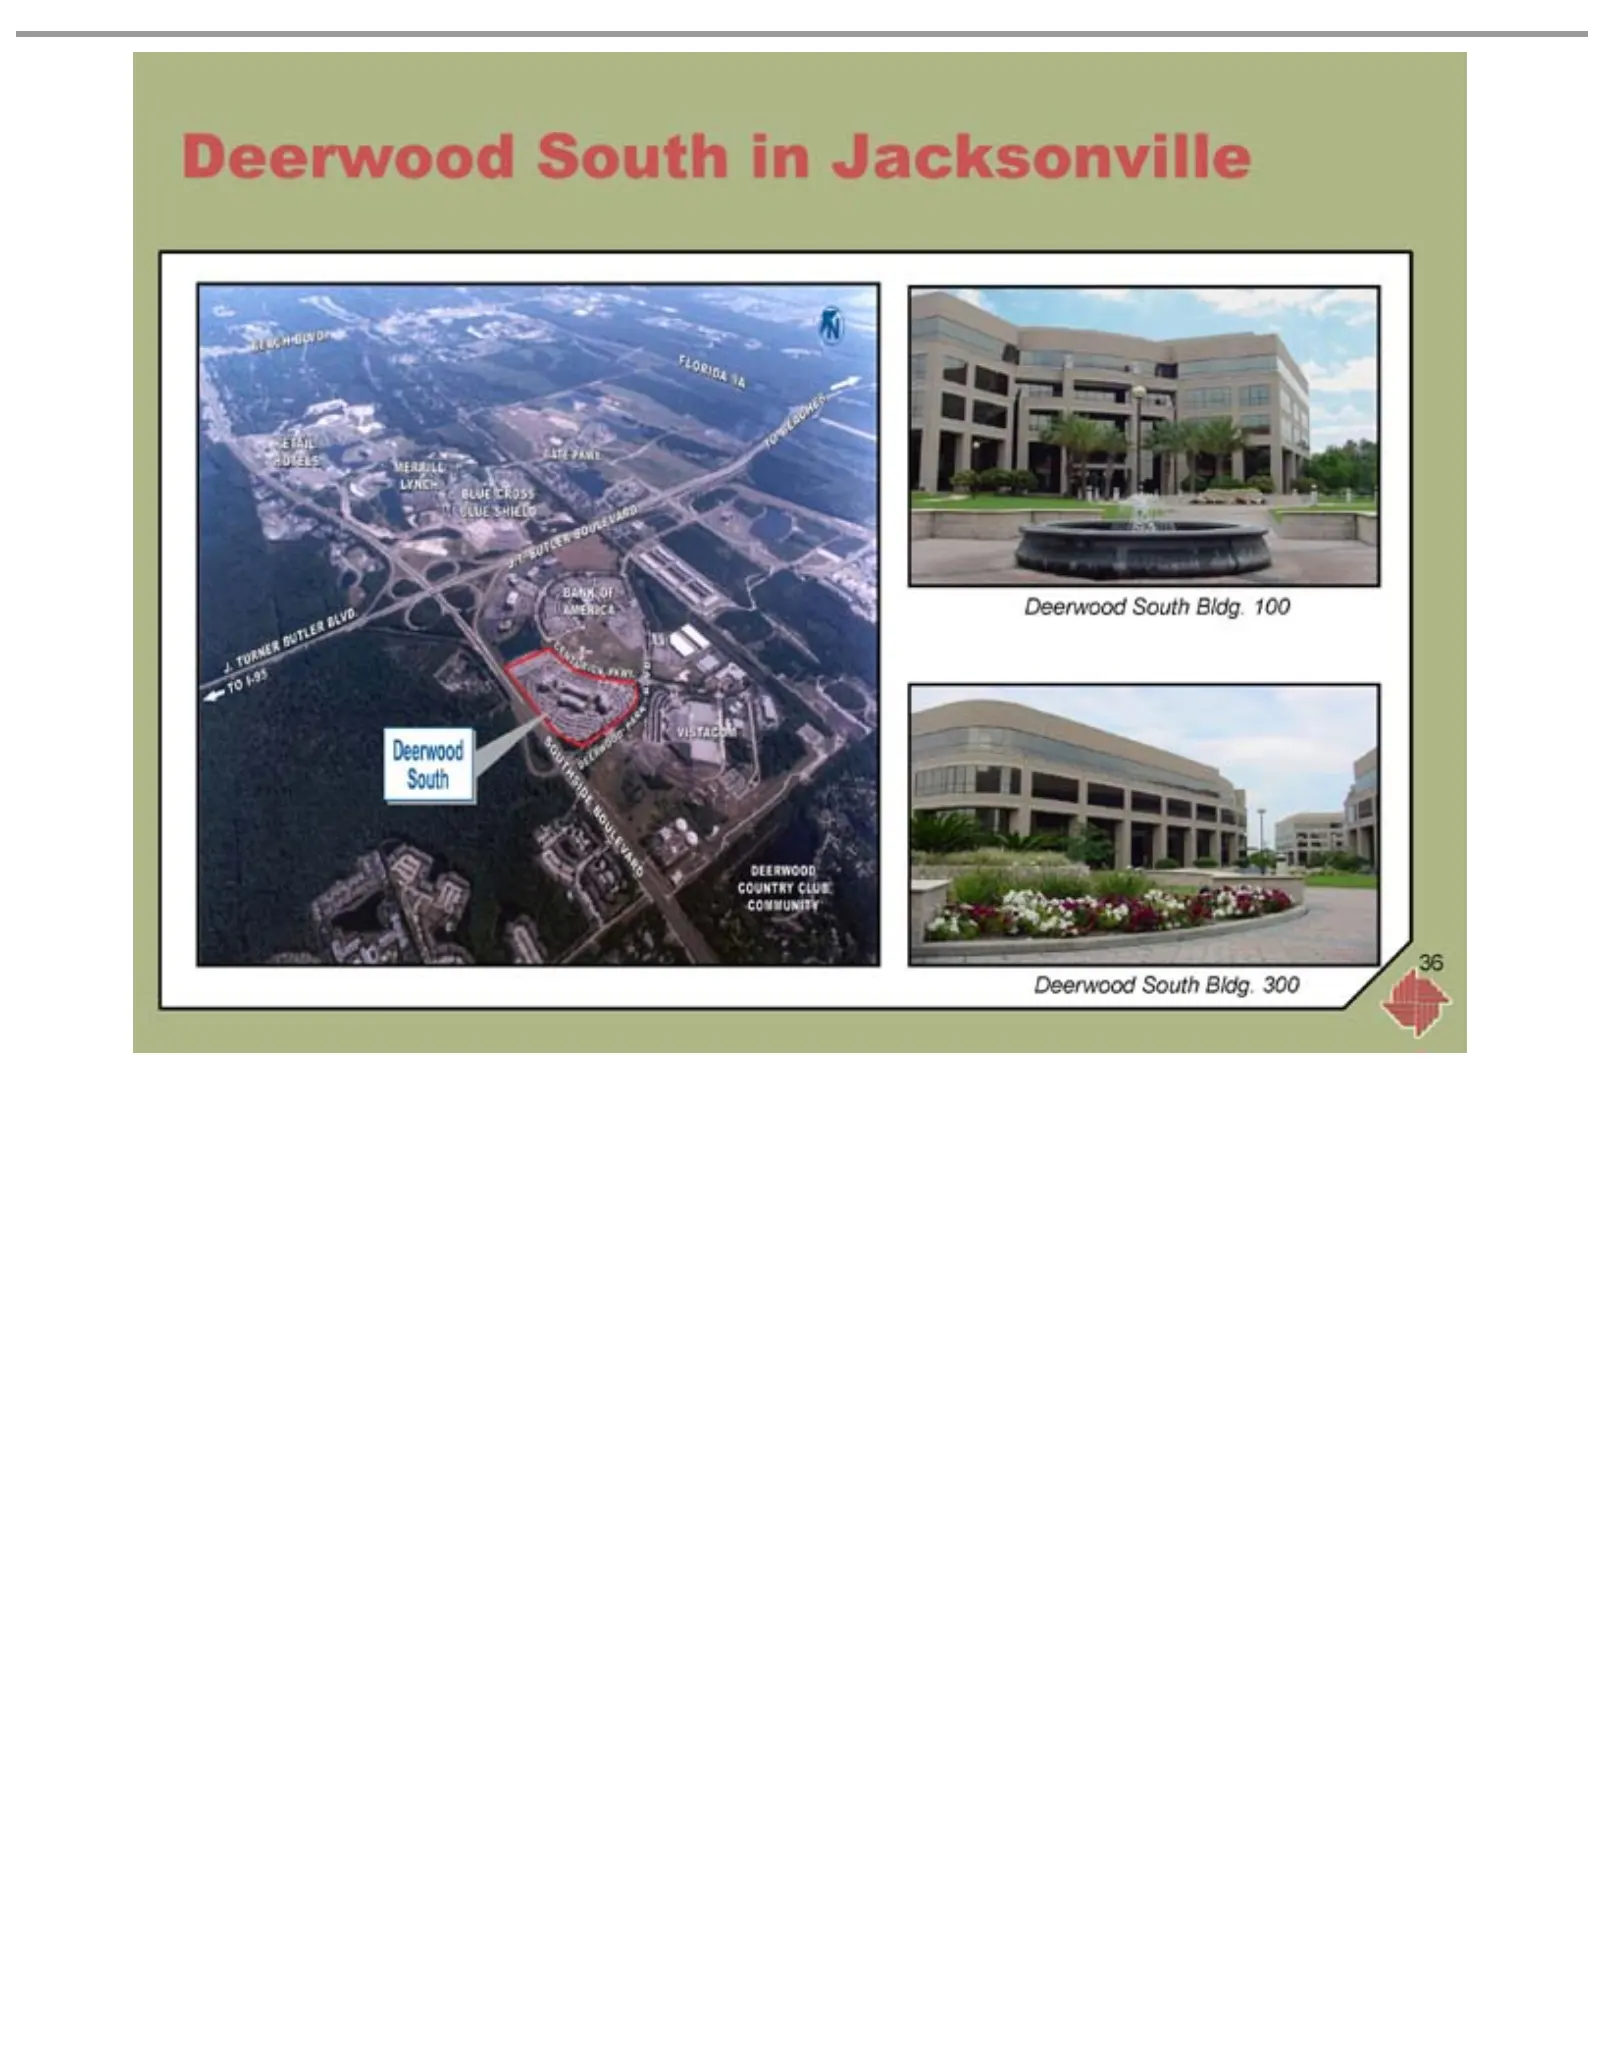
Slide 36: Deerwood South Bldg. in Jacksonville
Deerwood South Bldg. 36 in Jacksonville 100 300
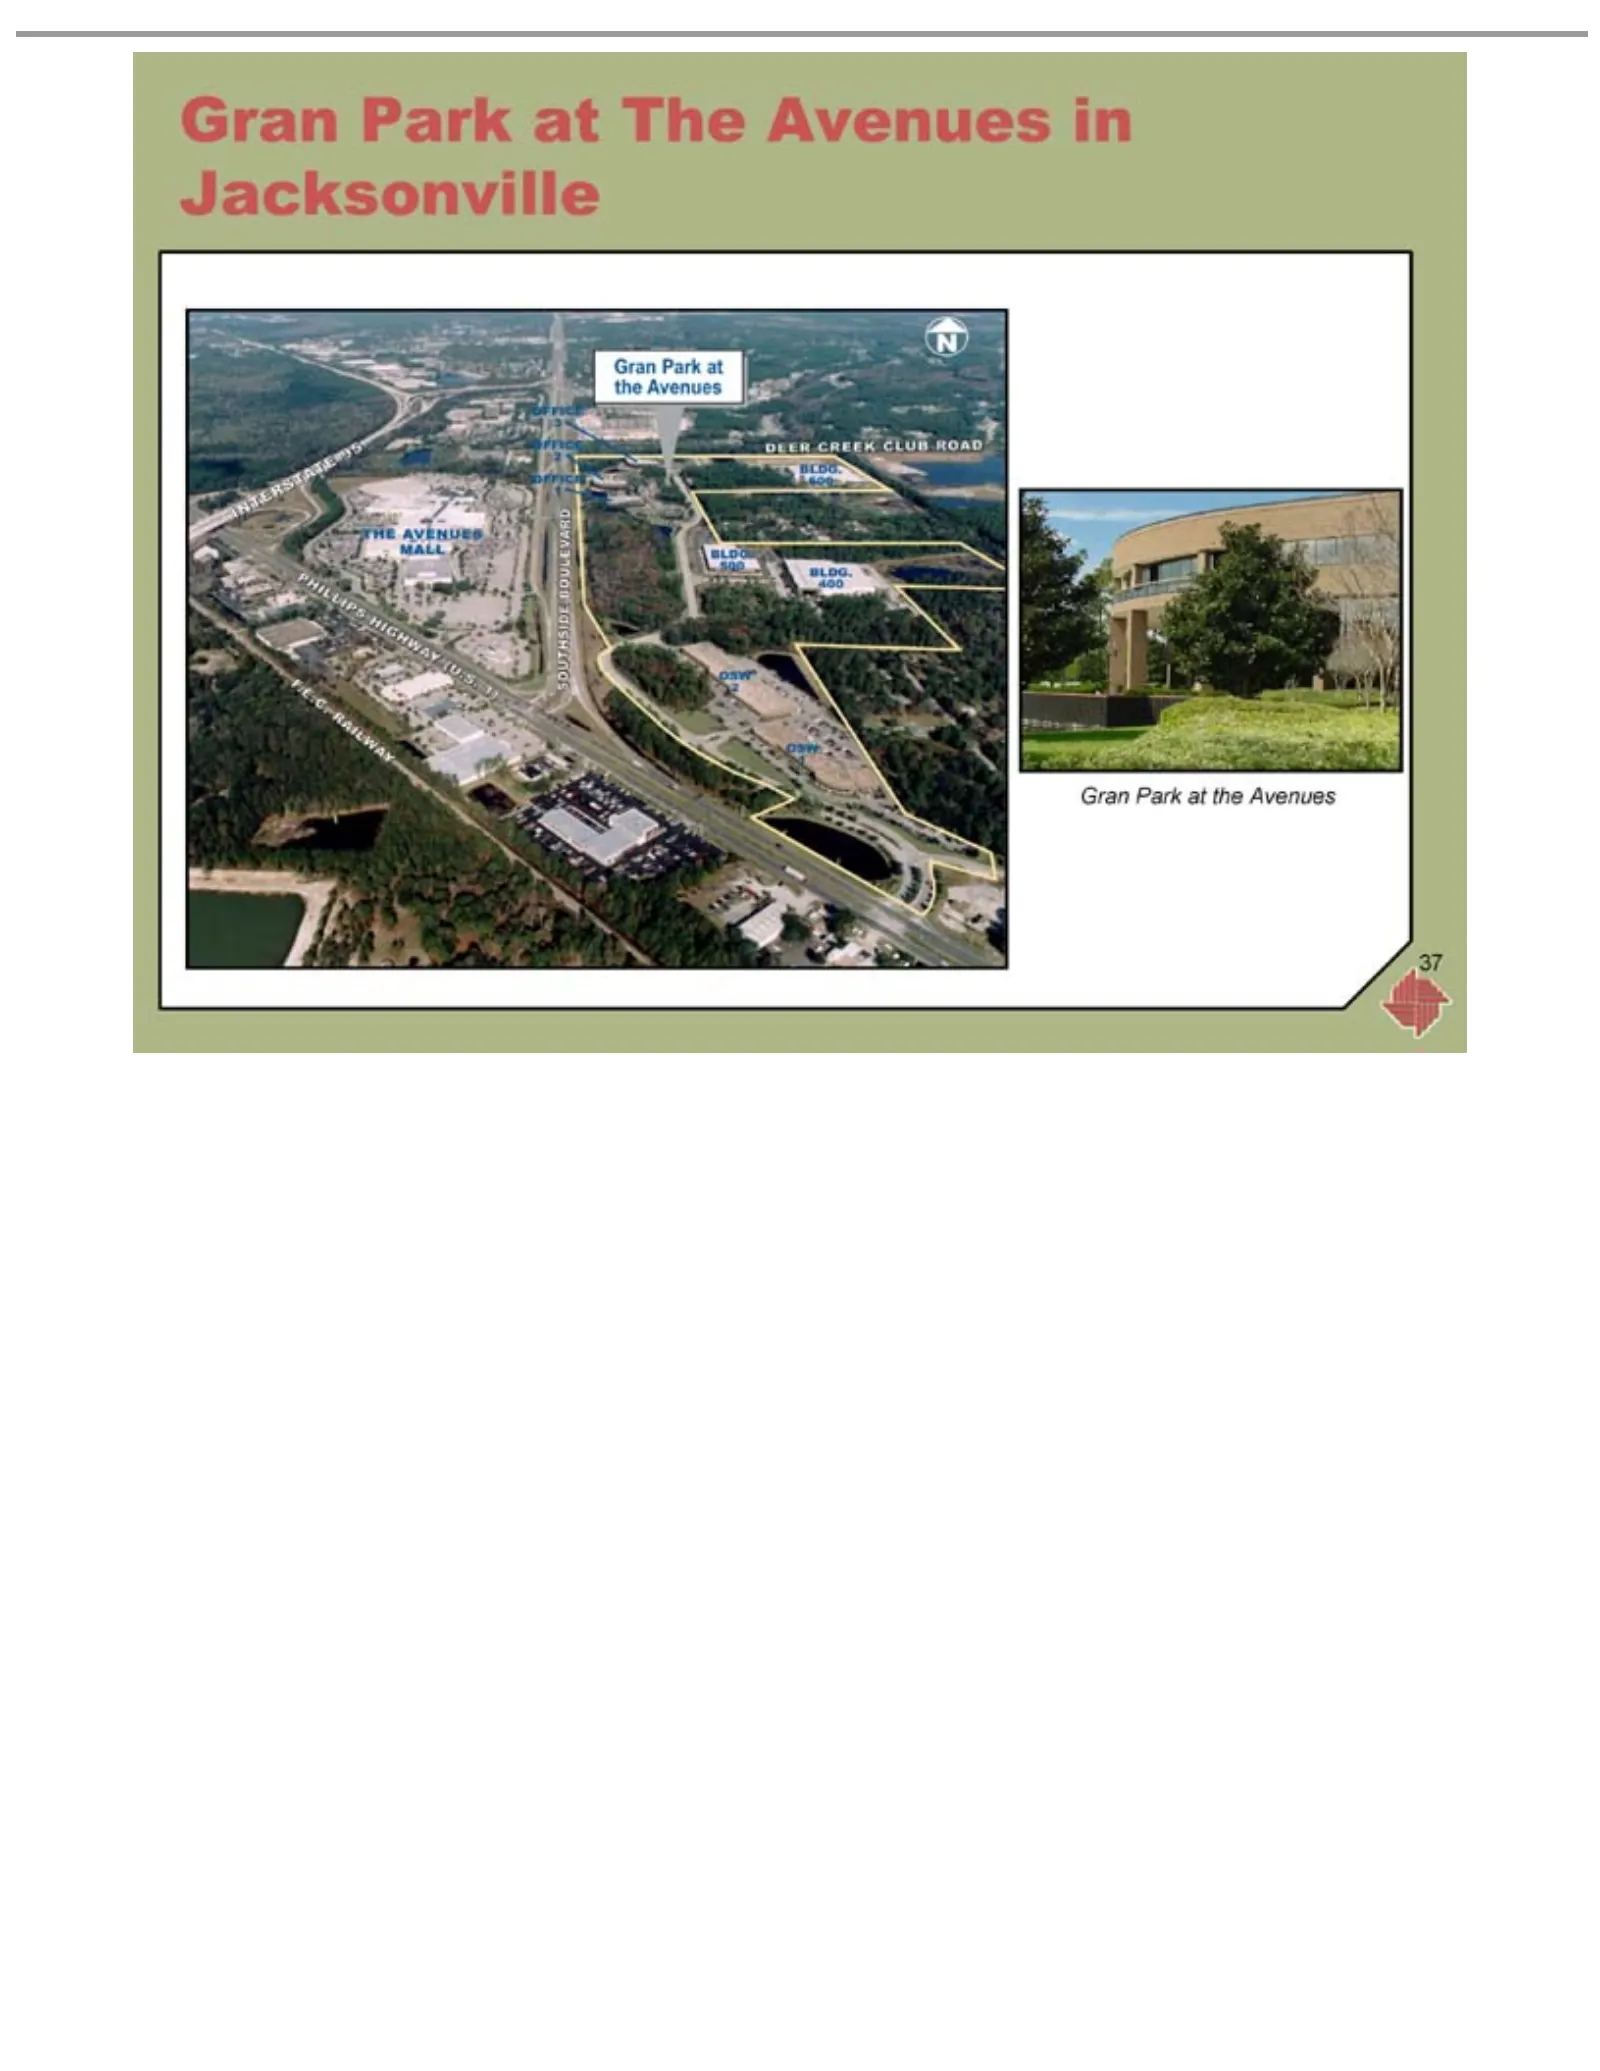
Slide 37: Gran Park at the Avenues in Jacksonville
Gran Park at The 37 the Avenues Avenues in Jacksonville
Slide 38: Flagler Properties Orlando Portfolio
Flagler Properties Orlando 38 Portfolio
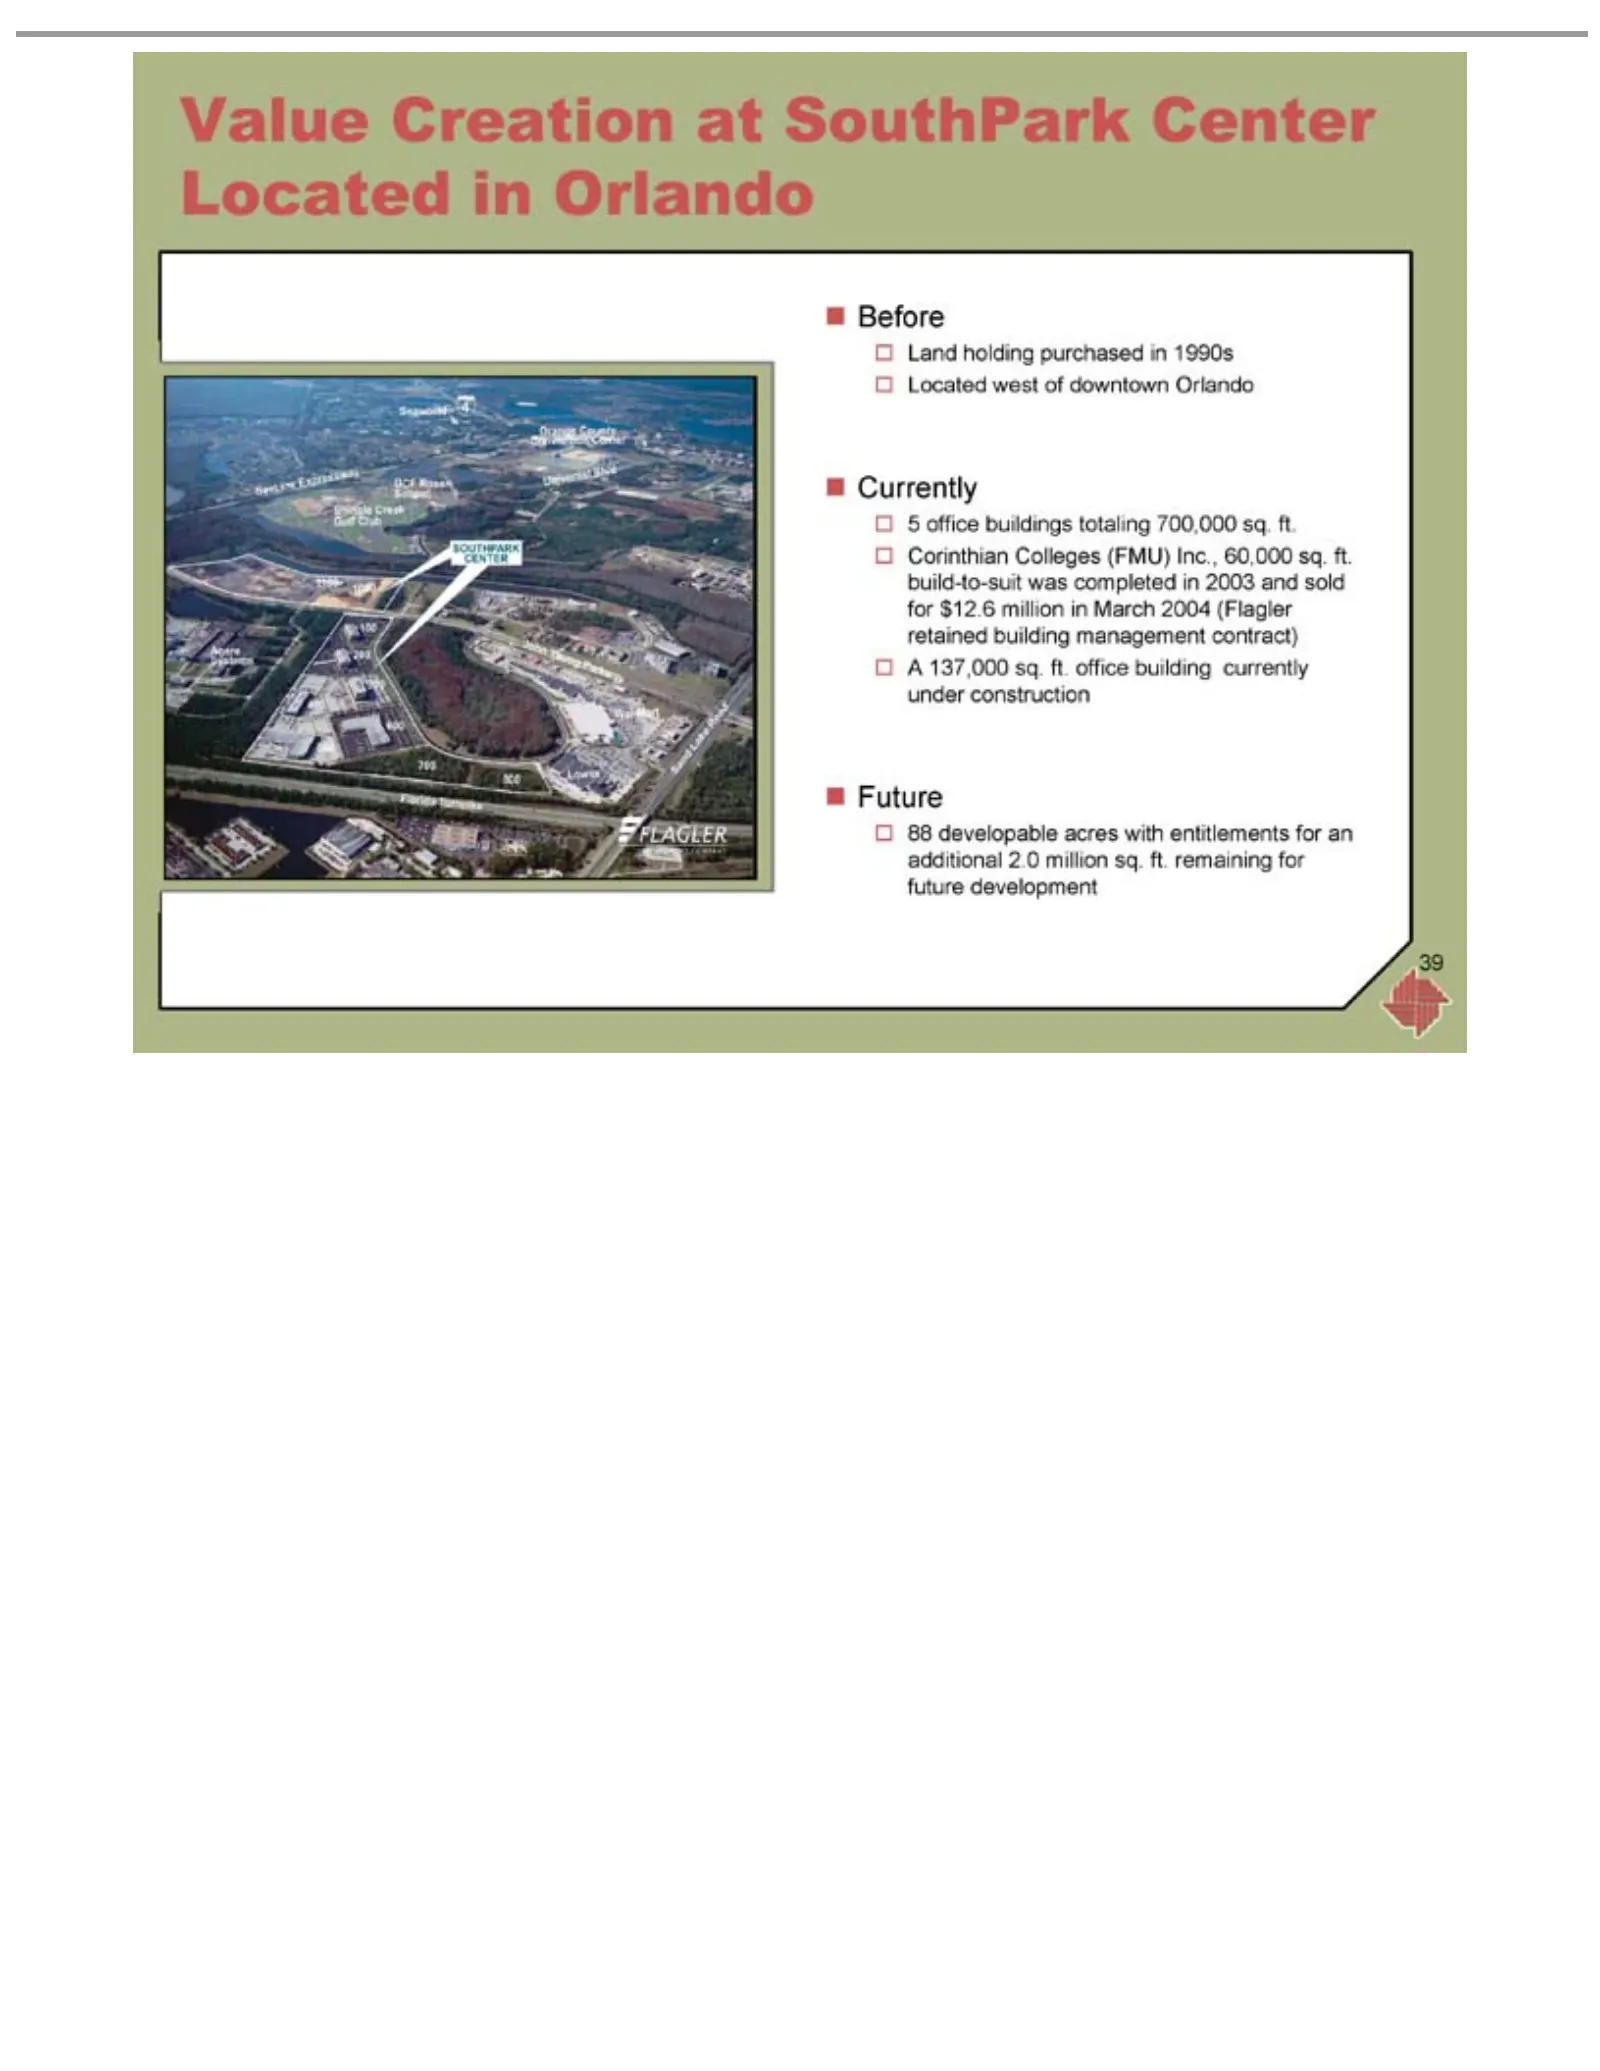
Slide 39: Value Creation – SouthPark Center, Orlando
?Value 39 A Before Land Located 5Currently Corinthian Future 88office 137,000 developable Creation holding buildings west sq. Colleges at of purchased ft.acres SouthPark downtown office totaling (FMU) with building in700,000 entitlements Center 1990s Orlando Inc.,currently 60,000 Located sq. ft. for
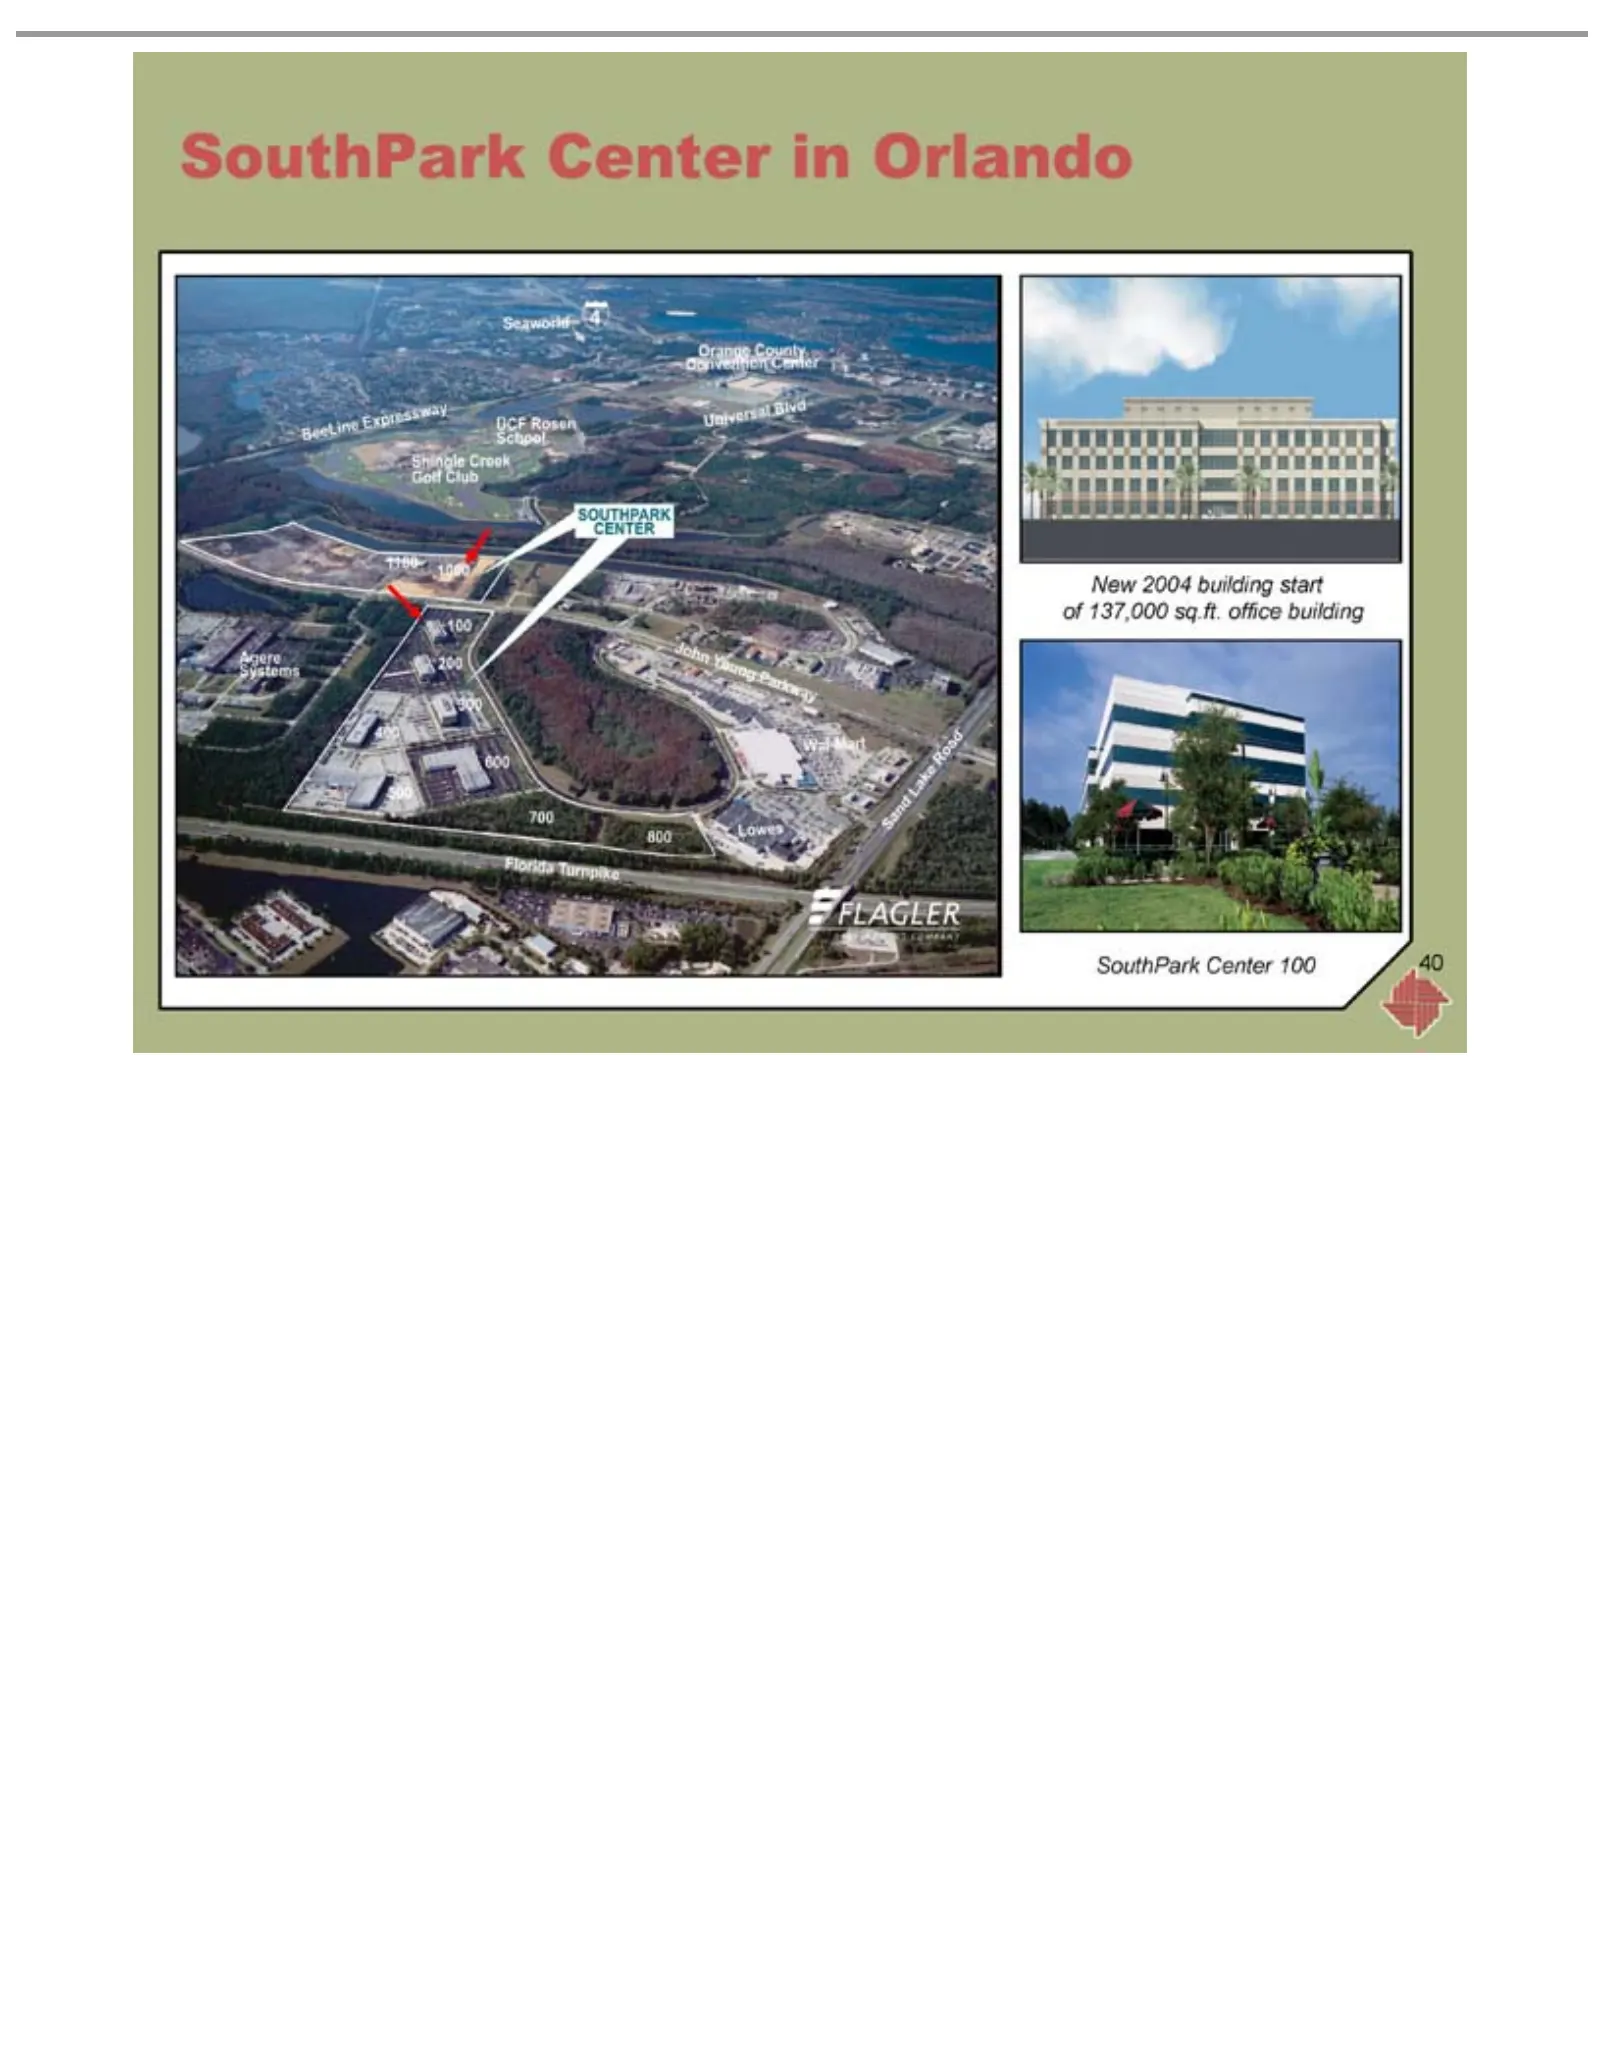
Slide 40: New 2004 Building at SouthPark Center in Orlando
New 2004 building SouthPark 40 Center 100 instart Orlando of 137,000 sq.ft. office building
Slide 41: Flagler Florida South Properties
FlaglerFlorida South 41 Properties Portfolio
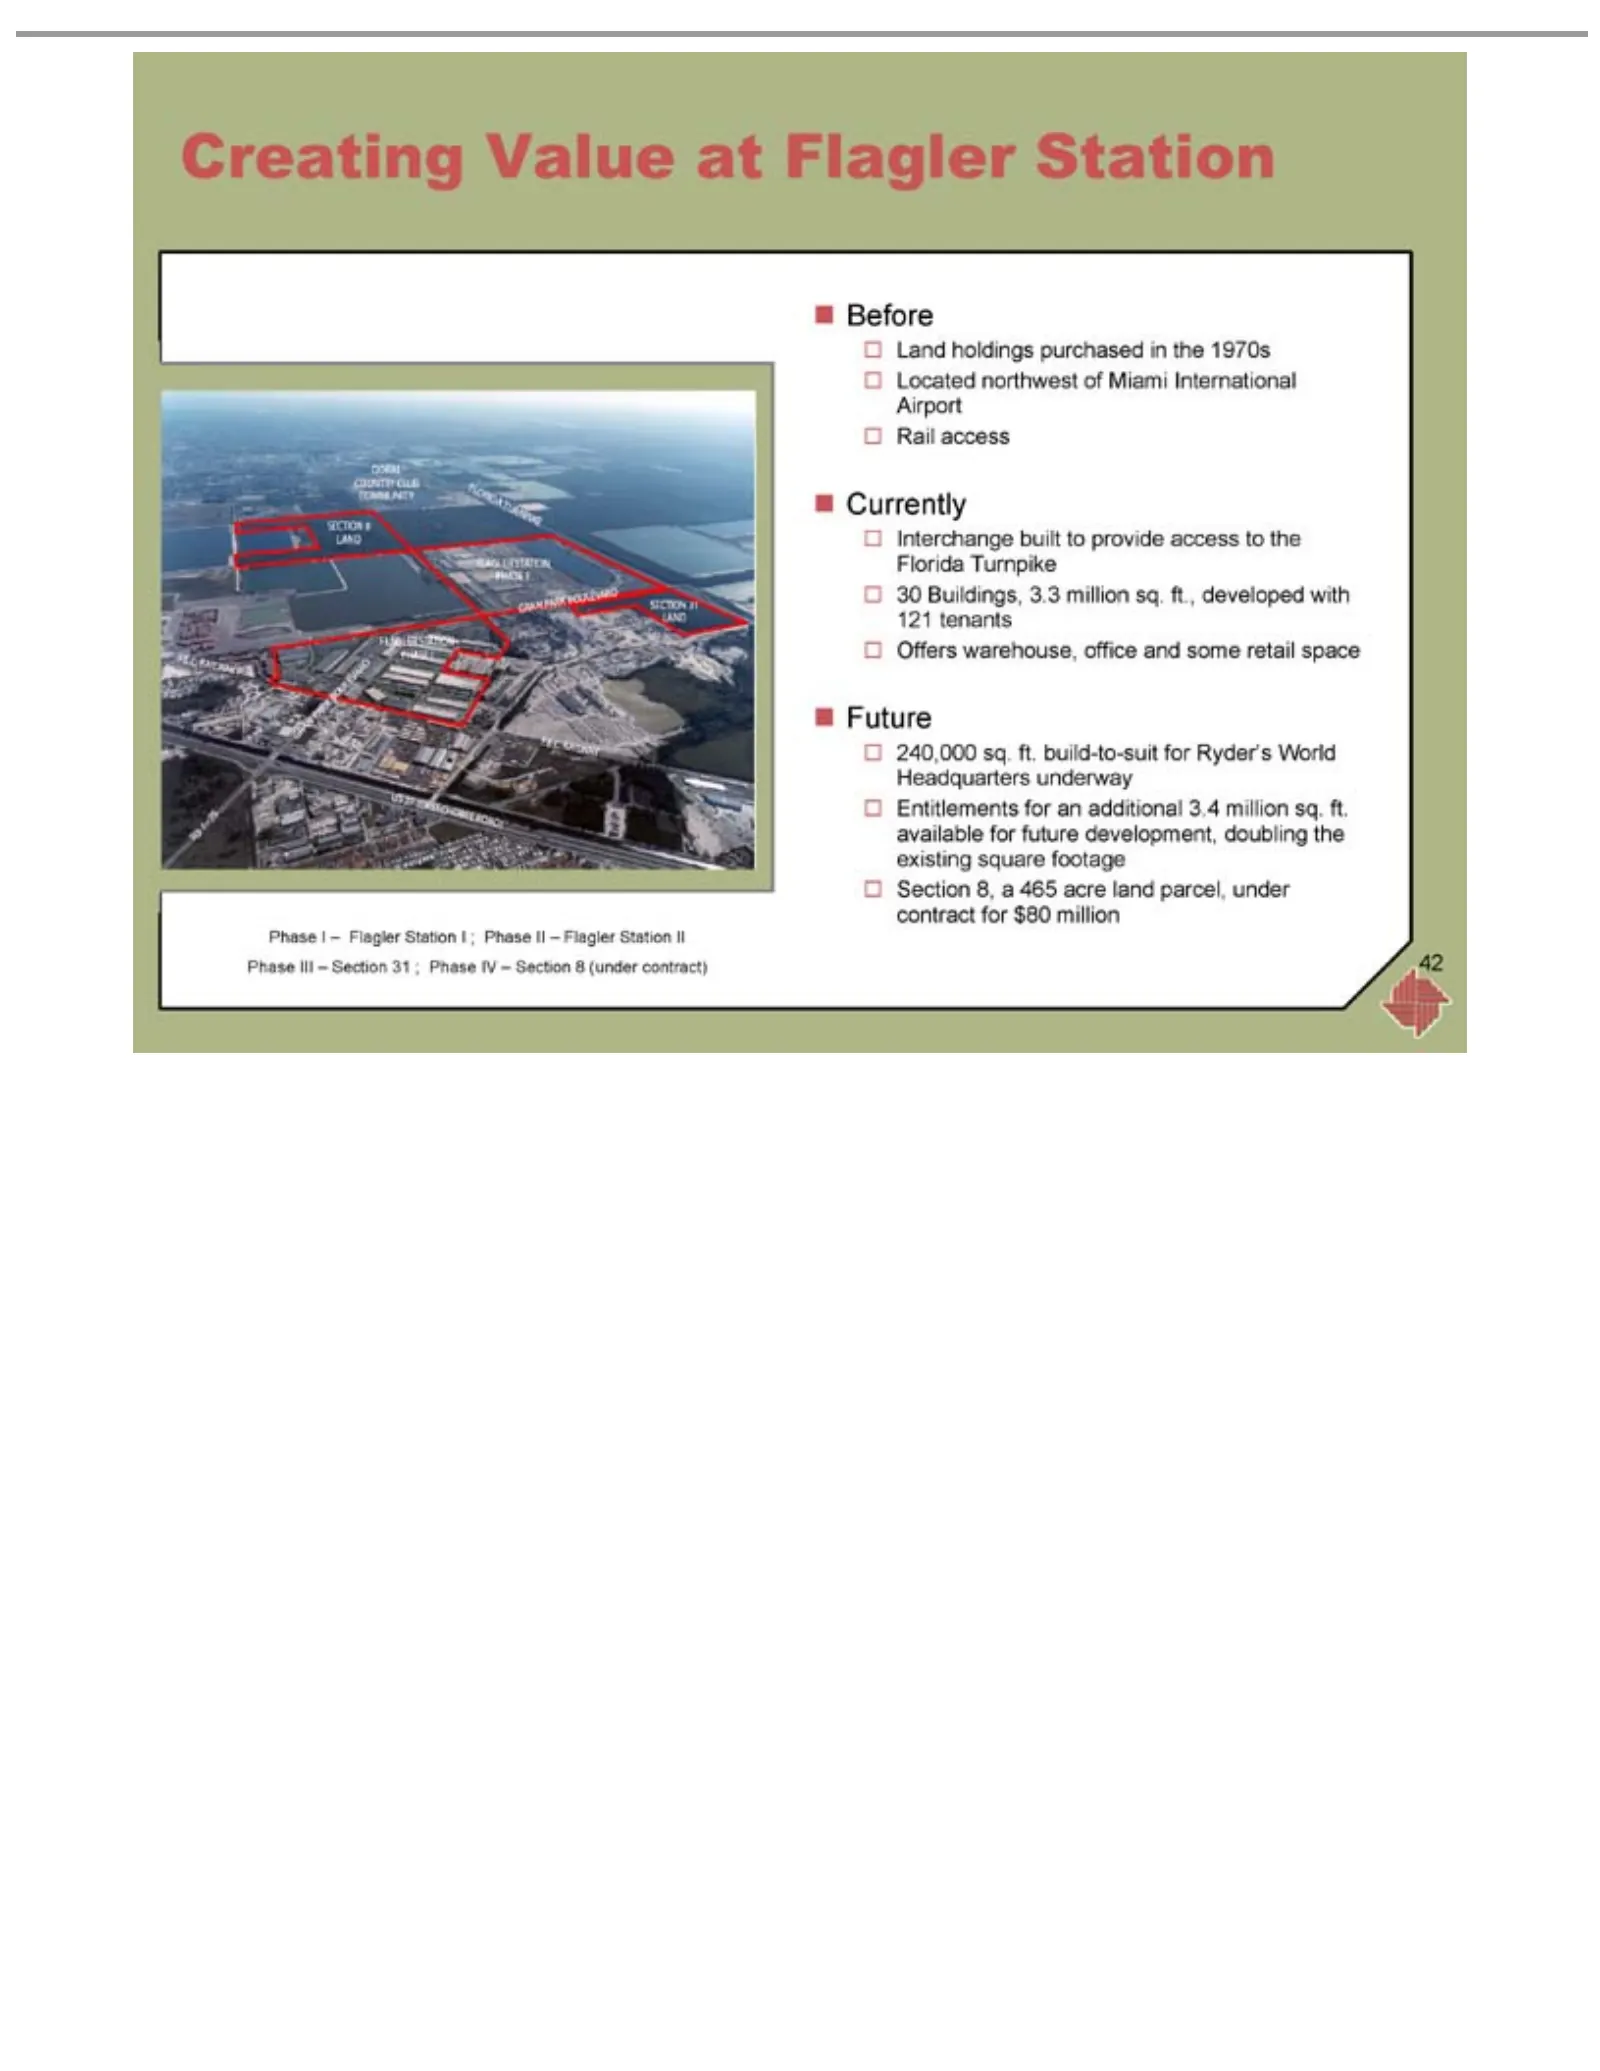
Slide 42: Creating Value – Flagler Station, Miami
Creating ?Phase 42 Before Land Located Rail Currently Interchange 30 Offers Future 240,000 Entitlements Section Buildings, Iaccess holdings –warehouse, Value Flagler 8, northwest sq.a ft. 465 built for at 3.3 purchased build-to-suit Station Flagler acre an to million office of additional provide lan
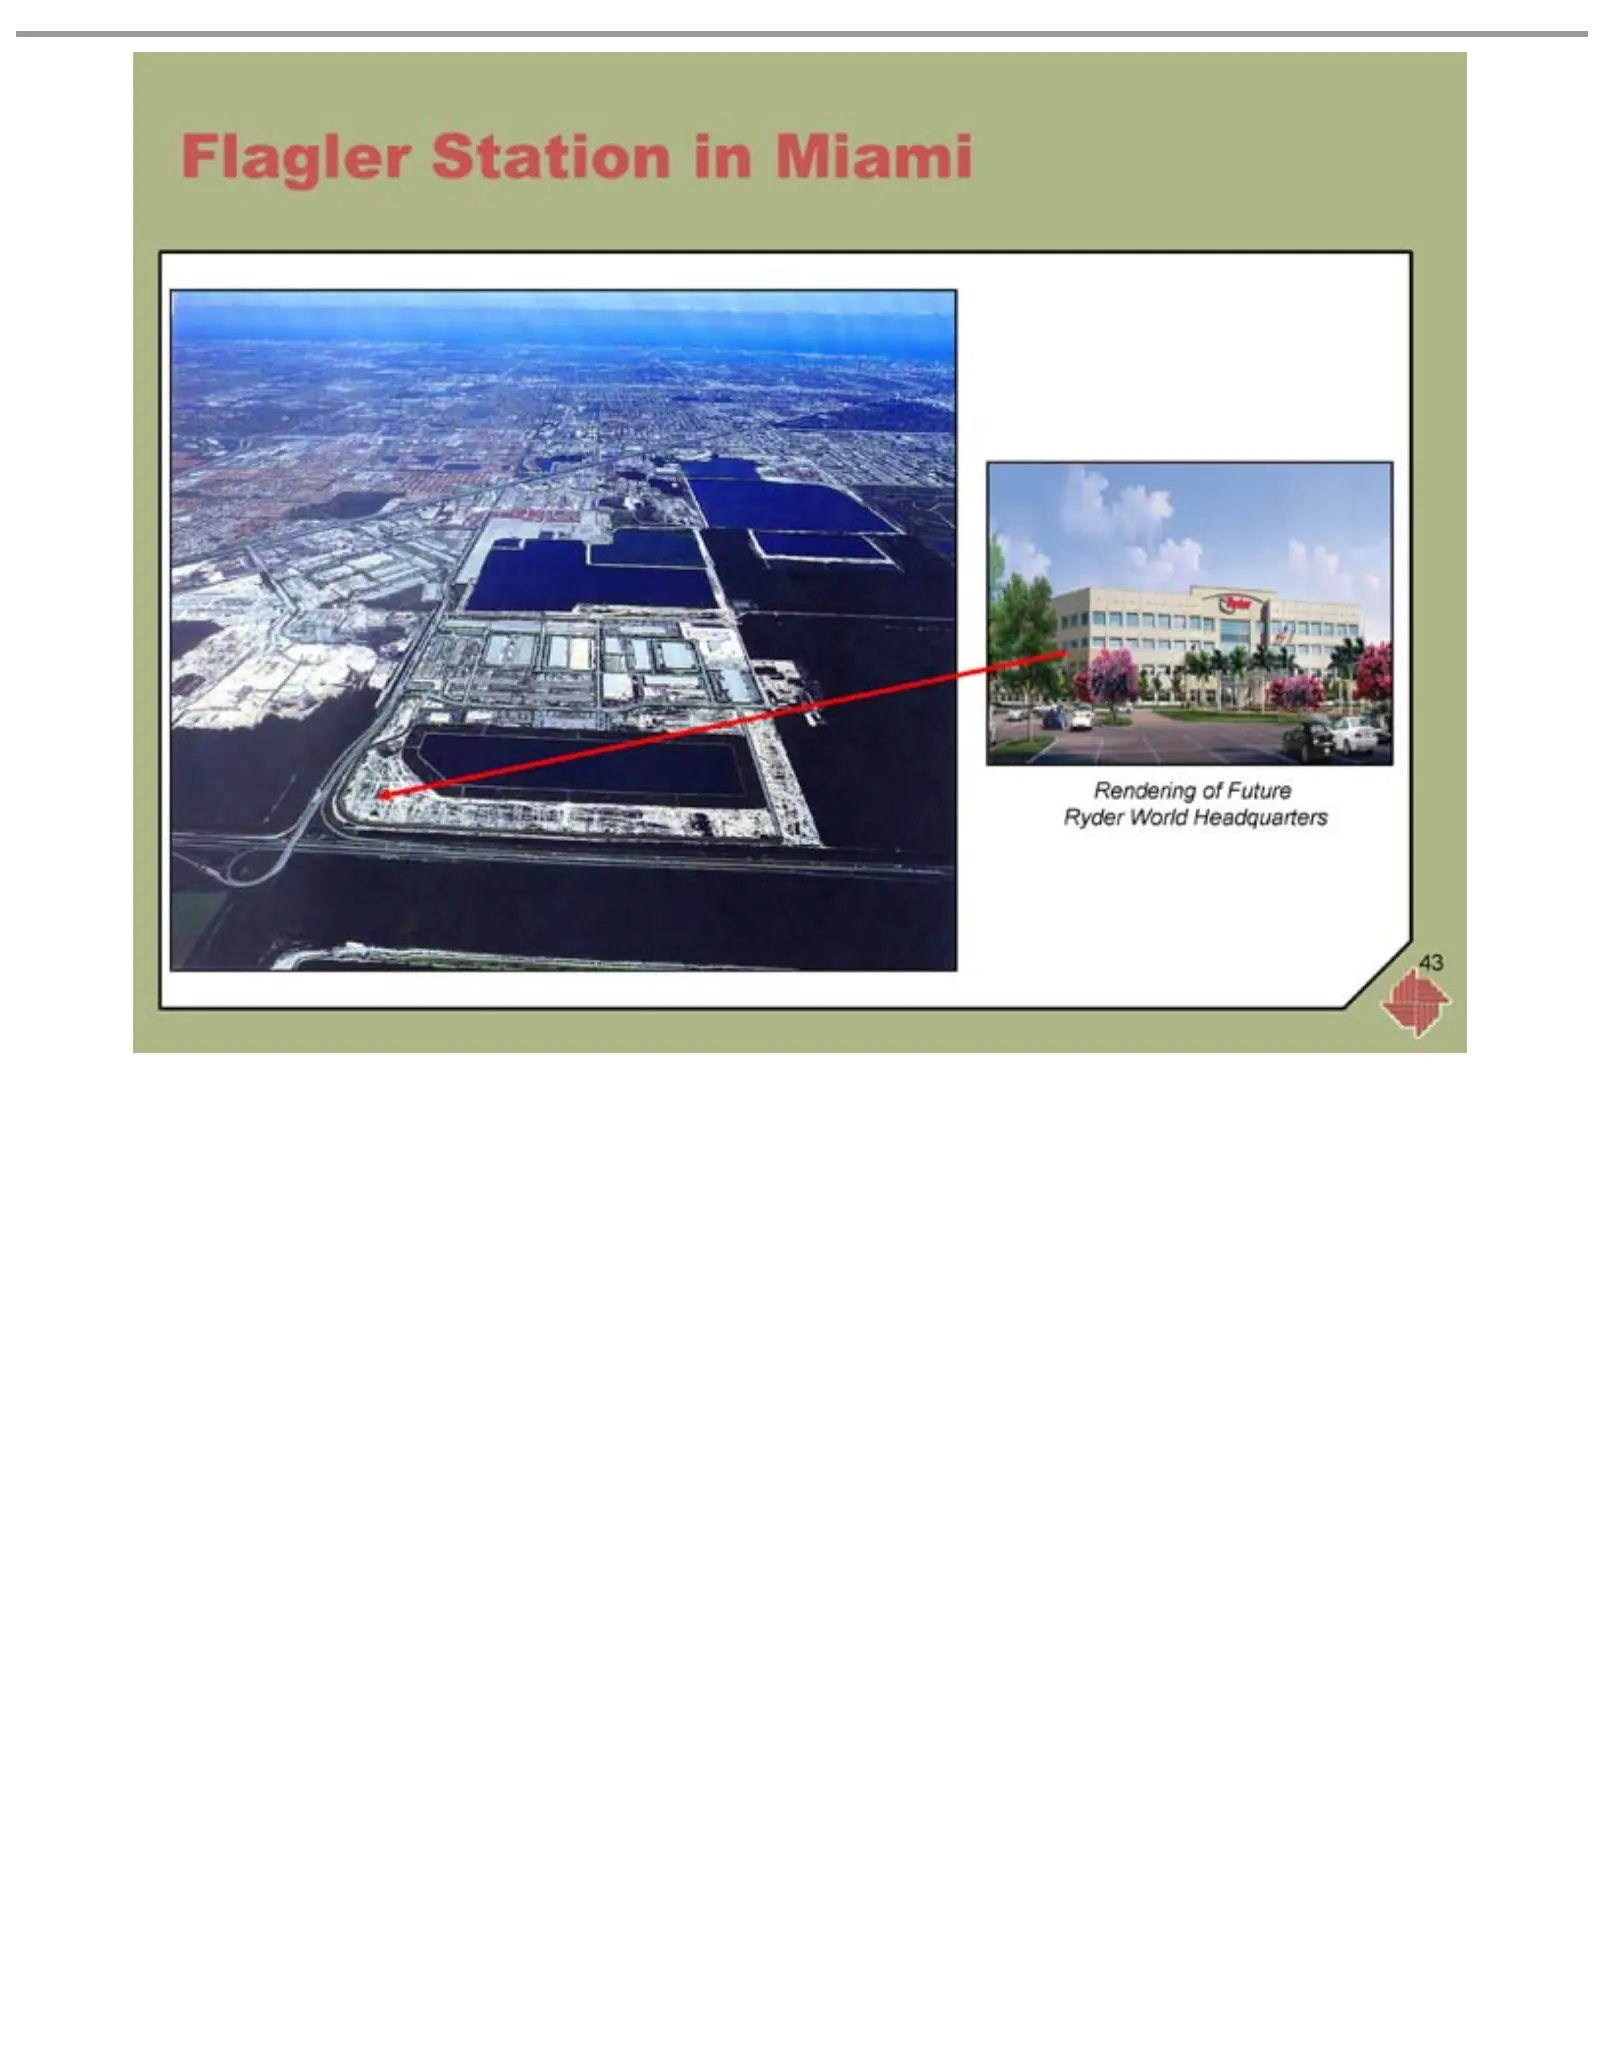
Slide 43: Rendering of Future Ryder World Headquarters in Miami
Flagler Station Rendering 43 of Future in Miami Ryder World Headquarters
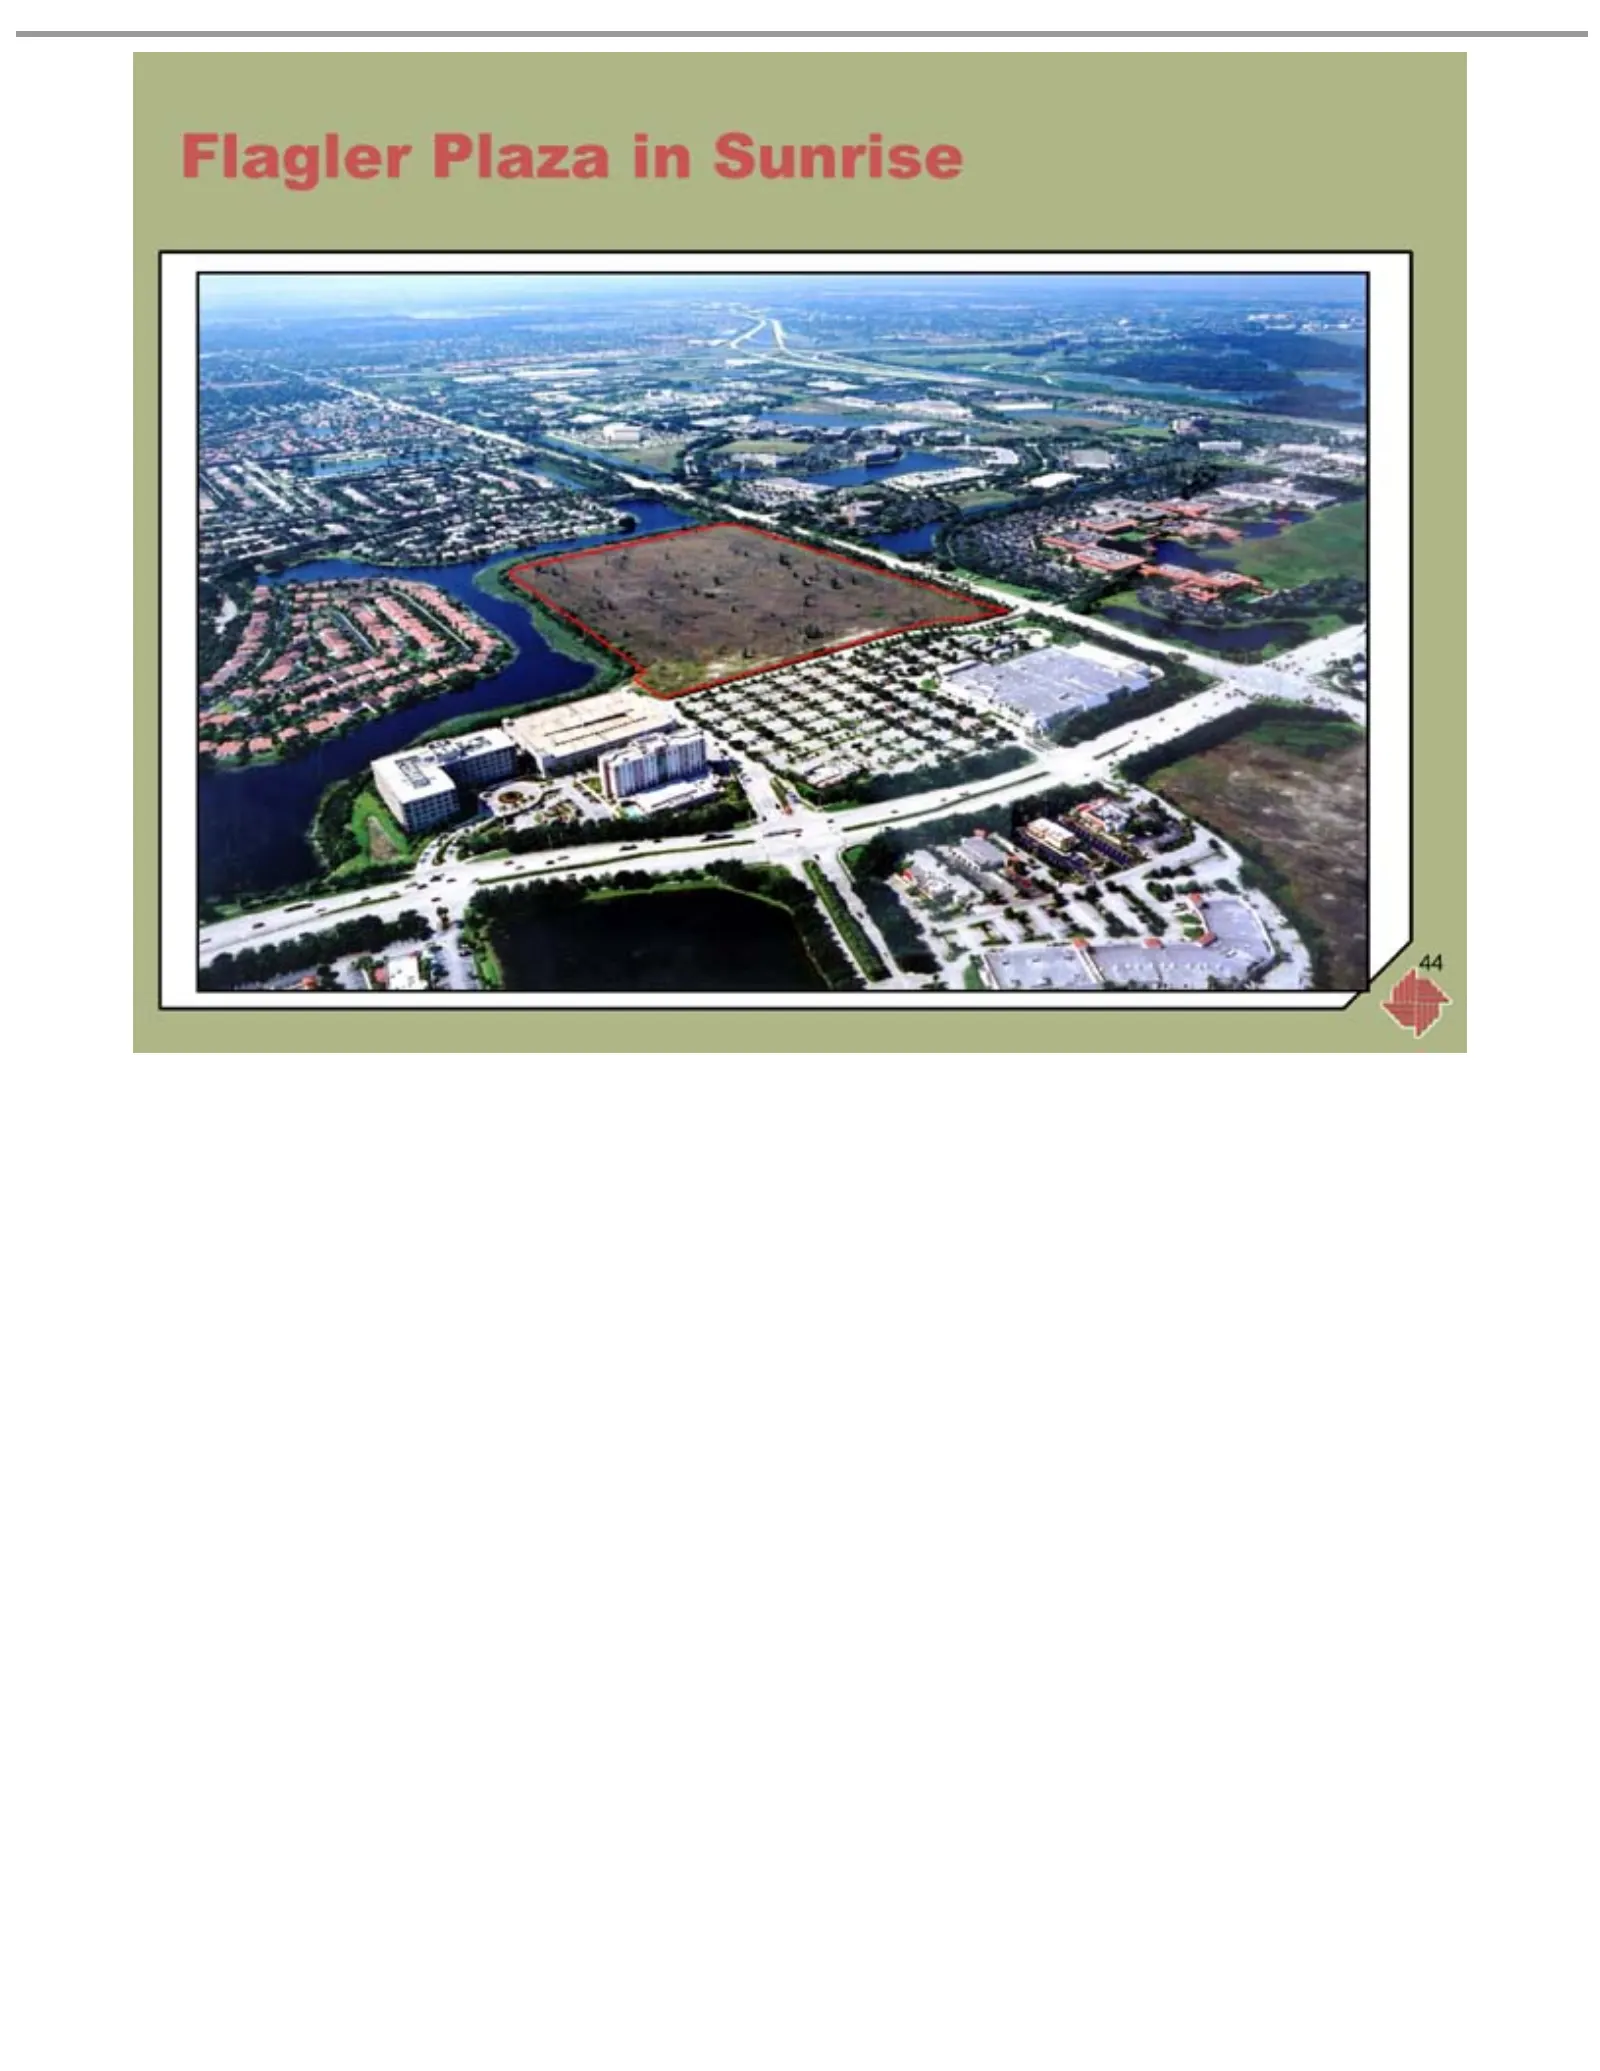
Slide 44: Flagler Plaza in Sunrise
Flagler Plaza in Sunrise 44
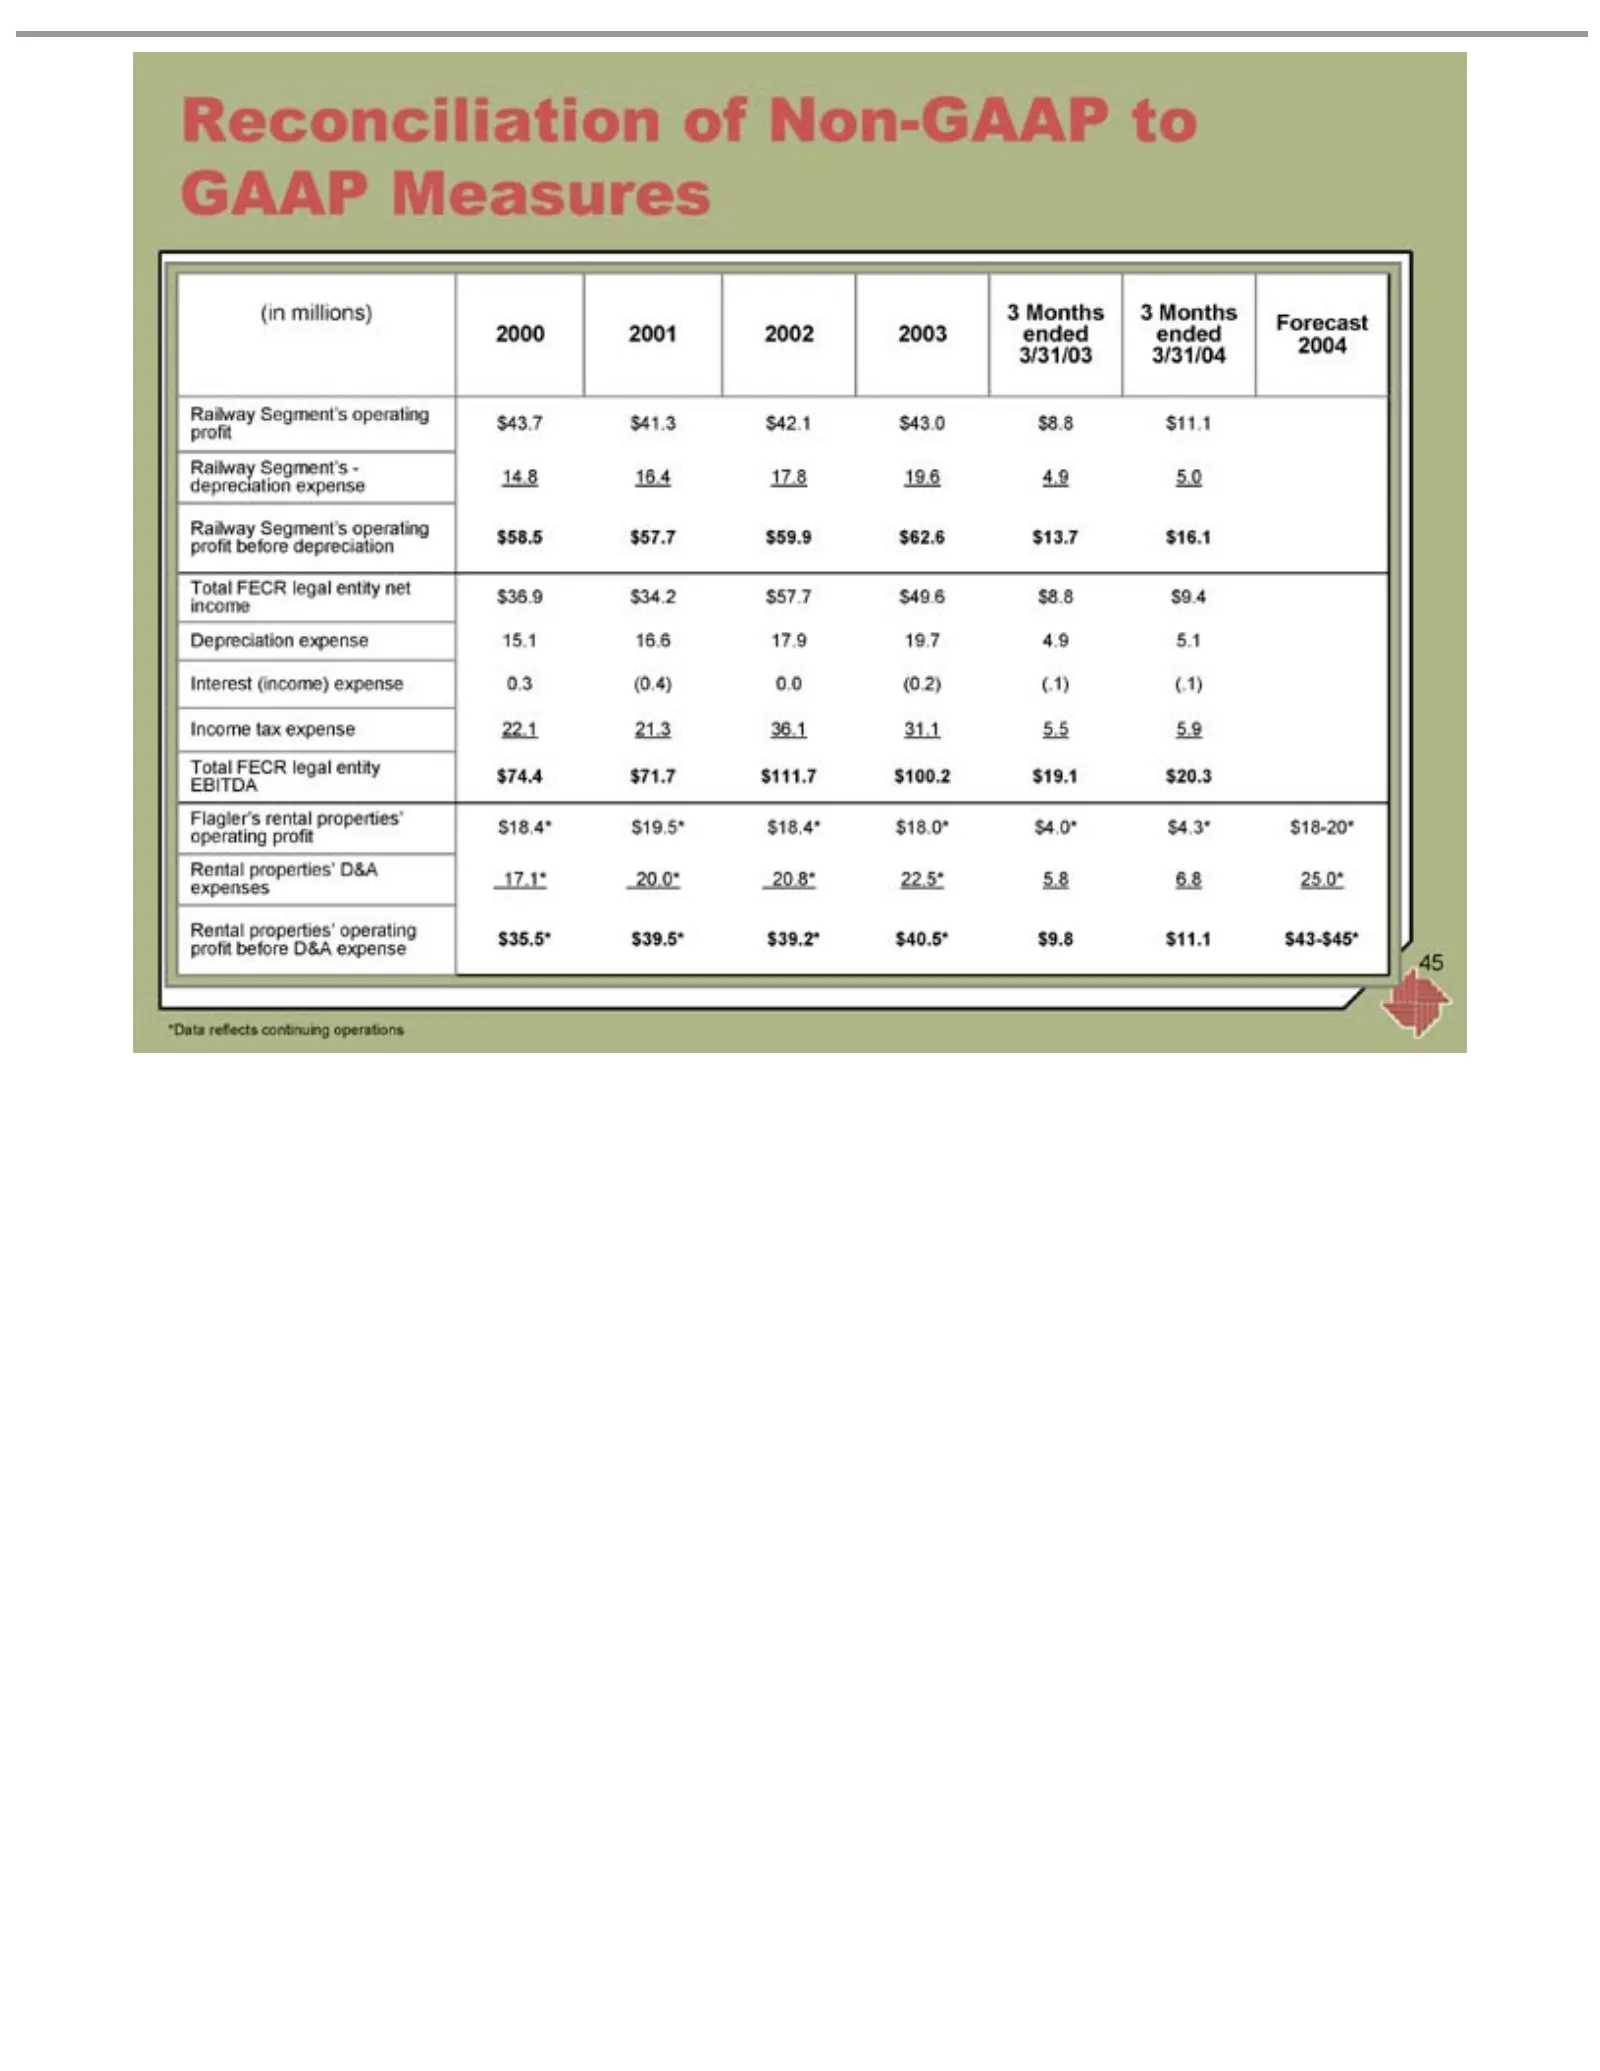
Slide 45: Non-GAAP Measures Reconciliation
Reconciliation (in 2000 Forecast 3/31/03 14.8 depreciation Railway Depreciation income Interest Income Total $ Flagler’s EBITDA $18.4* operating 17.1* Rental expenses $35.5* profit *Data 4543.7 58.5 36.9 74.4 millions) 16.4 2001 FECR before 20.0* reflects $properties’ $19.5* $39.5* (income) tax 3/31
Source: SEC EDGAR · 8-K filed May 14, 2004
More decks from Florida East Coast Industries Inc
 Merger or Acquisition (May 2007)15 slides · May 31, 2007
 Q1 2007 Earnings Presentation26 slides · May 9, 2007
 Q4 2006 Earnings Presentation39 slides · Feb 15, 2007
 Q3 2006 Earnings Presentation36 slides · Nov 2, 2006
 Ryan Beck Investor Event (September 2006)80 slides · Sep 13, 2006
 Morgan Keegan 2006 Equity Conference30 slides · Sep 7, 2006