Grant Prideco — Credit Suisse First Boston 2005 Offshore Technology Conference Roundtable
28 slides from Grant Prideco's conference presentation, May 3, 2005

Slide 1: Credit Suisse First Boston 2005 Offshore Technology Conference Roundtable
1 May 3, 2005 Mike McShane, Chairman, President & CEO Matt Fitzgerald, Sr. Vice President & CFO Credit Suisse First Boston 2005 Offshore Technology Conference Roundtable
Slide 2: Forward-Looking Statements
The information in this presentation contains forward-looking statements within the meaning of the Private Securities Litigation Reform Act of 1995 concerning, among other things, Grant Prideco's prospects for its operations and future demand for its products and services, all of which are subject t
Slide 3: Expansion Strategy Providing Less Cyclical Performance
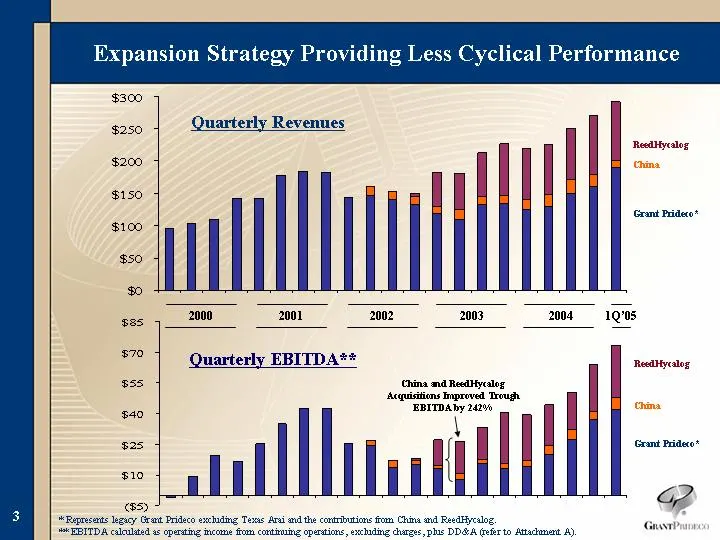
Expansion Strategy Providing Less Cyclical Performance Quarterly EBITDA** Quarterly Revenues * Represents legacy Grant Prideco excluding Texas Arai and the contributions from China and ReedHycalog. ** EBITDA calculated as operating income from continuing operations, excluding charges, plus DD&A (ref

Slide 4: Product Line Review
Product Line Review
Slide 5: Continuing China Expansion
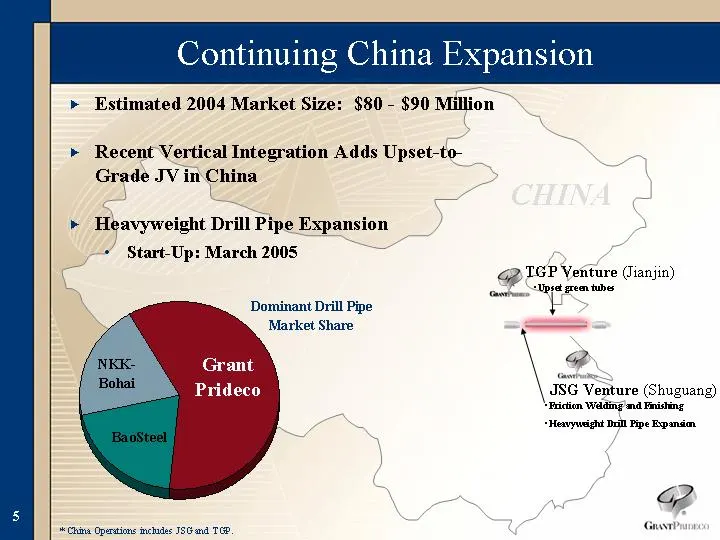
CHINA JSG Venture (Shuguang) TGP Venture (Jianjin) Friction Welding and Finishing Heavyweight Drill Pipe Expansion Upset green tubes * China Operations includes JSG and TGP. Continuing China Expansion Estimated 2004 Market Size: $80 - $90 Million Recent Vertical Integration Adds Upset-to- Grade JV i
Slide 6: Proven Record for Delivering Value-Added Drill Stem Products
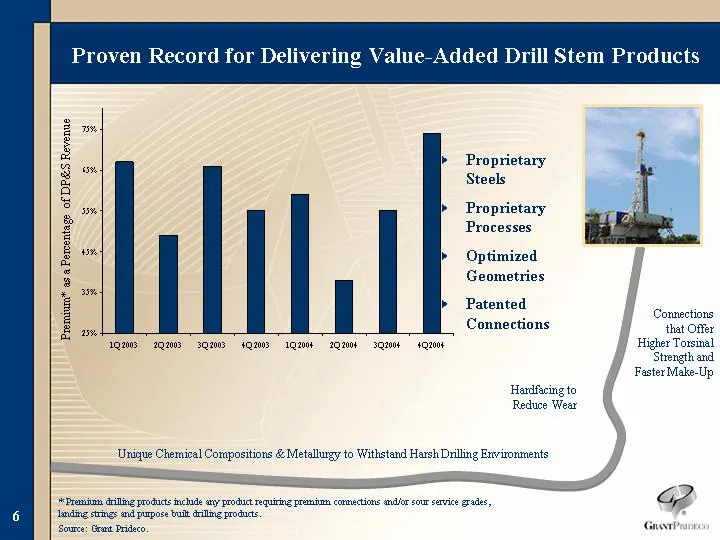
Proven Record for Delivering Value-Added Drill Stem Products * Premium drilling products include any product requiring premium connections and/or sour service grades, landing strings and purpose built drilling products. Source: Grant Prideco. Unique Chemical Compositions & Metallurgy to Withstand Ha
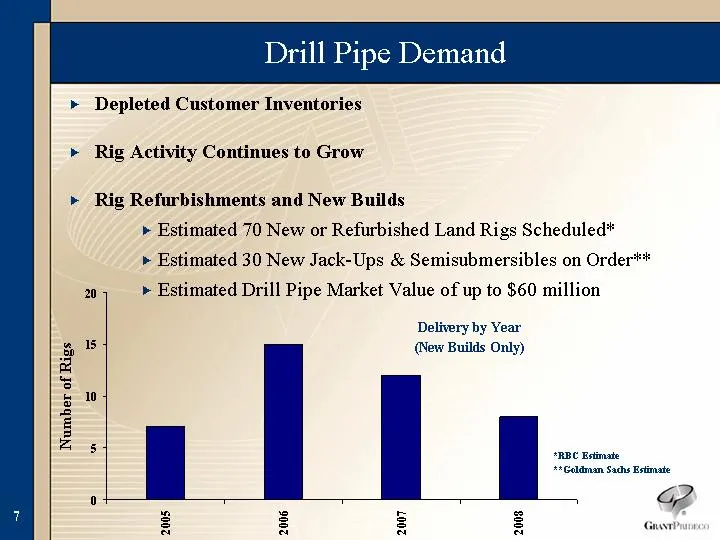
Slide 7: Shrinking Drill Pipe Inventories Should Provide Future Benefit
Shrinking Drill Pipe Inventories Should Provide Future Benefit Drill Pipe Demand Depleted Customer Inventories Rig Activity Continues to Grow Rig Refurbishments and New Builds Estimated 70 New or Refurbished Land Rigs Scheduled* Estimated 30 New Jack-Ups & Semisubmersibles on Order** Estimated Drill
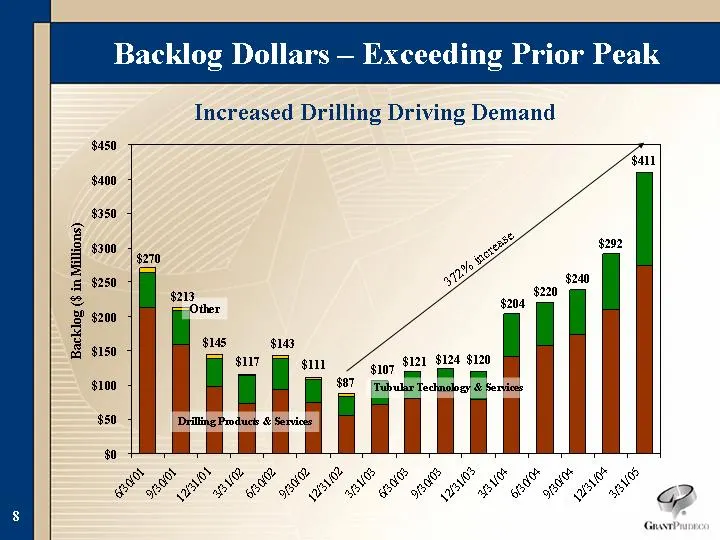
Slide 8: Backlog Dollars - Exceeding Prior Peak
Backlog Dollars - Exceeding Prior Peak 6/30/2001 9/30/2001 12/31/2001 3/31/2002 6/30/2002 9/30/2002 12/31/2002 3/31/2003 6/30/2003 9/30/2003 12/31/2003 3/31/2004 6/30/2004 9/30/2004 12/31/2004 3/31/2005 Drilling Products & Services 213.18 158.4 98.5 73.6 92.8 75.1 56.2 72 81 90 80 141.7 157.4 174.2
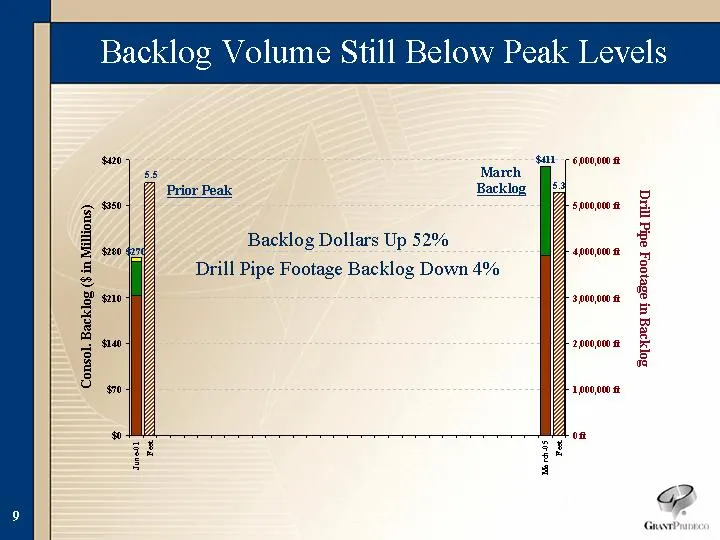
Slide 9: Backlog Volume Still Below Peak Levels
Backlog Volume Still Below Peak Levels Backlog Dollars Up 52% Drill Pipe Footage Backlog Down 4% March Backlog Prior Peak $270 $411 5.5 5.3 Drill Pipe Footage in Backlog Consol. Backlog ($ in Millions)
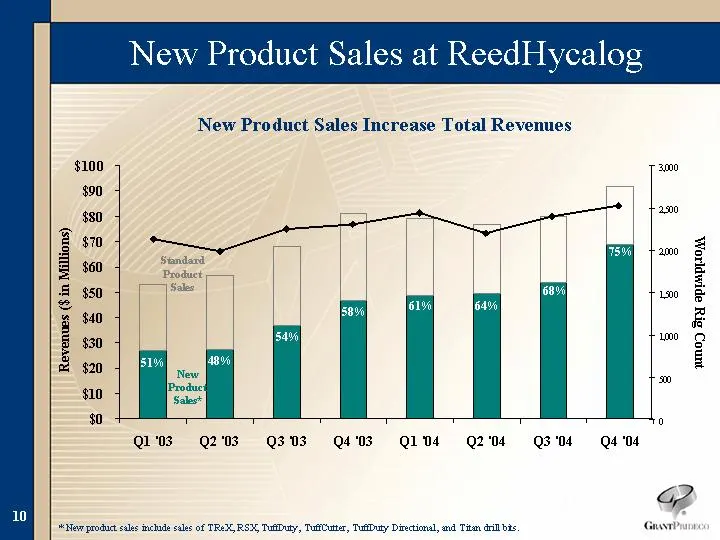
Slide 10: New Product Sales at ReedHycalog
Q1 '03 Q2 '03 Q3 '03 Q4 '03 Q1 '04 Q2 '04 Q3 '04 Q4 '04 Total New Product Sales 26.9 27.4 37 46.6 48.7 49.3 54 68.7 Standard Product Sales 26.3 29.3 31.1 34.3 30.5 27.3 25.5 22.9 Q1 '03 Q2 '03 Q3 '03 Q4 '03 Q1 '04 Q2 '04 Q3 '04 Q4 '04 Worldwide Rig Count 2135 1996 2253 2308 2444 2203 2401 2531 2135
Slide 11: Continuing Improvement at ReedHycalog
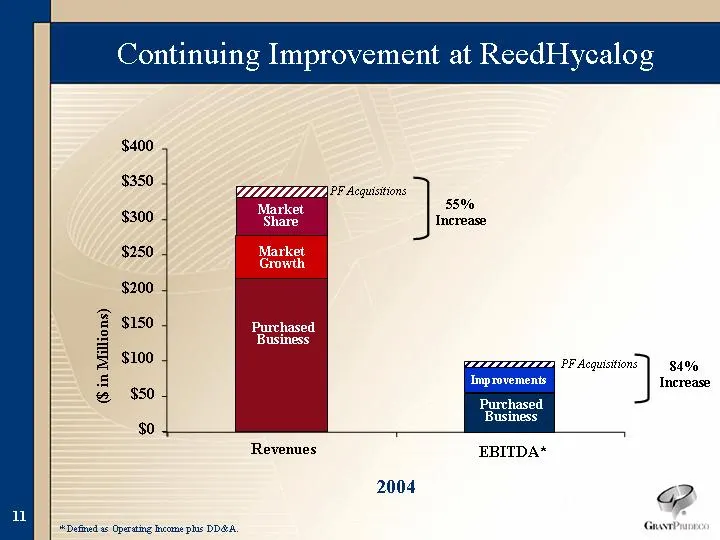
Continuing Improvement at ReedHycalog * Defined as Operating Income plus DD&A. Revenues Purchased Business Market Growth Market Share PF Acquisitions EBITDA* Purchased Business Improvements PF Acquisitions 55% Increase 84% Increase 2004 $0 $50 $100 $150 $200 $250 $300 $350 $400 ($ in Millions)
Slide 12: Recent Margin Focus Yields Results
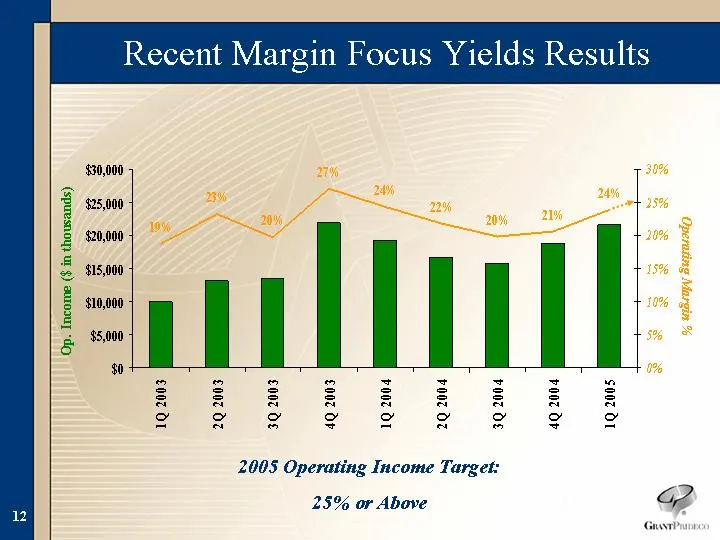
Recent Margin Focus Yields Results 2005 Operating Income Target: 25% or Above Operating Margin % Op. Income ($ in thousands)
Slide 13: Tubular Technology & Services
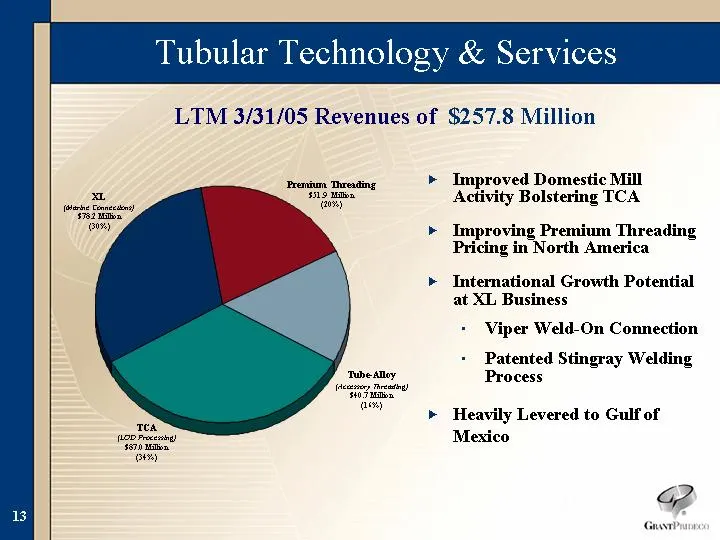
Tubular Technology & Services Premium Threading Tube-Alloy TCA XL 51.94 40.679 87.041 78.172 TCA (LOD Processing) $87.0 Million (34%) LTM 3/31/05 Revenues of $257.8 Million XL (Marine Connections) $78.2 Million (30%) Tube-Alloy (Accessory Threading) $40.7 Million (16%) Improved Domestic Mill Activit
Slide 14: Tubular Technology & Services
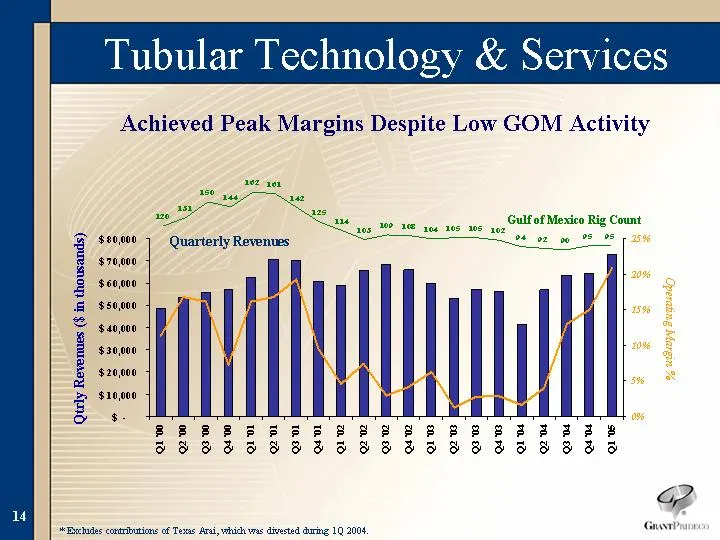
Tubular Technology & Services * Excludes contributions of Texas Arai, which was divested during 1Q 2004. Quarterly Revenues Operating Margin % Qtrly Revenues ($ in thousands) Gulf of Mexico Rig Count Achieved Peak Margins Despite Low GOM Activity
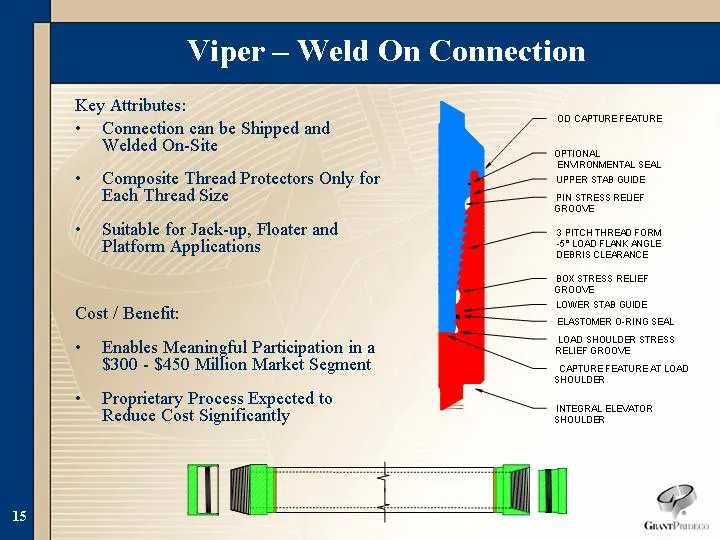
Slide 15: Viper - Weld On Connection
Key Attributes: Connection can be Shipped and Welded On-Site Composite Thread Protectors Only for Each Thread Size Suitable for Jack-up, Floater and Platform Applications Cost / Benefit: Enables Meaningful Participation in a $300 - $450 Million Market Segment Proprietary Process Expected to Reduce C
Slide 16: Financial Overview
Financial Overview
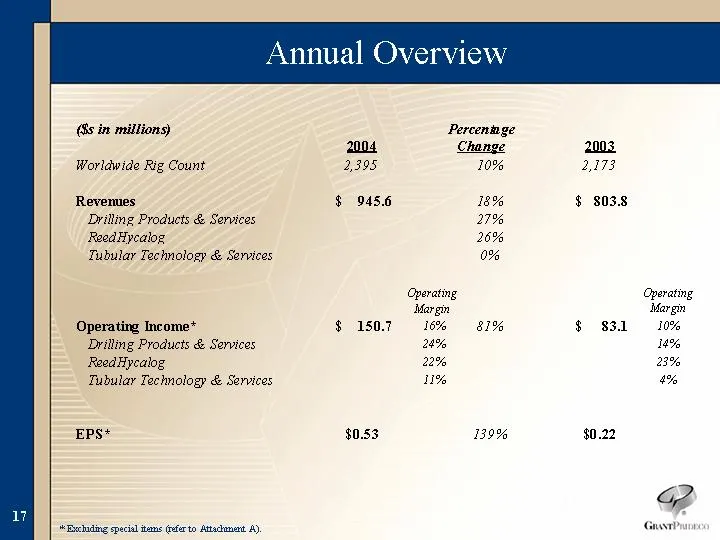
Slide 17: Annual Overview
Annual Overview * Excluding special items (refer to Attachment A).
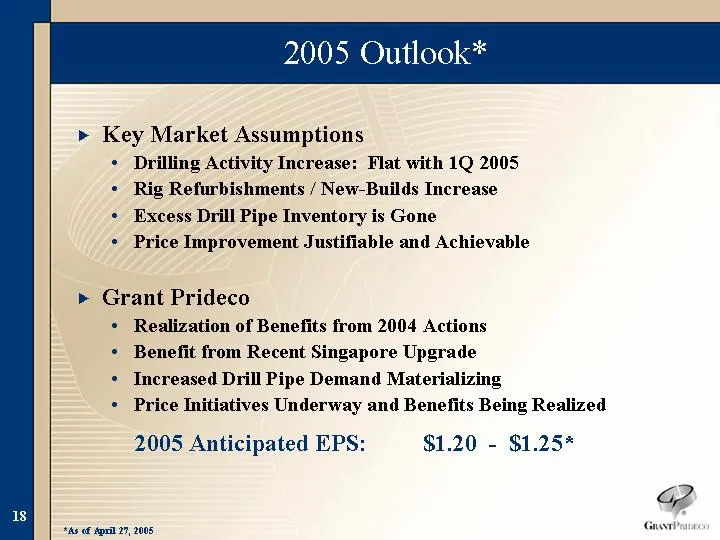
Slide 18: 2005 Outlook
2005 Outlook* Key Market Assumptions Drilling Activity Increase: Flat with 1Q 2005 Rig Refurbishments / New-Builds Increase Excess Drill Pipe Inventory is Gone Price Improvement Justifiable and Achievable Grant Prideco Realization of Benefits from 2004 Actions Benefit from Recent Singapore Upgrade I
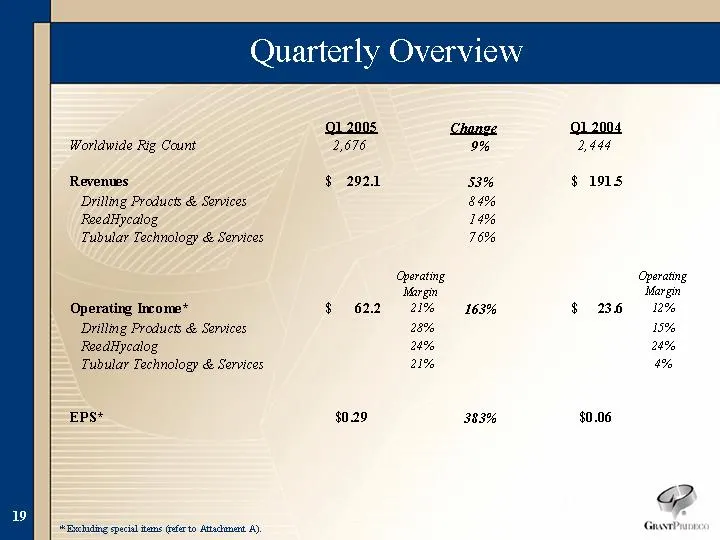
Slide 19: Quarterly Overview
Quarterly Overview * Excluding special items (refer to Attachment A).
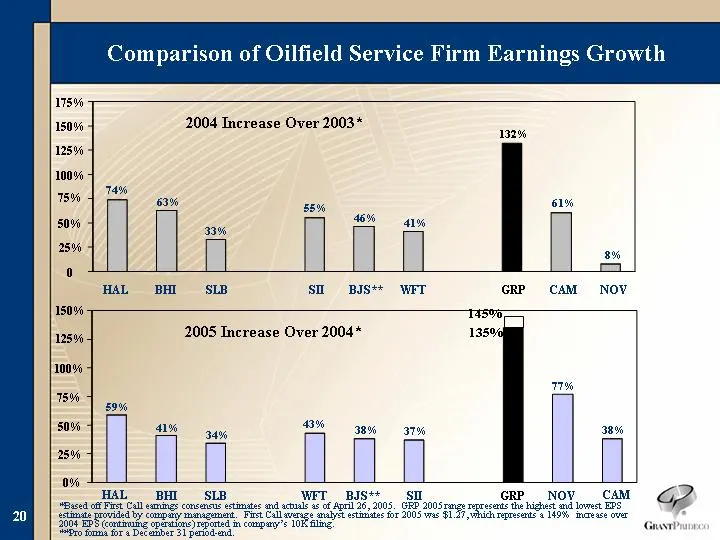
Slide 20: Comparison of Oilfield Service Firm Earnings Growth
Comparison of Oilfield Service Firm Earnings Growth HAL BHI SLB SII BJS WFT GRP CAM NOV 2004 Increase Over 2003 0.738 0.629 0.329 0.555 0.463 0.411 1.318 0.607 0.08 HAL BHI SLB BJS** SII WFT GRP CAM NOV 2004 Increase Over 2003* 150% 125% 100% 75% 50% 25% 0 HAL BHI SLB WFT BJS SII GRP NOI CAM 2005 In
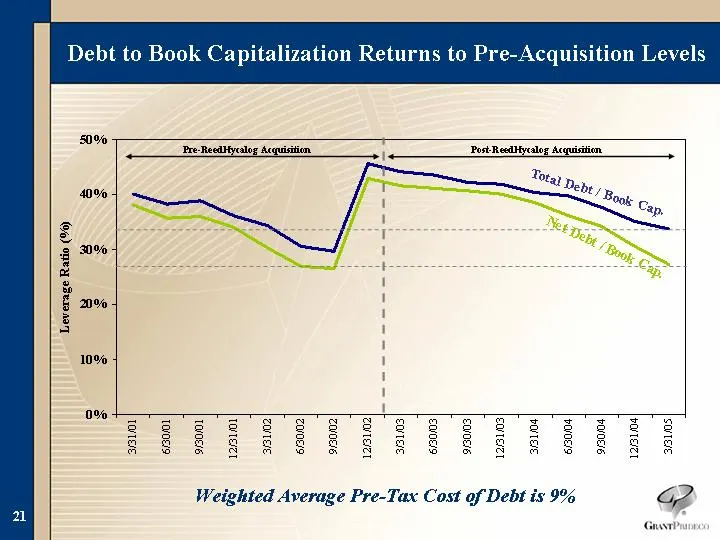
Slide 21: Debt to Book Capitalization Returns to Pre-Acquisition Levels
Debt to Book Capitalization Returns to Pre-Acquisition Levels 3/31/2001 6/30/2001 9/30/2001 12/31/2001 3/31/2002 6/30/2002 9/30/2002 12/31/2002 3/31/2003 6/30/2003 9/30/2003 12/31/2003 3/31/2004 6/30/2004 9/30/2004 12/31/2004 3/31/2005 Total Debt / Cap 0.4 0.383 0.388 0.362 0.344 0.305 0.296 0.457 0
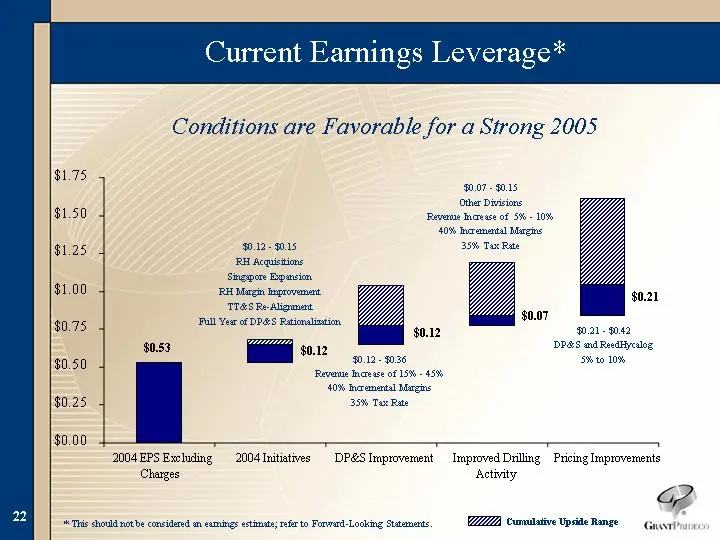
Slide 22: Current Earnings Leverage
Current Earnings Leverage* * This should not be considered an earnings estimate; refer to Forward-Looking Statements. Cumulative Upside Range Conditions are Favorable for a Strong 2005 $0.53 $0.21 - $0.42 DP&S and ReedHycalog 5% to 10% $0.21 $0.07 - $0.15 Other Divisions Revenue Increase of 5% - 10%

Slide 23
Slide 24: sia
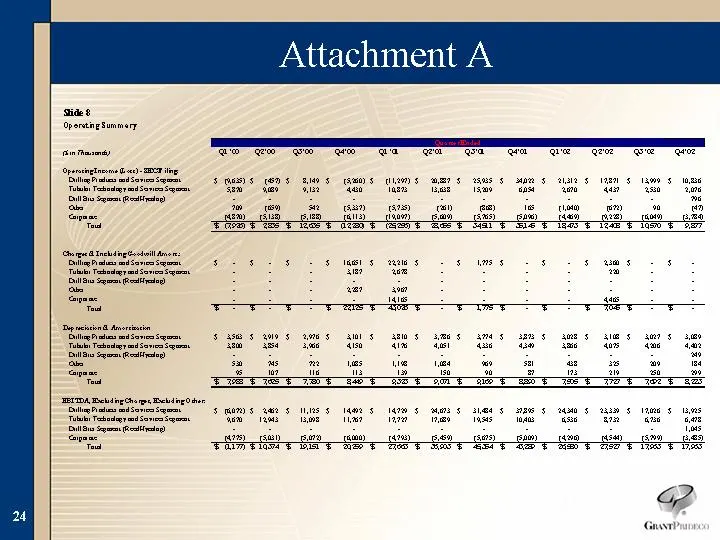
sia ones aati Herma makings edhe tor See Se ee Se ee $OENs cons AMS Gums Glas mars wes s Rs ales IMs Res me gm us gp fein dum an gaan) cam ela € tes eee eden te See et ee ee ee tae pe ess es FROM Ss Aer S MSS Mors arm sams BEES EES AOU SES Ress Rms vin ehiere fie eke efes + Se Se ee ae Be te os B Ga
Slide 25: Attachment A (continued)
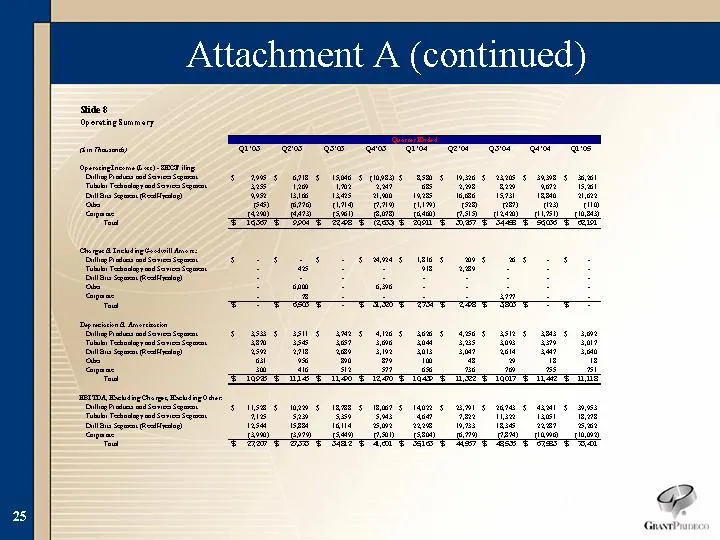
Attachment A (continued)
Slide 26: Attachment A (continued)
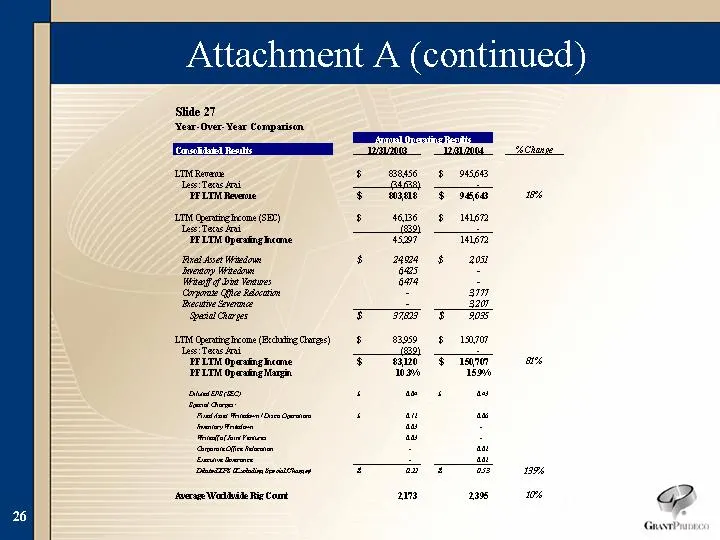
Attachment A (continued) Slide 27 ‘Yew Over-Year Comparison tava mm _ 2h anaeene a Tes Ten ink fay Triste T taat Face ae ‘mcg (S) $ sane mien ie ae 3 mm $200 Jno acne tes e | Aten of bia Vewwes ane - Crp Ge Ean 2 ain ‘tian Snomee 2 30 Spee Cher owe 3 Ross UNoprakeheome(Ecame Owes) «$a & Leterhe ian
Slide 27: Year-Over-Year Comparison
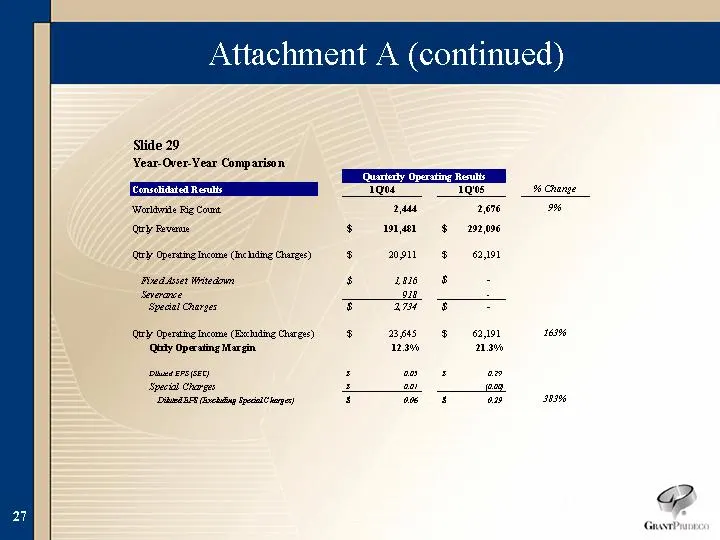
Slide 29 ‘Year-Over-Year Comparison (ay Opening income (Including Charges) Pied vet Wtedon Soave ‘Special Charges (ay Opentng come (Beading Charges) (Qhiy Operating Margin uses er(cer) ‘Speck Charges ‘Pied inchatg Spec oge) ‘Quartesly Operating Revulis 104 19% 2M 2656 $s ian ao2,006 3 men e291 $ 1u6
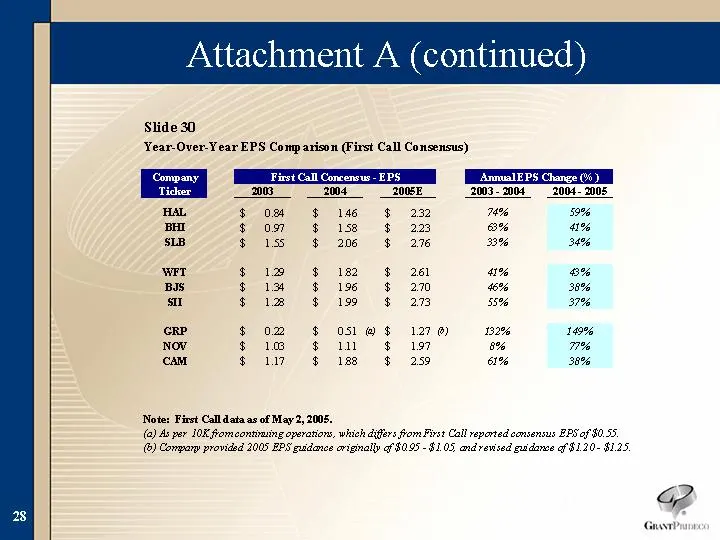
Slide 28: Attachment A (continued)
Attachment A (continued) Slide 30 ‘Year-Over-Year EPS Comparison (First Call Consensus) Fizst Call Concensus -EPS “Anmal EPS Change! 2003 2004 20055. ‘2003-2004 _2004- 2005 $ 08% $ 14 $ 232 746 5096 $ 07 $ 158 $ 223 2% 0% $15 $ 20 $ 276 3% 340% WrT $19 $ 192 $ 261 1% 8% BIS $ 13% $ 19 $ 270 6% 38% s
Source: SEC EDGAR · 8-K filed May 3, 2005
More decks from Grant Prideco Inc
 Pritchard Capital Partners 2008 Energize Conference30 slides · Jan 8, 2008
 Credit Suisse Vail Energy Conference 200636 slides · Feb 1, 2006
 Lehman Brothers 19th Annual CEO Energy / Power Conference (September 2005)28 slides · Sep 7, 2005
 Debt Investor Presentation (July 2005)29 slides · Jul 13, 2005
 Credit Suisse First Boston Vail Energy Conference 200530 slides · Feb 1, 2005
 UBS Warburg 2004 Global Oil & Gas Conference19 slides · Jun 4, 2004