Grant Prideco — Credit Suisse Vail Energy Conference 2006
36 slides from Grant Prideco's conference presentation, Feb 1, 2006

Slide 1: Credit Suisse Vail Energy Conference
Credit Suisse- Vail Energy Conference February 1, 2006 Mike McShane, Chairman, President & CEO Matt Fitzgerald, Senior Vice President & CFO
Slide 2: Forward-Looking Statements
The information in this presentation contains forward-looking statements within the meaning of the Private Securities Litigation Reform Act of 1995 concerning, among other things, Grant Prideco's prospects for its operations and future demand for its products and services, all of which are subject t
Slide 3: Recent Highlights
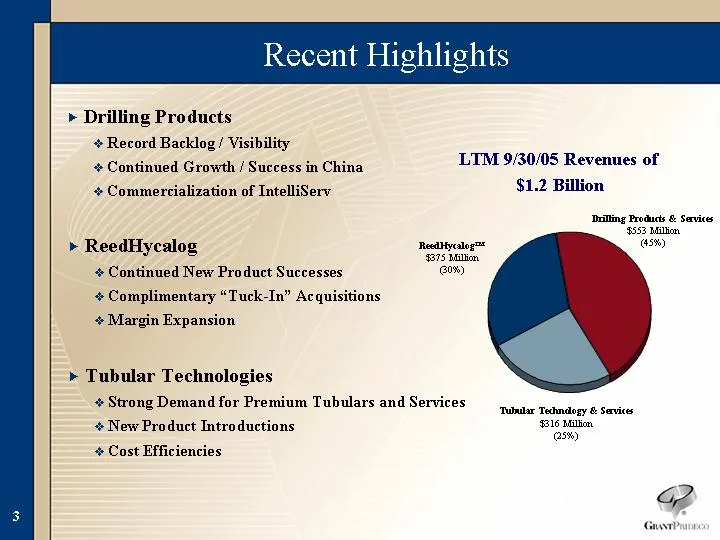
Recent Highlights Drilling Products Record Backlog / Visibility Continued Growth / Success in China Commercialization of IntelliServ Tubular Technologies Strong Demand for Premium Tubulars and Services New Product Introductions Cost Efficiencies ReedHycalog Continued New Product Successes Compliment
Slide 4: Strategy: Providing Growth and Margins
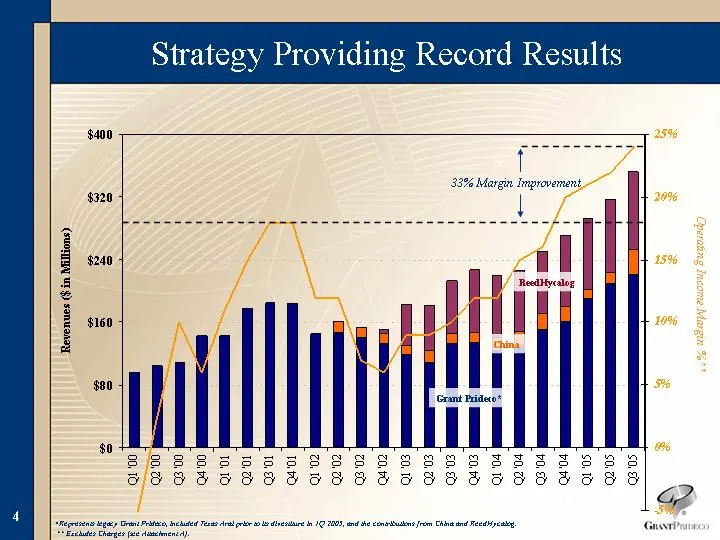
Q1 '00 Q2 '00 Q3 '00 Q4 '00 Q1 '01 Q2 '01 Q3 '01 Q4 '01 Q1 '02 Q2 '02 Q3 '02 Q4 '02 Q1 '03 Q2 '03 Q3 '03 Q4 '03 Q1 '04 Q2 '04 Q3 '04 Q4 '04 Q1 '05 Q2 '05 Q3 '05 PF GRP 95.713 103.9 109.17 142.876 142.788 177.681 184.364 183.223 144.838 146.856 139.824 132.946 119.476 109.347 132.027 134.118 124.378
Slide 5: Industry Leading Margins
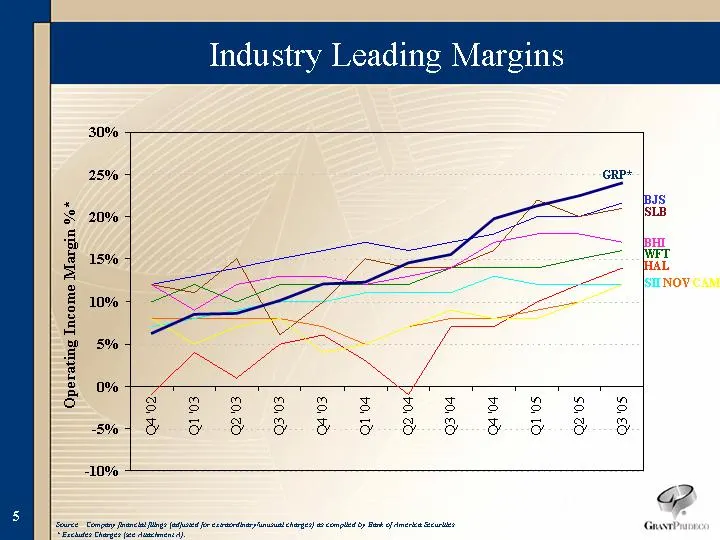
Industry Leading Margins Q1 '00 Q2 '00 Q3 '00 Q4 '00 Q1 '01 Q2 '01 Q3 '01 Q4 '01 Q1 '02 Q2 '02 Q3 '02 Q4 '02 Q1 '03 Q2 '03 Q3 '03 Q4 '03 Q1 '04 Q2 '04 Q3 '04 Q4 '04 Q1 '05 Q2 '05 Q3 '05 BJS 0.13 0.11 0.15 0.21 0.23 0.27 0.25 0.21 0.14 0.1 0.11 0.12 0.13 0.14 0.15 0.16 0.17 0.16 0.17 0.18 0.2 0.2 0.2
Slide 6: Highest Backlog Ever
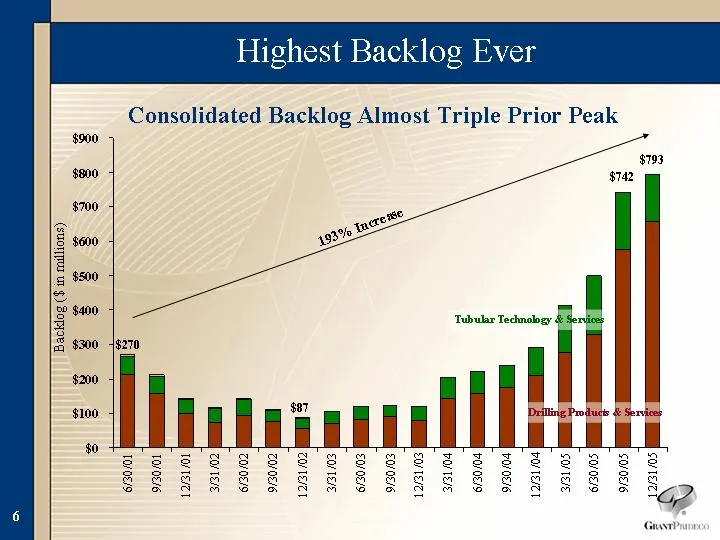
Highest Backlog Ever 6/30/2001 9/30/2001 12/31/2001 3/31/2002 6/30/2002 9/30/2002 12/31/2002 3/31/2003 6/30/2003 9/30/2003 12/31/2003 3/31/2004 6/30/2004 9/30/2004 12/31/2004 3/31/2005 6/30/2005 9/30/2005 12/31/2005 Drilling Products & Services 213.18 158.4 98.5 73.6 92.8 75.1 56.2 72 81 90 80 141.7
Slide 7: 2006 Initiatives
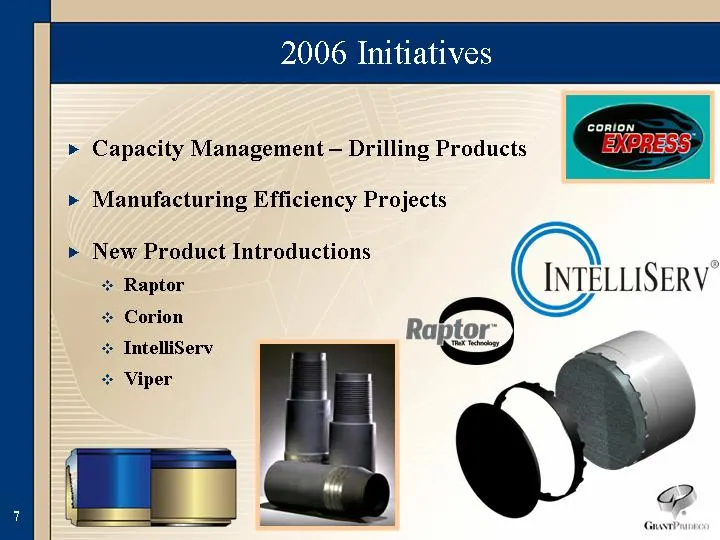
2006 Initiatives Capacity Management - Drilling Products Manufacturing Efficiency Projects New Product Introductions Raptor Corion IntelliServ Viper
Slide 8: Drilling Products Strategy
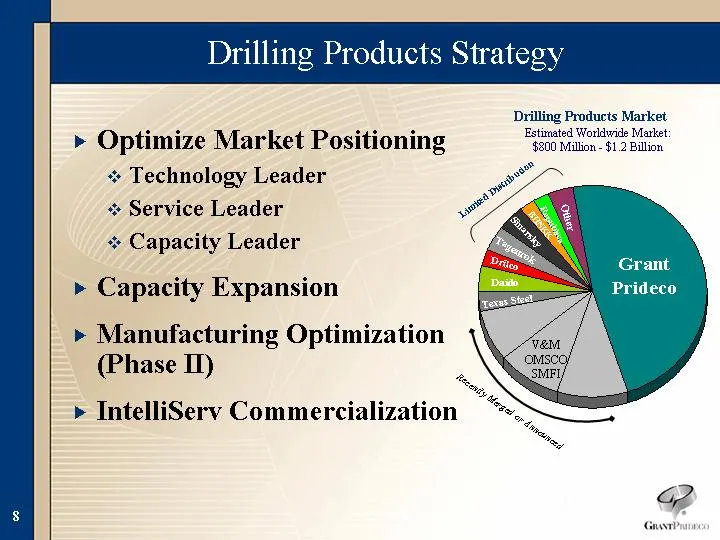
Drilling Products Strategy Optimize Market Positioning Technology Leader Service Leader Capacity Leader Capacity Expansion Manufacturing Optimization (Phase II) IntelliServ Commercialization Grant Prideco OMSCO V&M Texas Steel Daido Drilco Tagenrok Sinarsky BHNKK Republica OTHER Market Share 299 61
Slide 9: Drill Pipe Demand Drivers
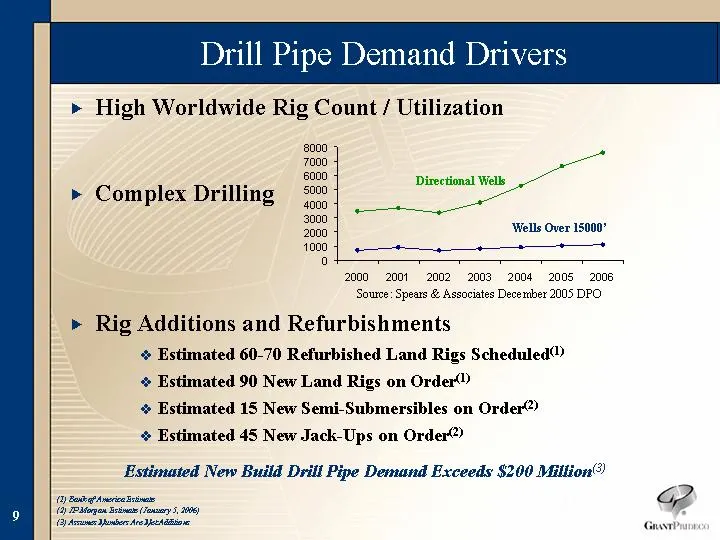
Drill Pipe Demand Drivers High Worldwide Rig Count / Utilization Complex Drilling Rig Additions and Refurbishments Estimated 60-70 Refurbished Land Rigs Scheduled(1) Estimated 90 New Land Rigs on Order(1) Estimated 15 New Semi-Submersibles on Order(2) Estimated 45 New Jack-Ups on Order(2) Estimated
Slide 10: Drill Pipe Backlog Sets New Record
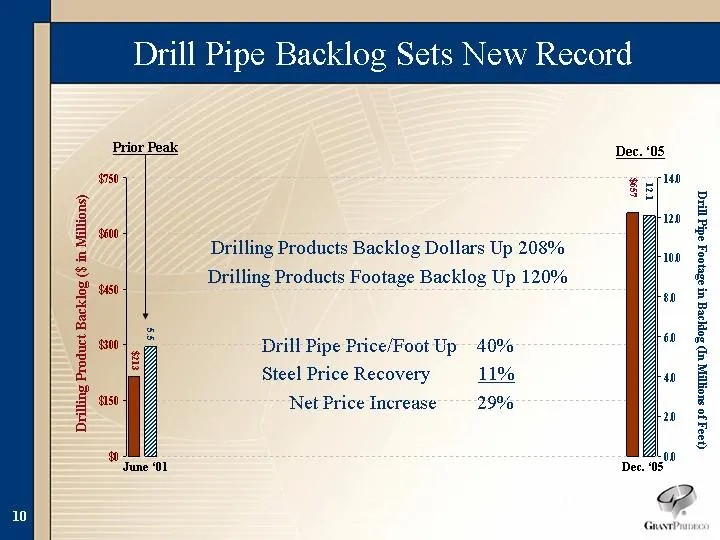
Drill Pipe Backlog Sets New Record Drilling Products Backlog Dollars Up 208% Drilling Products Footage Backlog Up 120% Drill Pipe Price/Foot Up 40% Steel Price Recovery 11% Net Price Increase 29% Dec. '05 Prior Peak 5.5 12.1 Drill Pipe Footage in Backlog (In Millions of Feet) Drilling Product Backlo
Slide 11: Drill Pipe Production & Capacity
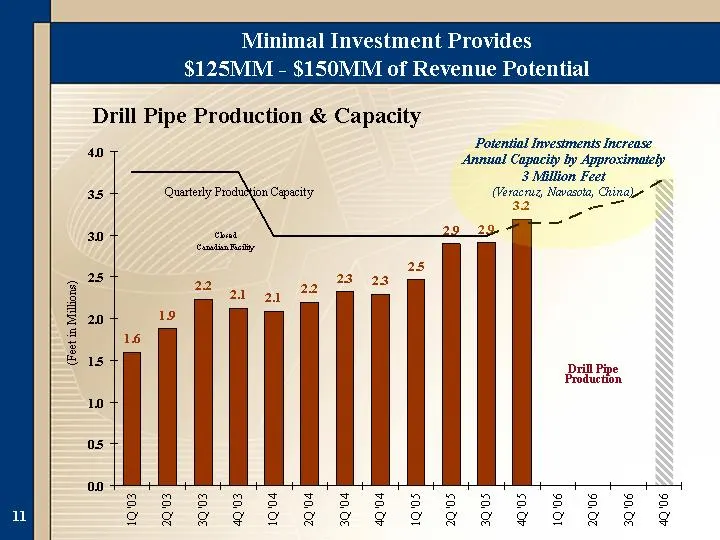
Minimal Investment Provides $125MM - $150MM of Revenue Potential Drill Pipe Production Quarterly Production Capacity 1Q '03 2Q '03 3Q '03 4Q '03 1Q '04 2Q '04 3Q '04 4Q '04 1Q '05 2Q '05 3Q '05 4Q '05 1Q '06 2Q '06 3Q '06 4Q '06 Consol. Drill Pipe Production 1.601 1.882 2.234 2.124 2.099 2.198 2.329
Slide 12: Strong Position in World's 2nd Largest Market
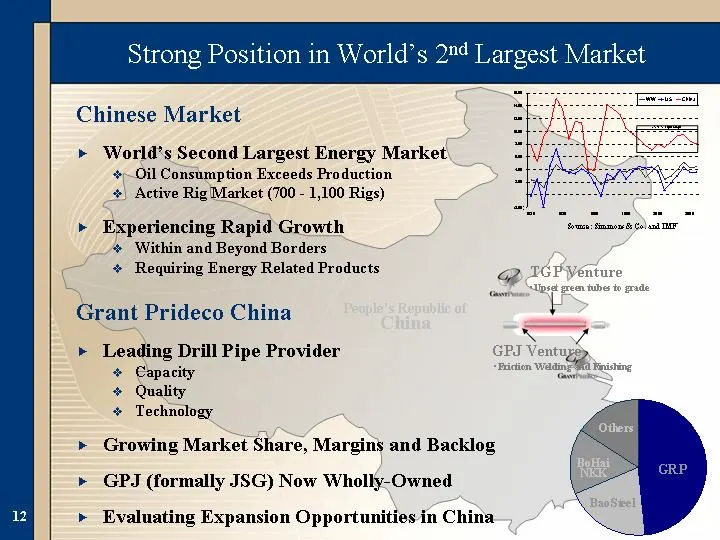
Strong Position in World's 2nd Largest Market Chinese Market World's Second Largest Energy Market Oil Consumption Exceeds Production Active Rig Market (700 - 1,100 Rigs) Experiencing Rapid Growth Within and Beyond Borders Requiring Energy Related Products GPJ Venture TGP Venture Friction Welding and
Slide 13: IntelliServ: Recent Highlights
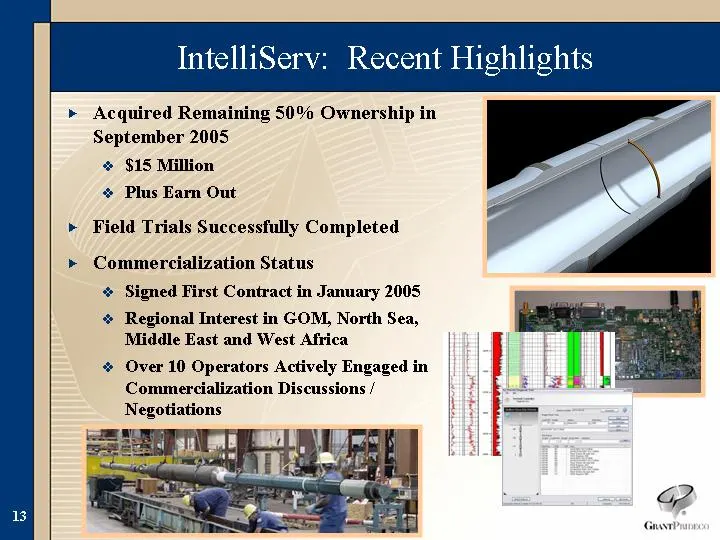
IntelliServ: Recent Highlights Acquired Remaining 50% Ownership in September 2005 $15 Million Plus Earn Out Field Trials Successfully Completed Commercialization Status Signed First Contract in January 2005 Regional Interest in GOM, North Sea, Middle East and West Africa Over 10 Operators Actively E
Slide 14: IntelliServ Network
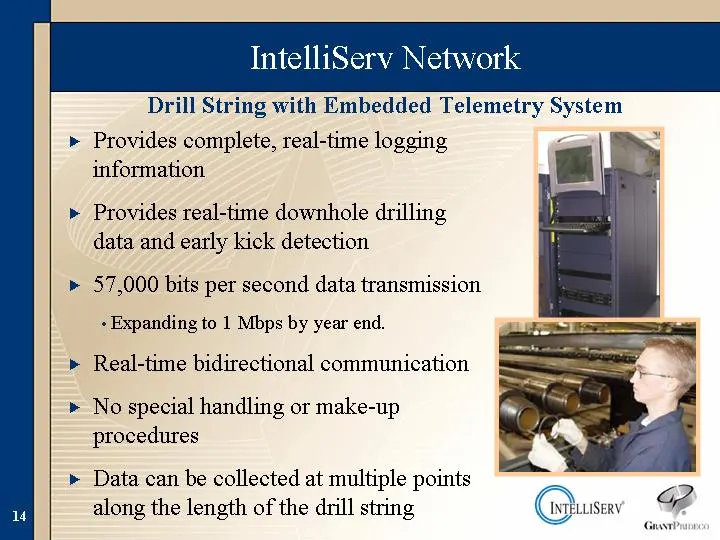
IntelliServ Network Provides complete, real-time logging information Provides real-time downhole drilling data and early kick detection 57,000 bits per second data transmission Expanding to 1 Mbps by year end. Real-time bidirectional communication No special handling or make-up procedures Data can b
Slide 15: ReedHycalog Strategy
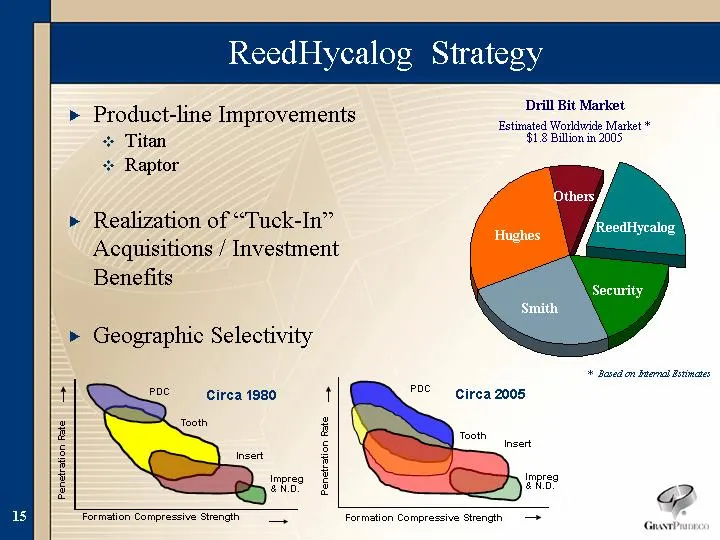
ReedHycalog Strategy Product-line Improvements Titan Raptor Realization of "Tuck-In" Acquisitions / Investment Benefits Geographic Selectivity Reed-Hycalog Security Smith Hughes Others 0.21 0.17 0.25 0.28 0.09 ReedHycalog Security Hughes Smith Others Drill Bit Market Estimated Worldwide Market * $1.
Slide 16: Recent Highlights + 2006 Opportunities
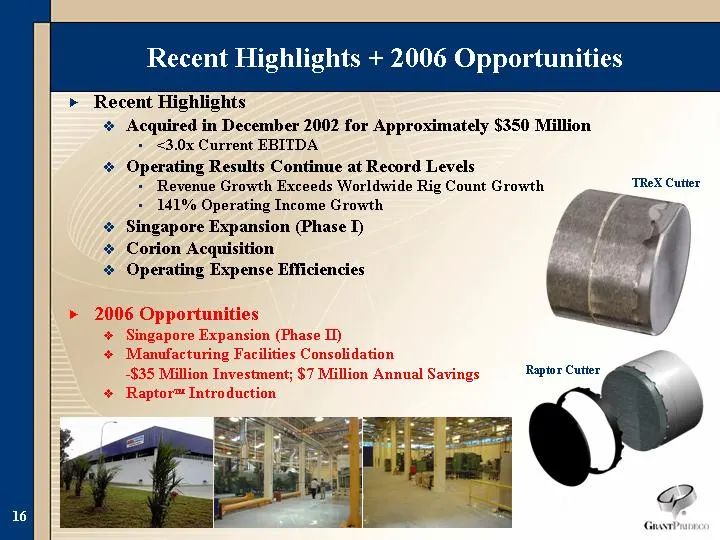
Recent Highlights + 2006 Opportunities Recent Highlights Acquired in December 2002 for Approximately $350 Million <3.0x Current EBITDA Operating Results Continue at Record Levels Revenue Growth Exceeds Worldwide Rig Count Growth 141% Operating Income Growth Singapore Expansion (Phase I) Corion Acqui
Slide 17: ReedHycalog Margin Focus Yields Results
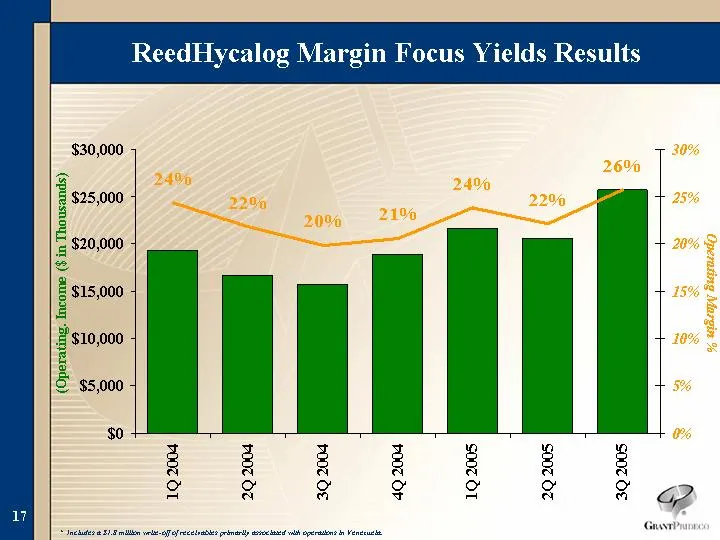
ReedHycalog Margin Focus Yields Results Operating Margin % (Operating. Income ($ in Thousands) * Includes a $1.8 million write-off of receivables primarily associated with operations in Venezuela.
Slide 18: Tubular Technology & Services
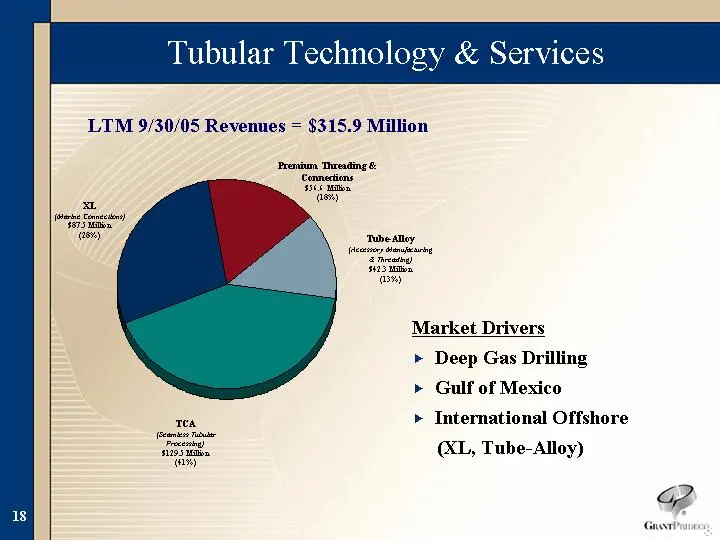
Tubular Technology & Services TCA (Seamless Tubular Processing) $129.5 Million (41%) XL (Marine Connections) $87.5 Million (28%) Tube-Alloy (Accessory Manufacturing & Threading) $42.3 Million (13%) Premium Threading & Connections $56.6 Million (18%) Market Drivers Deep Gas Drilling Gulf of Mexico In
Slide 19: Tubular Technology Improvements
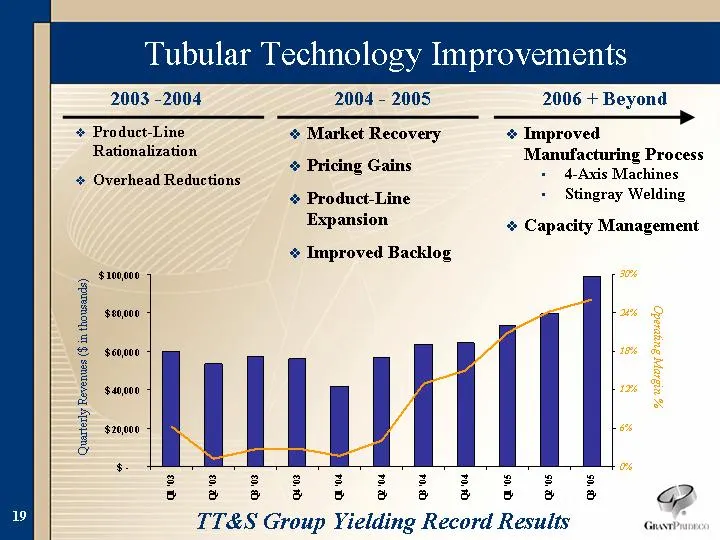
Tubular Technology Improvements Product-Line Rationalization Overhead Reductions Market Recovery Pricing Gains Product-Line Expansion Improved Backlog 2003 -2004 2004 - 2005 2006 + Beyond TT&S Group Yielding Record Results Improved Manufacturing Process 4-Axis Machines Stingray Welding Capacity Mana
Slide 20: XL Systems - Viper + Stingray
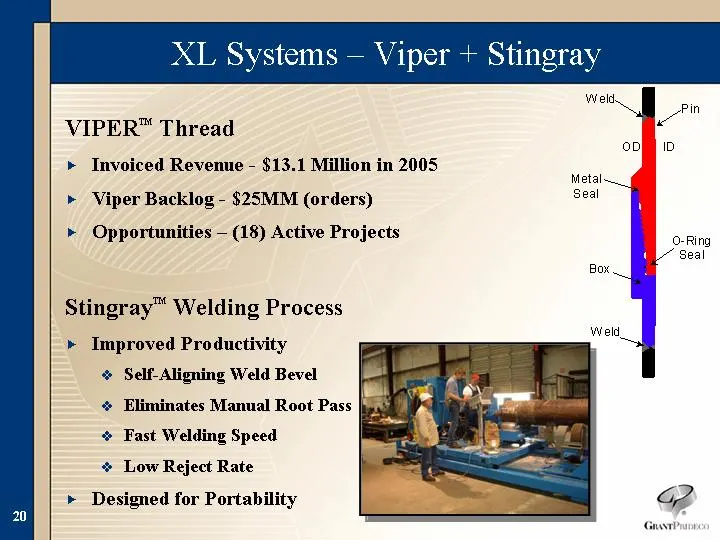
XL Systems - Viper + Stingray VIPERTM Thread Invoiced Revenue - $13.1 Million in 2005 Viper Backlog - $25MM (orders) Opportunities - (18) Active Projects StingrayTM Welding Process Improved Productivity Self-Aligning Weld Bevel Eliminates Manual Root Pass Fast Welding Speed Low Reject Rate Designed
Slide 21: TT&S Backlog
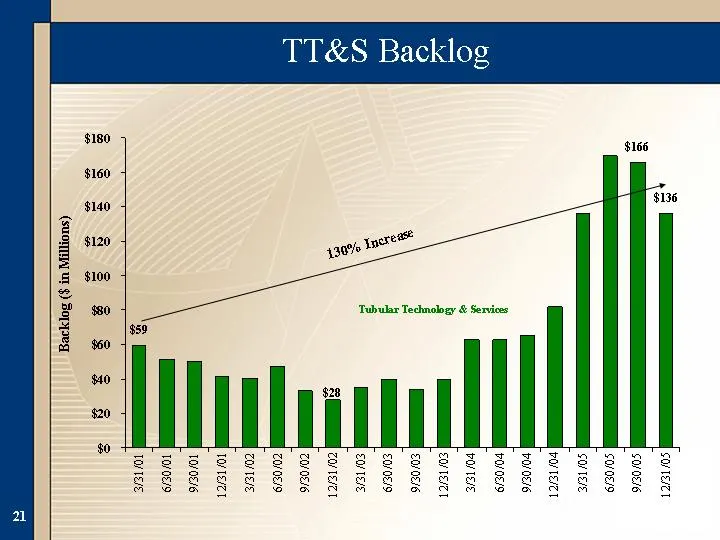
TT&S Backlog 3/31/2001 6/30/2001 9/30/2001 12/31/2001 3/31/2002 6/30/2002 9/30/2002 12/31/2002 3/31/2003 6/30/2003 9/30/2003 12/31/2003 3/31/2004 6/30/2004 9/30/2004 12/31/2004 3/31/2005 6/30/2005 9/30/2005 12/31/2005 Tubular Technology & Services 59.2 51.389 50.2 41.5 40.1 47.2 33.3 27.9 35 40 34 4

Slide 22: Financial
Financial
Slide 23: Recent Highlights
Recent Highlights Record Revenues and Earnings Margin Expansion Through: Volumes Pricing Efficiencies Restructured Balance Sheet Continued Capital Discipline / Return Focus
Slide 24: Quarterly Overview
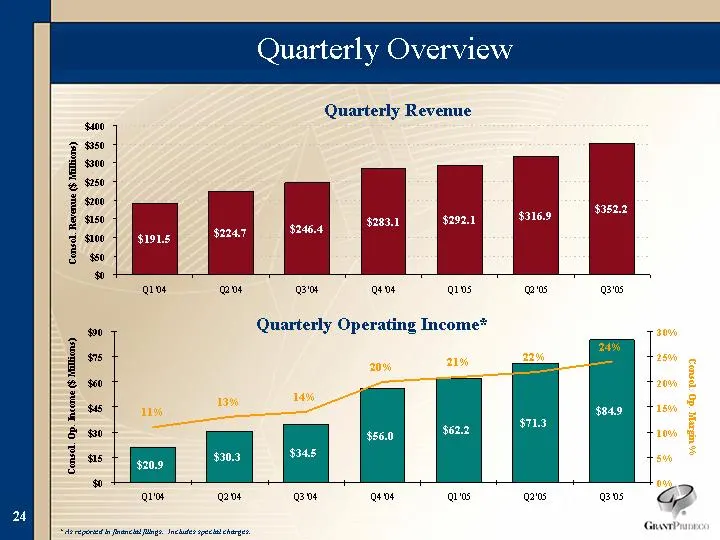
Quarterly Overview Q1 '04 Q2 '04 Q3 '04 Q4 '04 Q1 '05 Q2 '05 Q3 '05 Consol. Revenue 191.48 224.67 246.37 283.13 292.1 316.947 352.23 Q1 '04 Q2 '04 Q3 '04 Q4 '04 Q1 '05 Q2 '05 Q3 '05 Consol. SEC Op. Income 20.91 30.27 34.46 56.04 62.19 71.27 84.85 Op Margin % 0.11 0.13 0.14 0.2 0.21 0.22 0.24 Quarter
Slide 25: Restructured Balance Sheet Improves Performance & Flexibility
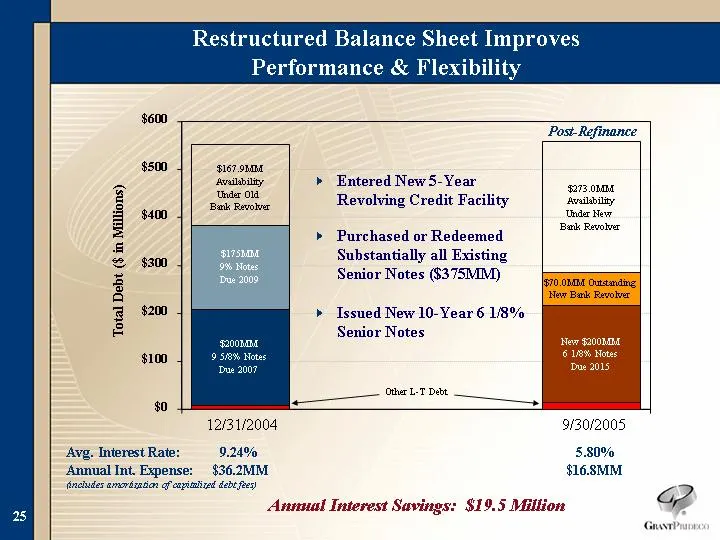
Restructured Balance Sheet Improves Performance & Flexibility Total Debt ($ in Millions) Entered New 5-Year Revolving Credit Facility Other L-T Debt Avg. Interest Rate: 9.24% 5.80% Annual Int. Expense: $36.2MM $16.8MM (includes amortization of capitalized debt fees) Annual Interest Savings: $19.5 Mi
Slide 26: Maintaining Capital Discipline in Strengthening Industry
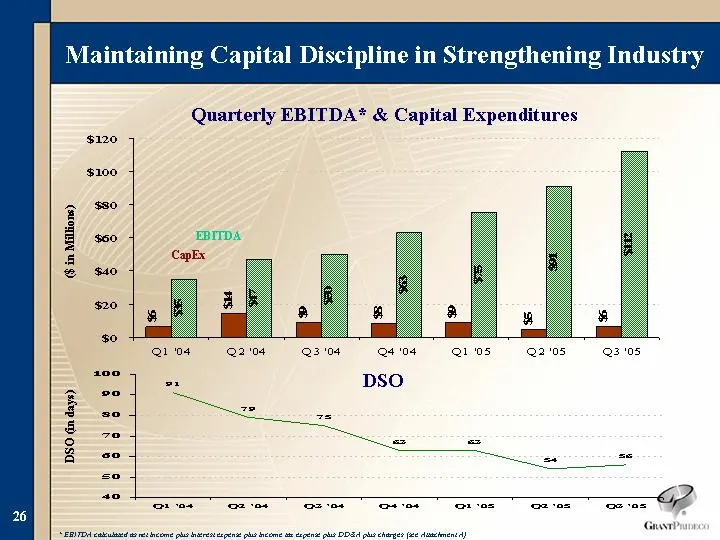
Maintaining Capital Discipline in Strengthening Industry Quarterly EBITDA* & Capital Expenditures ($ in Millions) Q1 '04 Q2 '04 Q3 '04 Q4 '04 Q1 '05 Q2 '05 Q3 '05 CapEx 6.29 14.44 8.8 8.35 9.1 4.86 6.36 EBITDA 34.65 46.86 50.03 63 74.86 90.81 112.11 EBITDA CapEx * EBITDA calculated as net income plu
Slide 27: 2006 Capital Expenditures
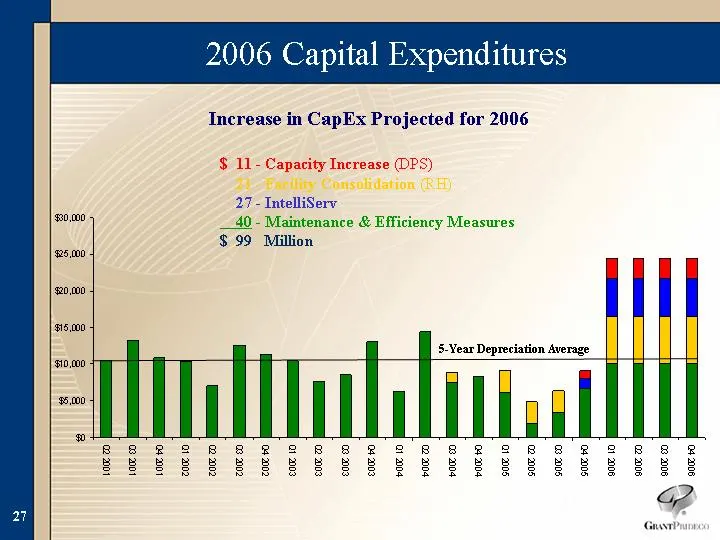
2006 Capital Expenditures 5-Year Depreciation Average Increase in CapEx Projected for 2006 $ 11 - Capacity Increase (DPS) 21 - Facility Consolidation (RH) 27 - IntelliServ 40 - Maintenance & Efficiency Measures $ 99 Million
Slide 28: Delivering Strong Returns
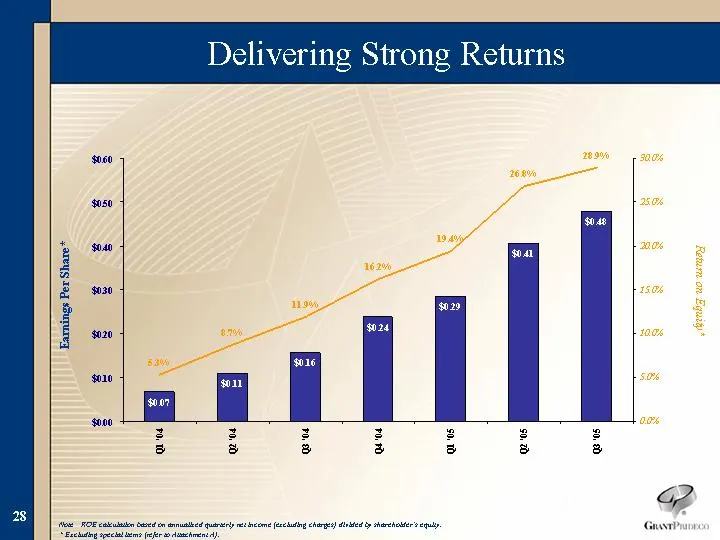
Delivering Strong Returns Earnings Per Share* Note: ROE calculation based on annualized quarterly net income (excluding charges) divided by shareholder's equity. * Excluding special items (refer to Attachment A). Return on Equity*
Slide 29: Summary
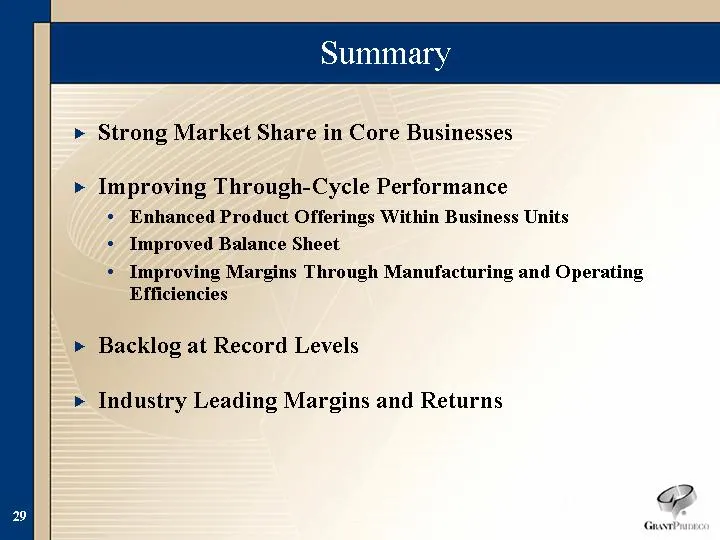
Summary Strong Market Share in Core Businesses Improving Through-Cycle Performance Enhanced Product Offerings Within Business Units Improved Balance Sheet Improving Margins Through Manufacturing and Operating Efficiencies Backlog at Record Levels Industry Leading Margins and Returns

Slide 30
Slide 31: Cee ayaa
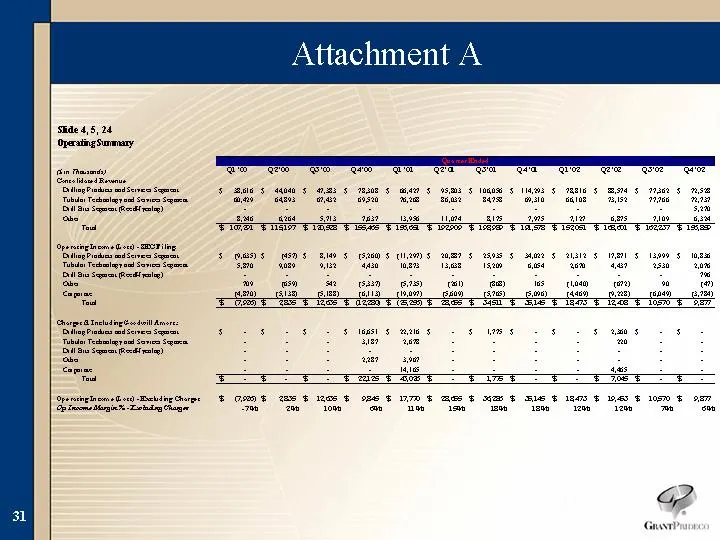
Cee ayaa Bite lgam asim Ecayriack soem ik a Tear $US) Fee Fes Fie toe EGS ESS Fe Fae FT ET fens Mens Rue § Gams cams mars es sou SALI Somes Le 5 we wey Sn itn iy cana sco Sse gee eae dee 6 fee ae gene Se tee eee te er i ee a i mgt St Rast mee MIDE mast Mat SUSE OSE NESE IOe E OE” @B Gast
Slide 32: Attachment A (continued)
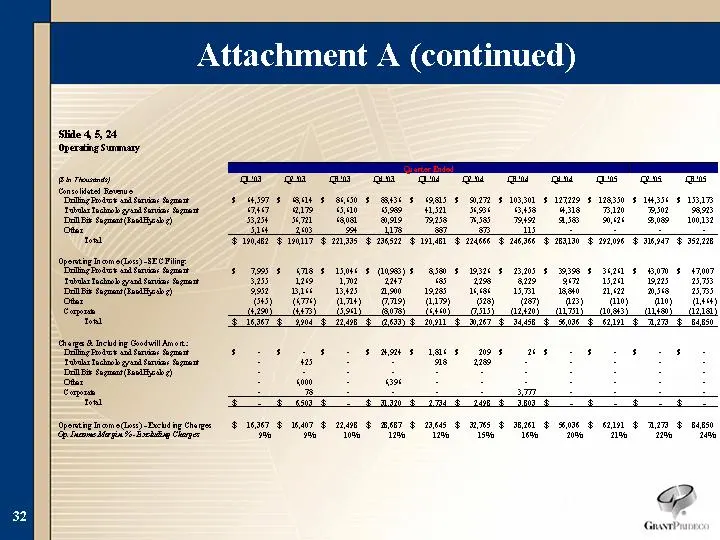
Attachment A (continued) Slide 5,24 Operating Senay sie r Ec : r r : hing ey a brine aaa $ aso 4s gals ans gine d |as s gam 4 man $Me sue # WaK s InIn ake ackok gratis Rome mia aim Gan Gem fan” Kae aise) wae mam” mann sae Dae frat Sa tm ek aay ue wit amt Rem ont Pinar FMT F Hise F Hes Fan GF Ao Fae
Slide 33: ‘Slide21
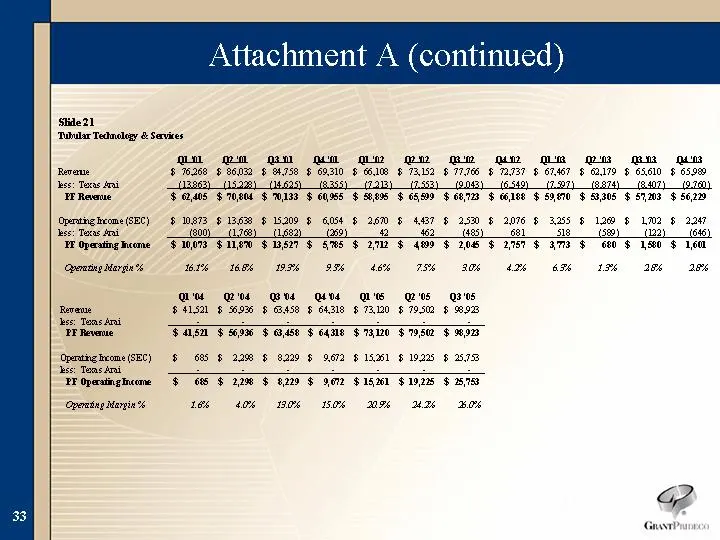
‘Slide21 ‘Tula Tednaley & Services Opnting eam (SEC) Ie: Tene fri TF Oparaing Reome posing Marin % come (SEC) “iss Teas Ani TF Operating come Opening Margin #16268 $ B5NR $ SE $ 6NAI0 fF GIG F TAD $1776 $ MIT § 62467 $ AI § 65610 $6590 r 1 as 2 " 8 8) FaMs $r0V | WIT F CHS FEV F CHOY Foam F Else | S
Slide 34: Slide
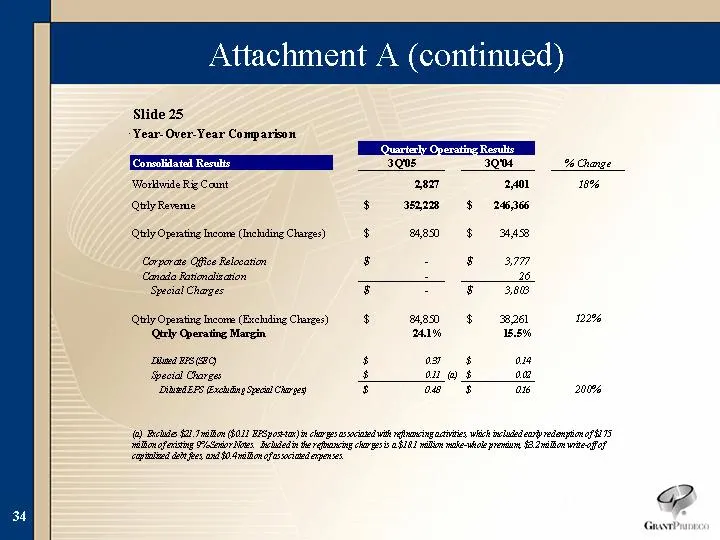
Slide 25 ‘Year-Over-Year Comparison %6 change Worllwide Rig Count 18% QblyReveme Qtrly Operating income (Inching Charges) $ men $M ASB Corporate Office Relocation $ 2 2 Bz Gada Faematrarion 26 Special Charges $ ~ oF 38B QhlyOpenting income (Exchiing Claes) «$= BD BDL nt ‘Qty Operating Margin 24% 155
Slide 35: EBITDA reconciliation
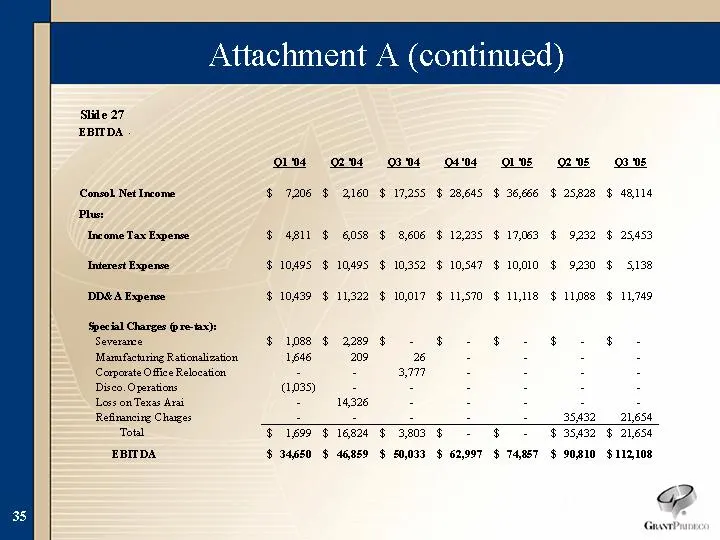
Slide 27 EBITDA Consol Net Income Plus: Income Tax Expence Corporate Office Relocation Disco. Operations inept Refizancing Chages Tol EBITDA O14 ons oo 4 $ 7206 $ 2160 $ 4pll $ g0s8 $ 10495 $ 19495 $ 10439 $ 11322 $ ines $ 2289 146209 ape = 14326 $ 17,255 8,606 10,352 o4'04 $ 23,645 $ 12,235 $ 10,54
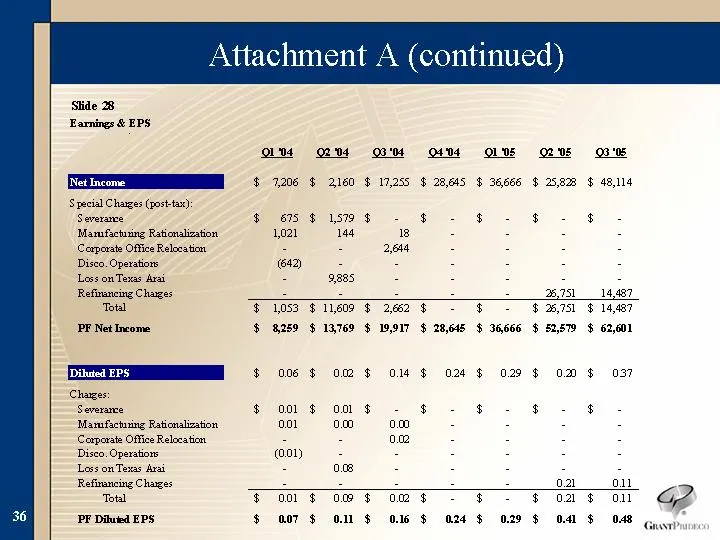
Slide 36: Attachment A (continued)
Attachment A (continued) Earnings & EPS Special Chases Got) Se Miarufacing Ratonaliction Carpets Office Relcaten Disco Operations Lots om Tex fining “Total “Charges “Sereramce | Mansfactning Rationalization Carperate Office Relocation Disco. Operations Lore on Texas Arai Refinancing Changes Total PF
Source: SEC EDGAR · 8-K filed Feb 1, 2006
More decks from Grant Prideco Inc
 Pritchard Capital Partners 2008 Energize Conference30 slides · Jan 8, 2008
 Lehman Brothers 19th Annual CEO Energy / Power Conference (September 2005)28 slides · Sep 7, 2005
 Debt Investor Presentation (July 2005)29 slides · Jul 13, 2005
 Credit Suisse First Boston 2005 Offshore Technology Conference Roundtable28 slides · May 3, 2005
 Credit Suisse First Boston Vail Energy Conference 200530 slides · Feb 1, 2005
 UBS Warburg 2004 Global Oil & Gas Conference19 slides · Jun 4, 2004