Dun & Bradstreet Holdings Inc.
Dun & Bradstreet — Q2 2020 Earnings Presentation
14 slides from Dun & Bradstreet's earnings presentation, Aug 6, 2020

Slide 1: Second Quarter 2020 Financial Results
Dun & Bradstreet SECOND QUARTER 2020 FINANCIAL RESULTS August 6, 2020
Slide 2: Disclaimer
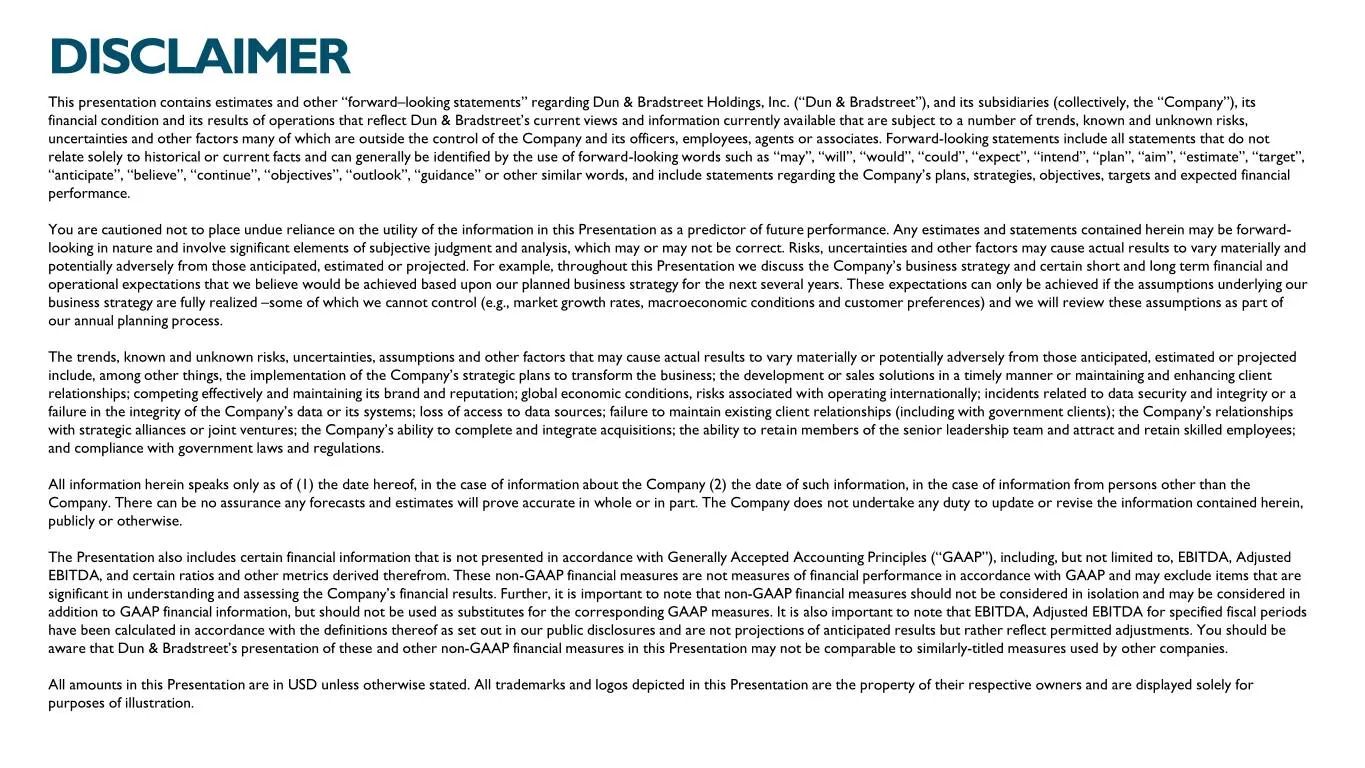
DISCLAIMER This presentation contains estimates and other “forward–looking statements” regarding Dun & Bradstreet Holdings, Inc. (“Dun & Bradstreet”), and its subsidiaries (collectively, the “Company”), its financial condition and its results of operations that reflect Dun & Bradstreet’s current vie
Slide 3: Financial Highlights (GAAP) Metrics Second Quarter 2020
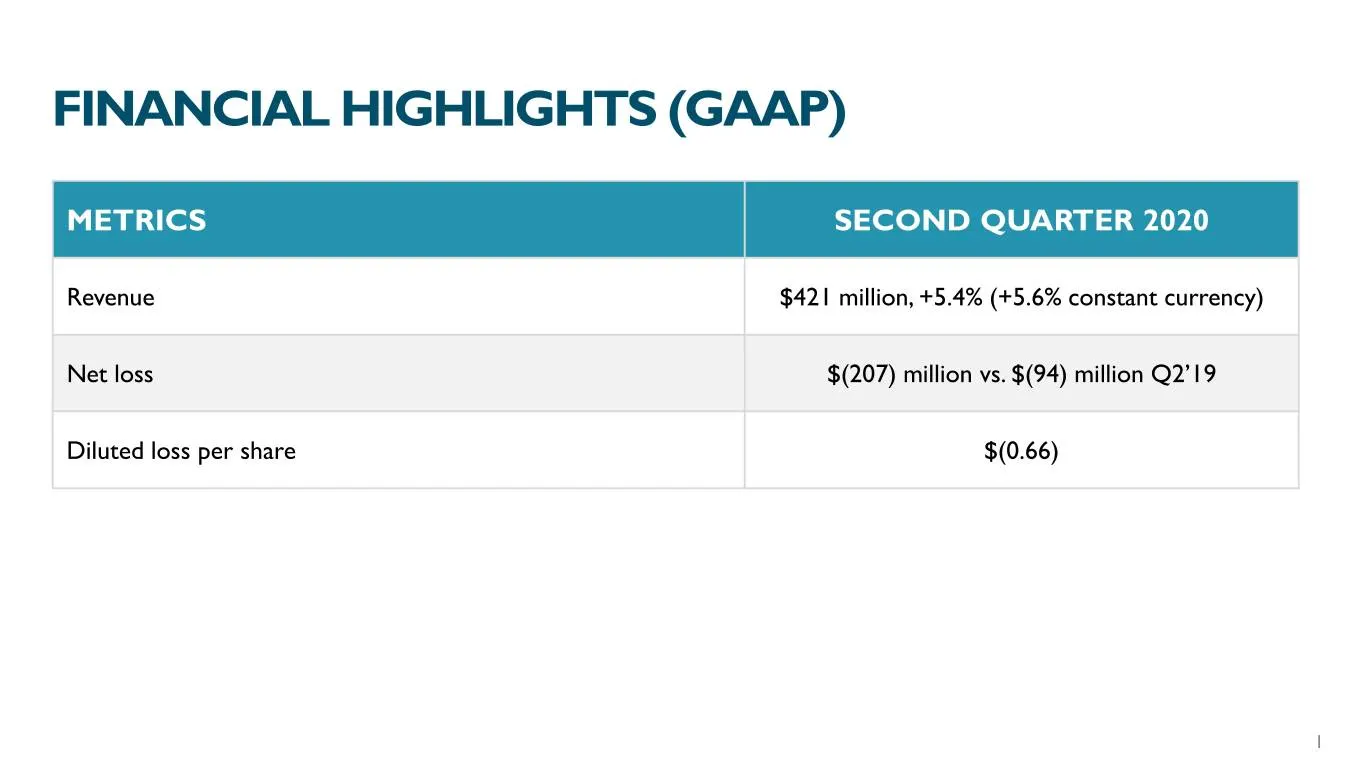
FINANCIAL HIGHLIGHTS (GAAP) METRICS SECOND QUARTER 2020 Revenue $421 million, +5.4% (+5.6% constant currency) Net loss $(207) million vs. $(94) million Q2’19 Diluted loss per share $(0.66) 1
Slide 4: Financial Highlights (Non-GAAP) Metrics Second Quarter 2020
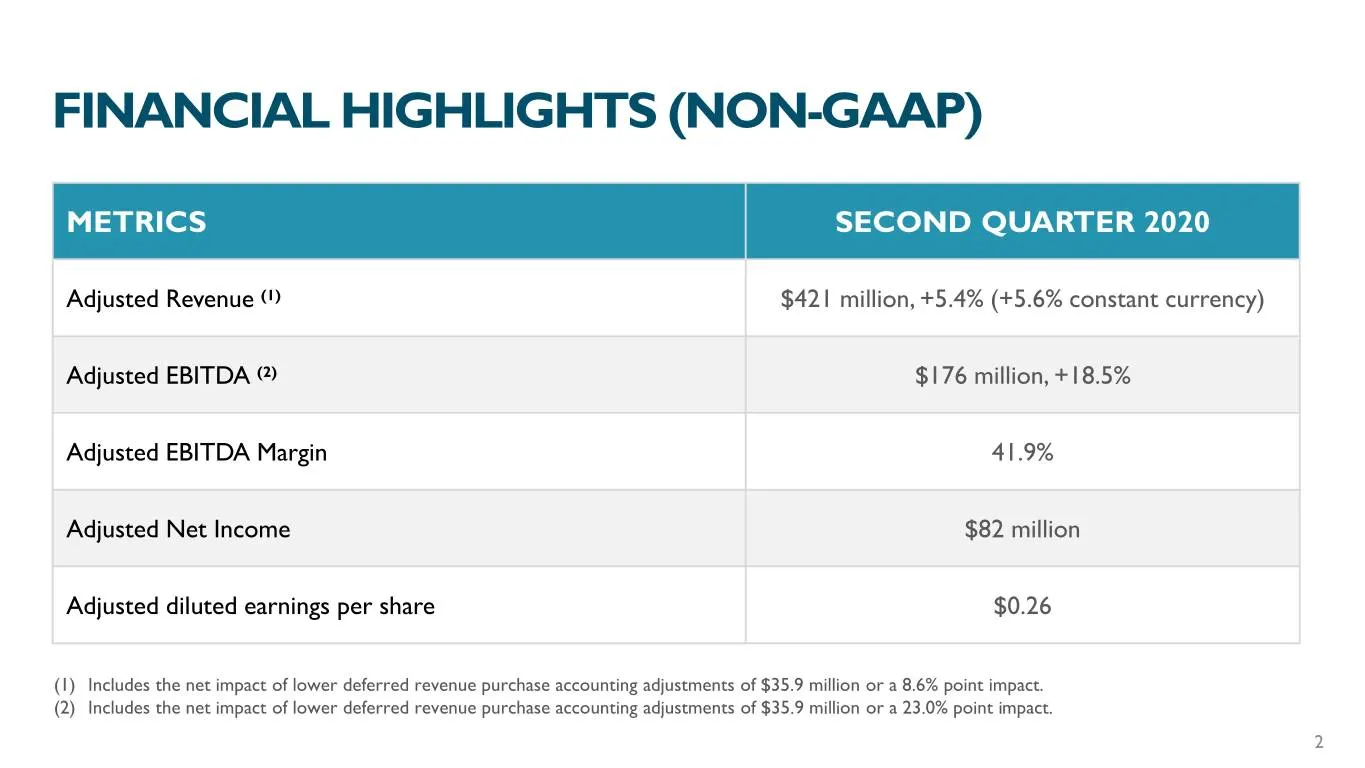
FINANCIAL HIGHLIGHTS (NON-GAAP) METRICS SECOND QUARTER 2020 Adjusted Revenue (1) $421 million, +5.4% (+5.6% constant currency) Adjusted EBITDA (2) $176 million, +18.5% Adjusted EBITDA Margin 41.9% Adjusted Net Income $82 million Adjusted diluted earnings per share $0.26 (1) Includes the net impact o
Slide 5: North America Revenue Second Quarter Highlights
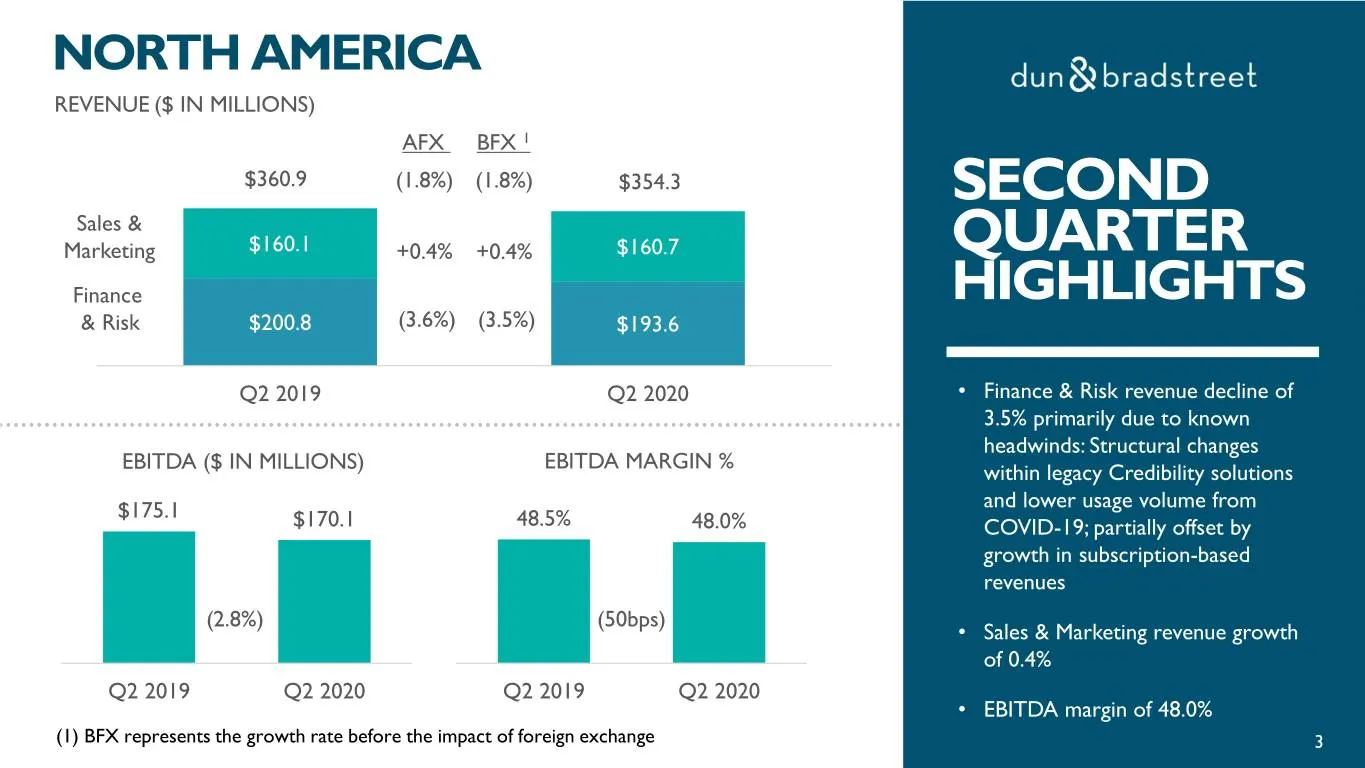
NORTH AMERICA REVENUE ($ IN MILLIONS) AFX BFX 1 $360.9 (1.8%) (1.8%) $354.3 SECOND Sales & Marketing $160.1 +0.4% +0.4% $160.7 QUARTER Finance HIGHLIGHTS & Risk $200.8 (3.6%) (3.5%) $193.6 Q2 2019 Q2 2020 • Finance & Risk revenue decline of 3.5% primarily due to known headwinds: Structural changes E
Slide 6: International Revenue Second Quarter Highlights
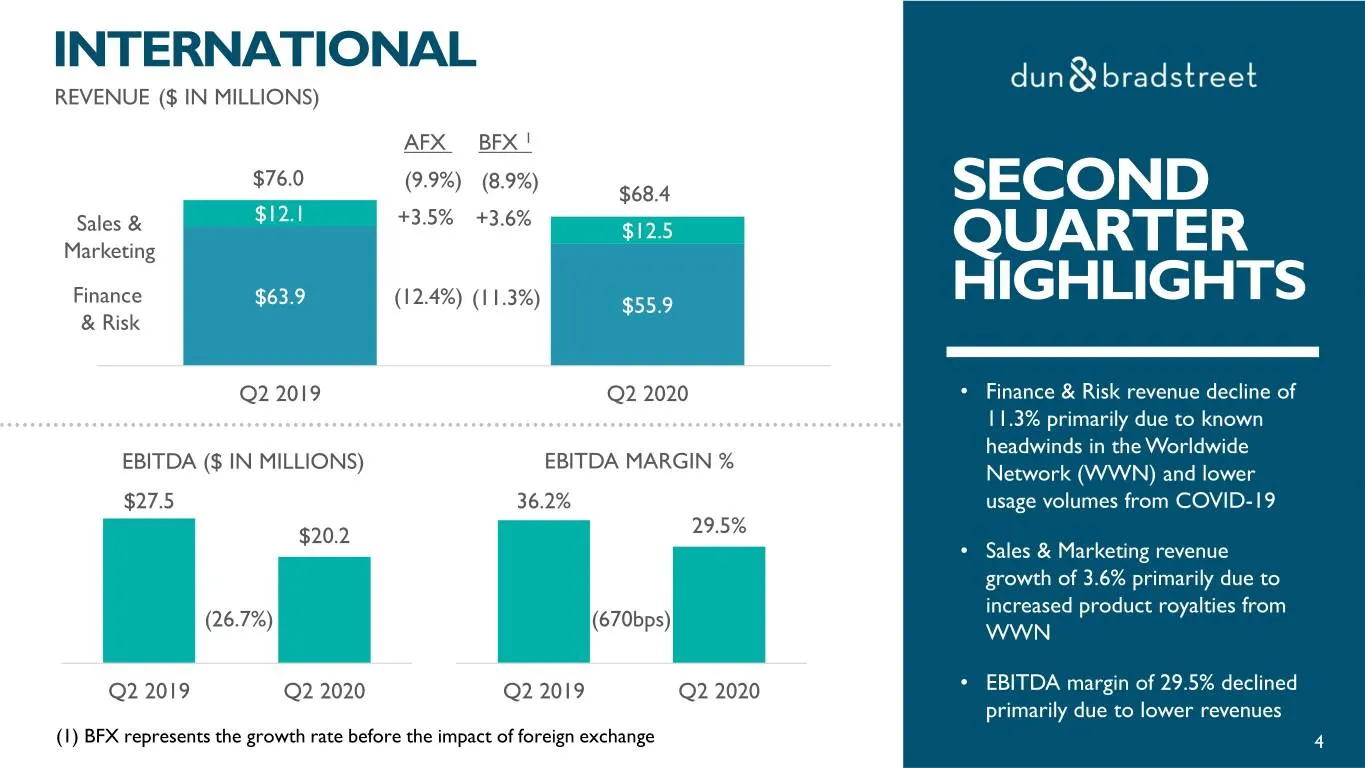
INTERNATIONAL REVENUE ($ IN MILLIONS) AFX BFX 1 $76.0 (9.9%) (8.9%) $68.4 SECOND $12.1 +3.5% +3.6% Sales & $12.5 Marketing QUARTER Finance $63.9 (12.4%) (11.3%) $55.9 HIGHLIGHTS & Risk Q2 2019 Q2 2020 • Finance & Risk revenue decline of 11.3% primarily due to known headwinds in the Worldwide EBITDA
Slide 7: Debt Summary June 30, 2020
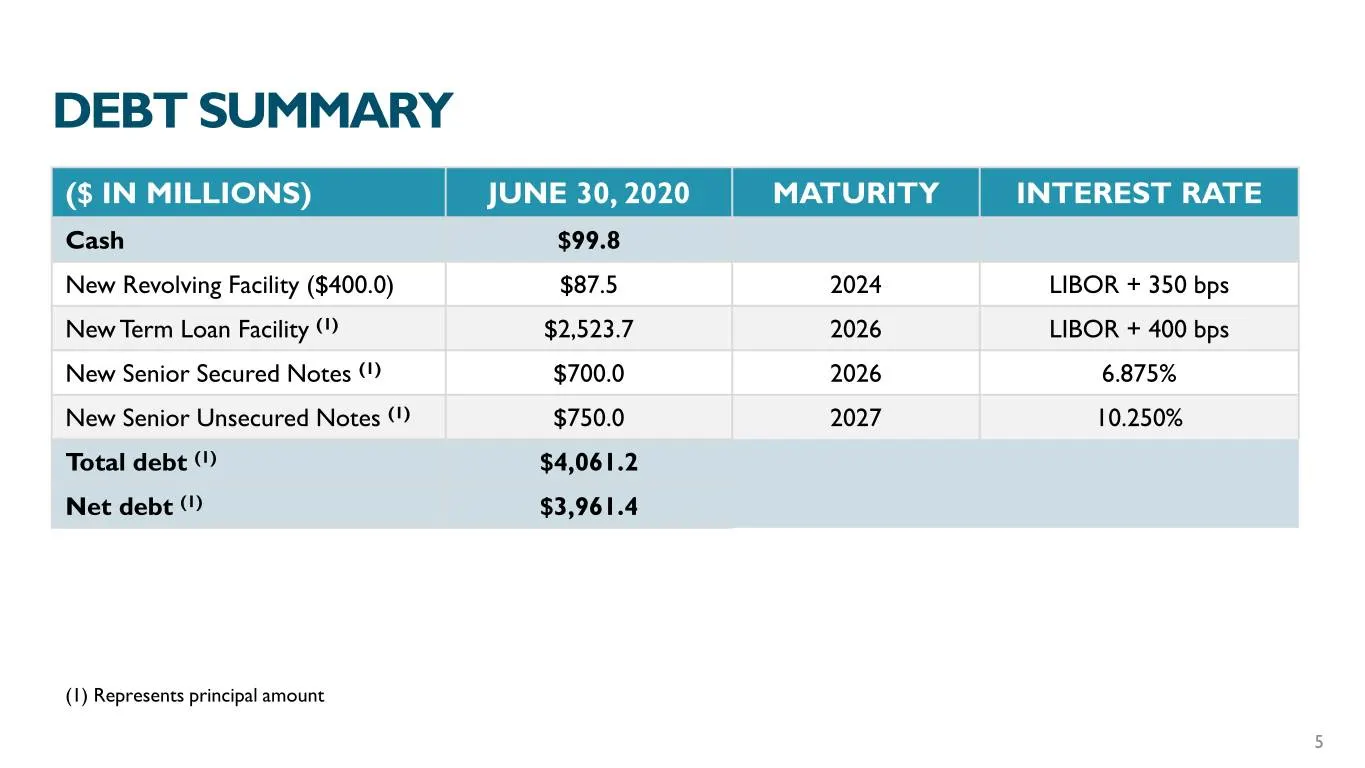
DEBT SUMMARY ($ IN MILLIONS) JUNE 30, 2020 MATURITY INTEREST RATE Cash $99.8 New Revolving Facility ($400.0) $87.5 2024 LIBOR + 350 bps New Term Loan Facility (1) $2,523.7 2026 LIBOR + 400 bps New Senior Secured Notes (1) $700.0 2026 6.875% New Senior Unsecured Notes (1) $750.0 2027 10.250% Total de
Slide 8: Full Year 2020 Financial Guidance
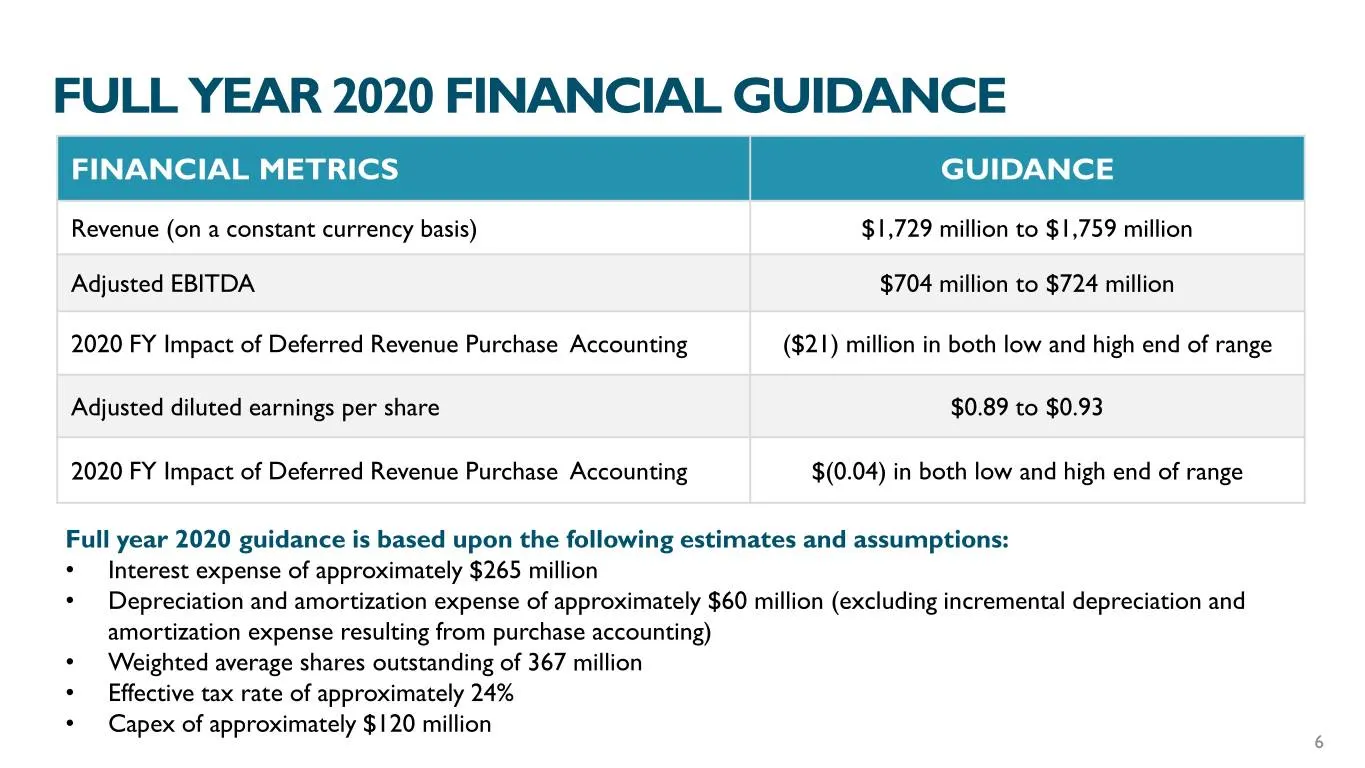
FULL YEAR 2020 FINANCIAL GUIDANCE FINANCIAL METRICS GUIDANCE Revenue (on a constant currency basis) $1,729 million to $1,759 million Adjusted EBITDA $704 million to $724 million 2020 FY Impact of Deferred Revenue Purchase Accounting ($21) million in both low and high end of range Adjusted diluted ea

Slide 9: Appendix
dun & bradstreet APPENDIX ©.
Slide 10: Financial Measures
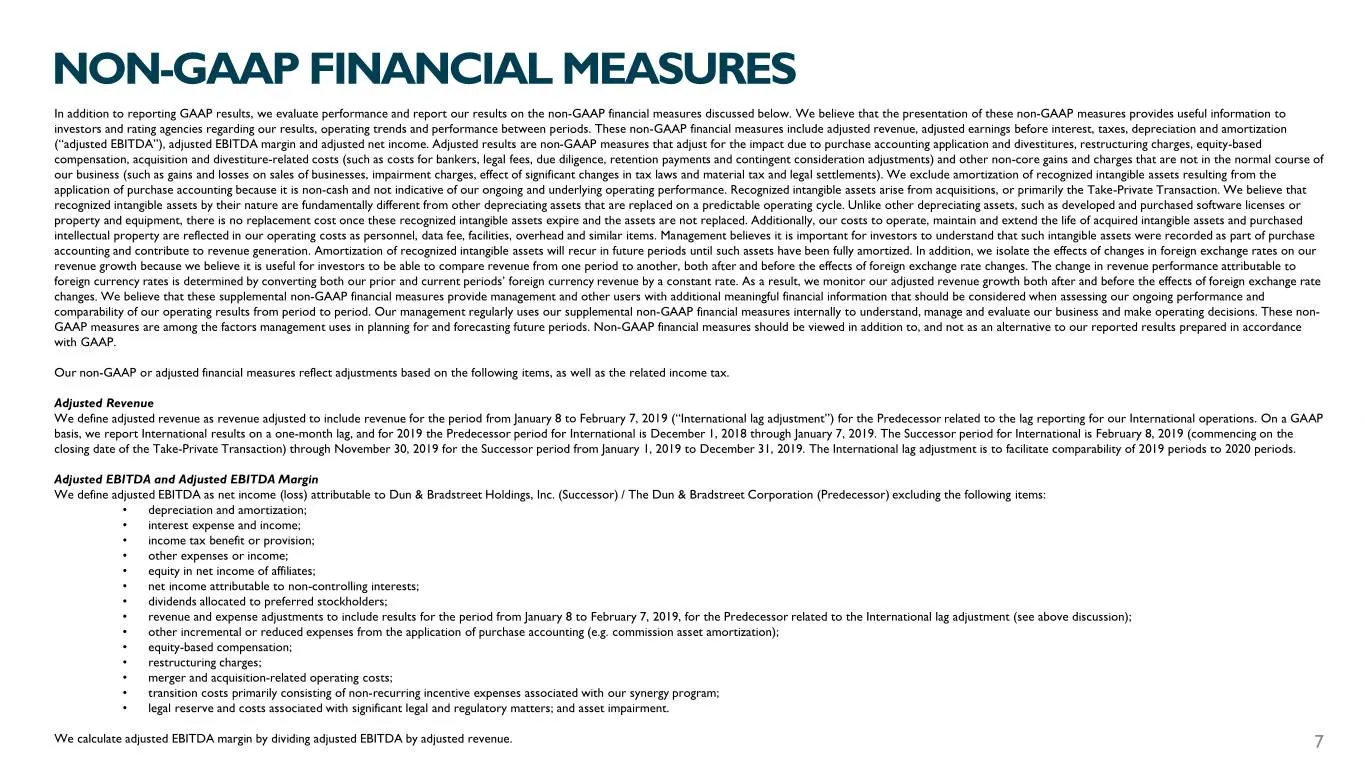
NON-GAAP FINANCIAL MEASURES In addition to reporting GAAP results, we evaluate performance and report our results on the non-GAAP financial measures discussed below. We believe that the presentation of these non-GAAP measures provides useful information to investors and rating agencies regarding our
Slide 11: Financial Measures (Continued)
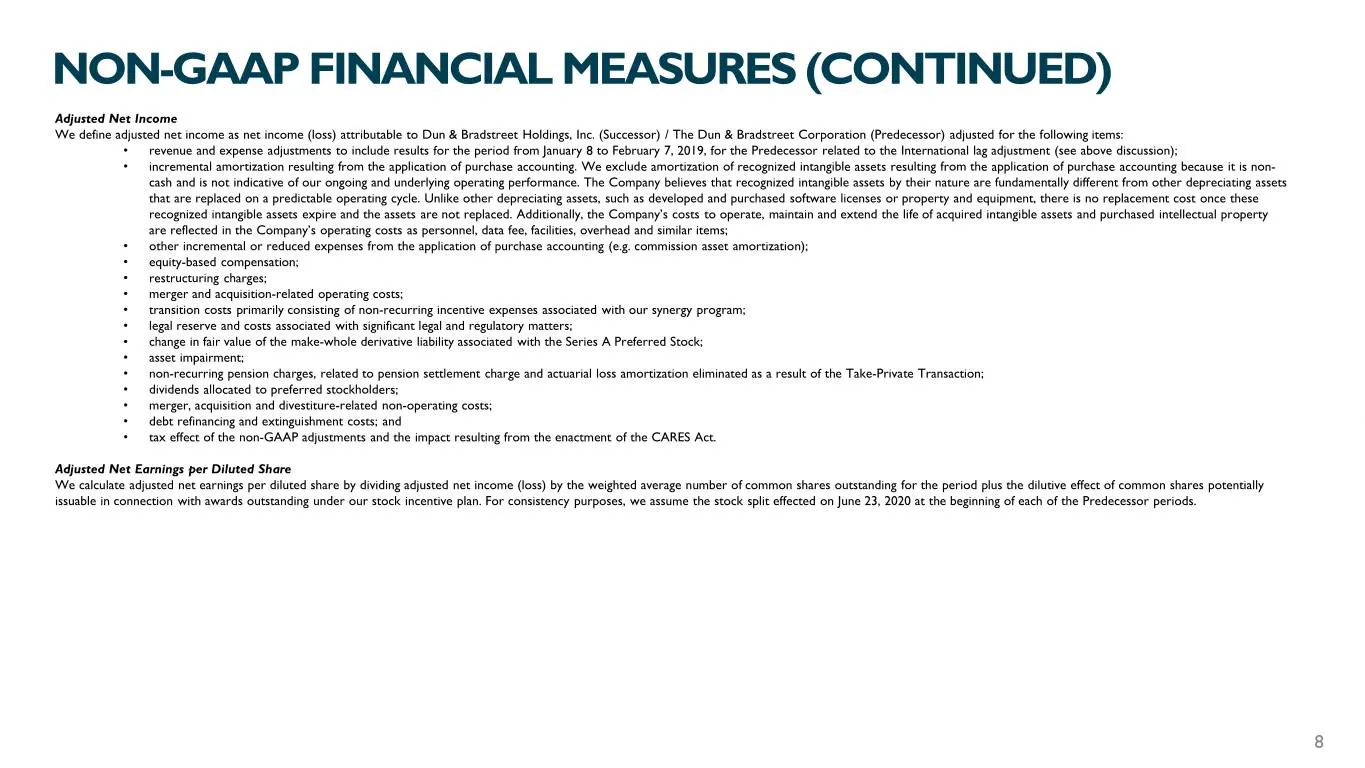
NON-GAAP FINANCIAL MEASURES (CONTINUED) Adjusted Net Income We define adjusted net income as net income (loss) attributable to Dun & Bradstreet Holdings, Inc. (Successor) / The Dun & Bradstreet Corporation (Predecessor) adjusted for the following items: • revenue and expense adjustments to include r
Slide 12: Reconciliation: Adjusted Revenue
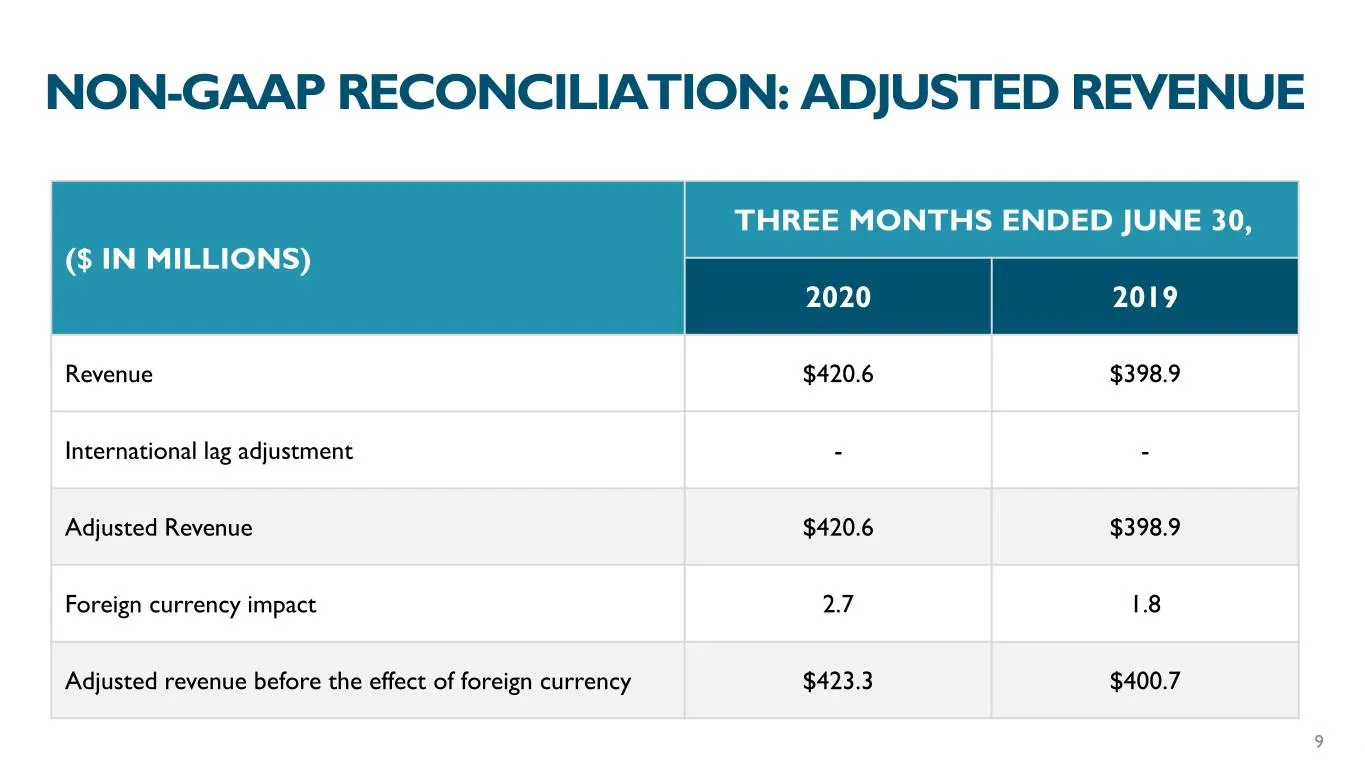
NON-GAAP RECONCILIATION: ADJUSTED REVENUE THREE MONTHS ENDED JUNE 30, ($ IN MILLIONS) 2020 2019 Revenue $420.6 $398.9 International lag adjustment - - Adjusted Revenue $420.6 $398.9 Foreign currency impact 2.7 1.8 Adjusted revenue before the effect of foreign currency $423.3 $400.7 9
Slide 13: Reconciliation: Adjusted EBITDA
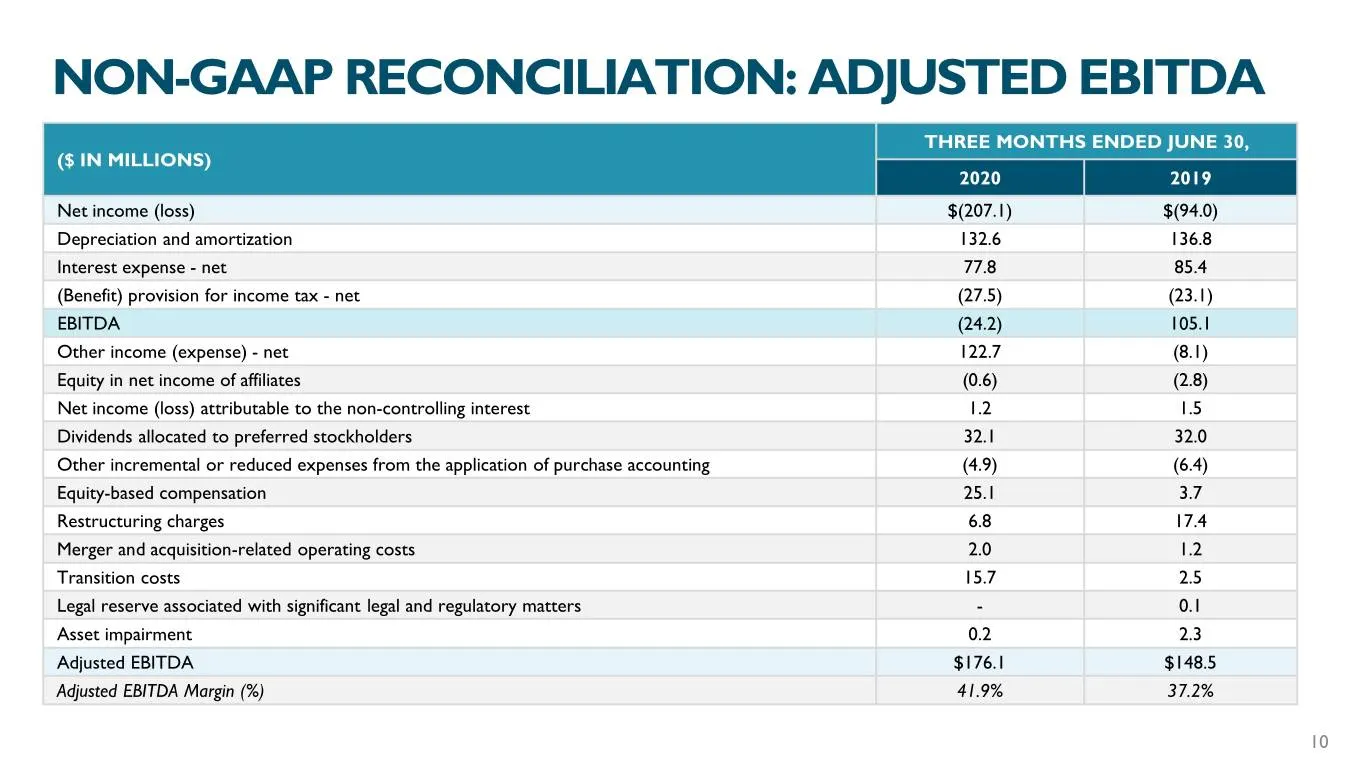
NON-GAAP RECONCILIATION: ADJUSTED EBITDA THREE MONTHS ENDED JUNE 30, ($ IN MILLIONS) 2020 2019 Net income (loss) $(207.1) $(94.0) Depreciation and amortization 132.6 136.8 Interest expense - net 77.8 85.4 (Benefit) provision for income tax - net (27.5) (23.1) EBITDA (24.2) 105.1 Other income (expens
Slide 14: Reconciliation: Adjusted Net Income
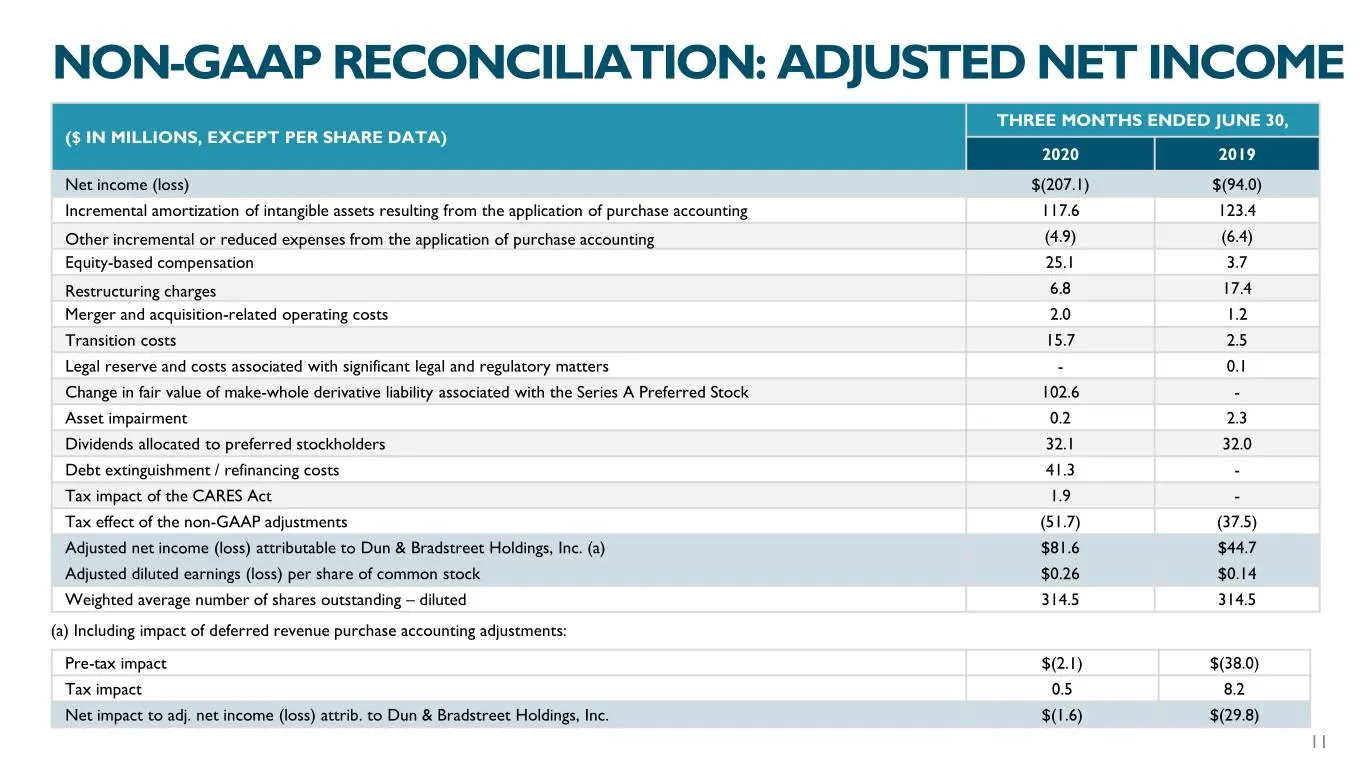
NON-GAAP RECONCILIATION: ADJUSTED NET INCOME THREE MONTHS ENDED JUNE 30, ($ IN MILLIONS, EXCEPT PER SHARE DATA) 2020 2019 Net income (loss) $(207.1) $(94.0) Incremental amortization of intangible assets resulting from the application of purchase accounting 117.6 123.4 Other incremental or reduced ex
Source: SEC EDGAR · 8-K filed Aug 6, 2020
More decks from Dun & Bradstreet Holdings Inc.
 Q1 2025 Earnings Presentation12 slides · May 1, 2025
 Q4 2024 Earnings Presentation15 slides · Feb 20, 2025
 Q3 2024 Earnings Presentation13 slides · Oct 31, 2024
 Q2 2024 Earnings Presentation13 slides · Aug 1, 2024
 Q1 2024 Earnings Presentation13 slides · May 2, 2024
 FY2023 Earnings Presentation16 slides · Feb 15, 2024