Markwest Energy Partners LP — Investor Presentation (November 2012)
38 slides from Markwest Energy Partners LP's investor presentation, Nov 14, 2012
Slide 1: Investor Presentation November 2012
Investor Presentation November 2012
Slide 2: Forward-Looking Statements
Forward-Looking Statements This presentation contains forward-looking statements and information. These forward-looking statements, which in many instances can be identified by words like “could,” “may,” “will,” “should,” “expects,” “plans,” “project,” “anticipates,” “believes,” “planned,” “proposed
Slide 3: Non-GAAP Measures
Non-GAAP Measures Distributable Cash Flow, Adjusted EBITDA, and Net Operating Margin are not measures of performance calculated in accordance with GAAP, and should not be considered separately from or as a substitute for net income, income from operations, or cash flow as reflected in our financial
Slide 4: Key Investment Considerations
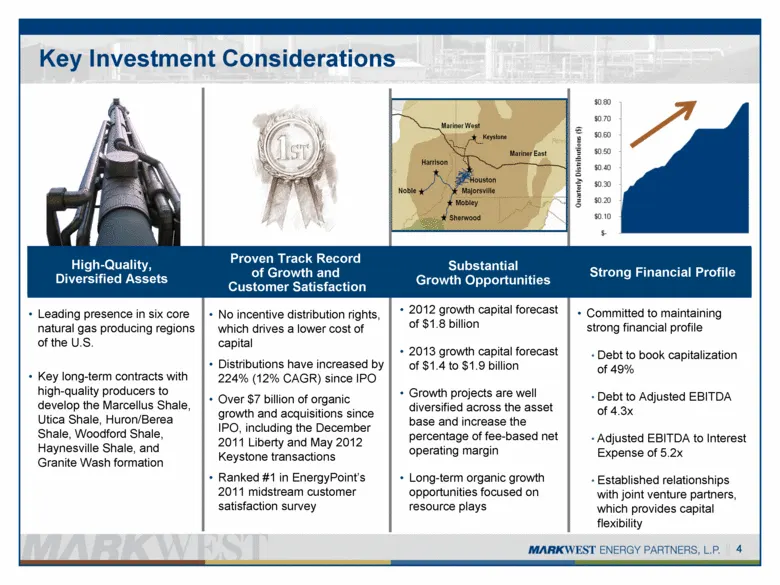
Keystone Key Investment Considerations High-Quality, Diversified Assets Proven Track Record of Growth and Customer Satisfaction Substantial Growth Opportunities Strong Financial Profile Leading presence in six core natural gas producing regions of the U.S. Key long-term contracts with high-quality p
Slide 5: MarkWest Operational Assets
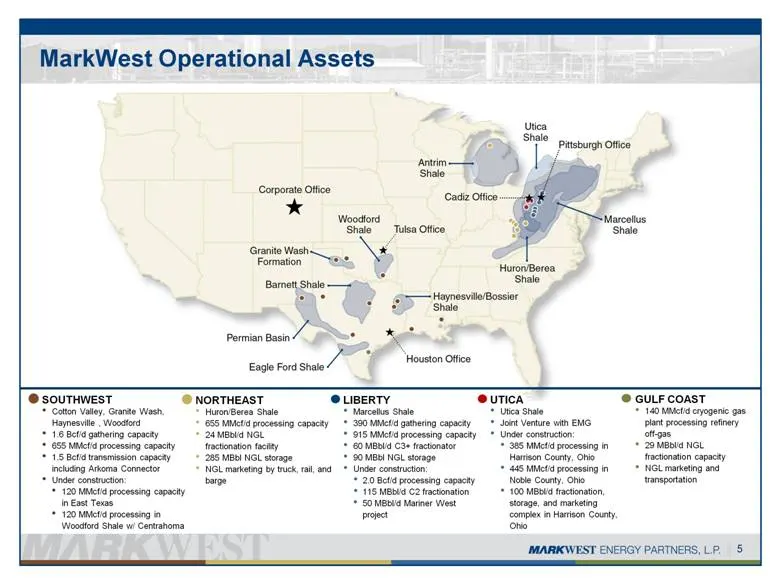
MarkWest Operational Assets LIBERTY Marcellus Shale 390 MMcf/d gathering capacity 915 MMcf/d processing capacity 60 MBbl/d C3+ fractionator 90 MBbl NGL storage Under construction: 2.0 Bcf/d processing capacity 115 MBbl/d C2 fractionation 50 MBbl/d Mariner West project GULF COAST 140 MMcf/d cryogenic
Slide 6: 2012 Forecasted Segment Operating Income
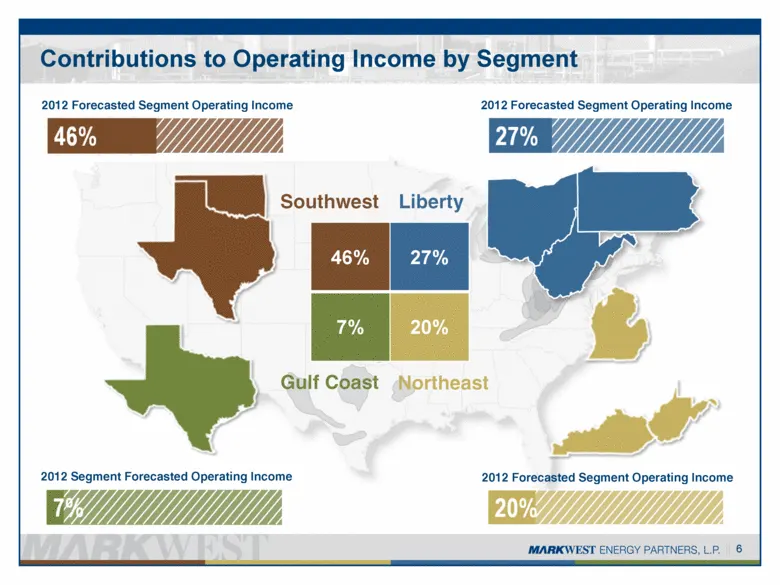
2012 Forecasted Segment Operating Income Contributions to Operating Income by Segment 6 2012 Forecasted Segment Operating Income 2012 Segment Forecasted Operating Income 2012 Forecasted Segment Operating Income 46% 27% 7% 20% Southwest Gulf Coast Northeast Liberty
Slide 7: US Shale Plays are Driving Natural Gas Supply
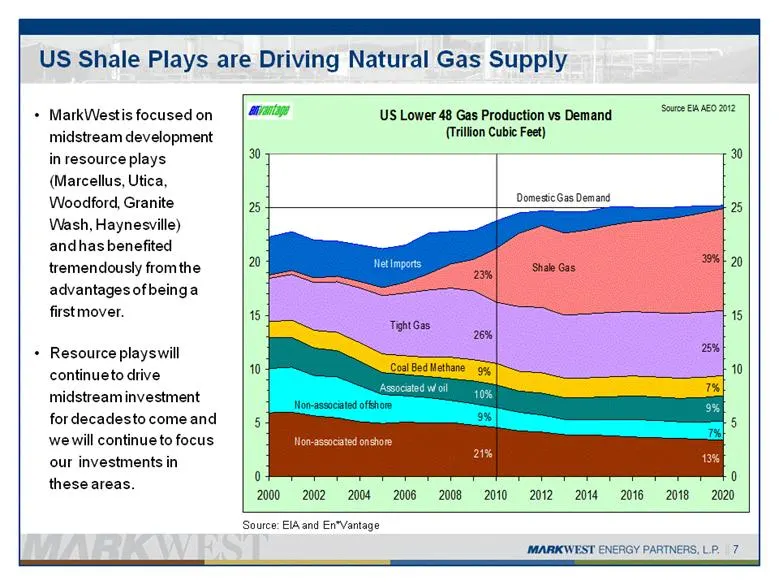
US Shale Plays are Driving Natural Gas Supply 7 Source: EIA and En*Vantage MarkWest is focused on midstream development in resource plays (Marcellus, Utica, Woodford, Granite Wash, Haynesville) and has benefited tremendously from the advantages of being a first mover. Resource plays will continue to
Slide 8: Commitment to Resource Plays
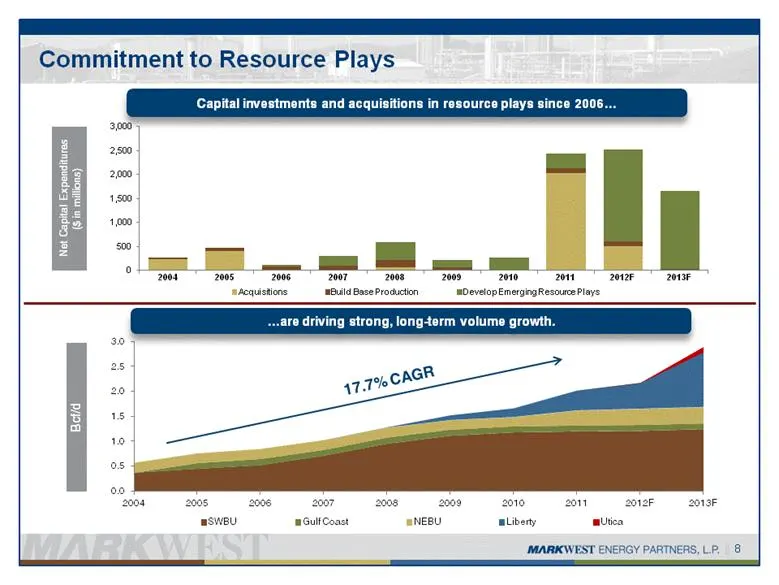
Emerging Resource Plays Base Production (Conventional / Tight Sand) Base Production (Conventional / Tight Sand) 8 Commitment to Resource Plays Capital investments and acquisitions in resource plays since 2006 are driving strong, long-term volume growth.
Slide 9: Growth Driven by Customer Satisfaction
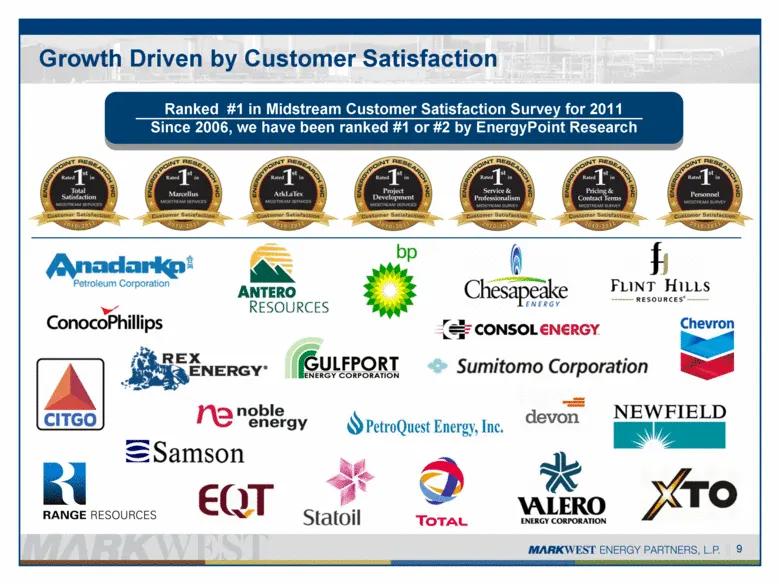
Growth Driven by Customer Satisfaction 9 Ranked #1 in Midstream Customer Satisfaction Survey for 2011 Since 2006, we have been ranked #1 or #2 by EnergyPoint Research
Slide 10: Southwest Segment
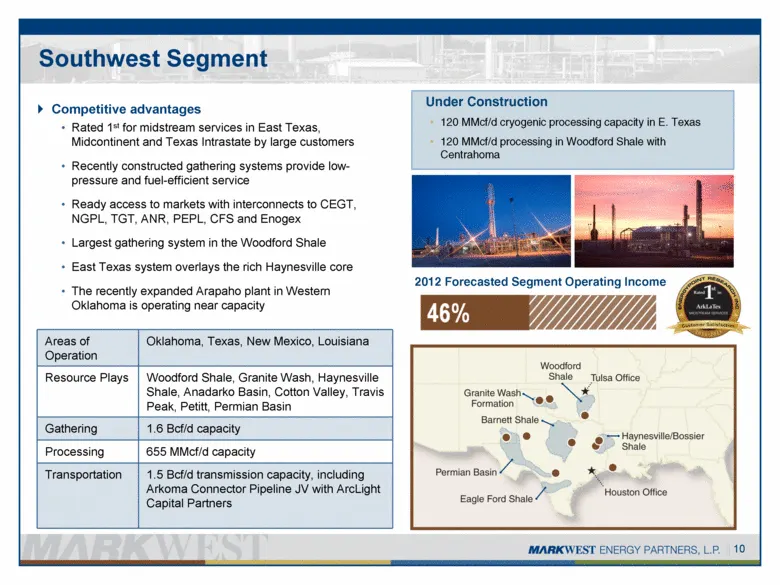
Southwest Segment Competitive advantages Rated 1st for midstream services in East Texas, Midcontinent and Texas Intrastate by large customers Recently constructed gathering systems provide low-pressure and fuel-efficient service Ready access to markets with interconnects to CEGT, NGPL, TGT, ANR, PEP
Slide 11: Gulf Coast Segment
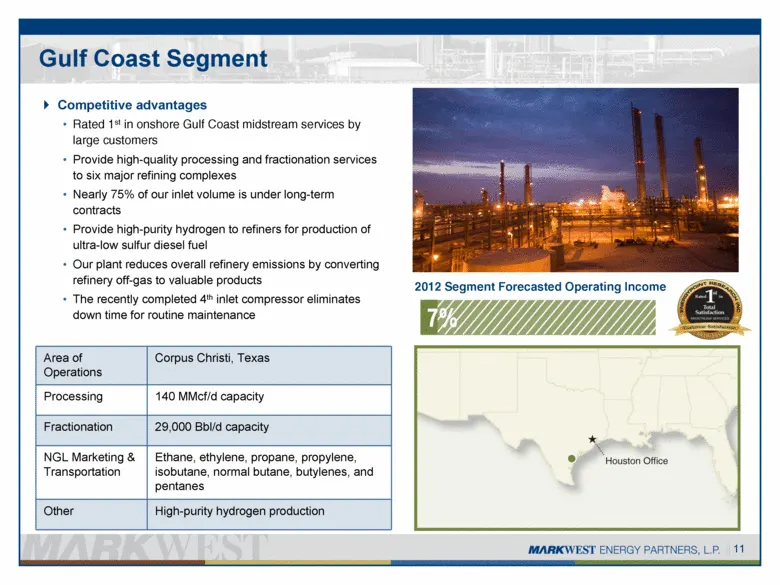
Gulf Coast Segment Competitive advantages Rated 1st in onshore Gulf Coast midstream services by large customers Provide high-quality processing and fractionation services to six major refining complexes Nearly 75% of our inlet volume is under long-term contracts Provide high-purity hydrogen to refin
Slide 12: Northeast Segment
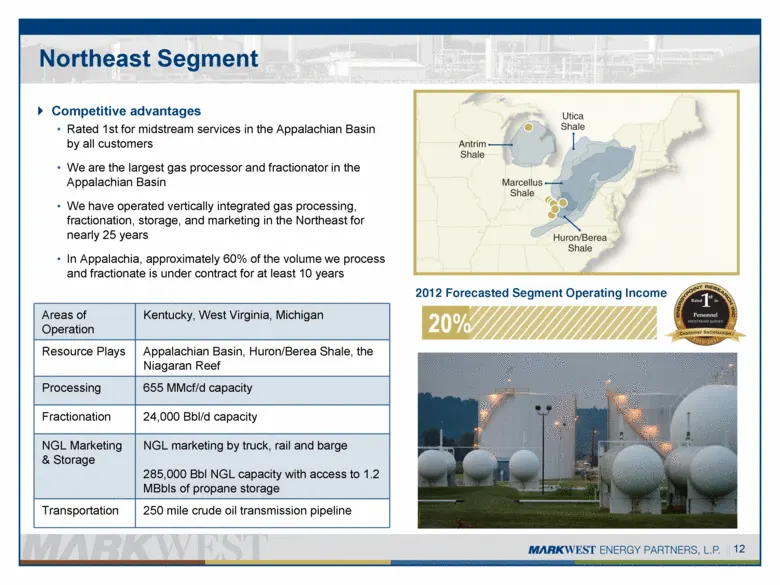
Northeast Segment Competitive advantages Rated 1st for midstream services in the Appalachian Basin by all customers We are the largest gas processor and fractionator in the Appalachian Basin We have operated vertically integrated gas processing, fractionation, storage, and marketing in the Northeast
Slide 13: Liberty Segment
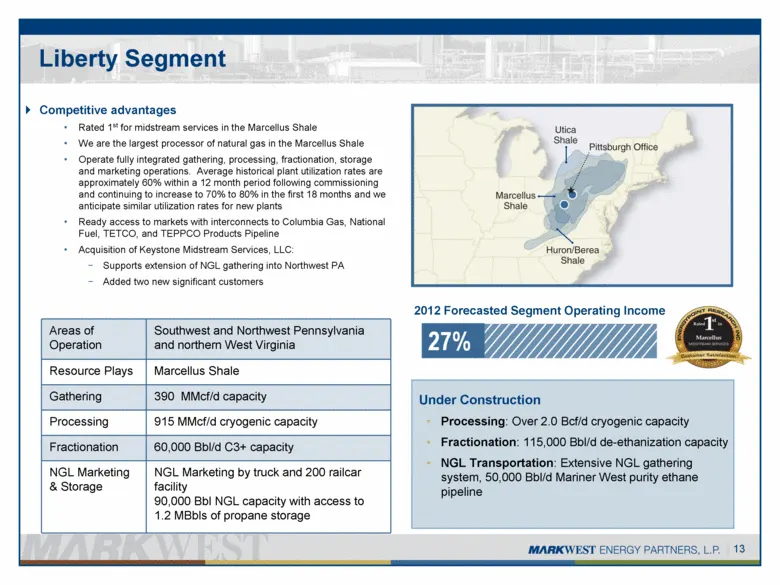
Liberty Segment Competitive advantages Rated 1st for midstream services in the Marcellus Shale We are the largest processor of natural gas in the Marcellus Shale Operate fully integrated gathering, processing, fractionation, storage and marketing operations. Average historical plant utilization rate
Slide 14: Liberty Processing Capacity
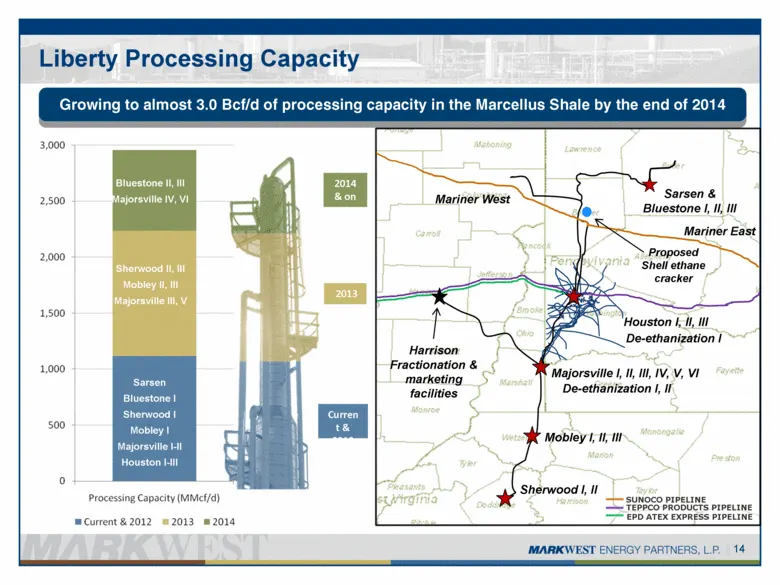
Liberty Processing Capacity 14 Growing to almost 3.0 Bcf/d of processing capacity in the Marcellus Shale by the end of 2014 TEPPCO PRODUCTS PIPELINE SUNOCO PIPELINE EPD ATEX EXPRESS PIPELINE Mariner West De-ethanization I Houston I, II, III De-ethanization I, II Majorsville I, II, III, IV, V, VI Sar
Slide 15: Liberty Project Schedule
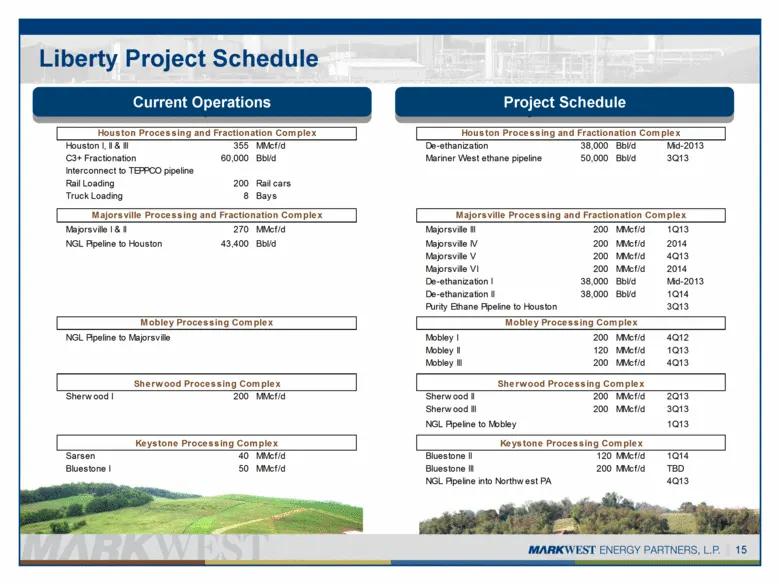
Liberty Project Schedule 15 Current Operations Project Schedule Houston I, II & III 355 MMcf/d De-ethanization 38,000 Bbl/d Mid-2013 C3+ Fractionation 60,000 Bbl/d Mariner West ethane pipeline 50,000 Bbl/d 3Q13 Interconnect to TEPPCO pipeline Rail Loading 200 Rail cars Truck Loading 8 Bays Majorsvil
Slide 16: MarkWest Utica EMG
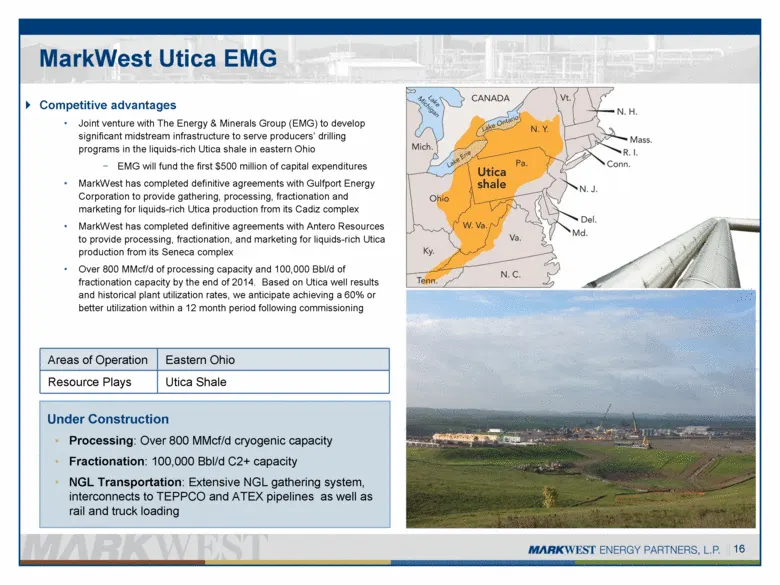
MarkWest Utica EMG Competitive advantages Joint venture with The Energy & Minerals Group (EMG) to develop significant midstream infrastructure to serve producers’ drilling programs in the liquids-rich Utica shale in eastern Ohio EMG will fund the first $500 million of capital expenditures MarkWest h
Slide 17: Utica Shale Summary
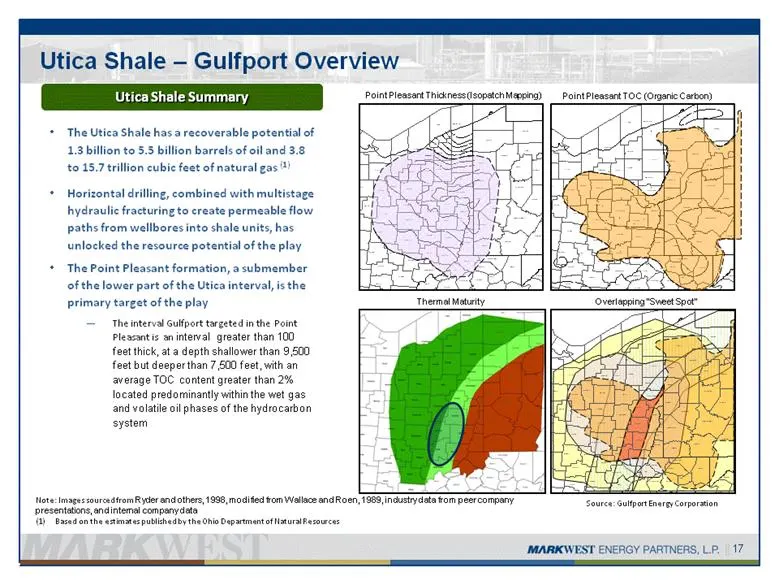
17 The Utica Shale has a recoverable potential of 1.3 billion to 5.5 billion barrels of oil and 3.8 to 15.7 trillion cubic feet of natural gas (1) Horizontal drilling, combined with multistage hydraulic fracturing to create permeable flow paths from wellbores into shale units, has unlocked the resou
Slide 18: Utica Shale Asset Overview and 2012 Activities
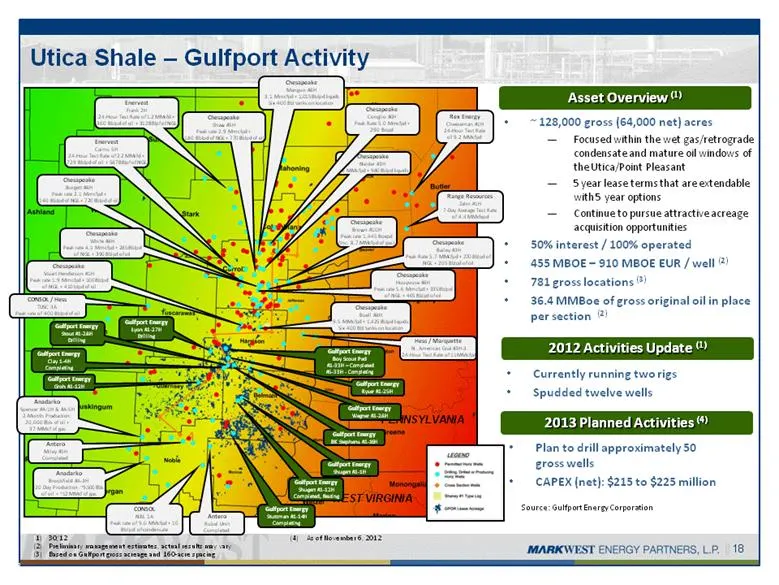
18 ~ 128,000 gross (64,000 net) acres Focused within the wet gas/retrograde condensate and mature oil windows of the Utica/Point Pleasant 5 year lease terms that are extendable with 5 year options Continue to pursue attractive acreage acquisition opportunities 50% interest / 100% operated 455 MBOE –
Slide 19: Utica Shale – Gulfport – Summary of Wells
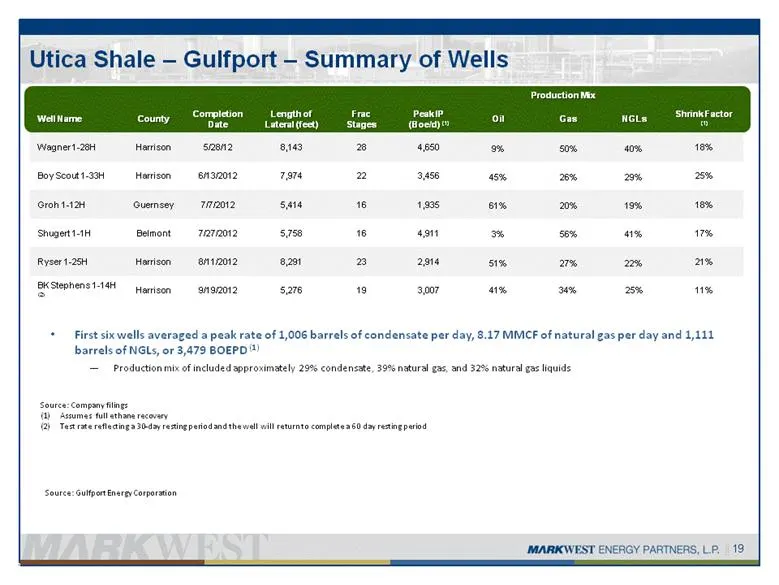
Production Mix Well Name County Completion Date Length of Lateral (feet) Frac Stages Peak IP (Boe/d) (1) Oil Gas NGLs Shrink Factor (1) Wagner 1-28H Harrison 5/28/12 8,143 28 4,650 9% 50% 40% 18% Boy Scout 1-33H Harrison 6/13/2012 7,974 22 3,456 45% 26% 29% 25% Groh 1-12H Guernsey 7/7/2012 5,414 16
Slide 20: Utica Shale – Antero Activity Summary
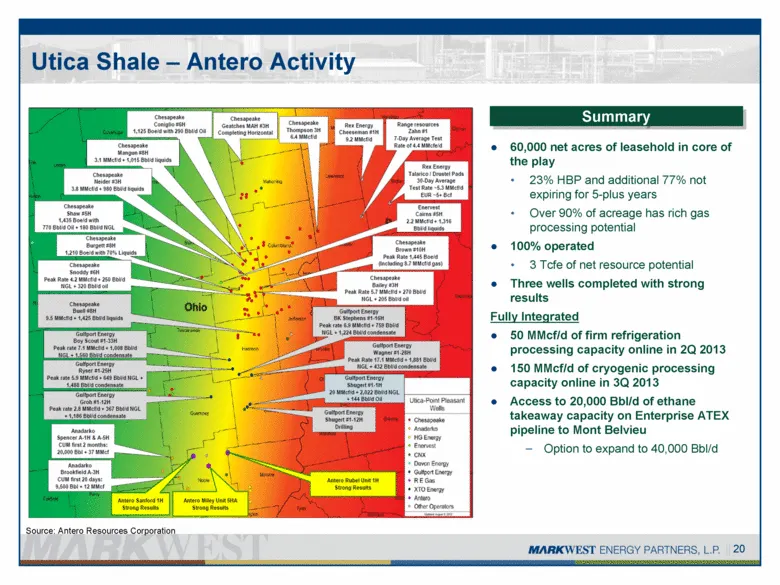
60,000 net acres of leasehold in core of the play 23% HBP and additional 77% not expiring for 5-plus years Over 90% of acreage has rich gas processing potential 100% operated 3 Tcfe of net resource potential Three wells completed with strong results Fully Integrated 50 MMcf/d of firm refrigeration p
Slide 21: Utica Processing Capacity
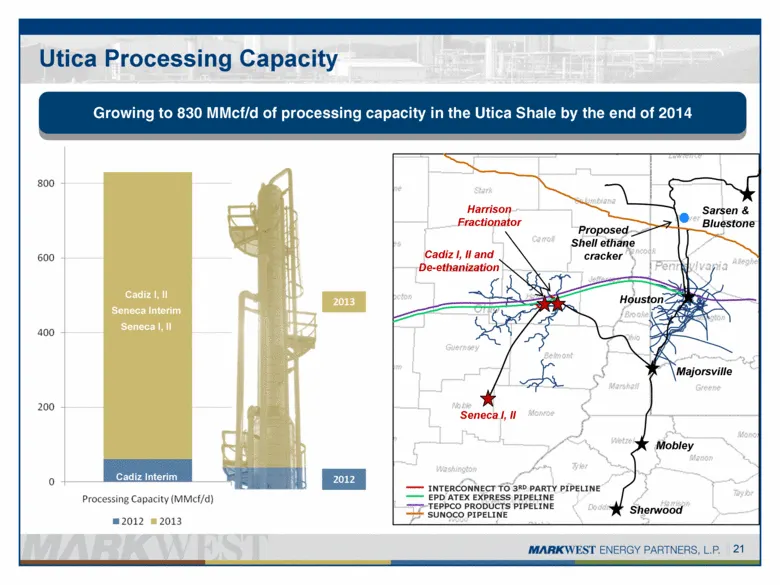
Utica Processing Capacity 21 Growing to 830 MMcf/d of processing capacity in the Utica Shale by the end of 2014 Mobley Sherwood Houston Majorsville Seneca I, II Harrison Fractionator Proposed Shell ethane cracker TEPPCO PRODUCTS PIPELINE EPD ATEX EXPRESS PIPELINE Sarsen & Bluestone INTERCONNECT TO 3
Slide 22: MarkWest EMG Utica JV Project Schedule
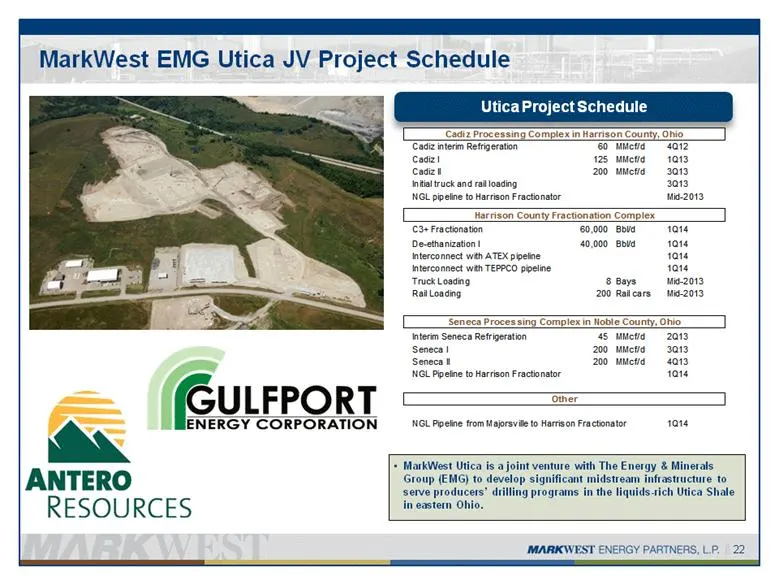
MarkWest EMG Utica JV Project Schedule 22 Utica Project Schedule MarkWest Utica is a joint venture with The Energy & Minerals Group (EMG) to develop significant midstream infrastructure to serve producers’ drilling programs in the liquids-rich Utica Shale in eastern Ohio. Cadiz interim Refrigeration
Slide 23: Breaking Ground in Cadiz
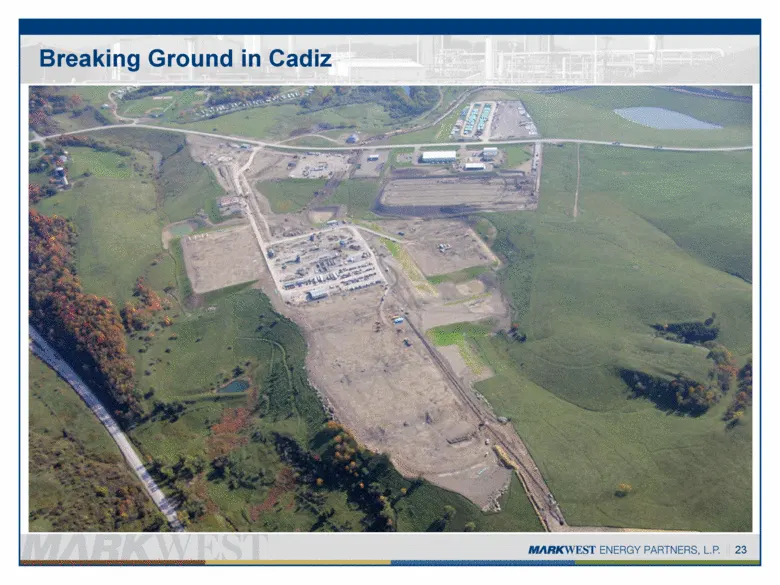
Breaking Ground in Cadiz MARKWEST ENERGY PARTNERS, LP. 23
Slide 24: Breaking Ground in Cadiz
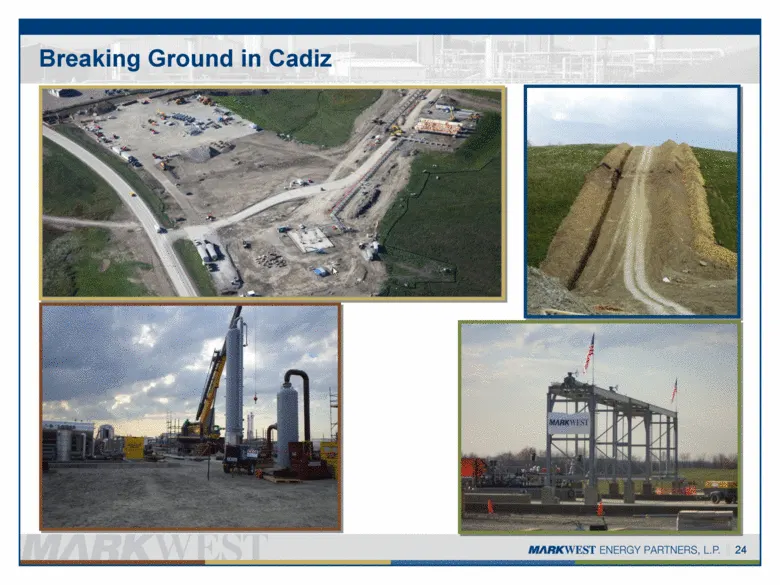
Breaking Ground in Cadiz MARKWEST ENERGY PARTNERS, LP. 24
Slide 25: Marcellus & Utica Fractionation Capacity
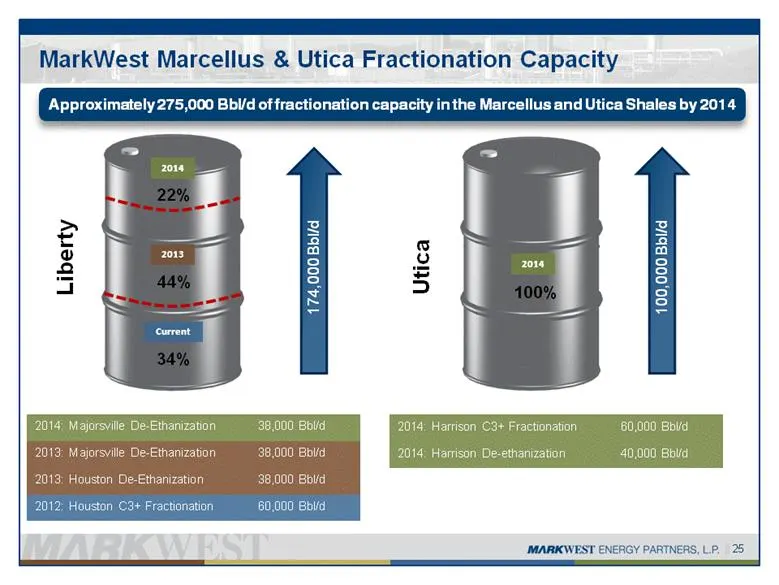
100% MarkWest Marcellus & Utica Fractionation Capacity 25 Approximately 275,000 Bbl/d of fractionation capacity in the Marcellus and Utica Shales by 2014 2014 2013 Current 2014: Majorsville De-Ethanization 38,000 Bbl/d 2013: Majorsville De-Ethanization 38,000 Bbl/d 2013: Houston De-Ethanization 38,0
Slide 26: Innovative Midstream Solutions
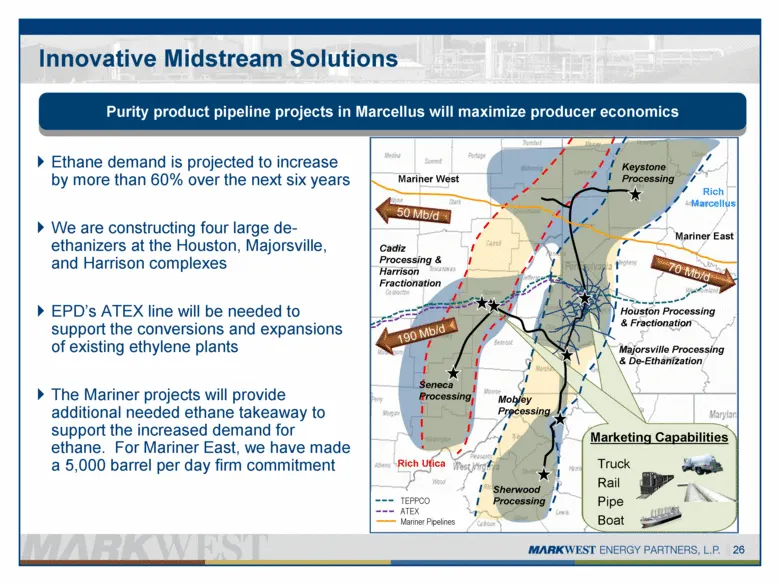
Innovative Midstream Solutions Ethane demand is projected to increase by more than 60% over the next six years We are constructing four large de-ethanizers at the Houston, Majorsville, and Harrison complexes EPD’s ATEX line will be needed to support the conversions and expansions of existing ethylen
Slide 27: Financial Overview
FINANCIAL OVERVIEW (MARKWEST ENERGY PARTNERS, LP.
Slide 28: DCF and Capital Guidance
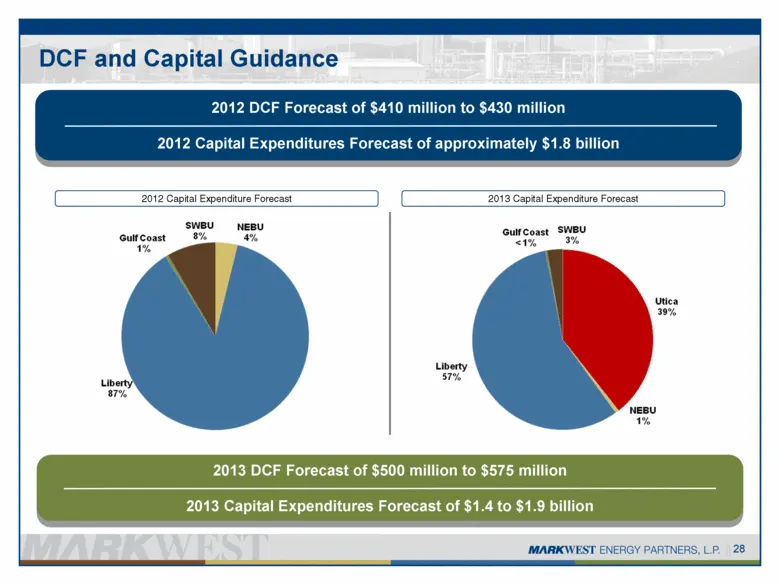
DCF and Capital Guidance 28 2012 DCF Forecast of $410 million to $430 million 2012 Capital Expenditures Forecast of approximately $1.8 billion 2013 DCF Forecast of $500 million to $575 million 2013 Capital Expenditures Forecast of $1.4 to $1.9 billion 2012 Capital Expenditure Forecast 2013 Capital E
Slide 29: Cost of Equity Capital
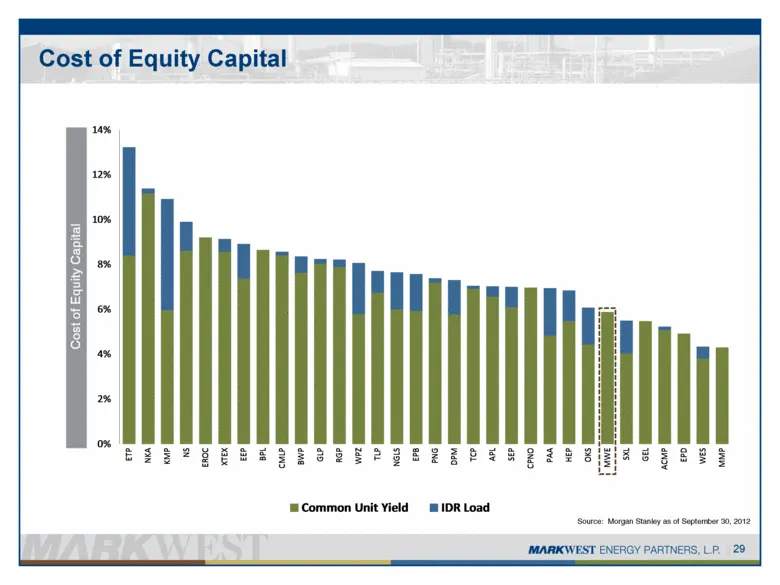
Cost of Equity Capital Source: Morgan Stanley as of September 30, 2012 29 0% 2% 4% 6% 8% 10% 12% 14% ETP NKA KMP NS EROC XTEX EEP BPL CMLP BWP GLP RGP WPZ TLP NGLS EPB PNG DPM TCP APL SEP CPNO PAA HEP OKS MWE SXL GEL ACMP EPD WES MMP Cost of Equity Capital Common Unit Yield IDR Load
Slide 30: Strong Distribution Growth and Unit Performance
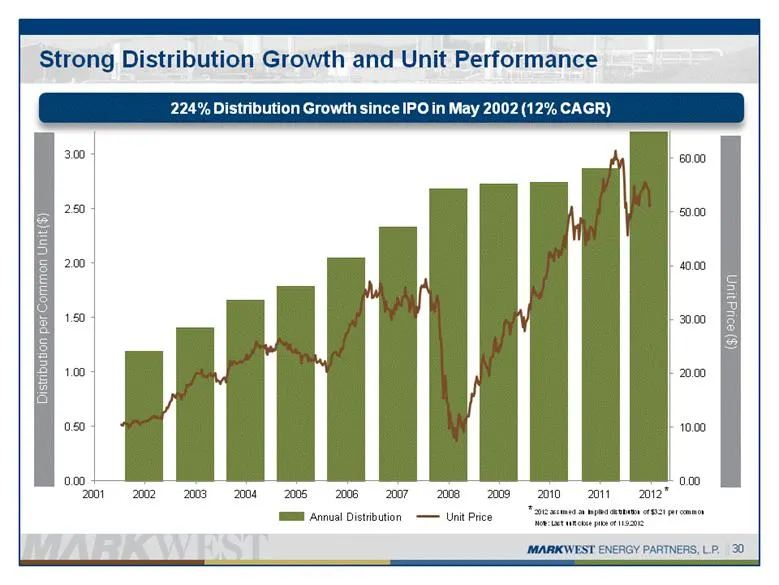
Strong Distribution Growth and Unit Performance 224% Distribution Growth since IPO in May 2002 (12% CAGR) * 2012 assumed an implied distribution of $3.21 per common Note: Last unit close price of 11.9.2012 30
Slide 31: Net Operating Margin by Contract Type and Hedging
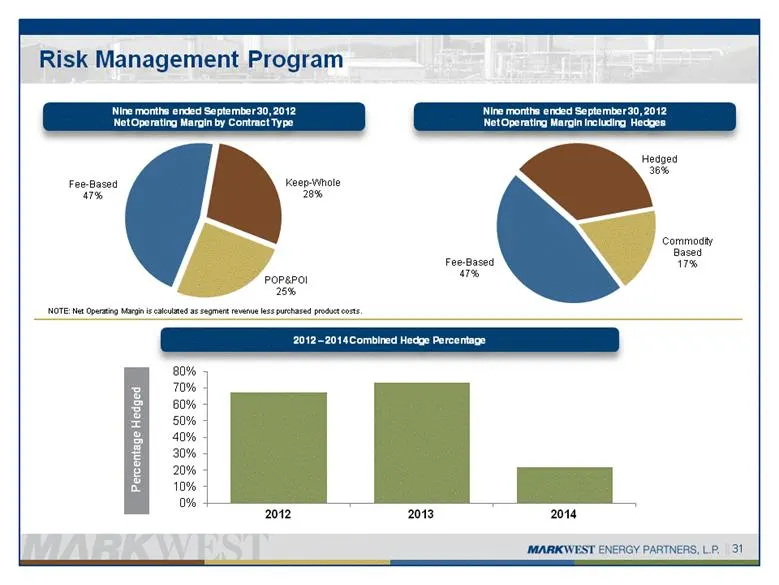
Nine months ended September 30, 2012 Net Operating Margin by Contract Type 2012 – 2014 Combined Hedge Percentage Risk Management Program NOTE: Net Operating Margin is calculated as segment revenue less purchased product costs. 31 Nine months ended September 30, 2012 Net Operating Margin Including He
Slide 32: Increasing Fee-Based Net Operating Margin
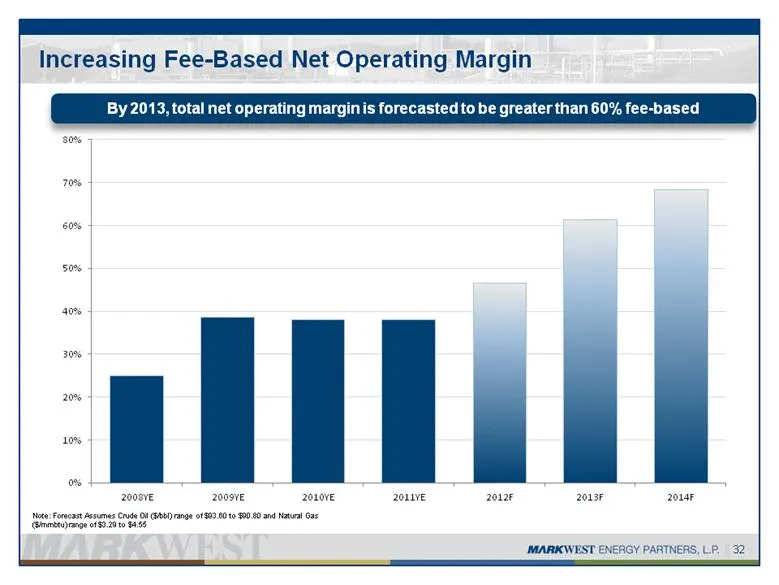
Increasing Fee-Based Net Operating Margin 32 Note: Forecast Assumes Crude Oil ($/bbl) range of $93.60 to $90.80 and Natural Gas ($/mmbtu) range of $3.29 to $4.55 By 2013, total net operating margin is forecasted to be greater than 60% fee-based
Slide 33: Keys to Success
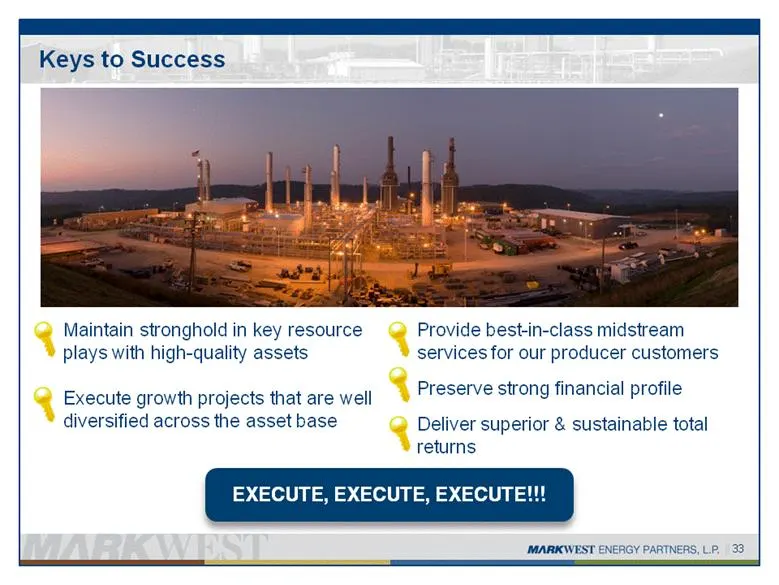
Keys to Success Maintain stronghold in key resource plays with high-quality assets Execute growth projects that are well diversified across the asset base 33 EXECUTE, EXECUTE, EXECUTE!!! Provide best-in-class midstream services for our producer customers Preserve strong financial profile Deliver sup
Slide 34: Appendix
APPENDIX MARKWEST ENERGY PARTNERS, LP.
Slide 35: Reconciliation of DCF and Distribution Coverage
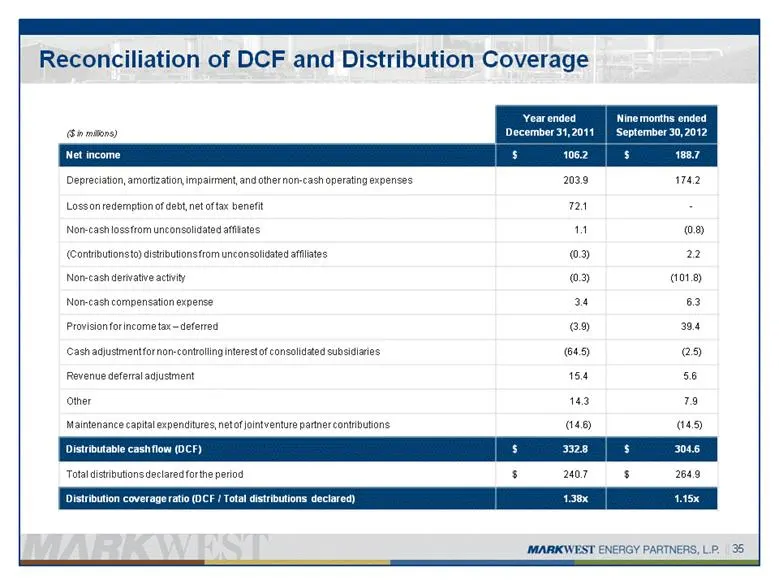
Reconciliation of DCF and Distribution Coverage ($ in millions) Year ended December 31, 2011 Nine months ended September 30, 2012 Net income $ 106.2 $ 188.7 Depreciation, amortization, impairment, and other non-cash operating expenses 203.9 174.2 Loss on redemption of debt, net of tax benefit 72.1 -
Slide 36: Reconciliation of Adjusted EBITDA
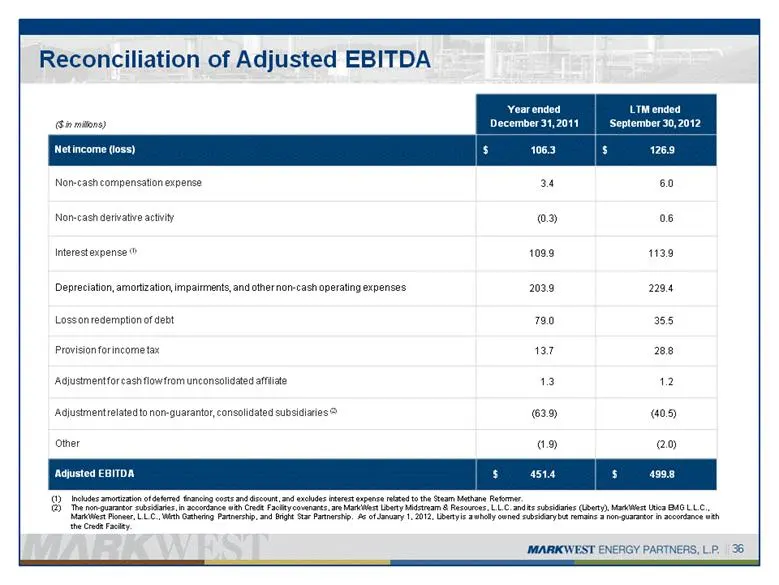
Reconciliation of Adjusted EBITDA ($ in millions) Year ended December 31, 2011 LTM ended September 30, 2012 Net income (loss) $ 106.3 $ 126.9 Non-cash compensation expense 3.4 6.0 Non-cash derivative activity (0.3) 0.6 Interest expense (1) 109.9 113.9 Depreciation, amortization, impairments, and oth
Slide 37: Reconciliation of Net Operating Margin
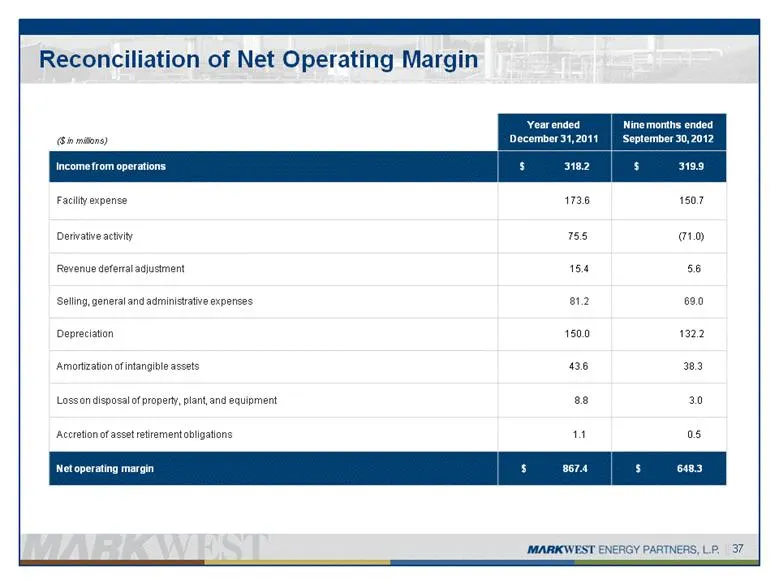
($ in millions) Year ended December 31, 2011 Nine months ended September 30, 2012 Income from operations $ 318.2 $ 319.9 Facility expense 173.6 150.7 Derivative activity 75.5 (71.0) Revenue deferral adjustment 15.4 5.6 Selling, general and administrative expenses 81.2 69.0 Depreciation 150.0 132.2 A
Slide 38: Contact details
1515 ARAPAHOE STREET TOWER 1, SUITE 1600 DENVER, COLORADO 80202 PHONE: 303-925-9200 INVESTOR RELATIONS: 866-858-0482 EMAIL: [email protected] WEBSITE: WWW.MARKWEST.COM
Source: SEC EDGAR · 8-K filed Nov 14, 2012
More decks from Markwest Energy Partners LP
 Fact Sheet (July 2017)1 slide · July 2017
 Fact Sheet (July 2017)1 slide · July 2017
 Fact Sheet (July 2017)1 slide · July 2017
 Markwest Energy Partners L P — Investor Day (December 2015)116 slides · Dec 3, 2015
 Merger or Acquisition (November 2015)17 slides · Nov 13, 2015
 Merger or Acquisition (November 2015)17 slides · Nov 12, 2015