Markwest Energy Partners LP — Merger or Acquisition (November 2015)
17 slides from Markwest Energy Partners LP's merger presentation, Nov 13, 2015
Slide 1: Investor Presentation November 12, 2015
INVESTOR PRESENTATION November 12, 2015
Slide 2: Non-GAAP Financial Measures / Forward-Looking Statements
NON-GAAP FINANCIAL MEASURES / FORWARD-LOOKING STATEMENTS 2 Mar kW est E n er g y Part n e rs , L .P . i s a mas te r l i m i te d part n e rs h i p t hat ow ns a n d o p erat e s m i d str e am s er v ice s r e lat e d b us i n es s es . Mar kW est has a lea d i n g pr e se nc e i n ma n y nat ura l
Slide 3: Additional Information
ADDITIONAL INFORMATION 3 Addit i o na l Informat i o n and Where to F ind I t T h is com m u n icat ion may b e d e e m e d to b e so l ic i tat io n mat e r ia l i n r e s p ect o f th e pro pos e d acq u is i t io n o f th e Part n er sh i p b y MPL X. I n co nn ect io n wit h t h e pro p ose d ac
Slide 4: MWE and MPLX – A Strategic Combination That Will Deliver Enhanced Value
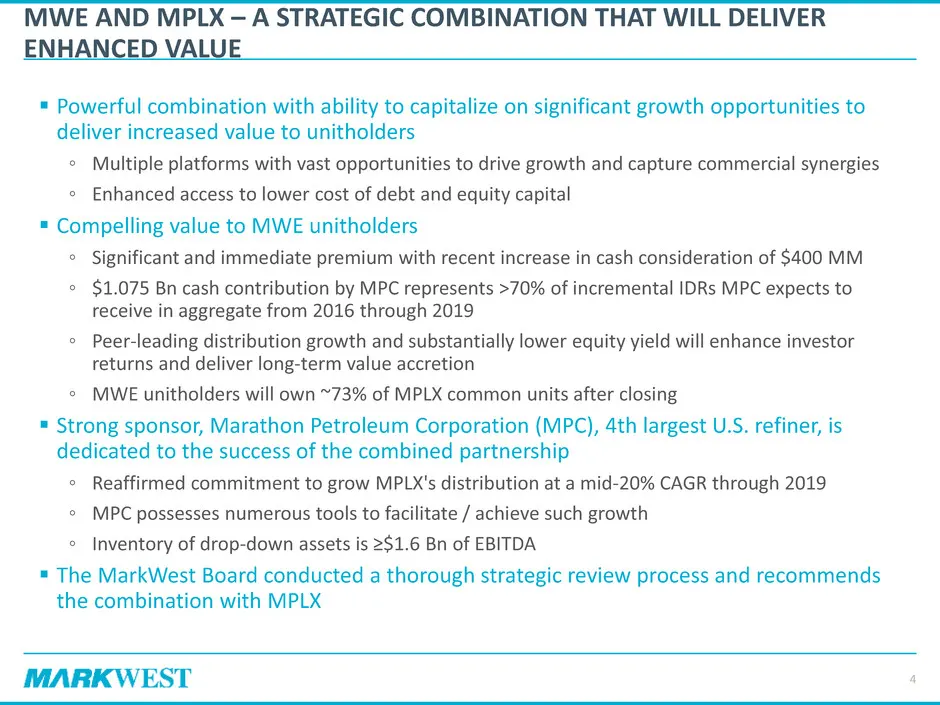
MWE AND MPLX – A STRATEGIC COMBINATION THAT WILL DELIVER ENHANCED VALUE Powerful combination with ability to capitalize on significant growth opportunities to deliver increased value to unitholders ◦ Multiple platforms with vast opportunities to drive growth and capture commercial synergies ◦ Enha
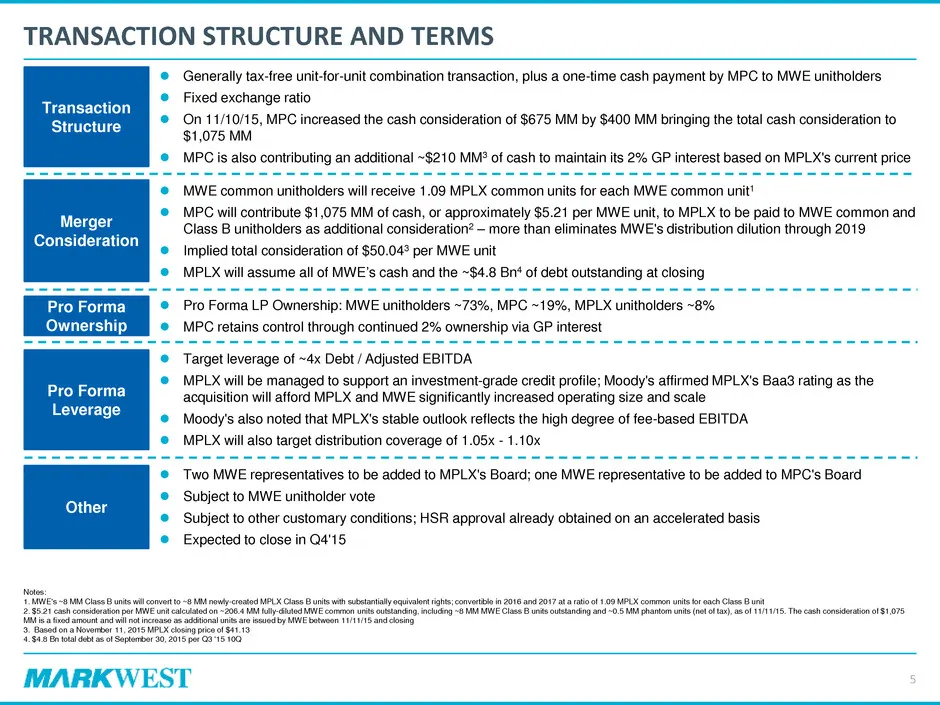
Slide 5: Transaction Structure and Terms
TRANSACTION STRUCTURE AND TERMS Merger Consideration Other Transaction Structure MWE common unitholders will receive 1.09 MPLX common units for each MWE common unit1 MPC will contribute $1,075 MM of cash, or approximately $5.21 per MWE unit, to MPLX to be paid to MWE common and Class B unitholde
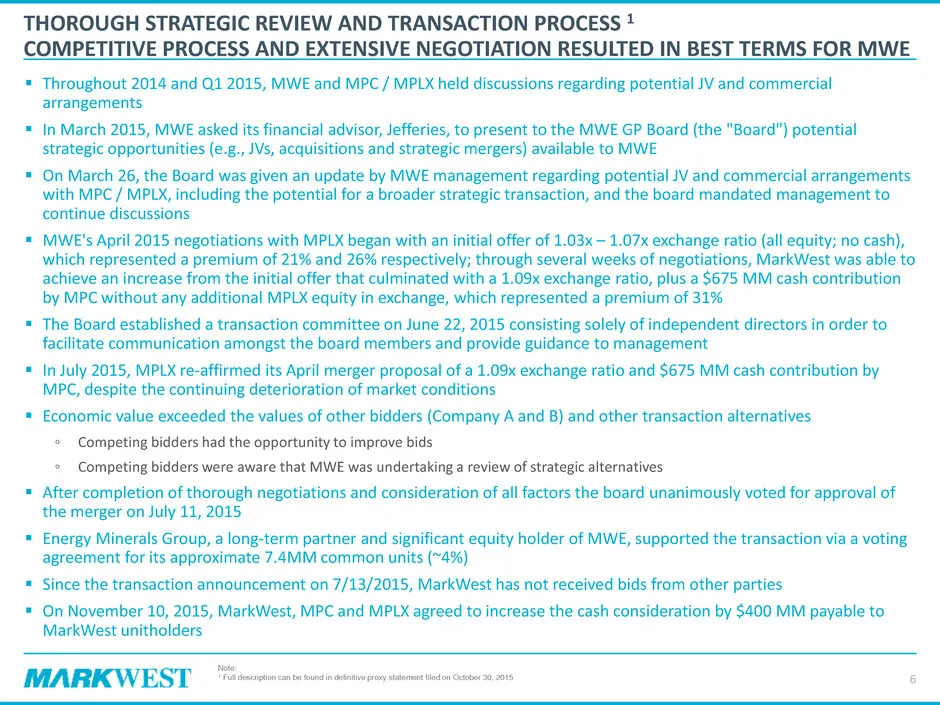
Slide 6: Thorough Strategic Review and Transaction Process
THOROUGH STRATEGIC REVIEW AND TRANSACTION PROCESS 1 COMPETITIVE PROCESS AND EXTENSIVE NEGOTIATION RESULTED IN BEST TERMS FOR MWE Throughout 2014 and Q1 2015, MWE and MPC / MPLX held discussions regarding potential JV and commercial arrangements In March 2015, MWE asked its financial advisor, Jef
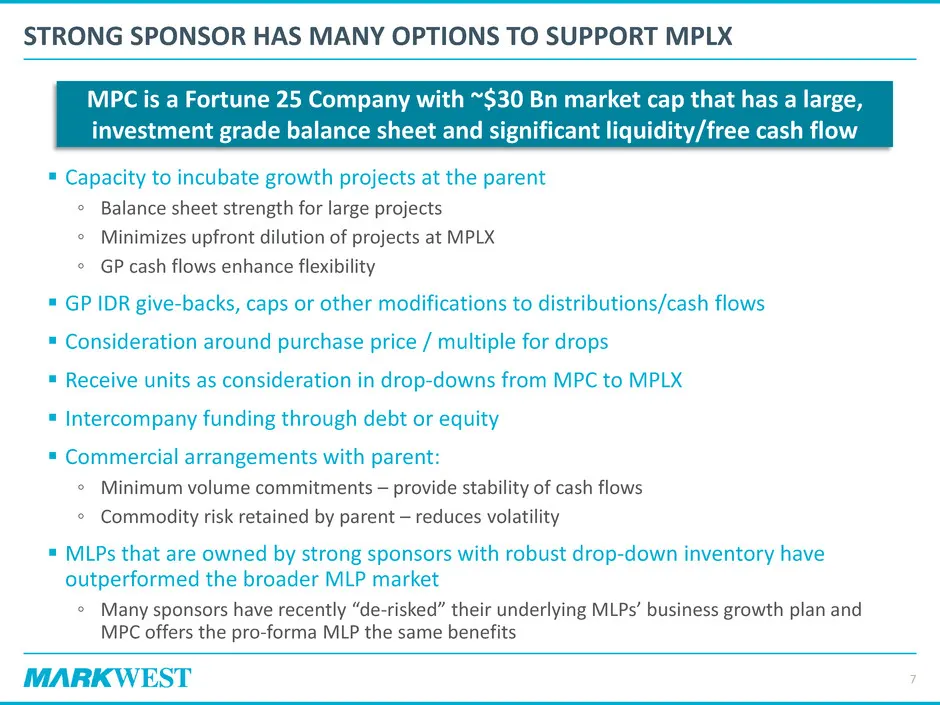
Slide 7: Strong Sponsor Has Many Options to Support MPLX
STRONG SPONSOR HAS MANY OPTIONS TO SUPPORT MPLX Capacity to incubate growth projects at the parent ◦ Balance sheet strength for large projects ◦ Minimizes upfront dilution of projects at MPLX ◦ GP cash flows enhance flexibility GP IDR give-backs, caps or other modifications to distributions/cash
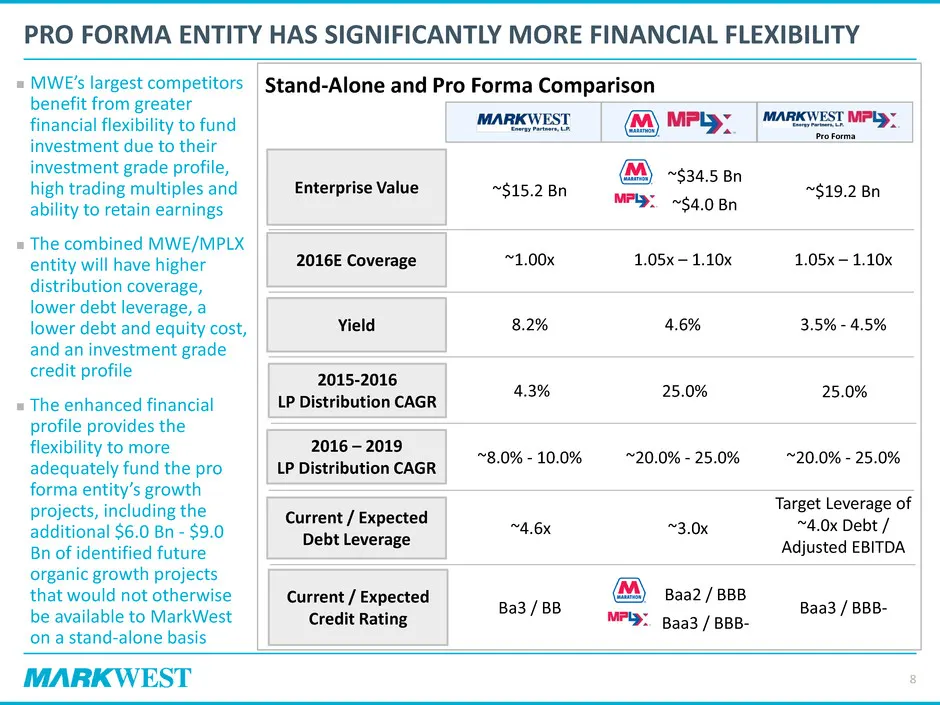
Slide 8: Stand-Alone and Pro Forma Comparison
Stand-Alone and Pro Forma Comparison Baa2 / BBB Baa3 / BBB- Enterprise Value 2016E Coverage Yield Current / Expected Debt Leverage 2016 – 2019 LP Distribution CAGR Pro Forma Ba3 / BB ~$15.2 Bn ~$4.0 Bn ~$34.5 Bn ~$19.2 Bn 1.05x – 1.10x ~1.00x 1.05x – 1.10x 8.2% 4.6% 3.5% - 4.5% ~8.0% - 10.0% ~20.0%
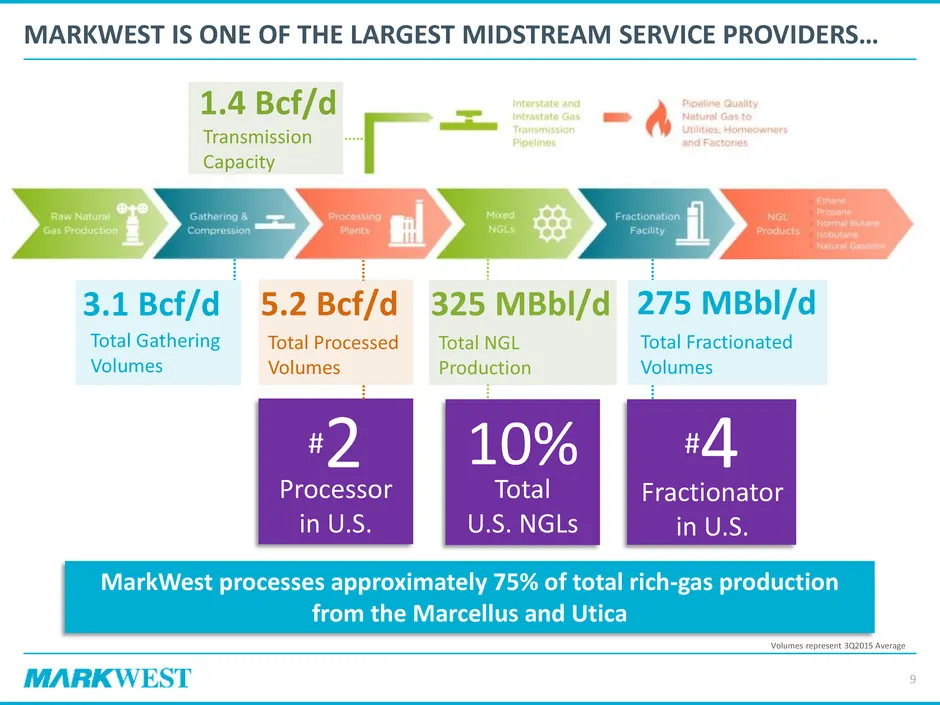
Slide 9: MarkWest Is One of the Largest Midstream Service Providers
3.1 Bcf/d Total Gathering Volumes MARKWEST IS ONE OF THE LARGEST MIDSTREAM SERVICE PROVIDERS… Total Processed Volumes 5.2 Bcf/d 275 MBbl/d Total Fractionated Volumes 9 Volumes represent 3Q2015 Average MarkWest processes approximately 75% of total rich-gas production from the Marcellus and Utica Tota
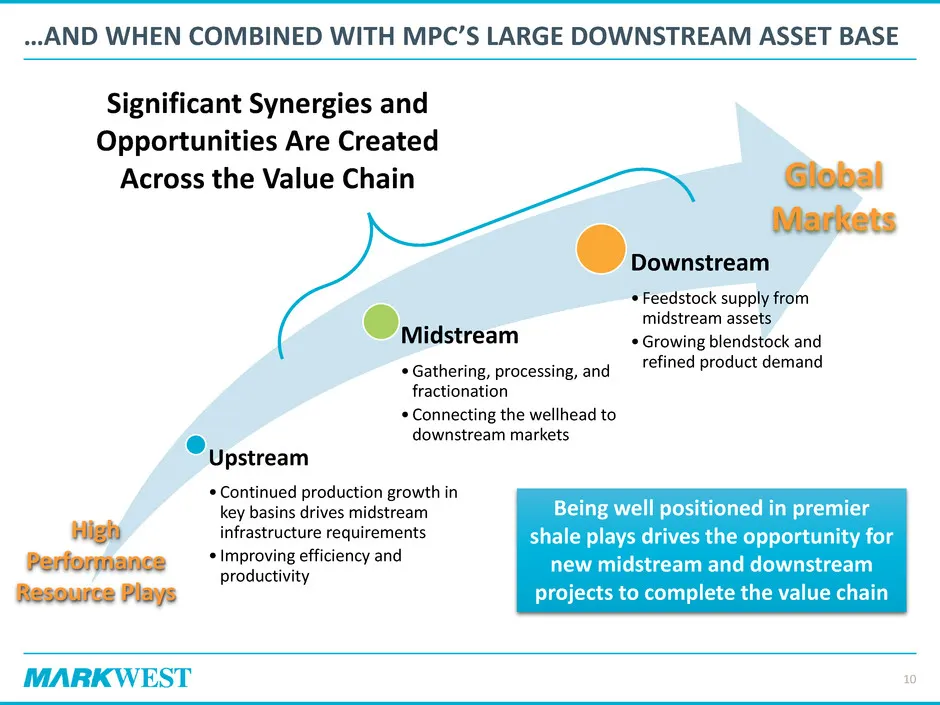
Slide 10: Significant Synergies and Opportunities Across the Value Chain
Upstream •Continued production growth in key basins drives midstream infrastructure requirements • Improving efficiency and productivity Midstream •Gathering, processing, and fractionation •Connecting the wellhead to downstream markets Downstream • Feedstock supply from midstream assets •Growing ble
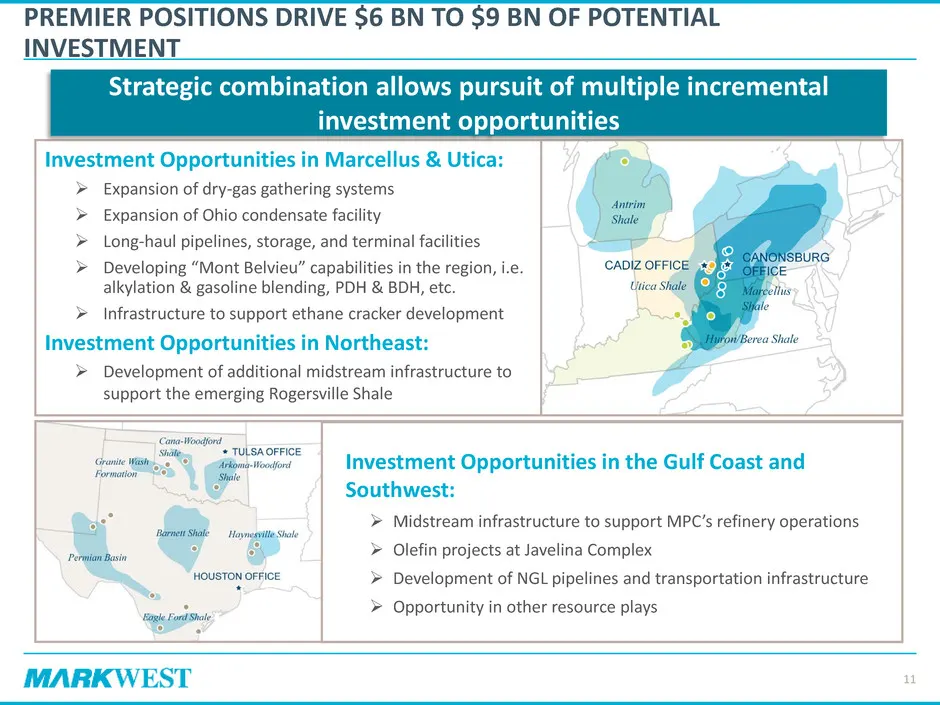
Slide 11: Premier Positions Drive $6 Bn to $9 Bn of Potential Investment
PREMIER POSITIONS DRIVE $6 BN TO $9 BN OF POTENTIAL INVESTMENT Investment Opportunities in Marcellus & Utica: Expansion of dry-gas gathering systems Expansion of Ohio condensate facility Long-haul pipelines, storage, and terminal facilities Developing “Mont Belvieu” capabilities in the regio
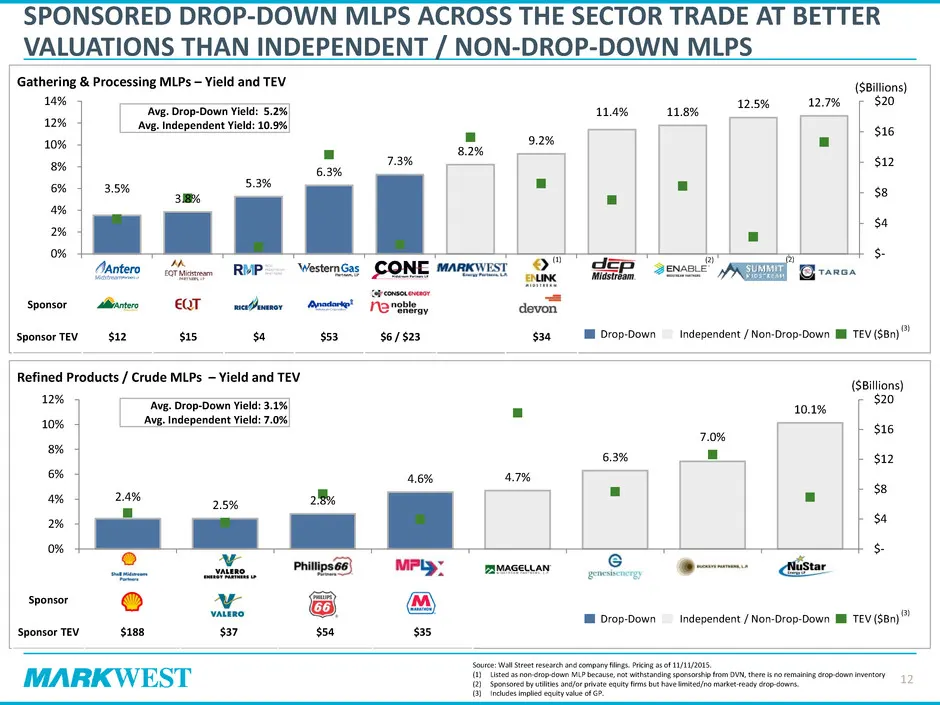
Slide 12: Sponsored Drop-Down MLPs Trade at Better Valuations
2.4% 2.5% 2.8% 4.6% 4.7% 6.3% 7.0% 10.1% $- $4 $8 $12 $16 $20 0% 2% 4% 6% 8% 10% 12% SHLX VLP PSXP MPLX MMP GEL BPL NS Gathering & Processing MLPs – Yield and TEV 3.5% 3.8% 5.3% 6.3% 7.3% 8.2% 9.2% 11.4% 11.8% 12.5% 12.7% $- $4 $8 $12 $16 $20 0% 2% 4% 6% 8% 10% 12% 14% AM EQM RMP WES CNNX MWE ENLK D
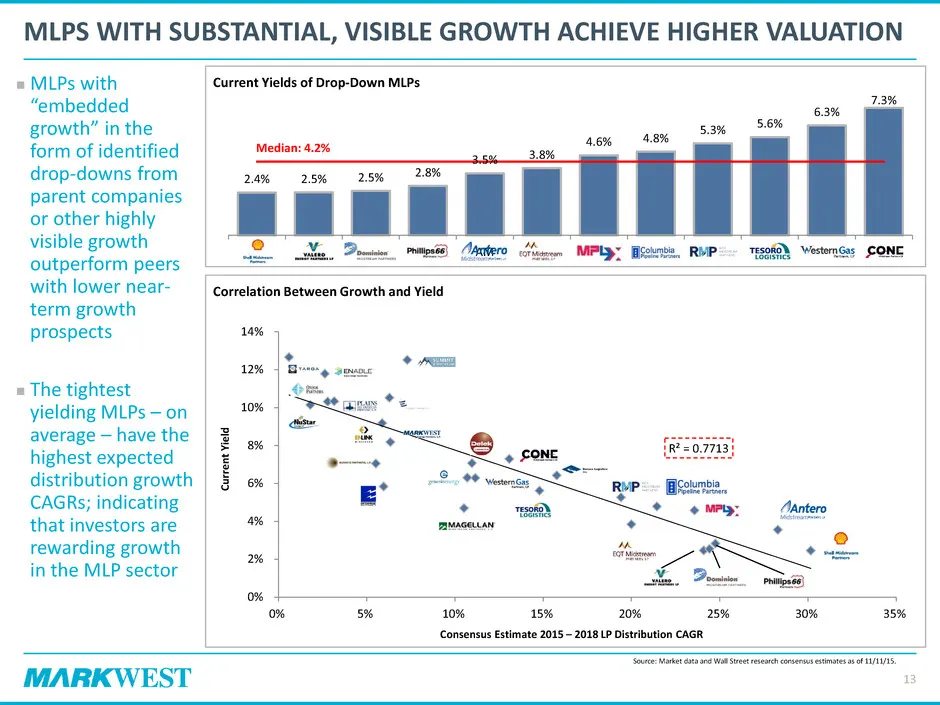
Slide 13: MLPs with Substantial, Visible Growth Achieve Higher Valuation
R² = 0.7713 0% 2% 4% 6% 8% 10% 12% 14% 0% 5% 10% 15% 20% 25% 30% 35% Current Yields of Drop-Down MLPs 2.4% 2.5% 2.5% 2.8% 3.5% 3.8% 4.6% 4.8% 5.3% 5.6% 6.3% 7.3% SHLX VLP DM PSXP AM EQM MPLX CPPL RMP TLLP WES CNNX Correlation Between Growth and Yield MLPS WITH SUBSTANTIAL, VISIBLE GROWTH ACHIEVE HIG
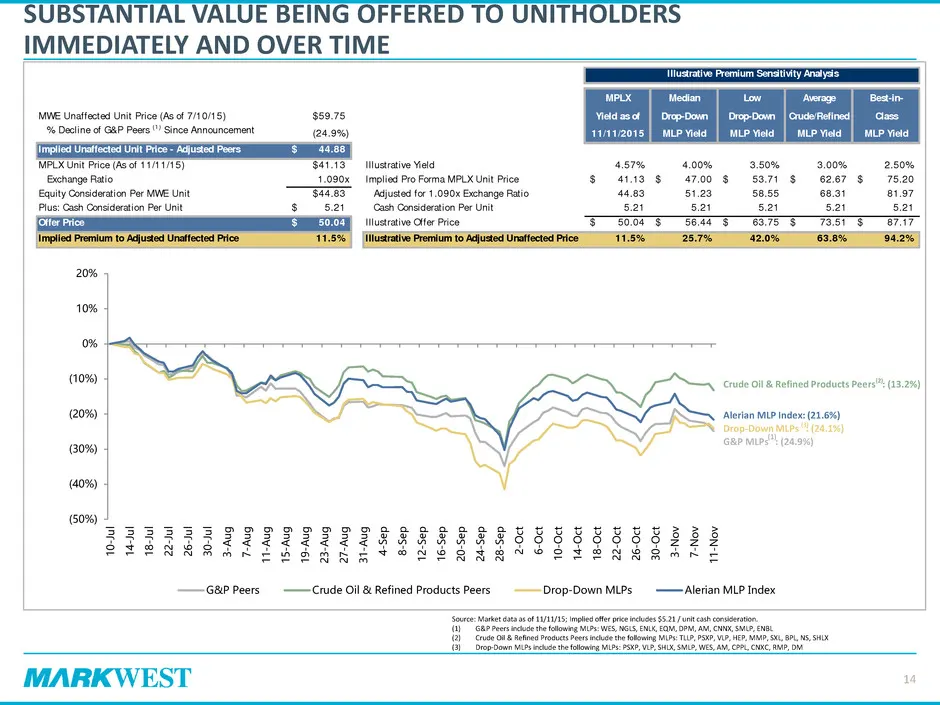
Slide 14: Substantial Value Being Offered to Unitholders Immediately and Over Time
SUBSTANTIAL VALUE BEING OFFERED TO UNITHOLDERS IMMEDIATELY AND OVER TIME Source: Market data as of 11/11/15; Implied offer price includes $5.21 / unit cash consideration. (1) G&P Peers include the following MLPs: WES, NGLS, ENLK, EQM, DPM, AM, CNNX, SMLP, ENBL (2) Crude Oil & Refined Products Peers
Slide 15: Distributions to MWE Unitholders
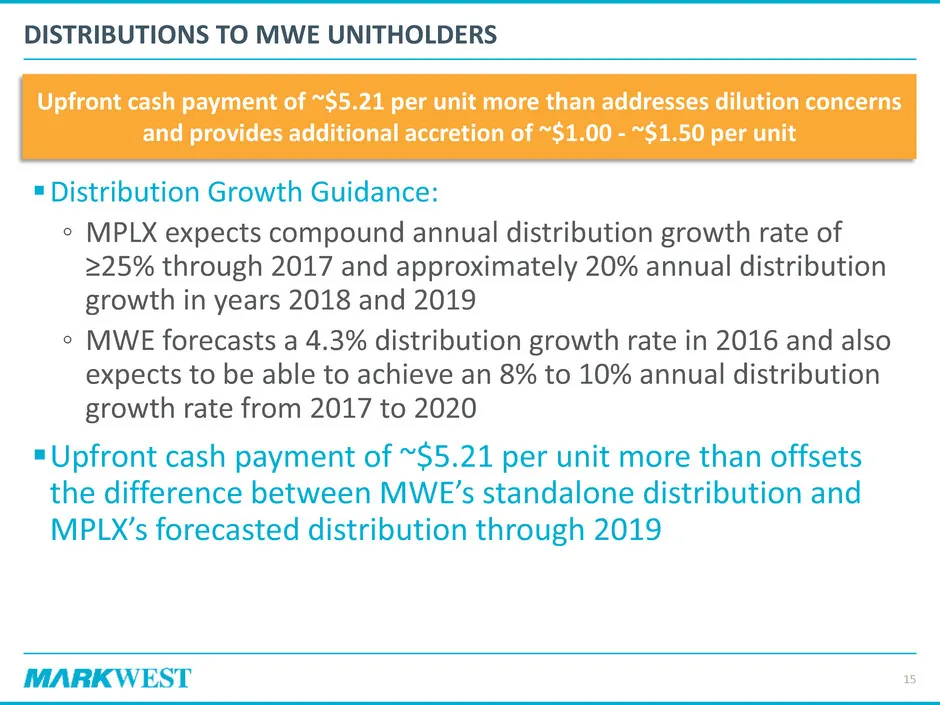
DISTRIBUTIONS TO MWE UNITHOLDERS Distribution Growth Guidance: ◦ MPLX expects compound annual distribution growth rate of ≥25% through 2017 and approximately 20% annual distribution growth in years 2018 and 2019 ◦ MWE forecasts a 4.3% distribution growth rate in 2016 and also expects to be able to
Slide 16: Combination Benefits to MarkWest Unitholders
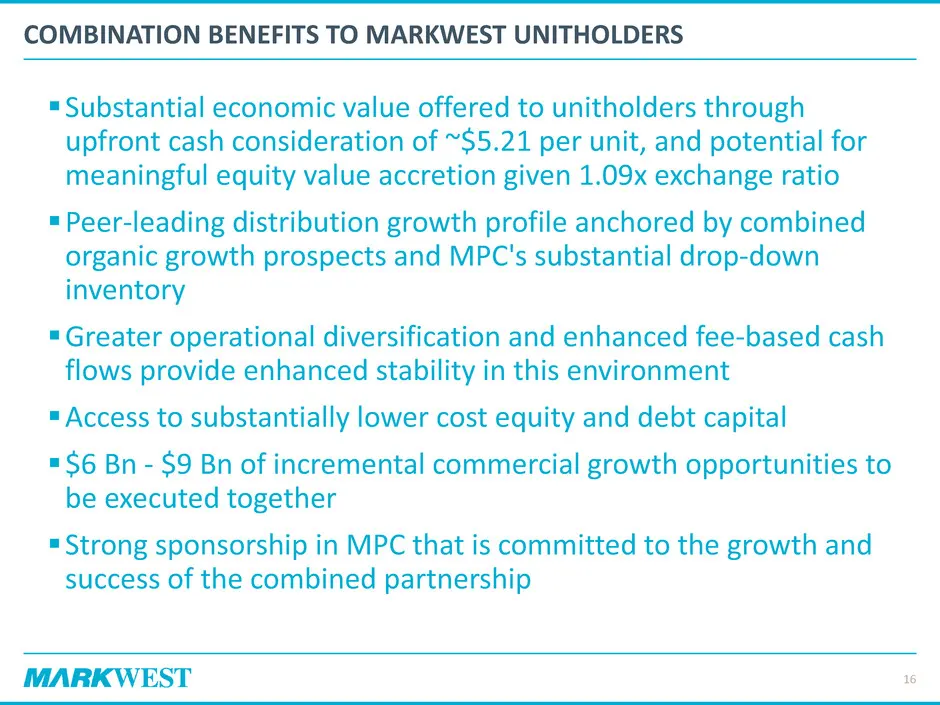
COMBINATION BENEFITS TO MARKWEST UNITHOLDERS Substantial economic value offered to unitholders through upfront cash consideration of ~$5.21 per unit, and potential for meaningful equity value accretion given 1.09x exchange ratio Peer-leading distribution growth profile anchored by combined organic
Slide 17: 1515 ARAPAHOE STREET TOWER 1, SUITE 1600 DENVER, COLORADO 202 PHONE: 303-925-9200 INVESTOR RELATIONS:
1515 ARAPAHOE STREET TOWER 1, SUITE 1600 DENVER, COLORADO 80202 PHONE: 303-925-9200 INVESTOR RELATIONS: 866-858-0482 EMAIL: [email protected] WEBSITE: WWW.MARKWEST.COM
Source: SEC EDGAR · 425 filed Nov 13, 2015
More decks from Markwest Energy Partners LP
 Fact Sheet (July 2017)1 slide · July 2017
 Fact Sheet (July 2017)1 slide · July 2017
 Fact Sheet (July 2017)1 slide · July 2017
 Markwest Energy Partners L P — Investor Day (December 2015)116 slides · Dec 3, 2015
 Merger or Acquisition (November 2015)17 slides · Nov 12, 2015
 Q3 2015 Earnings Presentation20 slides · Nov 4, 2015