Reliant Bancorp — Raymond James U.S. Bank Conference 2020
35 slides from Reliant Bancorp's conference presentation, Sep 9, 2020
Slide 1: Raymond James U.S. Bank Conference September 9-10, 2020
Raymond James U.S. Bank Conference September 9-10, 2020
Slide 2: Safe Harbor Statements
Safe Harbor Statements Forward-Looking StatementsAll statements, other than statements of historical fact, included in this presentation and any oral statements made regarding the subject of this presentation, that address activities, events or developments that Reliant Bancorp, Inc. (“Reliant” or t
Slide 3: Why Reliant?
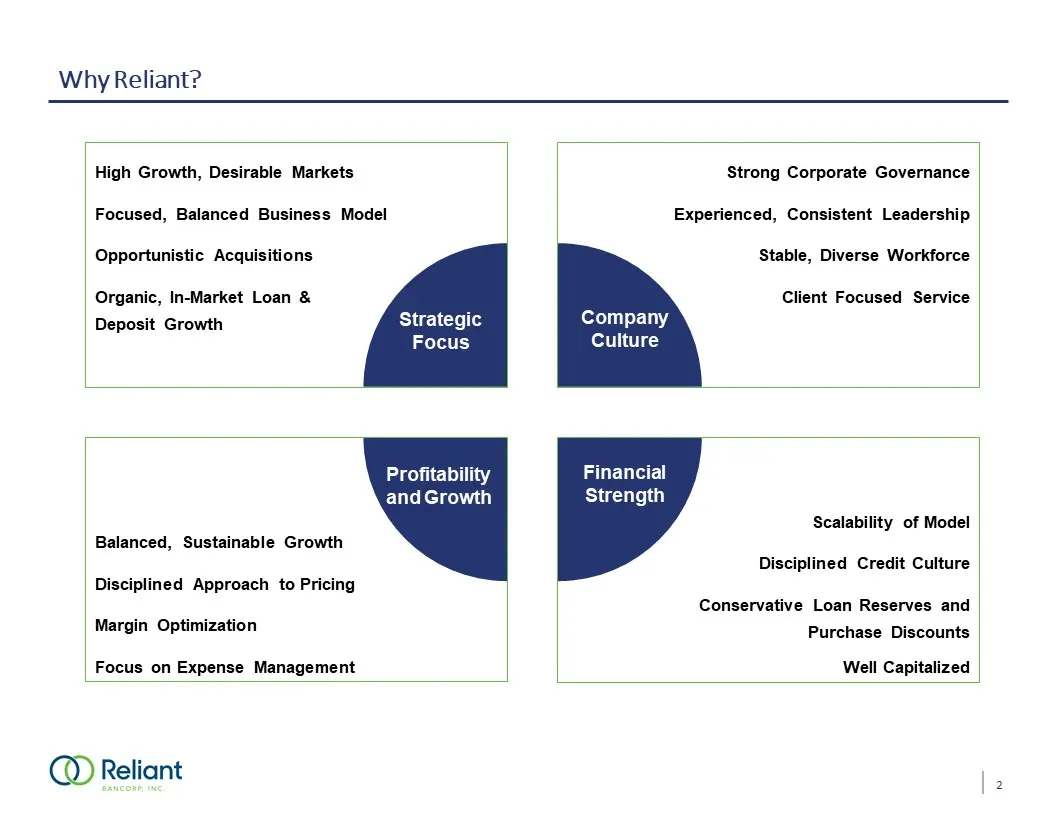
Why Reliant? High Growth, Desirable MarketsFocused, Balanced Business ModelOpportunistic AcquisitionsOrganic, In-Market Loan & Deposit Growth Balanced, Sustainable GrowthDisciplined Approach to PricingMargin OptimizationFocus on Expense Management Strong Corporate GovernanceExperienced, Consistent L
Slide 4: Experienced, Committed Leadership Team
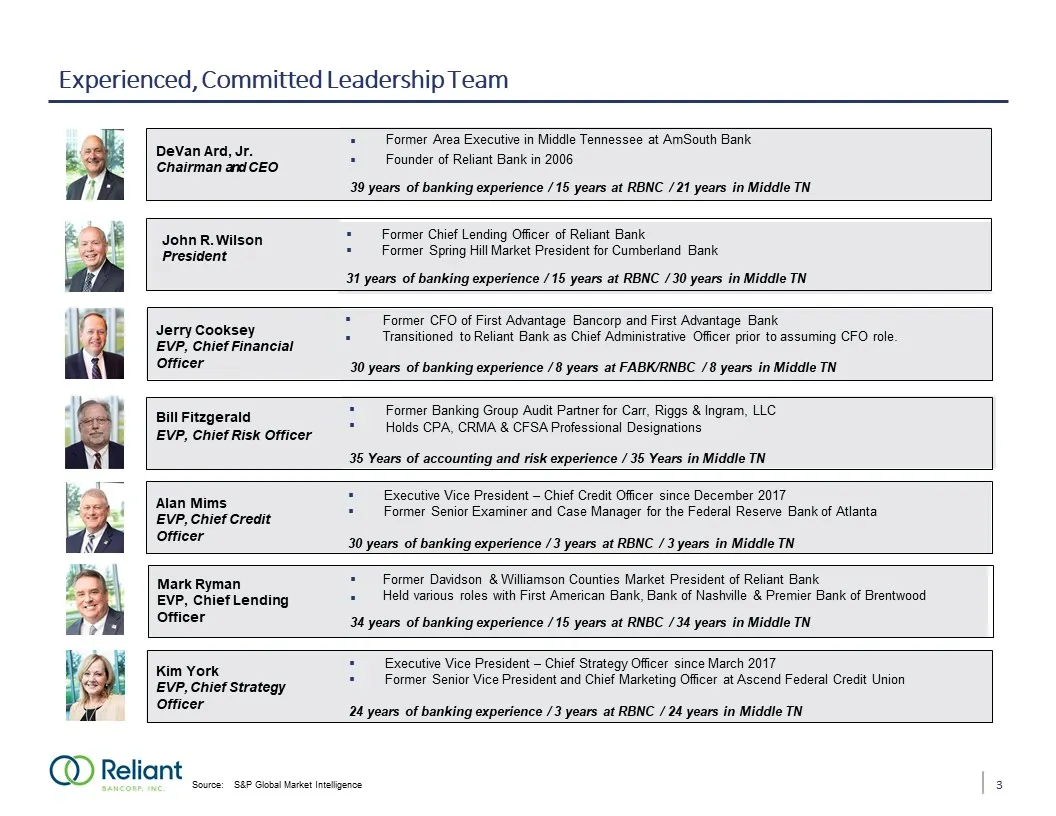
Experienced, Committed Leadership Team 3 Source: S&P Global Market Intelligence DeVan Ard, Jr. Chairman and CEO Former Area Executive in Middle Tennessee at AmSouth Bank Founder of Reliant Bank in 2006 39 years of banking experience / 15 years at RBNC / 21 years in Middle TN Jerry CookseyEVP, Chi
Slide 5: Pandemic - Our Response to COVID-19
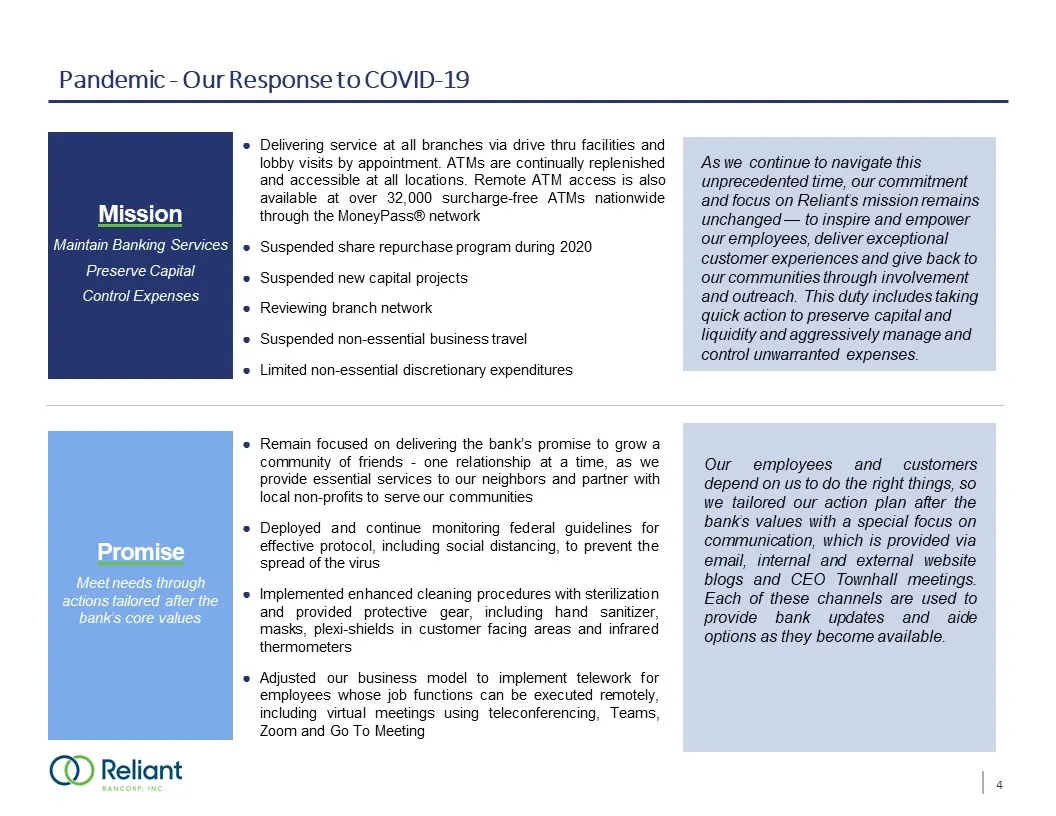
Pandemic - Our Response to COVID-19 EmployeesEnsuring Health and Safety of our Team Members CommunitiesHelping the Communities we Serve PromiseMeet needs through actions tailored after the bank’s core values MissionMaintain Banking ServicesPreserve Capital Control Expenses CommunitiesHelping the Com
Slide 6: Pandemic - Our Response to COVID-19 (Cont'd)
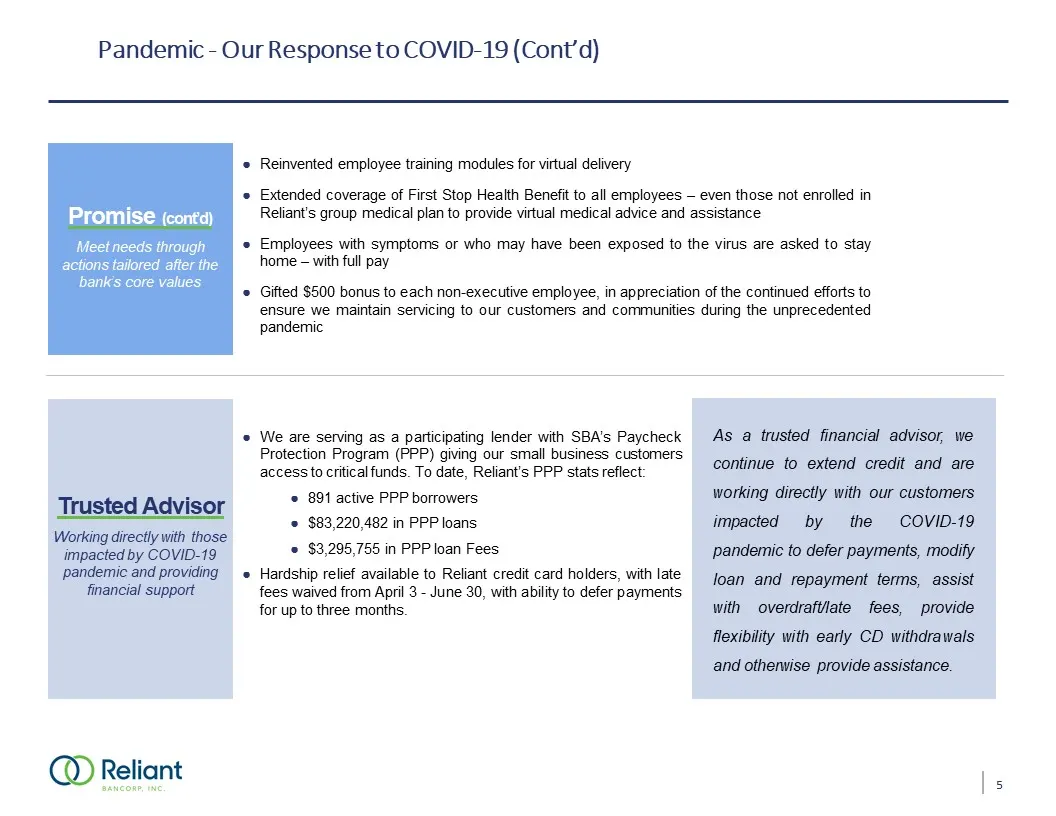
Pandemic - Our Response to COVID-19 (Cont’d) EmployeesEnsuring Health and Safety of our Team Members CommunitiesHelping the Communities we Serve CommunitiesHelping the Communities we Serve CommunitiesHelping the Communities we Serve Reinvented employee training modules for virtual deliveryExtended c
Slide 7: Pandemic - Our Response to COVID-19 (Cont'd)
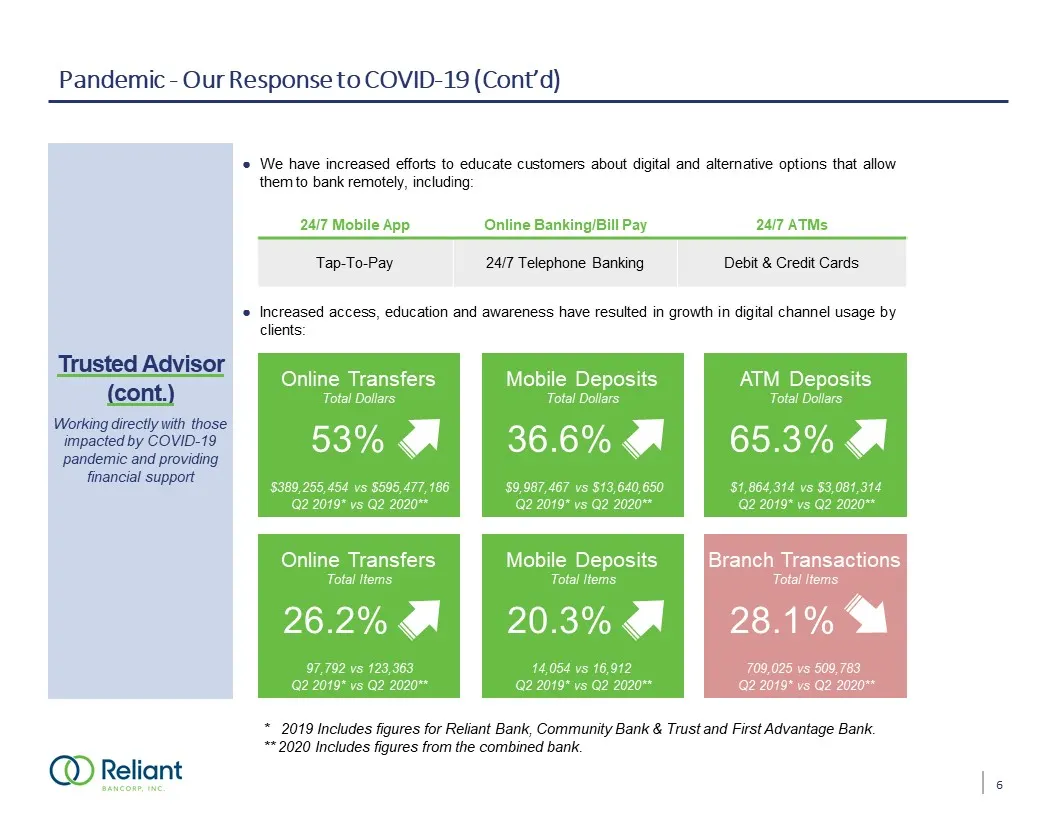
Pandemic - Our Response to COVID-19 (Cont’d) EmployeesEnsuring Health and Safety of our Team Members CommunitiesHelping the Communities we Serve CommunitiesHelping the Communities we Serve CommunitiesHelping the Communities we Serve We have increased efforts to educate customers about digital and al
Slide 8: Reliant Bank Franchise Overview
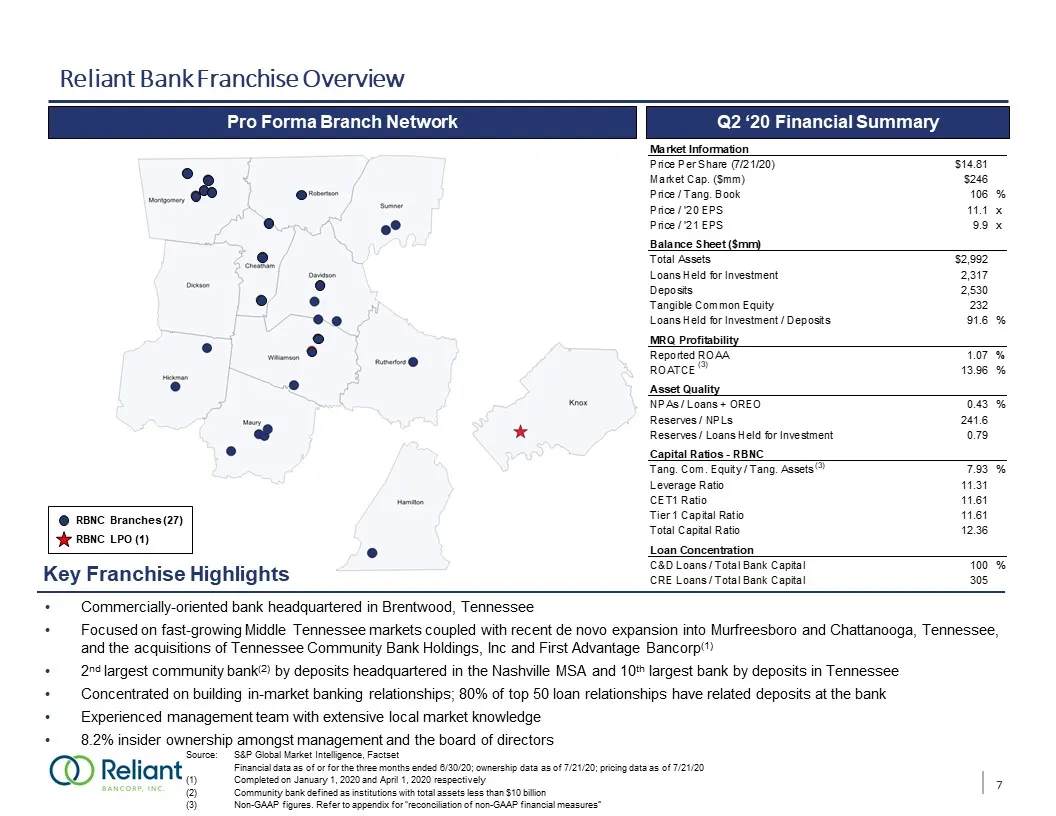
Reliant Bank Franchise Overview Commercially-oriented bank headquartered in Brentwood, Tennessee Focused on fast-growing Middle Tennessee markets coupled with recent de novo expansion into Murfreesboro and Chattanooga, Tennessee, and the acquisitions of Tennessee Community Bank Holdings, Inc and Fir
Slide 9: Our History
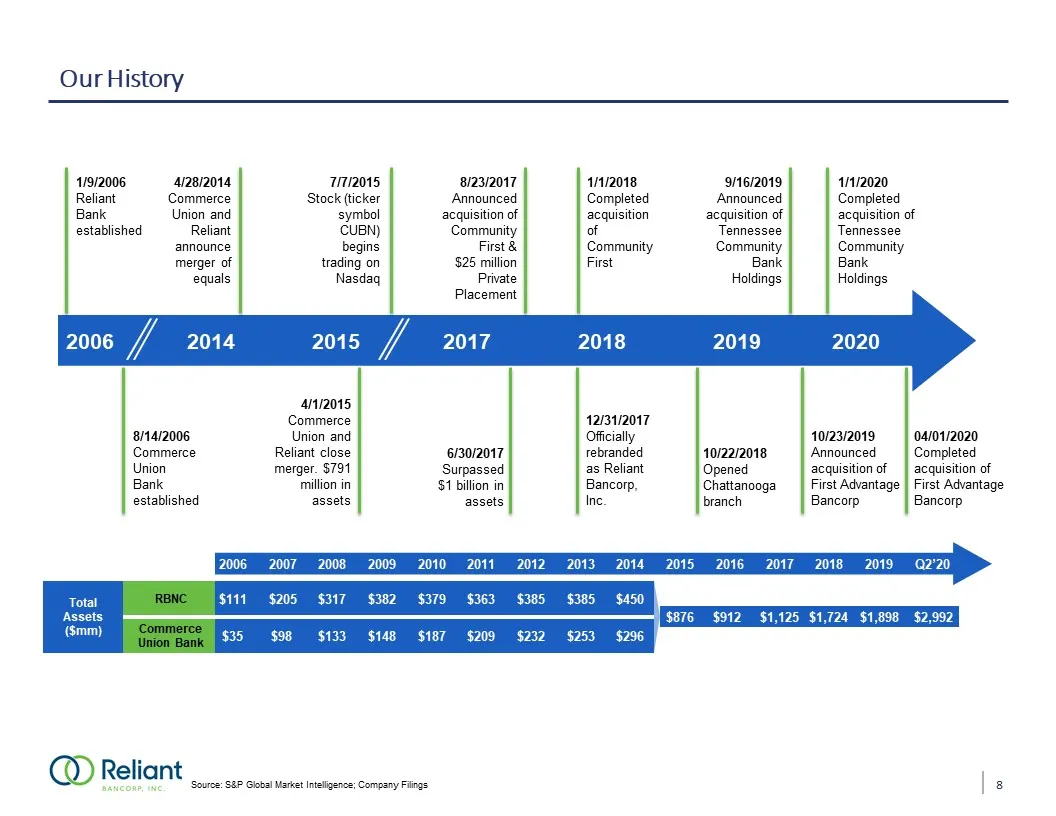
Source: S&P Global Market Intelligence; Company Filings 2006 Our History Total Assets($mm) RBNC Commerce Union Bank 1/9/2006Reliant Bank established 4/28/2014Commerce Union and Reliant announce merger of equals 7/7/2015Stock (ticker symbol CUBN) begins trading on Nasdaq 2006 2014 2017 2018 8/14/2006
Slide 10: Financial Highlights & Results
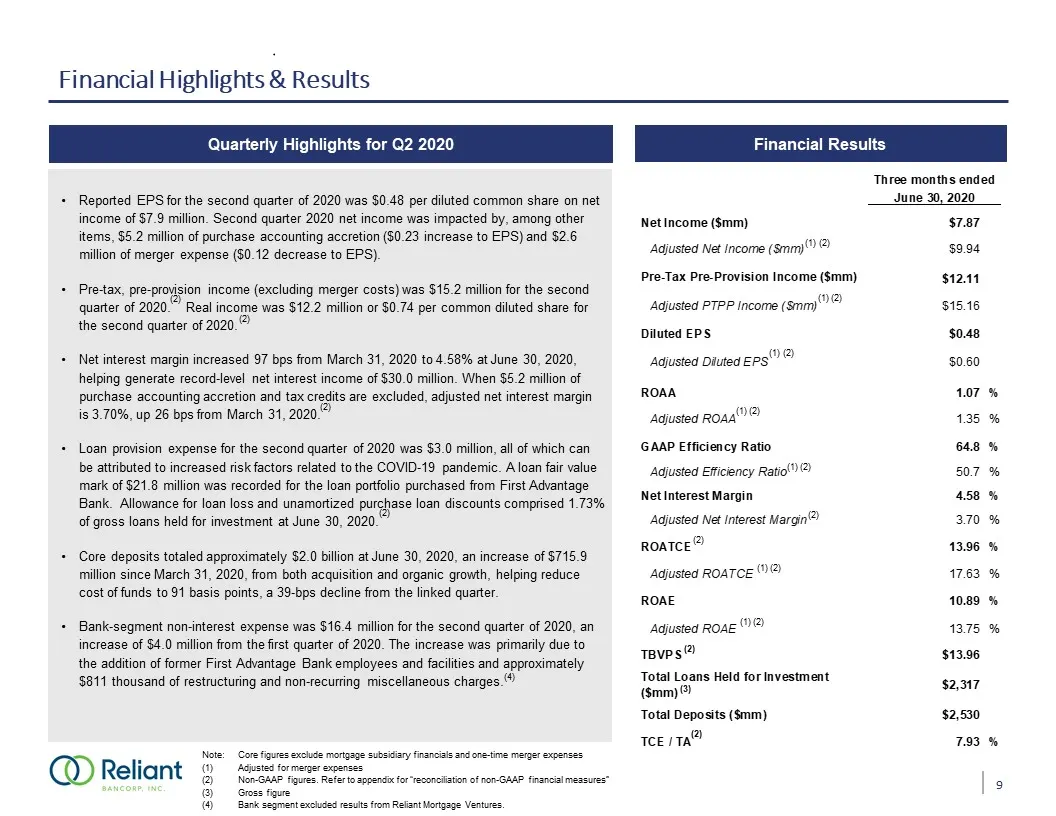
Financial Highlights & Results Quarterly Highlights for Q2 2020 Financial Results Note: Core figures exclude mortgage subsidiary financials and one-time merger expensesAdjusted for merger expensesNon-GAAP figures. Refer to appendix for “reconciliation of non-GAAP financial measures”Gross figureBank
Slide 11: Recent Acquisitions to Grow Franchise and Expand Presence in Middle Tennessee
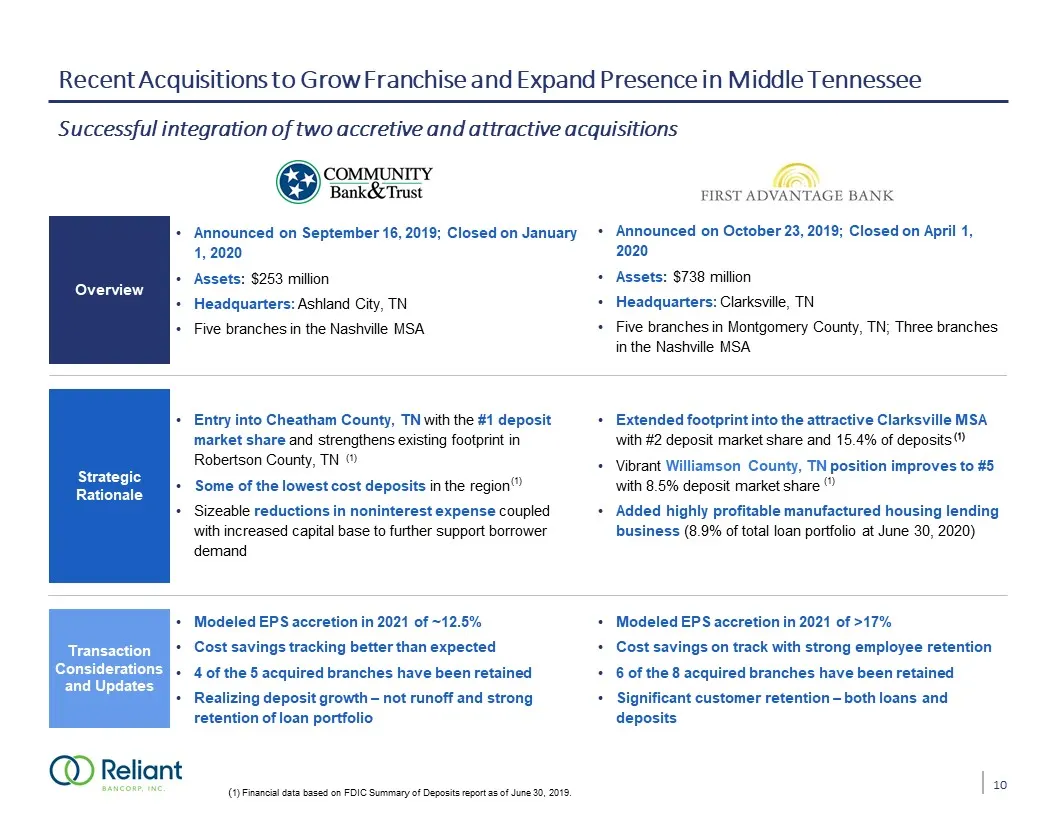
Recent Acquisitions to Grow Franchise and Expand Presence in Middle Tennessee Announced on September 16, 2019; Closed on January 1, 2020Assets: $253 millionHeadquarters: Ashland City, TN Five branches in the Nashville MSA Announced on October 23, 2019; Closed on April 1, 2020Assets: $738 millionHead
Slide 12: Nashville Deposit Market Share
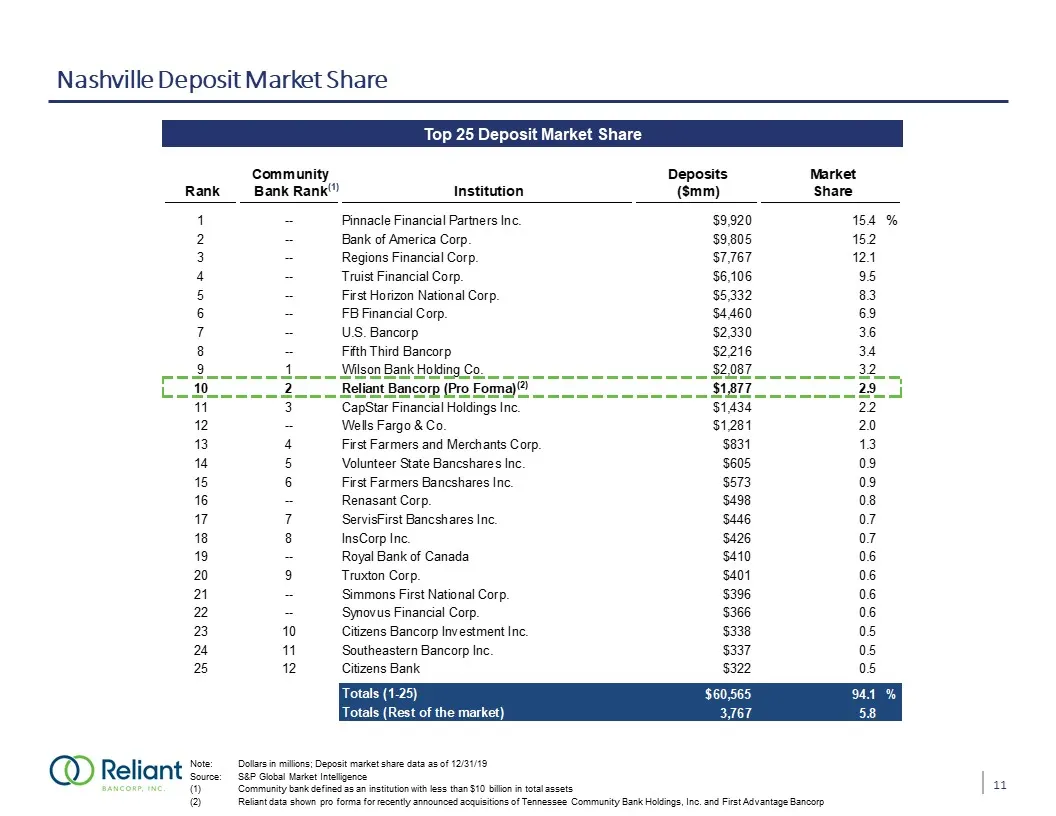
Nashville Deposit Market Share Top 25 Deposit Market Share Note: Dollars in millions; Deposit market share data as of 12/31/19Source: S&P Global Market IntelligenceCommunity bank defined as an institution with less than $10 billion in total assetsReliant data shown pro forma for recently announced a
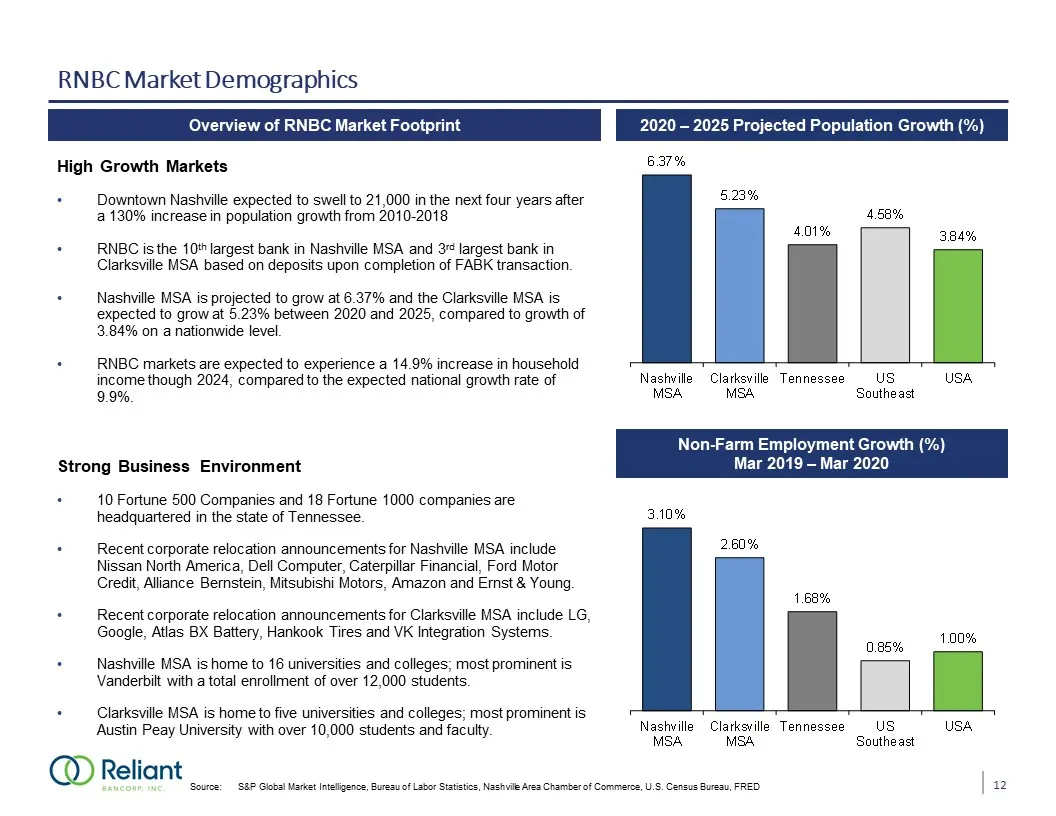
Slide 13: RNBC Market Demographics
RNBC Market Demographics Overview of RNBC Market Footprint High Growth MarketsDowntown Nashville expected to swell to 21,000 in the next four years after a 130% increase in population growth from 2010-2018RNBC is the 10th largest bank in Nashville MSA and 3rd largest bank in Clarksville MSA based on
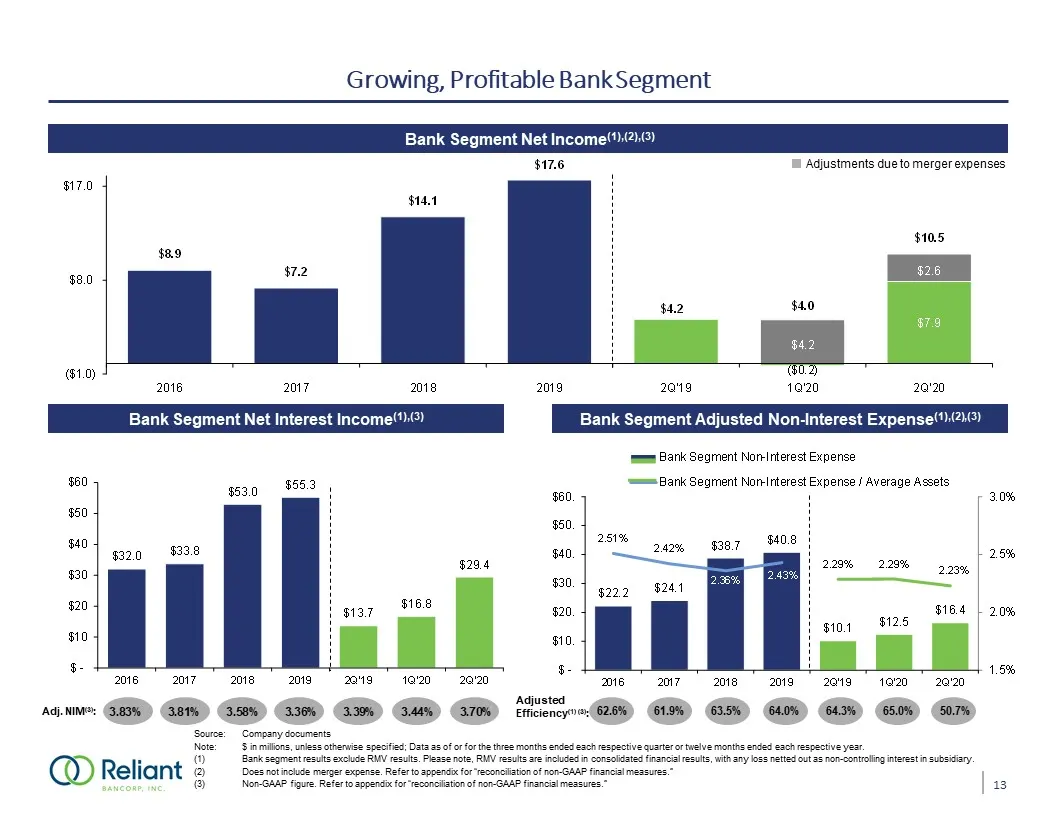
Slide 14: Growing, Profitable Bank Segment
Growing, Profitable Bank Segment Bank Segment Net Income(1),(2),(3) Source: Company documentsNote: $ in millions, unless otherwise specified; Data as of or for the three months ended each respective quarter or twelve months ended each respective year. Bank segment results exclude RMV results. Please
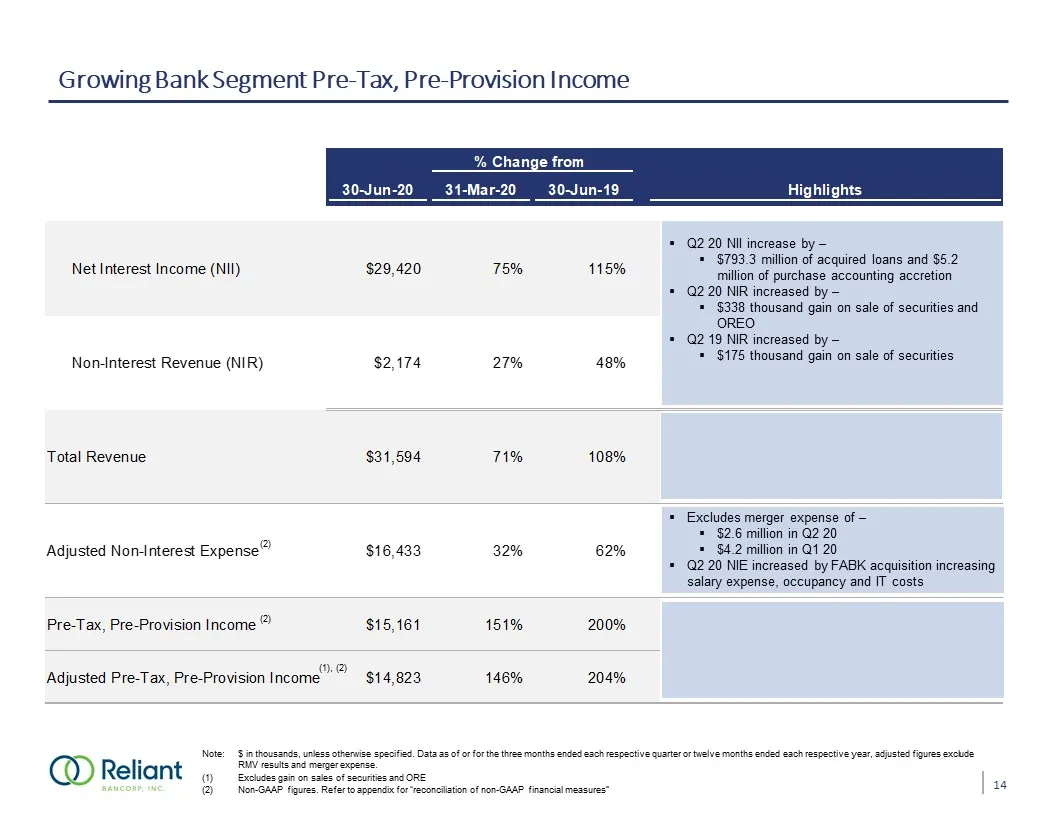
Slide 15: Growing Bank Segment Pre-Tax, Pre-Provision Income
Growing Bank Segment Pre-Tax, Pre-Provision Income Q4 19 NII impacted by 1.1 million gain on sale of securities$166 thousand gain on sale of OREQ1 19 NII impacted by$131 thousand gain on sale of securities Note: $ in thousands, unless otherwise specified. Data as of or for the three months ended eac
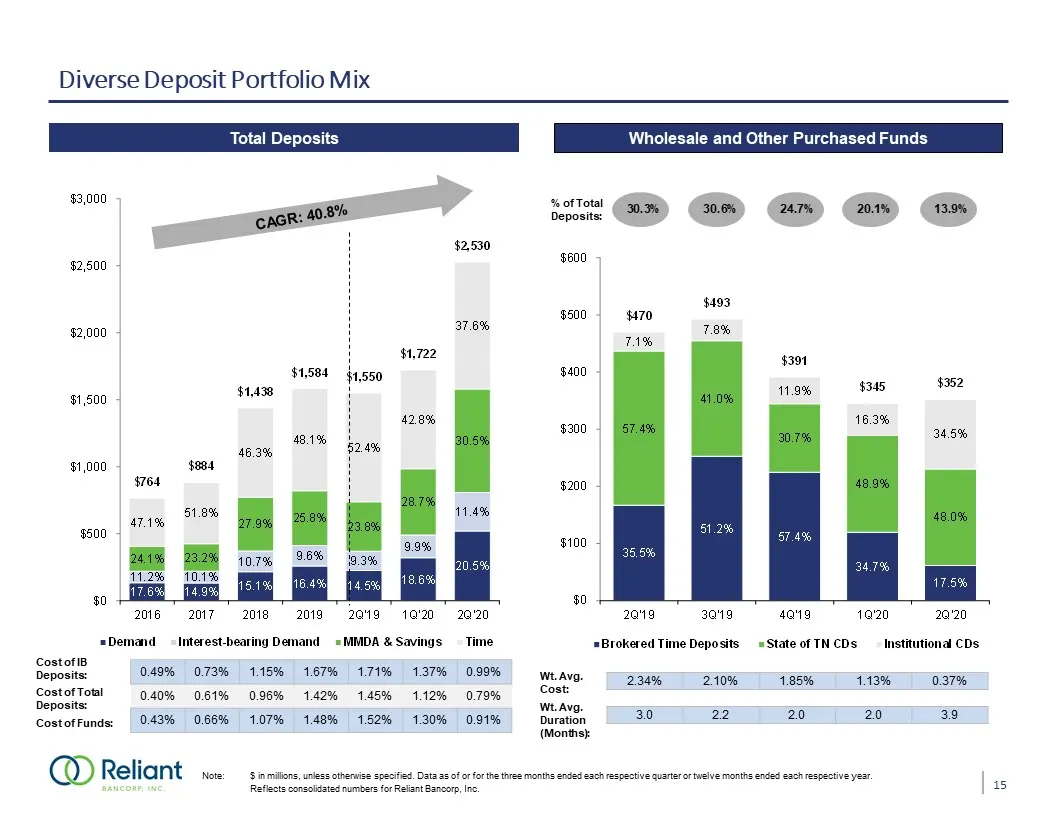
Slide 16: Diverse Deposit Portfolio Mix
Diverse Deposit Portfolio Mix Cost of IB Deposits: Cost of Funds: Note: $ in millions, unless otherwise specified. Data as of or for the three months ended each respective quarter or twelve months ended each respective year. Reflects consolidated numbers for Reliant Bancorp, Inc. Wholesale and Other
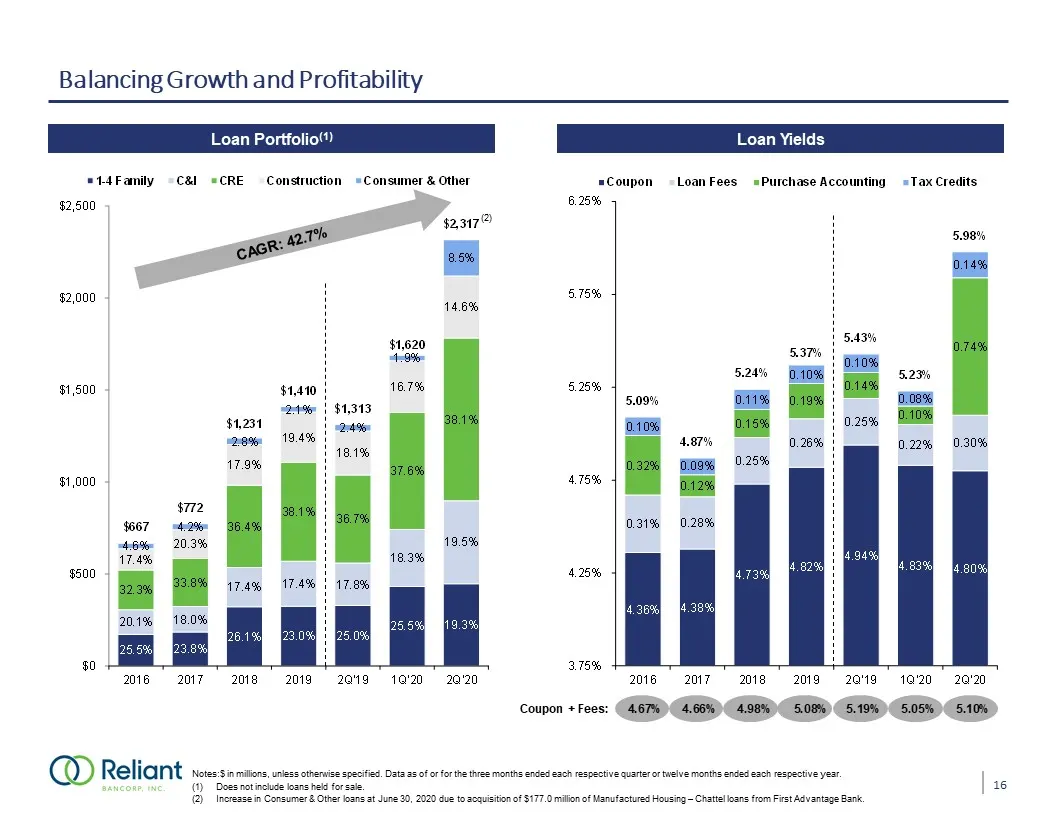
Slide 17: Balancing Growth and Profitability
Balancing Growth and Profitability Coupon + Fees: Loan Portfolio(1) Notes:$ in millions, unless otherwise specified. Data as of or for the three months ended each respective quarter or twelve months ended each respective year. Does not include loans held for sale.Increase in Consumer & Other loans a
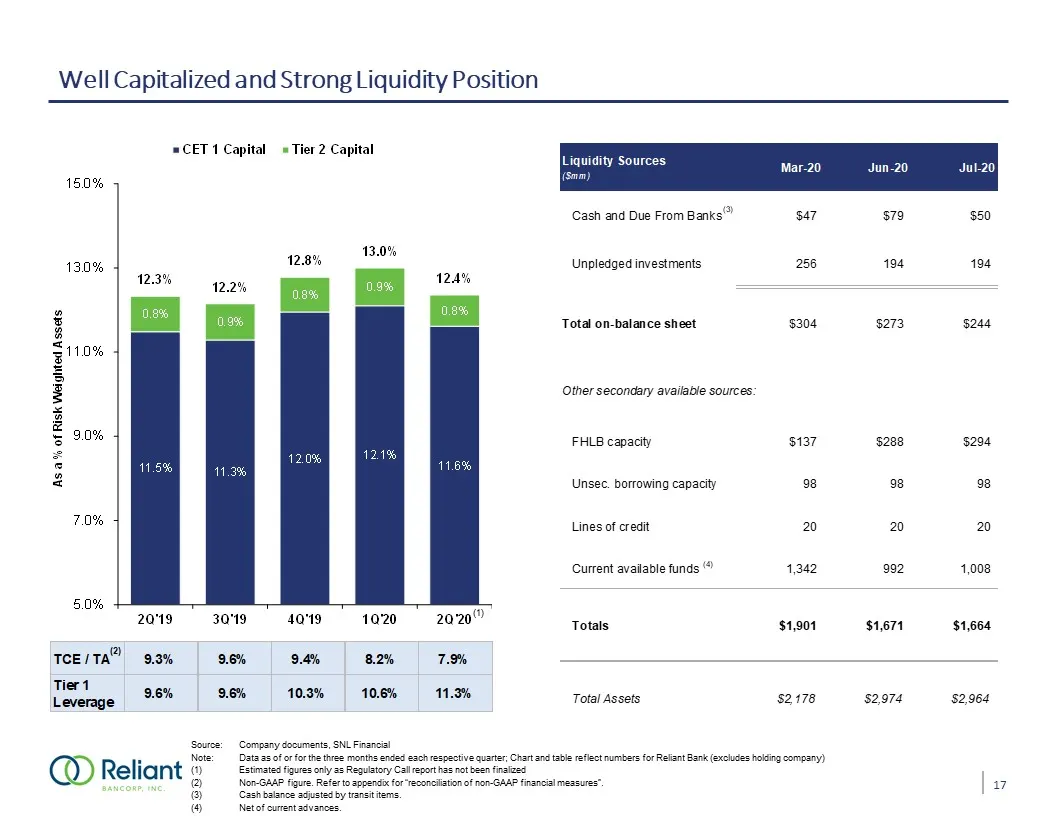
Slide 18: Well Capitalized and Strong Liquidity Position
Well Capitalized and Strong Liquidity Position Source: Company documents, SNL FinancialNote: Data as of or for the three months ended each respective quarter; Chart and table reflect numbers for Reliant Bank (excludes holding company)Estimated figures only as Regulatory Call report has not been fina
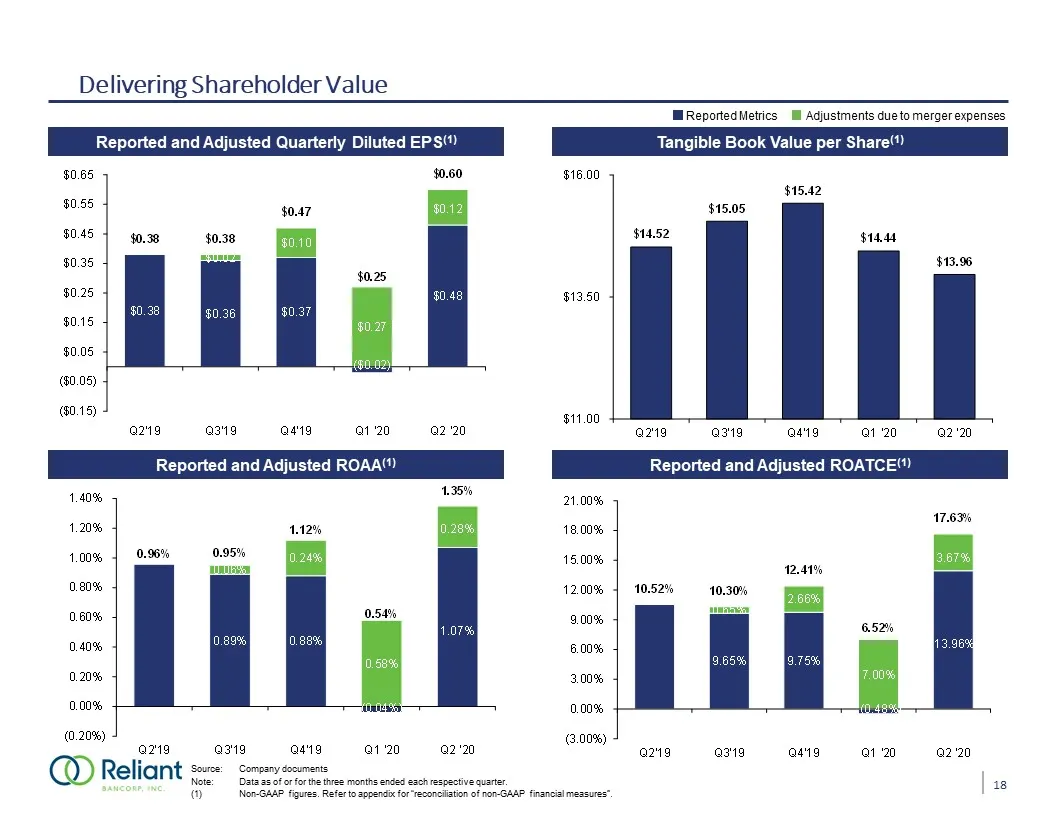
Slide 19: Delivering Shareholder Value
Delivering Shareholder Value Reported and Adjusted Quarterly Diluted EPS(1) Tangible Book Value per Share(1) Reported and Adjusted ROAA(1) Reported and Adjusted ROATCE(1) Source: Company documentsNote: Data as of or for the three months ended each respective quarter. (1) Non-GAAP figures. Refer to a
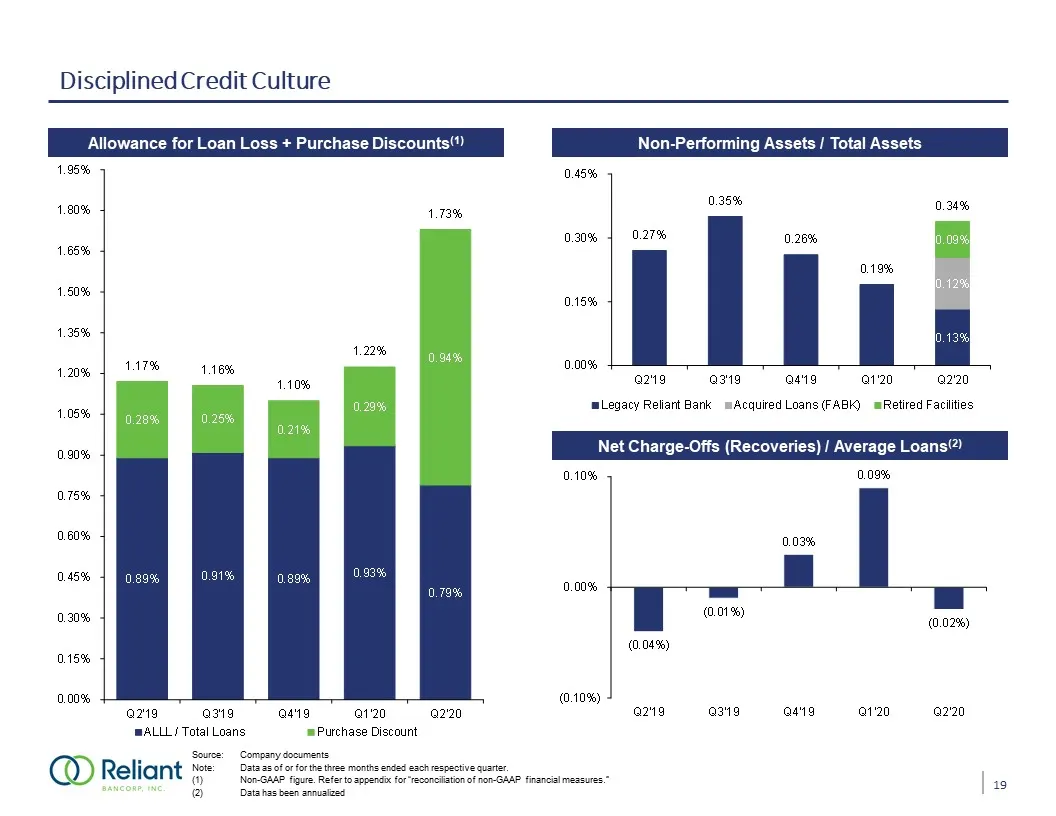
Slide 20: Disciplined Credit Culture
Disciplined Credit Culture Allowance for Loan Loss + Purchase Discounts(1) Net Charge-Offs (Recoveries) / Average Loans(2) Non-Performing Assets / Total Assets Source: Company documentsNote: Data as of or for the three months ended each respective quarter.Non-GAAP figure. Refer to appendix for “reco
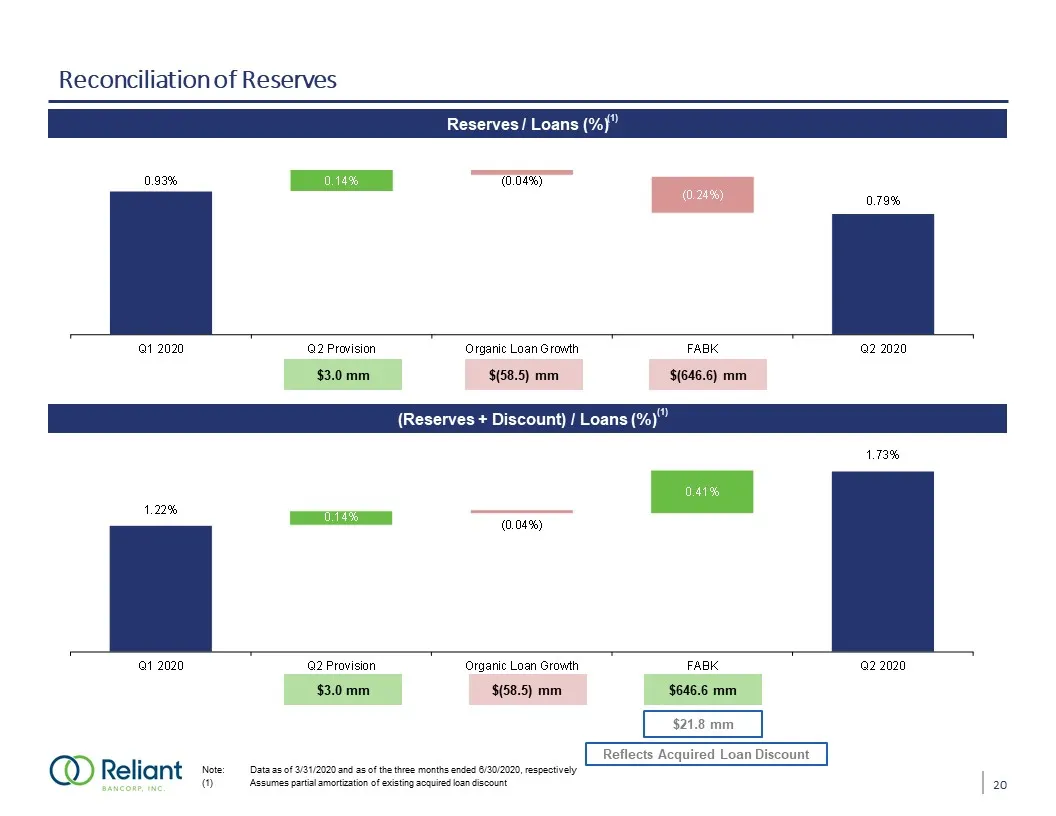
Slide 21: Reconciliation of Reserves
Reconciliation of Reserves Reserves / Loans (%) (Reserves + Discount) / Loans (%) Note: Data as of 3/31/2020 and as of the three months ended 6/30/2020, respectively(1) Assumes partial amortization of existing acquired loan discount $3.0 mm $(58.5) mm $(646.6) mm $3.0 mm $(58.5) mm $646.6 mm $21.8 m
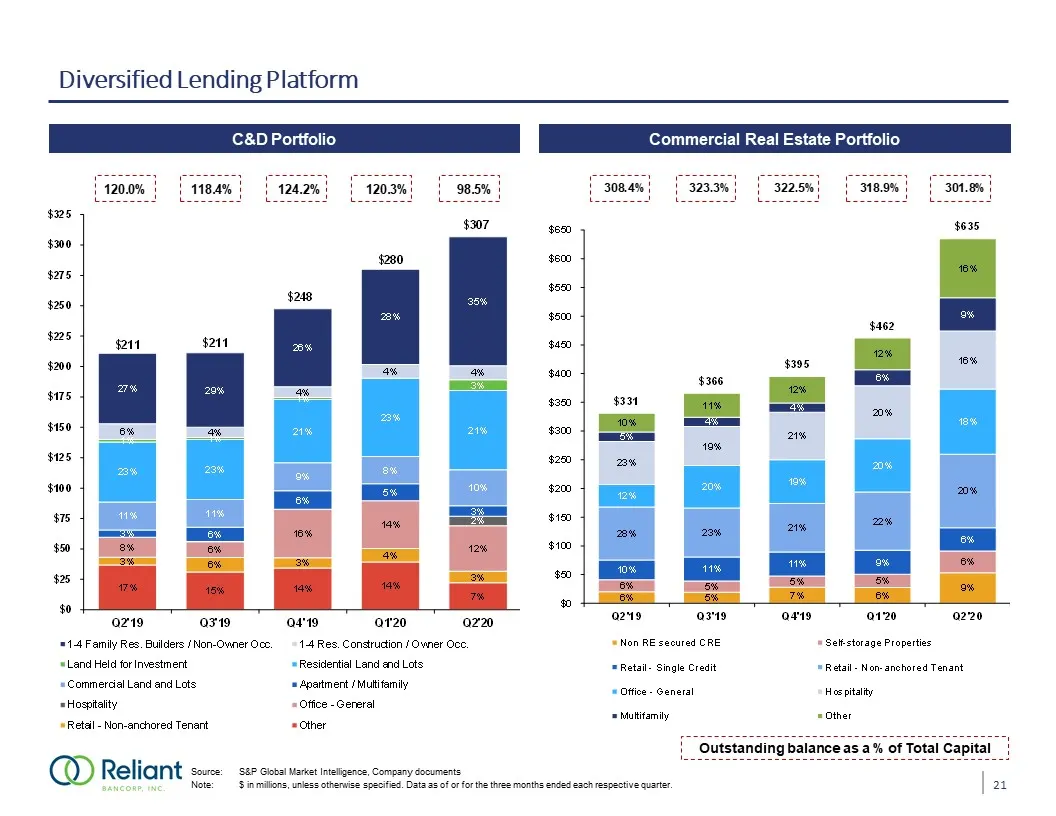
Slide 22: Diversified Lending Platform
Diversified Lending Platform C&D Portfolio Commercial Real Estate Portfolio Source: S&P Global Market Intelligence, Company documentsNote: $ in millions, unless otherwise specified. Data as of or for the three months ended each respective quarter. Outstanding balance as a % of Total Capital 21
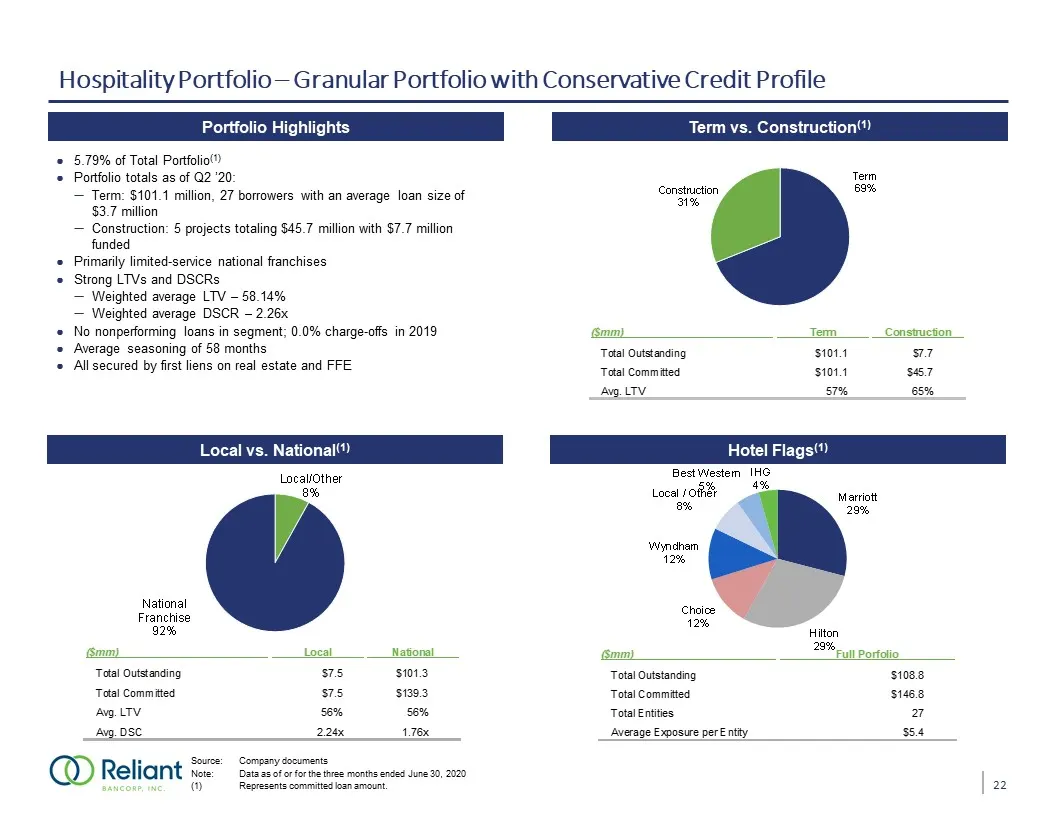
Slide 23: Hospitality Portfolio – Granular Portfolio with Conservative Credit Profile
Hospitality Portfolio – Granular Portfolio with Conservative Credit Profile Source: Company documentsNote: Data as of or for the three months ended June 30, 2020 (1) Represents committed loan amount. Local vs. National(1) Term vs. Construction(1) Portfolio Highlights Hotel Flags(1) 5.79% of Total Po
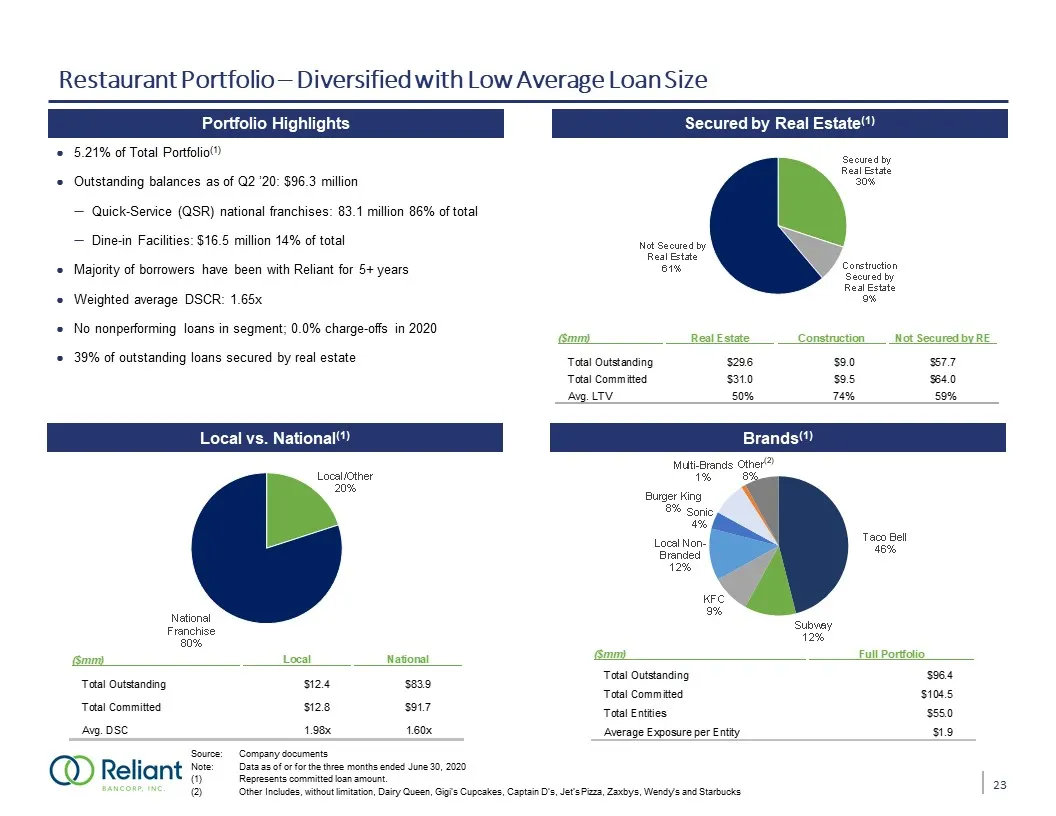
Slide 24: Restaurant Portfolio – Diversified with Low Average Loan Size
Restaurant Portfolio – Diversified with Low Average Loan Size Source: Company documentsNote: Data as of or for the three months ended June 30, 2020(1) Represents committed loan amount.(2) Other Includes, without limitation, Dairy Queen, Gigi’s Cupcakes, Captain D’s, Jet’s Pizza, Zaxbys, Wendy’s and
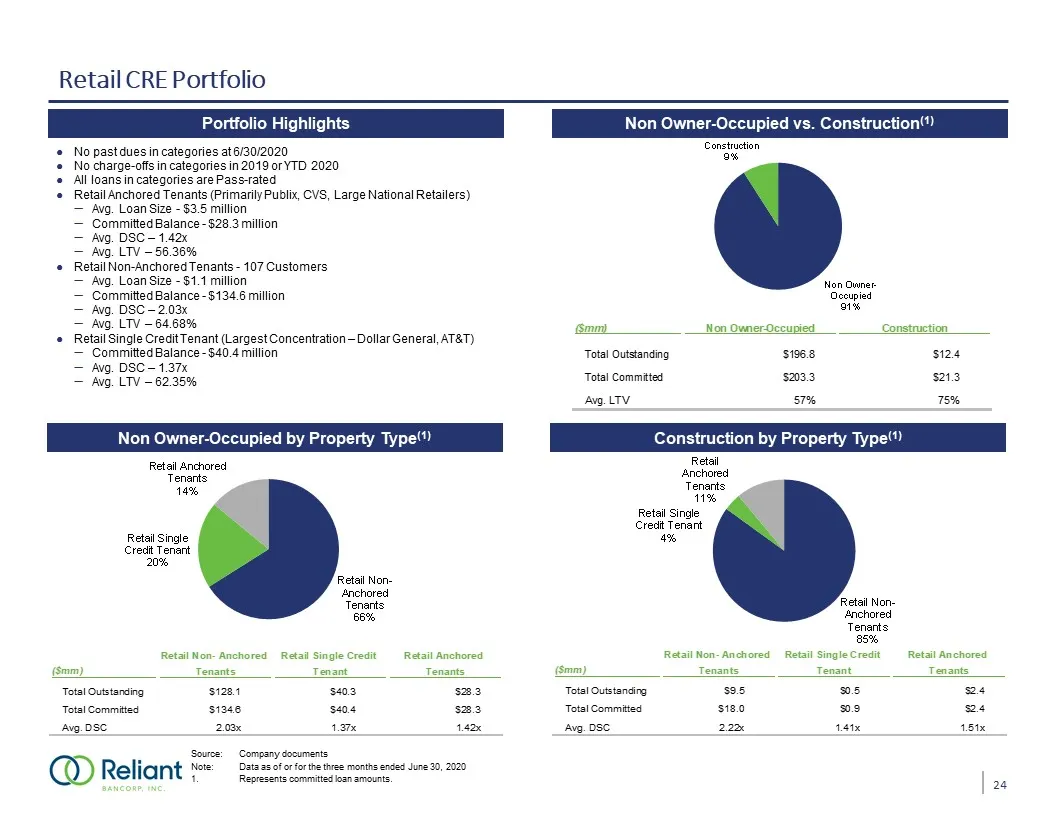
Slide 25: Retail CRE Portfolio
Retail CRE Portfolio Source: Company documentsNote: Data as of or for the three months ended June 30, 2020 Represents committed loan amounts. Total $93.7 million Total $124.4 million Portfolio Statistics Burger King Non Owner-Occupied by Property Type(1) Non Owner-Occupied vs. Construction(1) Portfo
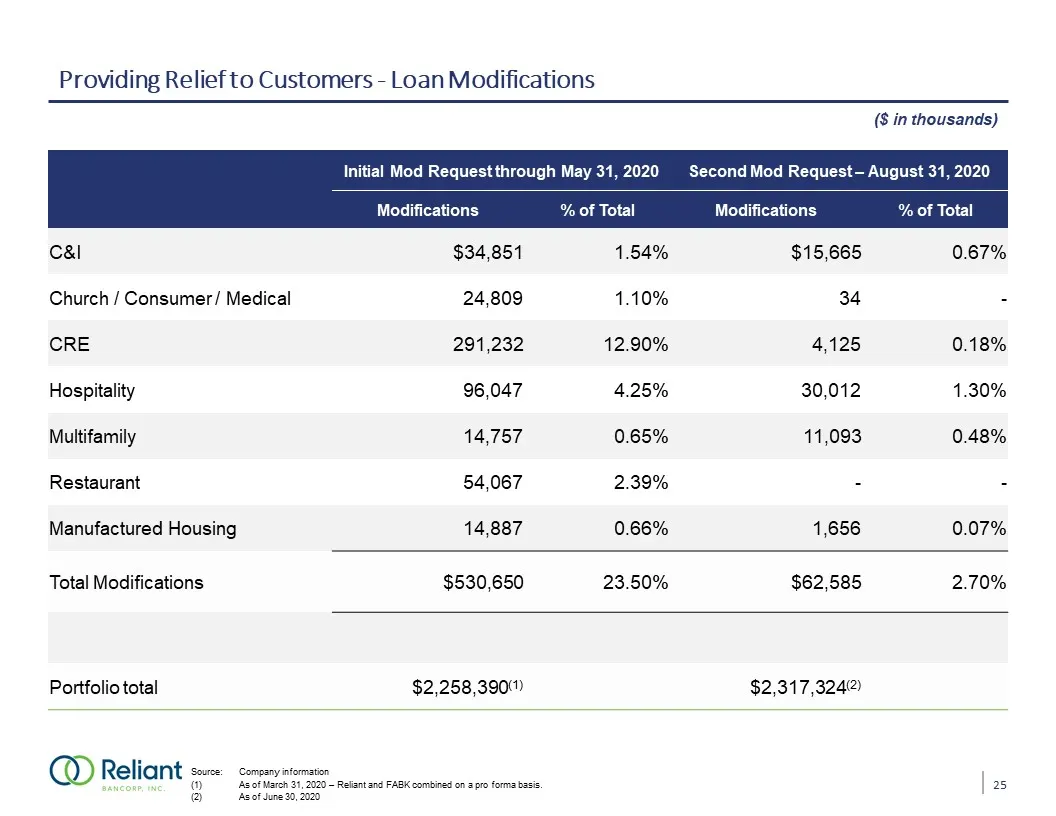
Slide 26: Providing Relief to Customers - Loan Modifications
Providing Relief to Customers - Loan Modifications Q4 19 NII impacted by 1.1 million gain on sale of securities$166 thousand gain on sale of OREQ1 19 NII impacted by$131 thousand gain on sale of securities Initial Mod Request through May 31, 2020 Second Mod Request – August 31, 2020 Modifications %
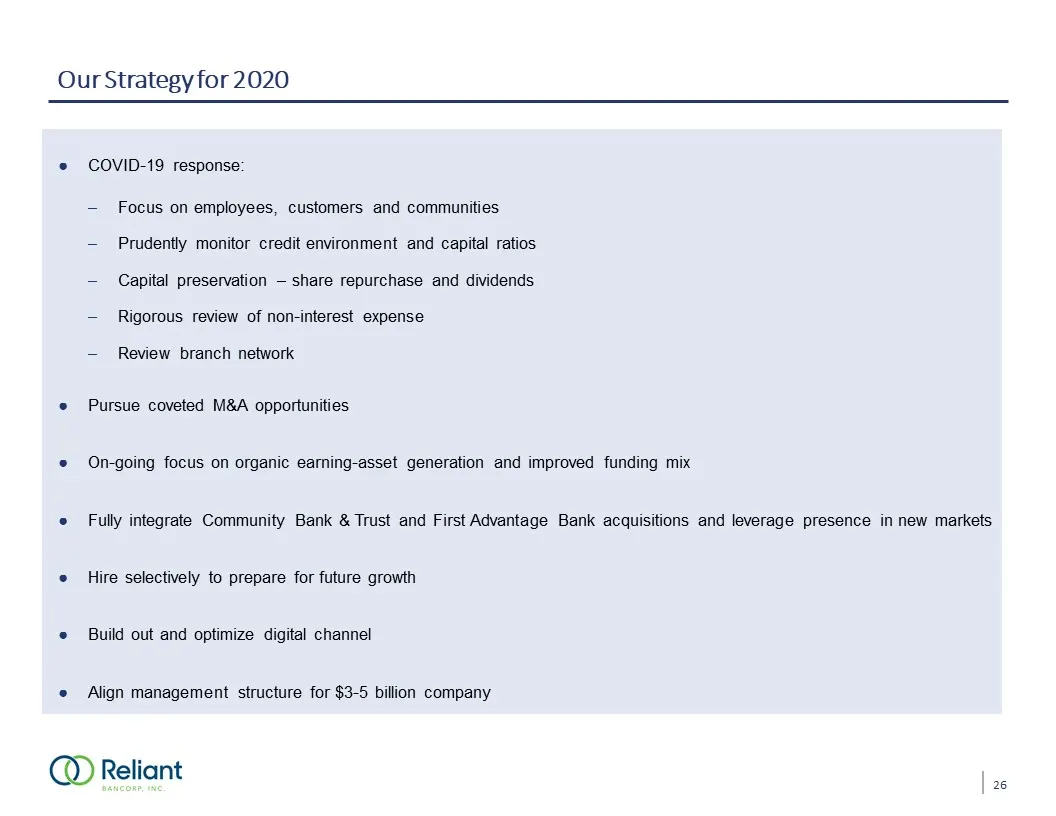
Slide 27: Our Strategy for 2020
Our Strategy for 2020 COVID-19 response:Focus on employees, customers and communitiesPrudently monitor credit environment and capital ratiosCapital preservation – share repurchase and dividendsRigorous review of non-interest expenseReview branch networkPursue coveted M&A opportunitiesOn-going focus

Slide 28: Appendix
GROW TOGETHER Appendix
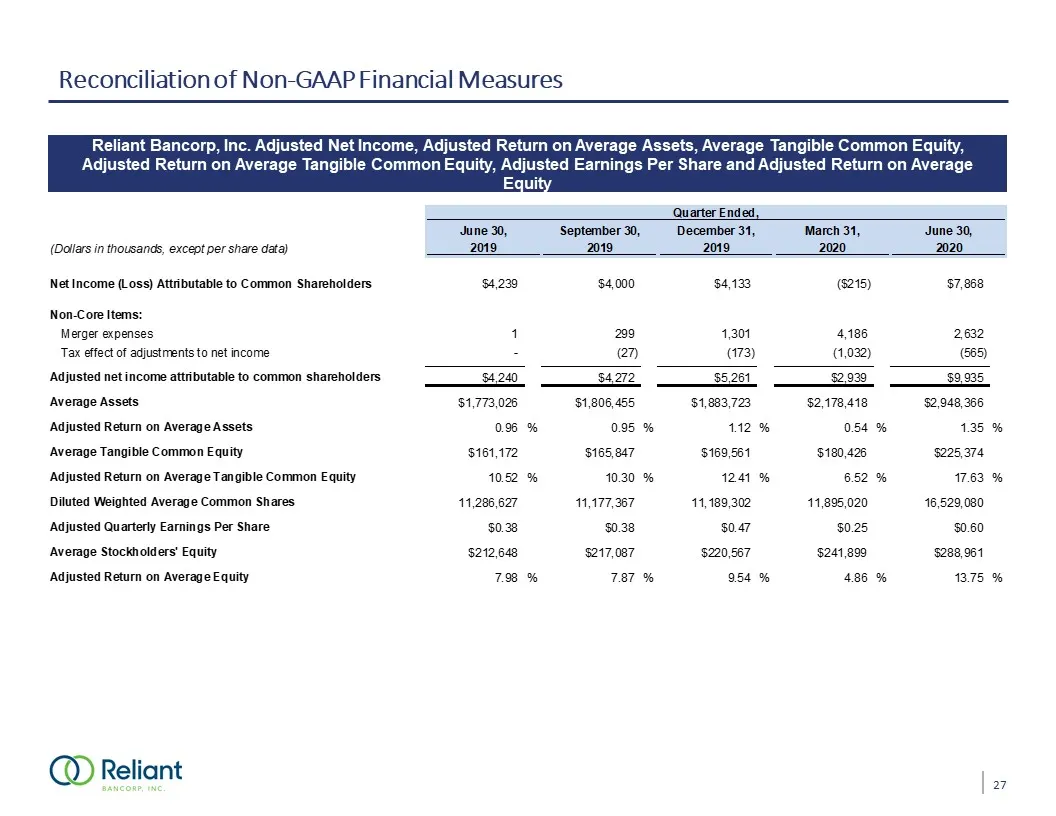
Slide 29: Reconciliation of Non-GAAP Financial Measures
Reconciliation of Non-GAAP Financial Measures Reliant Bancorp, Inc. Adjusted Net Income, Adjusted Return on Average Assets, Average Tangible Common Equity, Adjusted Return on Average Tangible Common Equity, Adjusted Earnings Per Share and Adjusted Return on Average Equity 27
Slide 30: Reconciliation of Non-GAAP Financial Measures
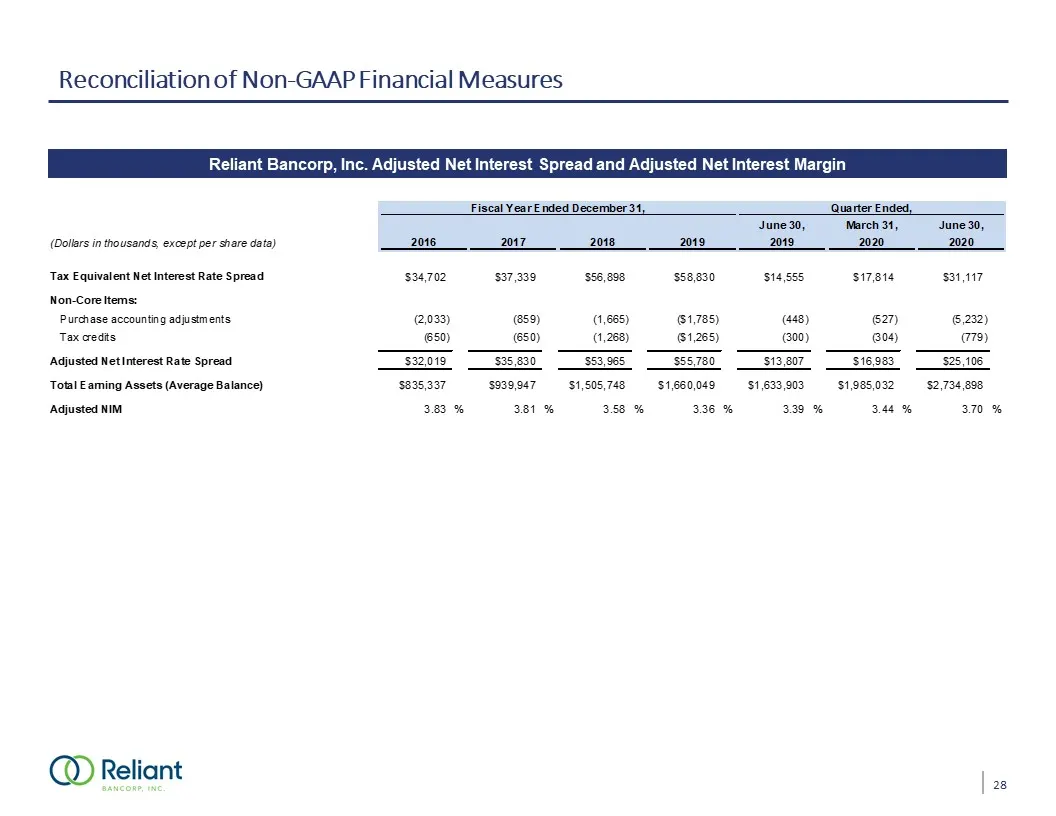
Reconciliation of Non-GAAP Financial Measures Reliant Bancorp, Inc. Adjusted Net Interest Spread and Adjusted Net Interest Margin 28
Slide 31: Reconciliation of Non-GAAP Financial Measures
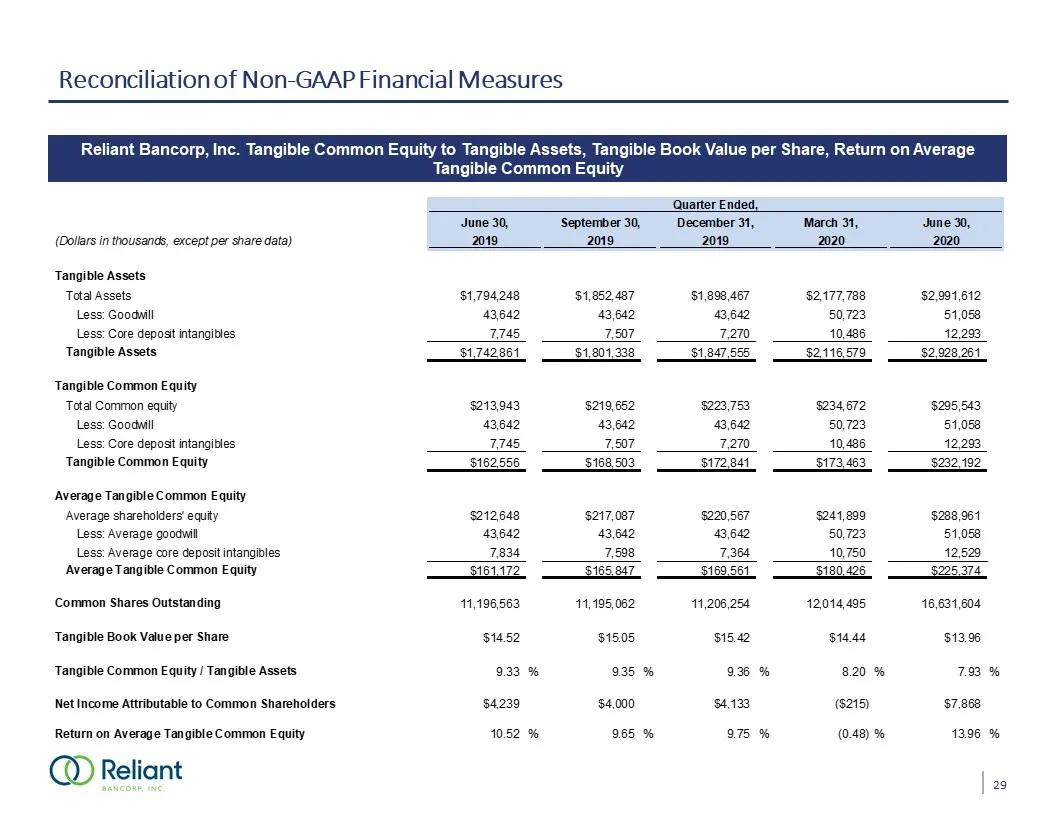
Reconciliation of Non-GAAP Financial Measures Reliant Bancorp, Inc. Tangible Common Equity to Tangible Assets, Tangible Book Value per Share, Return on Average Tangible Common Equity 29
Slide 32: Reconciliation of Non-GAAP Financial Measures
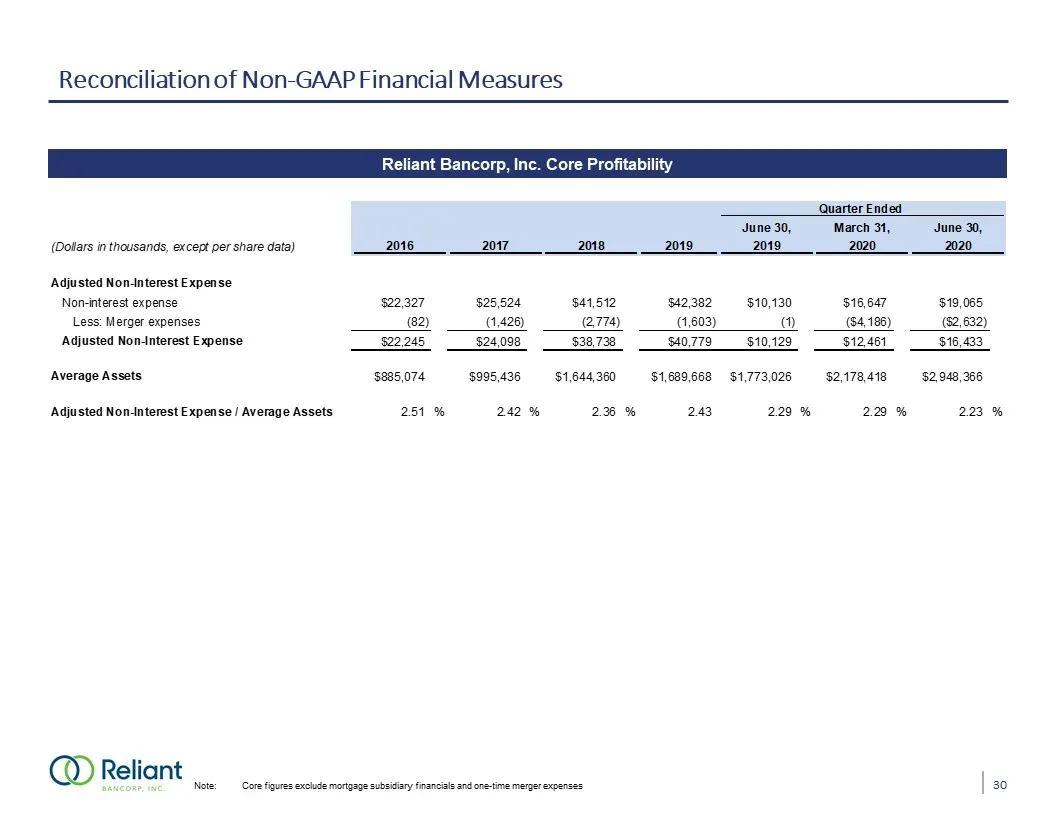
Reconciliation of Non-GAAP Financial Measures Reliant Bancorp, Inc. Core Profitability Note: Core figures exclude mortgage subsidiary financials and one-time merger expenses 30
Slide 33: Reconciliation of Non-GAAP Financial Measures
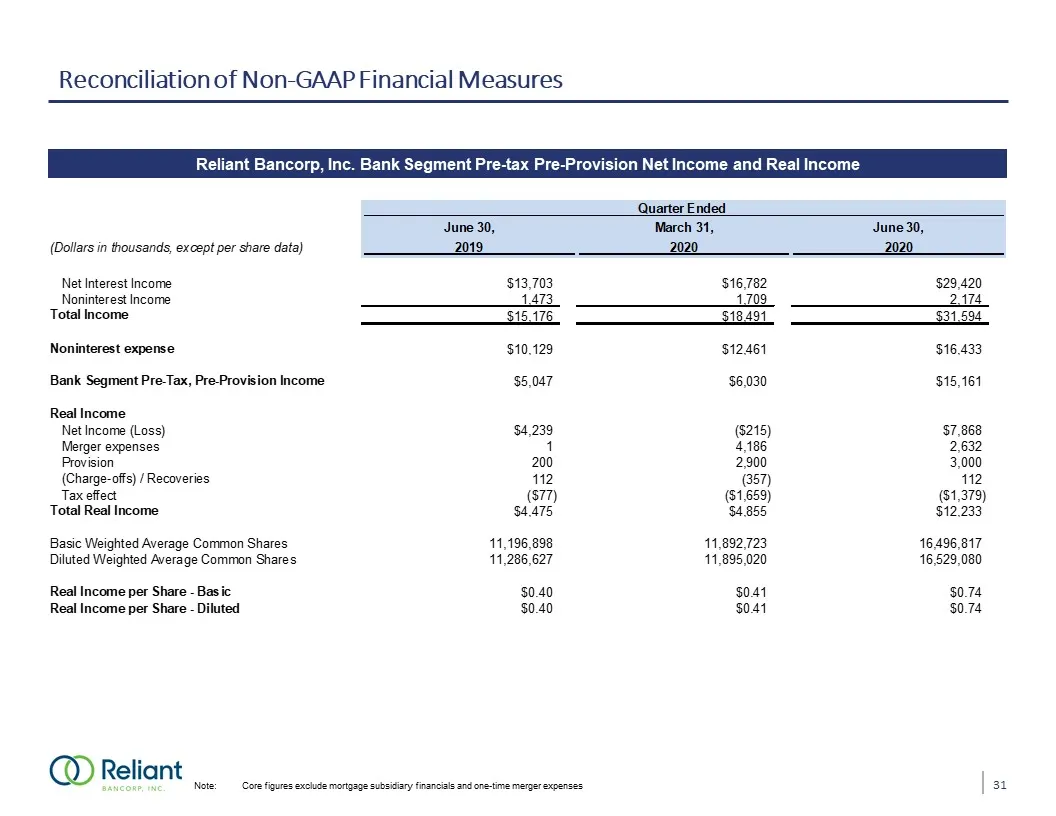
Reconciliation of Non-GAAP Financial Measures Reliant Bancorp, Inc. Bank Segment Pre-tax Pre-Provision Net Income and Real Income Note: Core figures exclude mortgage subsidiary financials and one-time merger expenses 31
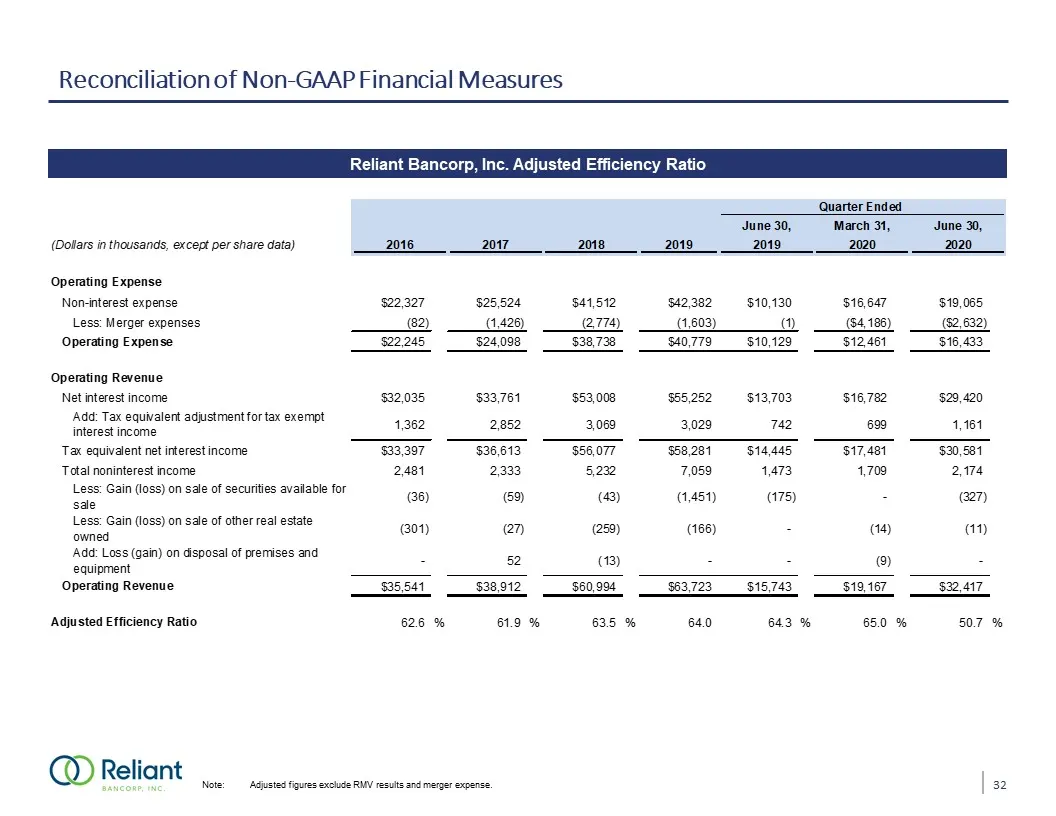
Slide 34: Reconciliation of Non-GAAP Financial Measures
Reconciliation of Non-GAAP Financial Measures Reliant Bancorp, Inc. Adjusted Efficiency Ratio Note: Adjusted figures exclude RMV results and merger expense. 32
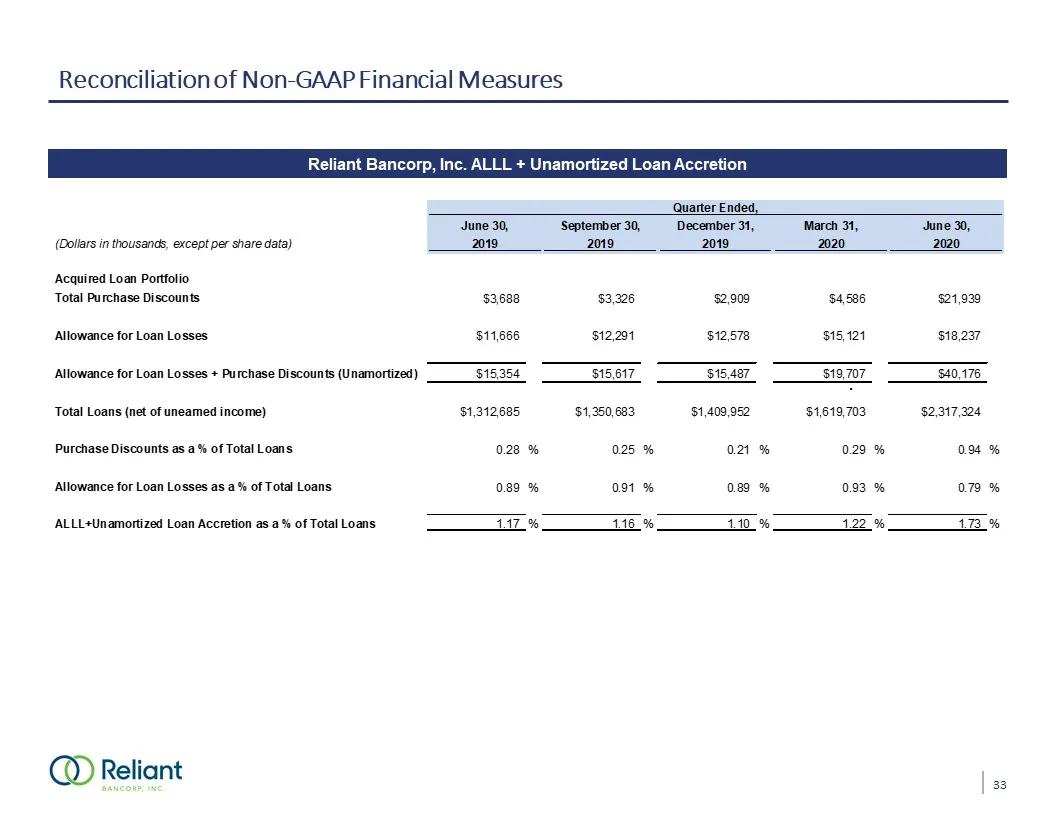
Slide 35: Reconciliation of Non-GAAP Financial Measures
Reconciliation of Non-GAAP Financial Measures Reliant Bancorp, Inc. ALLL + Unamortized Loan Accretion 33
Source: SEC EDGAR · 8-K filed Sep 9, 2020
More decks from Reliant Bancorp Inc
 Q3 2021 Earnings Presentation29 slides · Oct 21, 2021
 Q2 2021 Earnings Presentation28 slides · Jul 21, 2021
 Merger or Acquisition (July 2021)13 slides · Jul 15, 2021
 Gulf South Bank Conference 202128 slides · Apr 30, 2021
 Q1 2021 Earnings Presentation18 slides · Apr 22, 2021
 Raymond James Virtual Investor Meetings 202130 slides · Mar 10, 2021