Front Yard Residential — Investor Presentation (June 2019)
26 slides from Front Yard Residential's investor presentation, Jun 4, 2019
Slide 1: Investor Presentation June 2019
Investor Presentation June 2019 George Ellison, CEO Robin Lowe, CFO home.welcome © 2019 Front Yard Residential. All rights reserved. 1
Slide 2: Forward-looking Statements
Forward-looking Statements This presentation contains forward-looking statements within the meaning of Section 27A of the Securities Act of 1933, as amended, and Section 21E of the Securities Exchange Act of 1934, as amended, regarding management’s beliefs, estimates, projections, anticipations and
Slide 3: Executive Summary and Investment Highlights
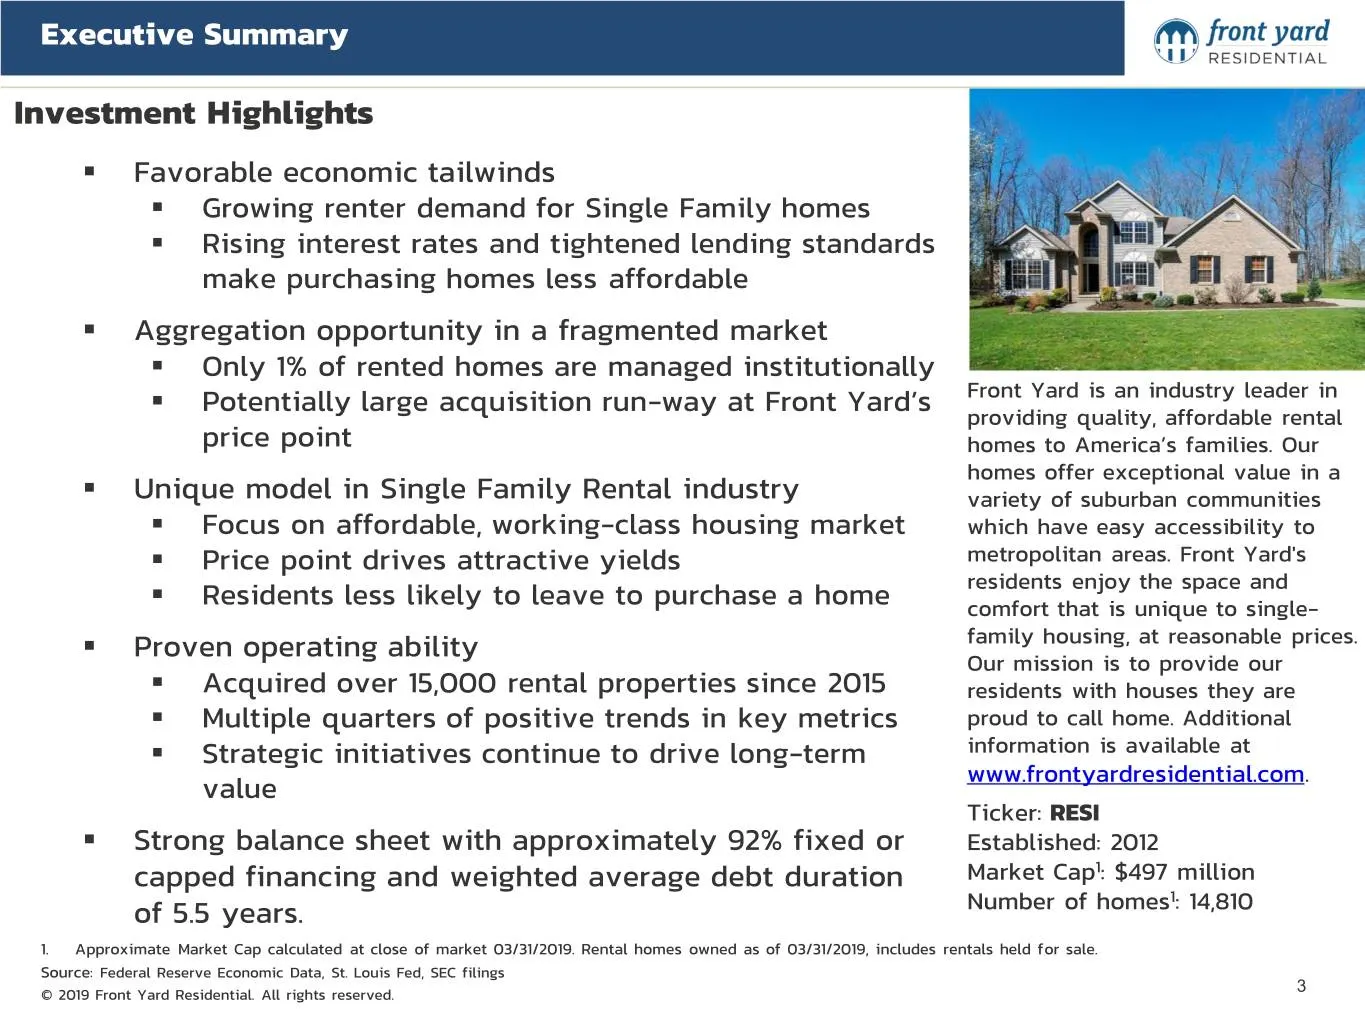
Executive Summary Investment Highlights . Favorable economic tailwinds . Growing renter demand for Single Family homes . Rising interest rates and tightened lending standards make purchasing homes less affordable . Aggregation opportunity in a fragmented market . Only 1% of rented homes are managed
Slide 4: Strong Fundamentals and Opportunity in Affordable Housing
Strong Fundamentals and Opportunity in Affordable Housing © 2019 Front Yard Residential. All rights reserved. 4
Slide 5: Housing by Population
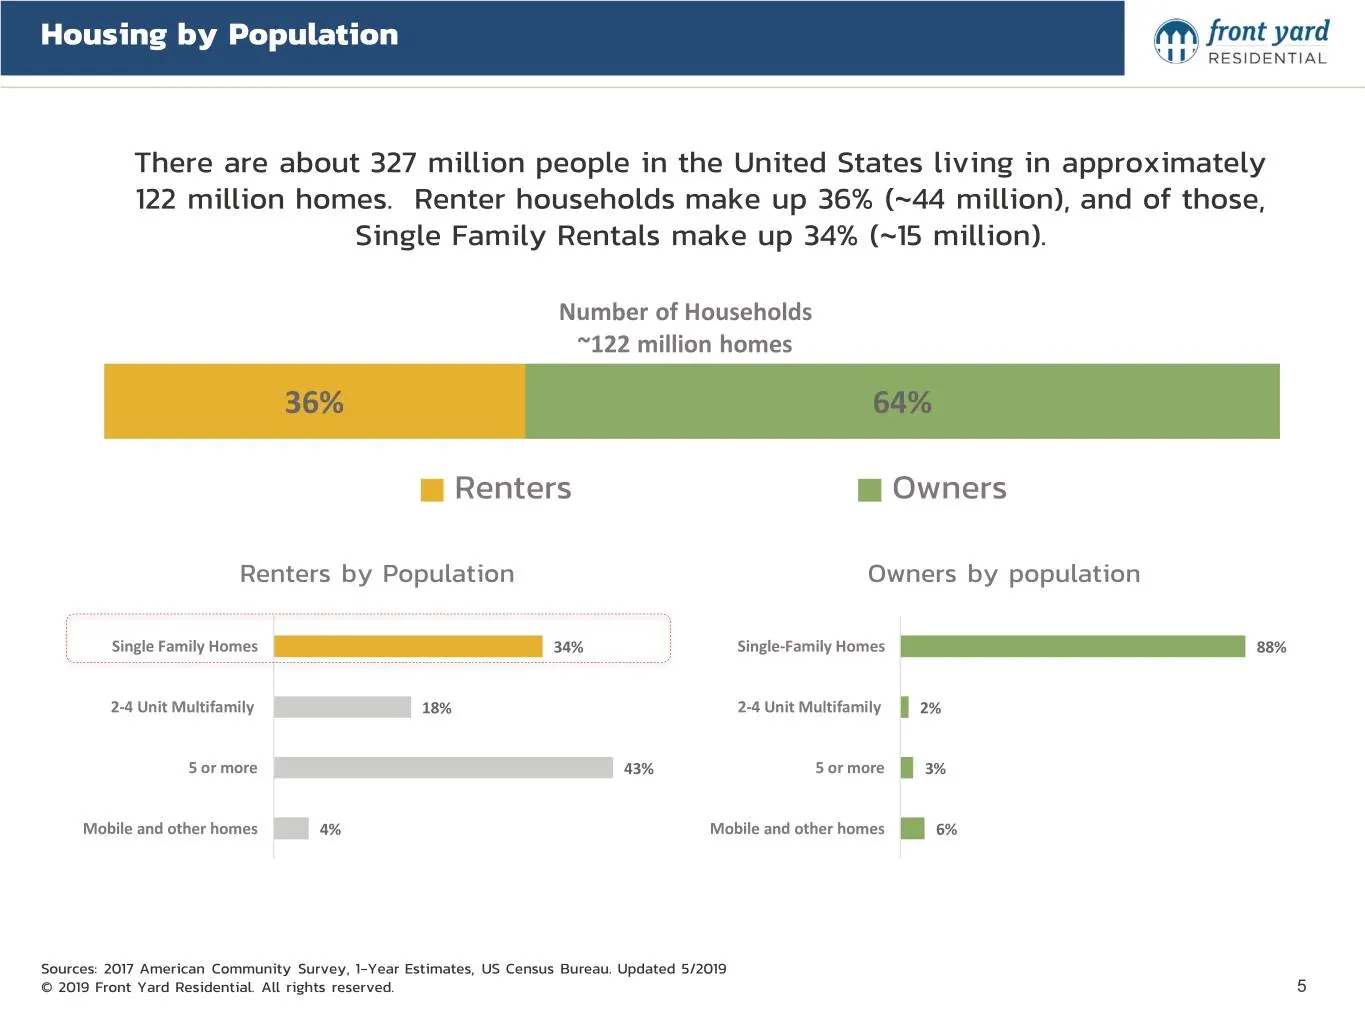
Housing by Population There are about 327 million people in the United States living in approximately 122 million homes. Renter households make up 36% (~44 million), and of those, Single Family Rentals make up 34% (~15 million). Number of Households ~122 million homes 36% 64% Renters Owners Renters
Slide 6: Rental Demand Increasing
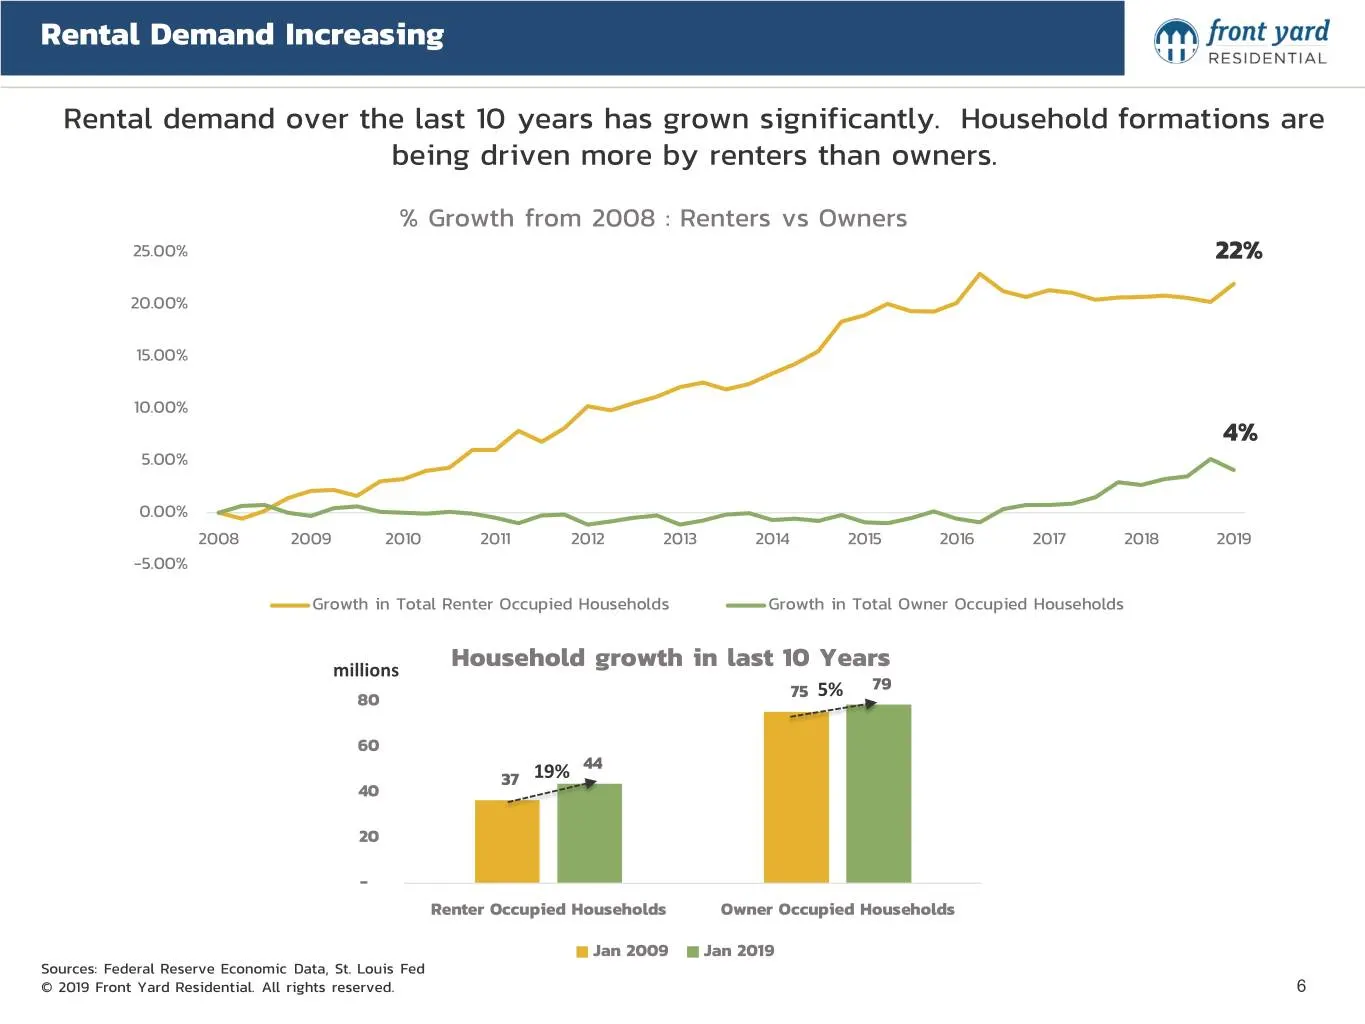
Rental Demand Increasing Rental demand over the last 10 years has grown significantly. Household formations are being driven more by renters than owners. % Growth from 2008 : Renters vs Owners 25.00% 22% 20.00% 15.00% 10.00% 4% 5.00% 0.00% 2008 2009 2010 2011 2012 2013 2014 2015 2016 2017 2018 2019
Slide 7: Institutional Opportunity
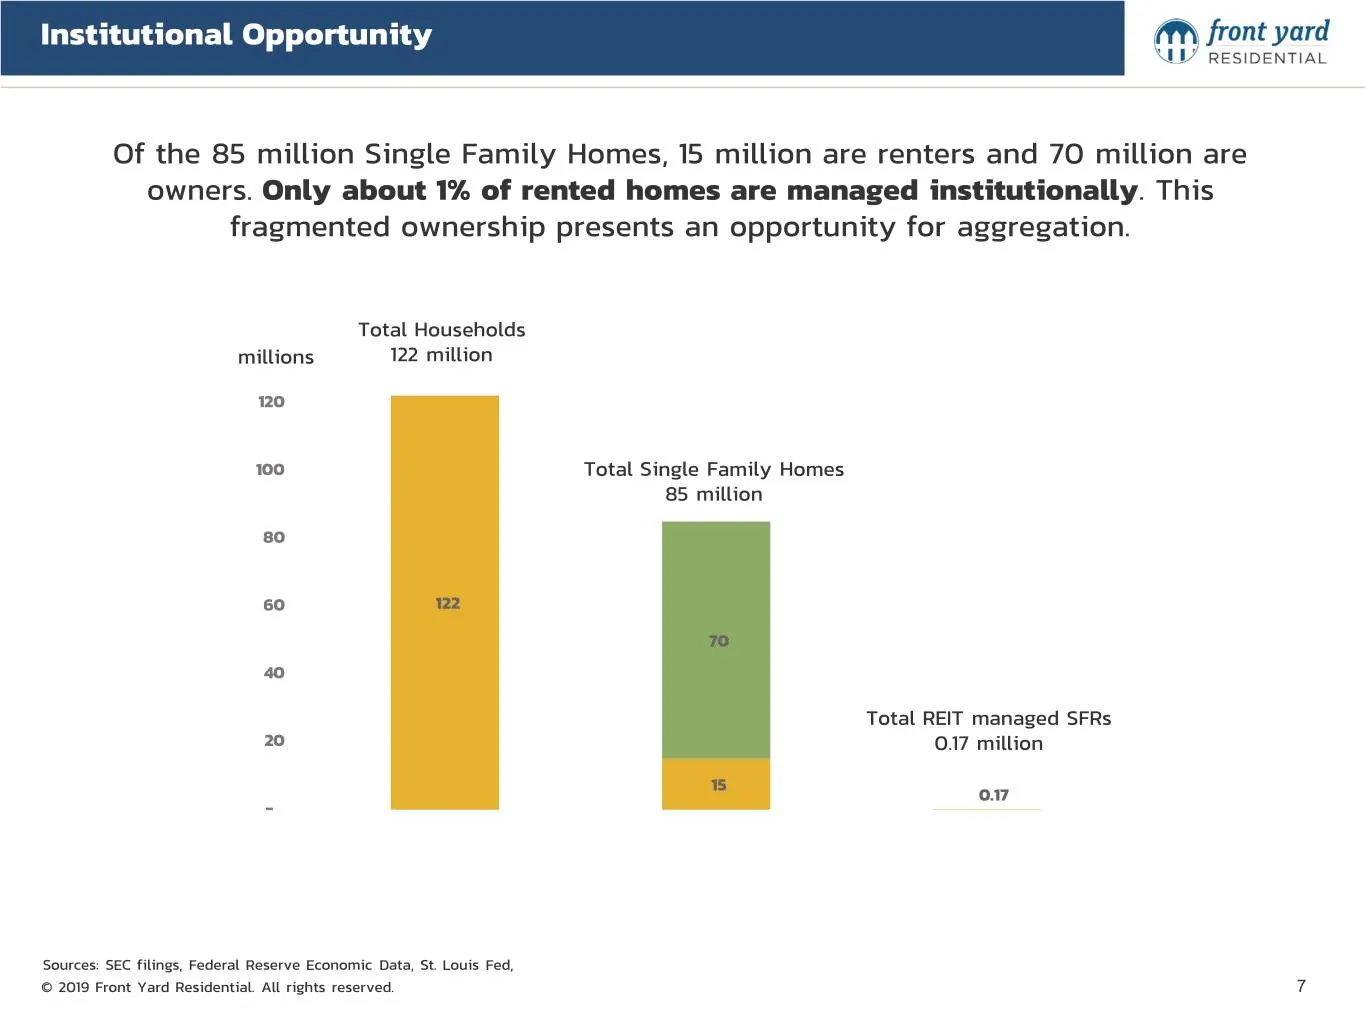
Institutional Opportunity Of the 85 million Single Family Homes, 15 million are renters and 70 million are owners. Only about 1% of rented homes are managed institutionally. This fragmented ownership presents an opportunity for aggregation. Total Households millions 122 million 120 100 Total Single
Slide 8: Positive Trends in Single Family Rental
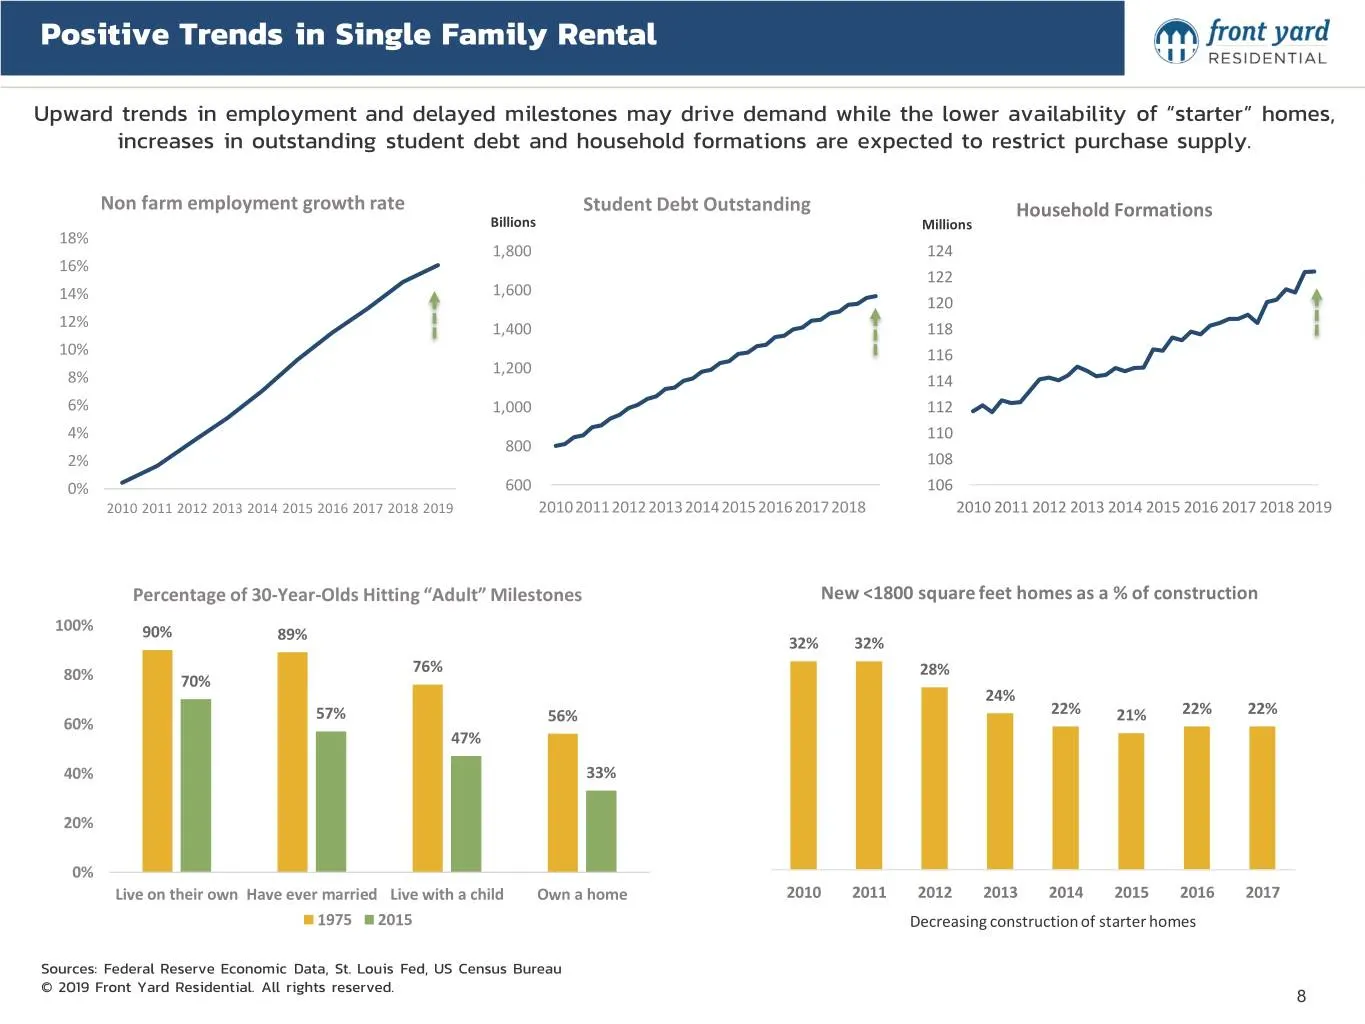
Positive Trends in Single Family Rental Upward trends in employment and delayed milestones may drive demand while the lower availability of “starter” homes, increases in outstanding student debt and household formations are expected to restrict purchase supply. Non farm employment growth rate Studen
Slide 9: Renter Household Growth and Supply Deficit of Housing Units
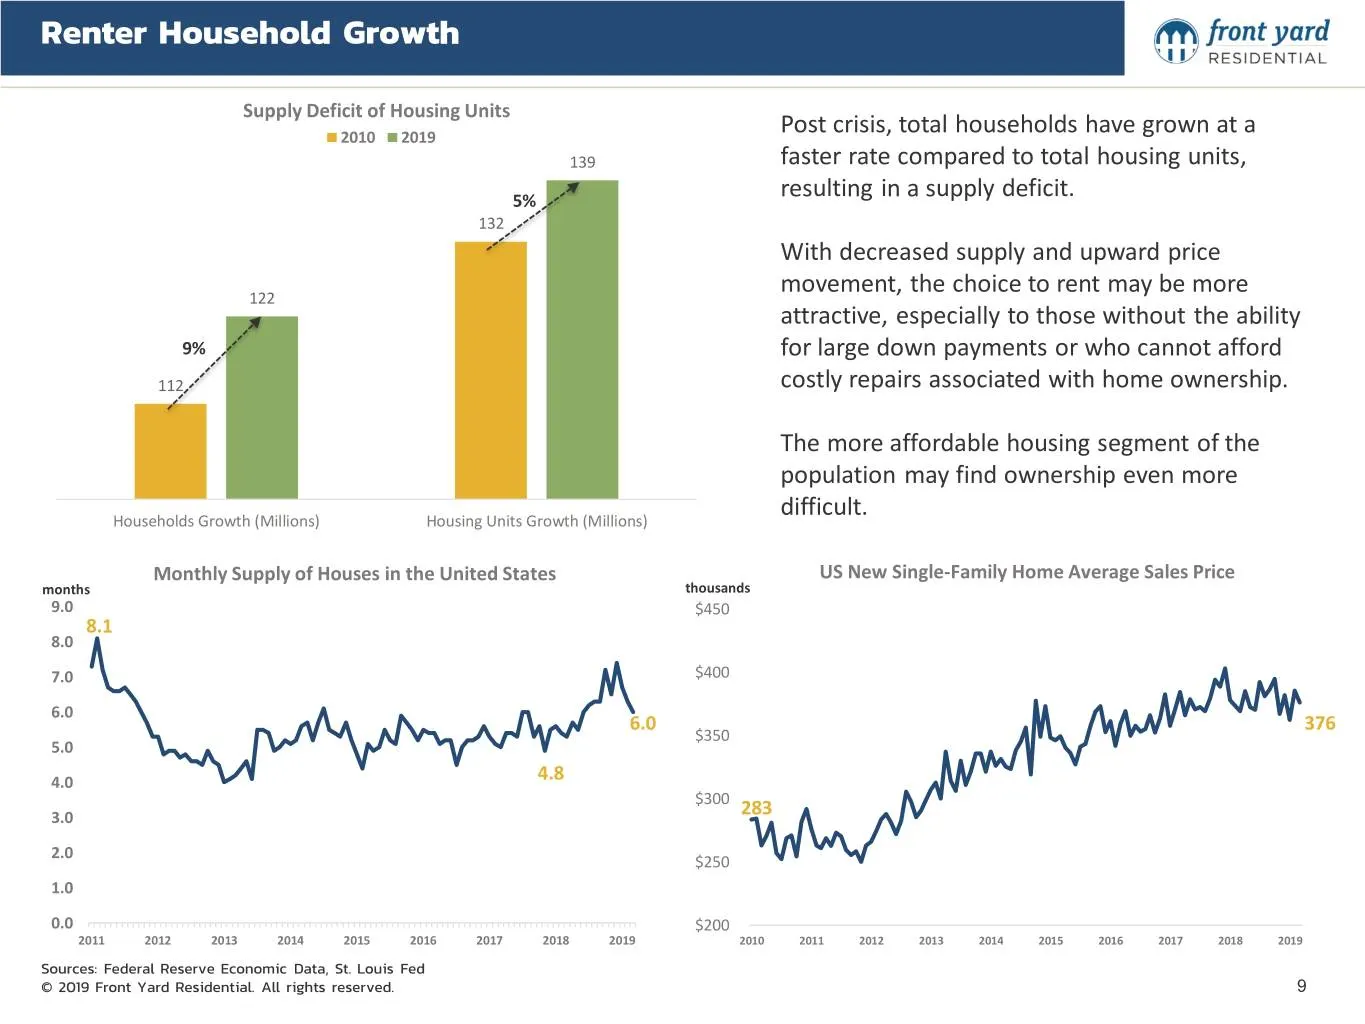
Renter Household Growth Supply Deficit of Housing Units 2010 2019 Post crisis, total households have grown at a 139 faster rate compared to total housing units, 5% resulting in a supply deficit. 132 With decreased supply and upward price movement, the choice to rent may be more 122 attractive, espec
Slide 10: Challenges in Home Ownership Financing
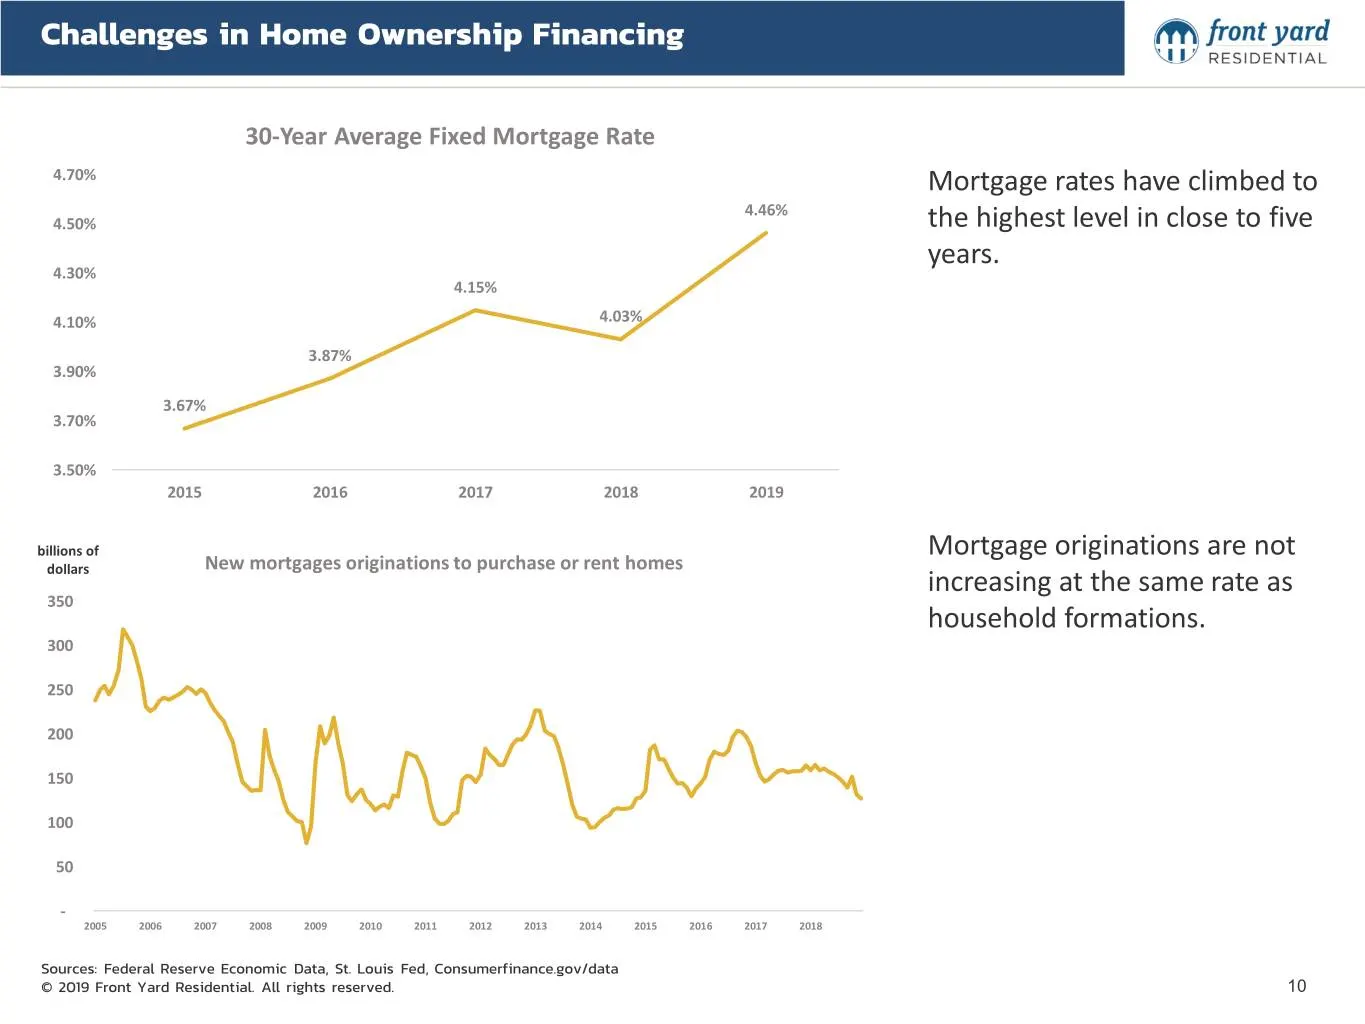
Challenges in Home Ownership Financing 30-Year Average Fixed Mortgage Rate 4.70% Mortgage rates have climbed to 4.46% 4.50% the highest level in close to five years. 4.30% 4.15% 4.10% 4.03% 3.87% 3.90% 3.67% 3.70% 3.50% 2015 2016 2017 2018 2019 billions of Mortgage originations are not New mortgages
Slide 11: FICO Distributions
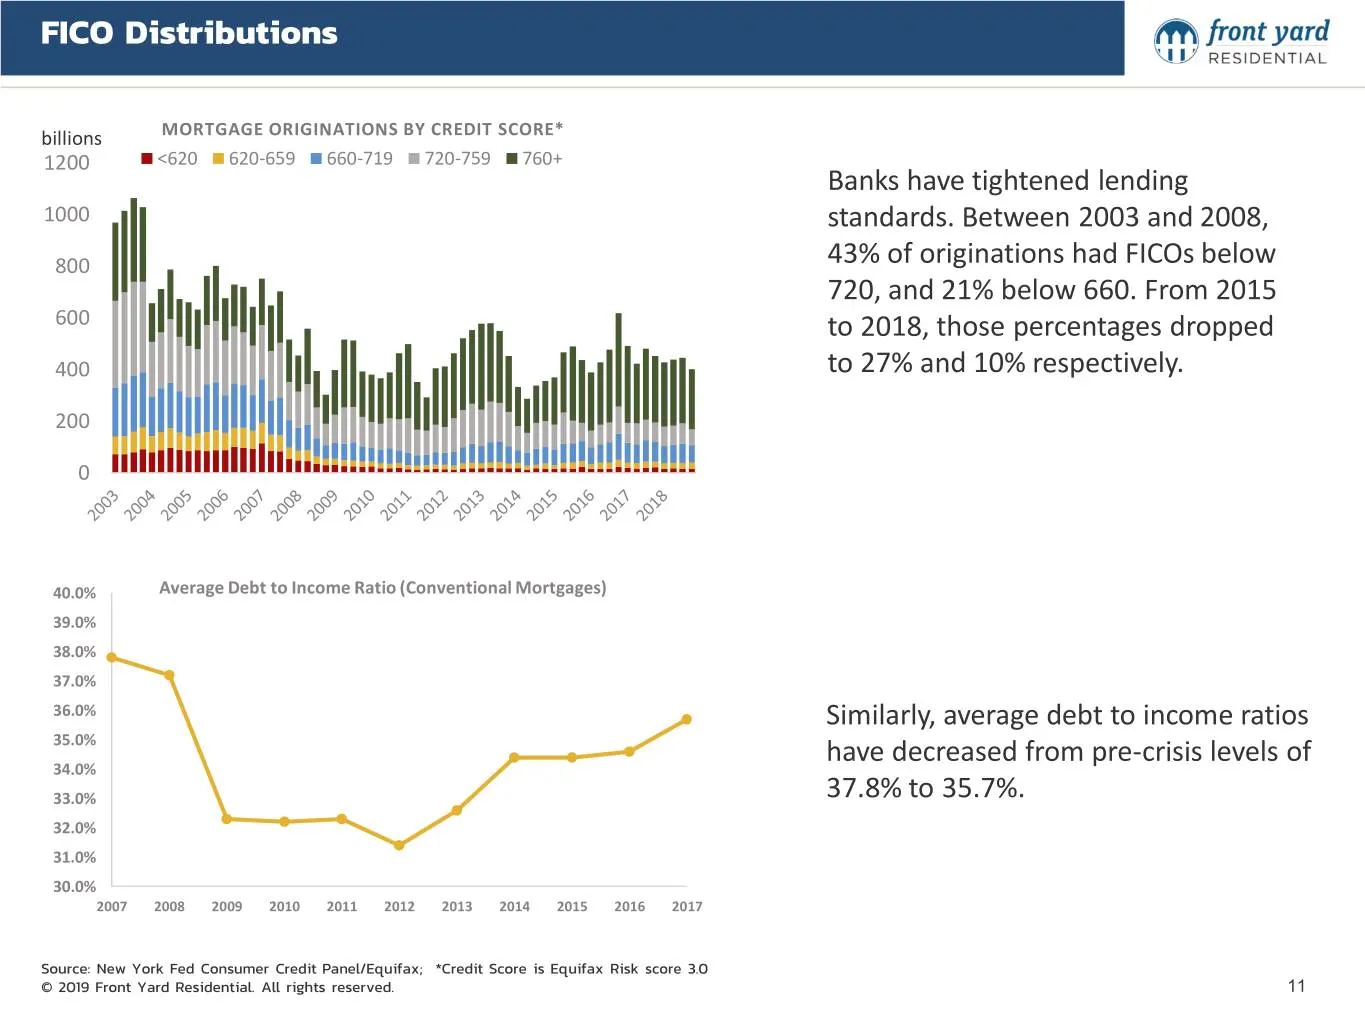
FICO Distributions billions MORTGAGE ORIGINATIONS BY CREDIT SCORE* 1200 <620 620-659 660-719 720-759 760+ Banks have tightened lending 1000 standards. Between 2003 and 2008, 800 43% of originations had FICOs below 720, and 21% below 660. From 2015 600 to 2018, those percentages dropped 400 to 27% an
Slide 12: Strong Growth and Operational Performance
Strong Growth and Operational Performance © 2019 Front Yard Residential. All rights reserved. 12

Slide 13: Mission Statement
Mission Statement Front Yard Residential is an industry leader in providing quality, affordable rental homes to America’s families. Our homes offer exceptional value in a variety of suburban communities across the US with access to quality education and jobs. We renovate each property to bring it up
Slide 14: Strong Performance on Initiatives
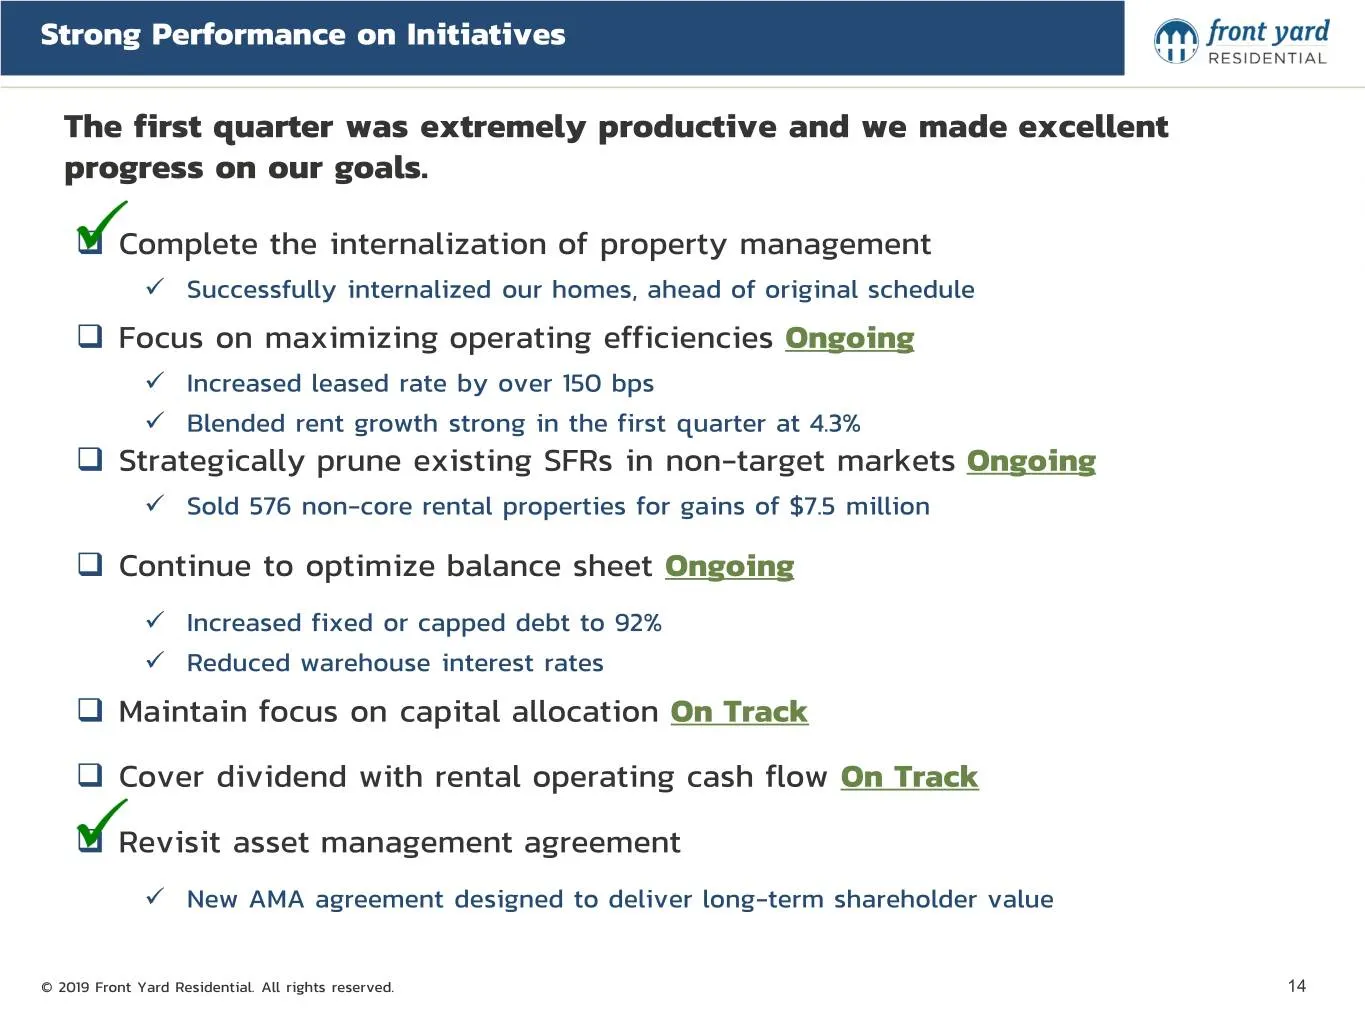
Strong Performance on Initiatives The first quarter was extremely productive and we made excellent progress on our goals. Complete the internalization of property management Successfully internalized our homes, ahead of original schedule Focus on maximizing operating efficiencies Ongoing Inc
Slide 15: Company Snapshot
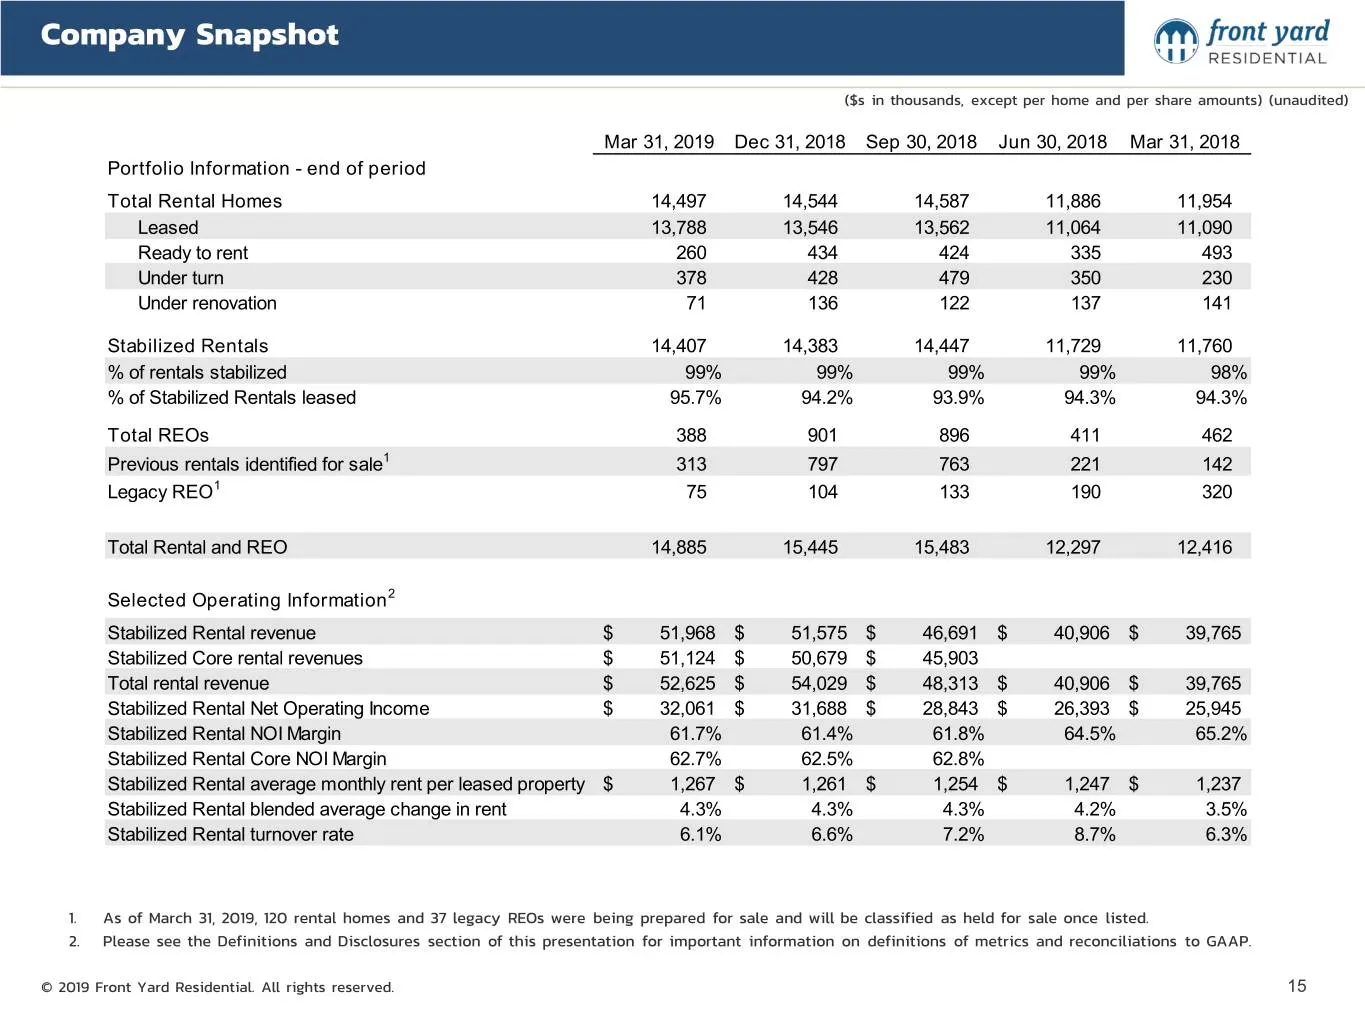
Company Snapshot ($s in thousands, except per home and per share amounts) (unaudited) Mar 31, 2019 Dec 31, 2018 Sep 30, 2018 Jun 30, 2018 Mar 31, 2018 Portfolio Information - end of period Total Rental Homes 14,497 14,544 14,587 11,886 11,954 Leased 13,788 13,546 13,562 11,064 11,090 Ready to rent 2
Slide 16: New AMA Agreement
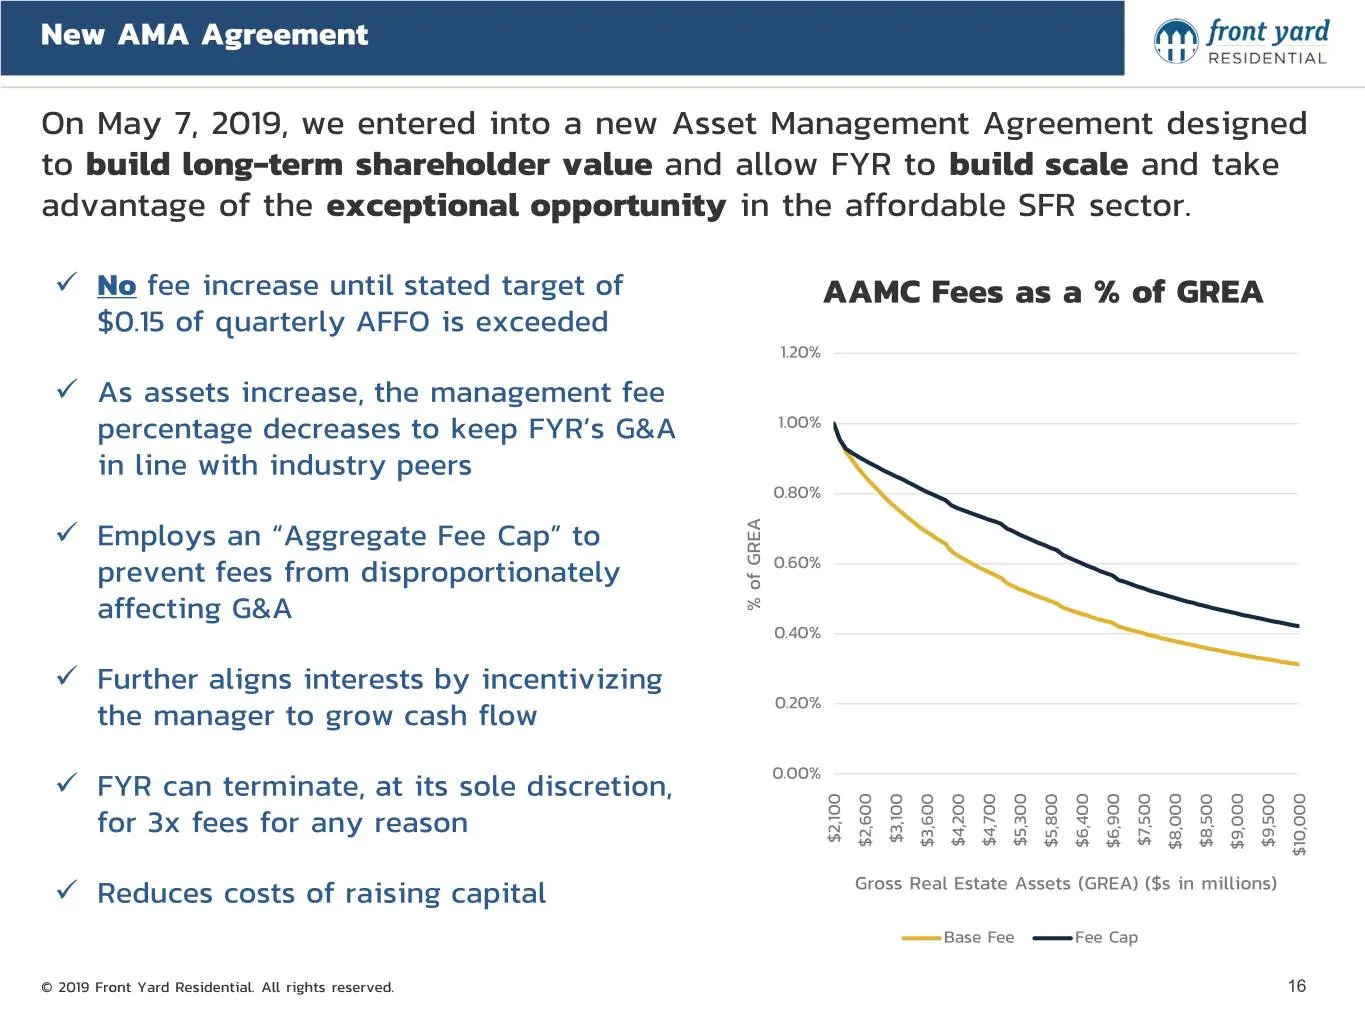
New AMA Agreement On May 7, 2019, we entered into a new Asset Management Agreement designed to build long-term shareholder value and allow FYR to build scale and take advantage of the exceptional opportunity in the affordable SFR sector. No fee increase until stated target of AAMC Fees as a % of G
Slide 17: Strong Demand Drivers and High Resident Retention
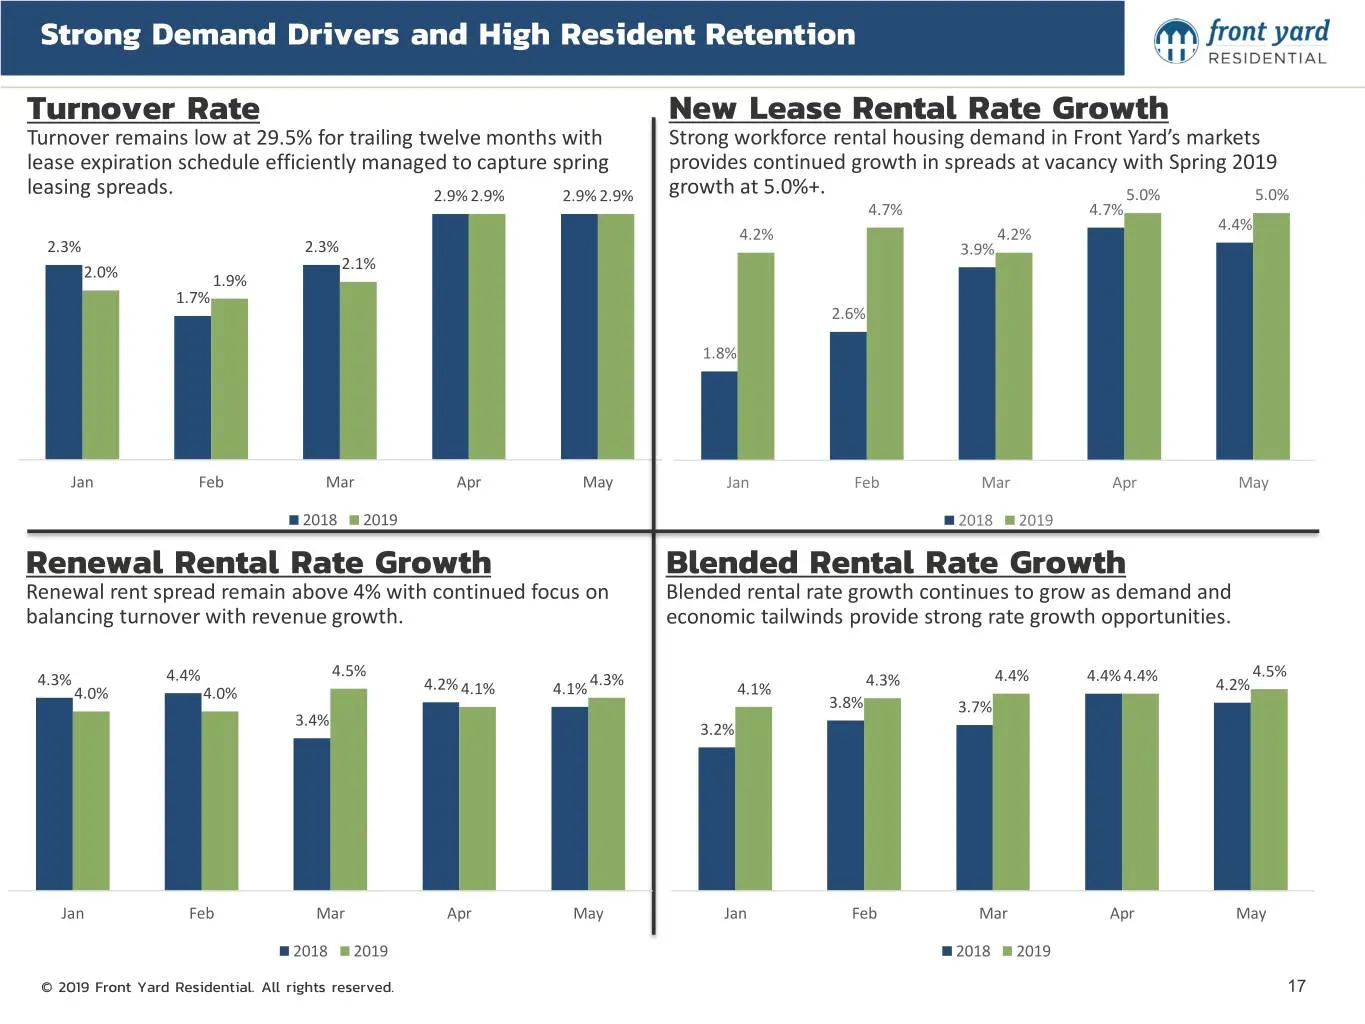
Strong Demand Drivers and High Resident Retention Turnover Rate New Lease Rental Rate Growth Turnover remains low at 29.5% for trailing twelve months with Strong workforce rental housing demand in Front Yard’s markets lease expiration schedule efficiently managed to capture spring provides continued
Slide 18: FFO and Core FFO
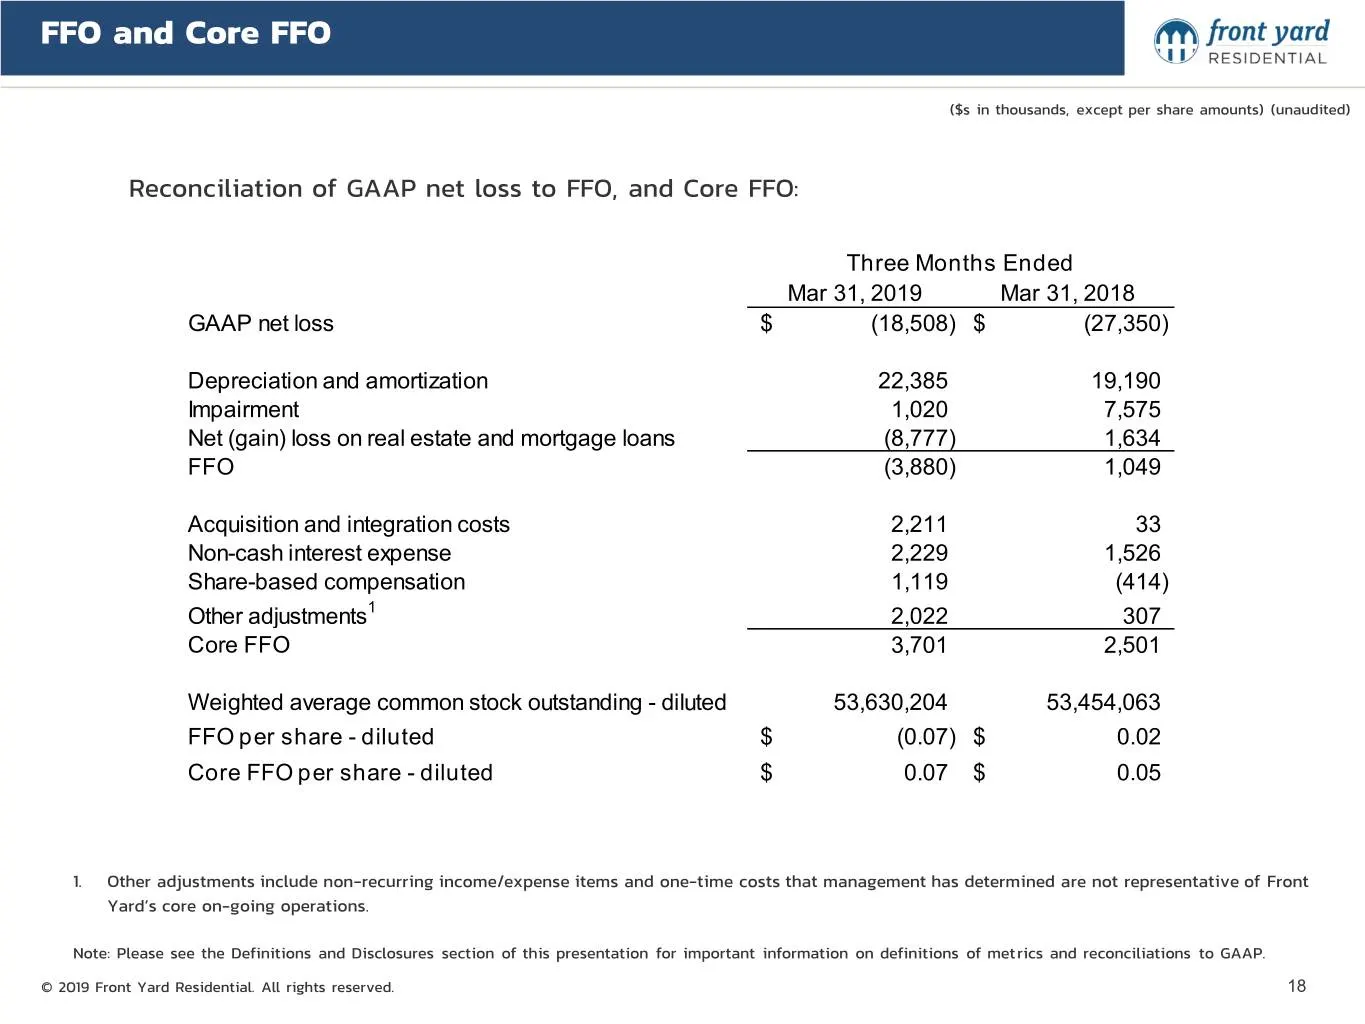
FFO and Core FFO ($s in thousands, except per share amounts) (unaudited) Reconciliation of GAAP net loss to FFO, and Core FFO: Three Months Ended Three Months Ended Mar 31, 2019 Mar 31, 2018 GAAP net loss $ (18,508) $ (27,350) Depreciation and amortization 22,385 19,190 Impairment 1,020 7,575 Net (g
Slide 19: Rental Portfolio Detail
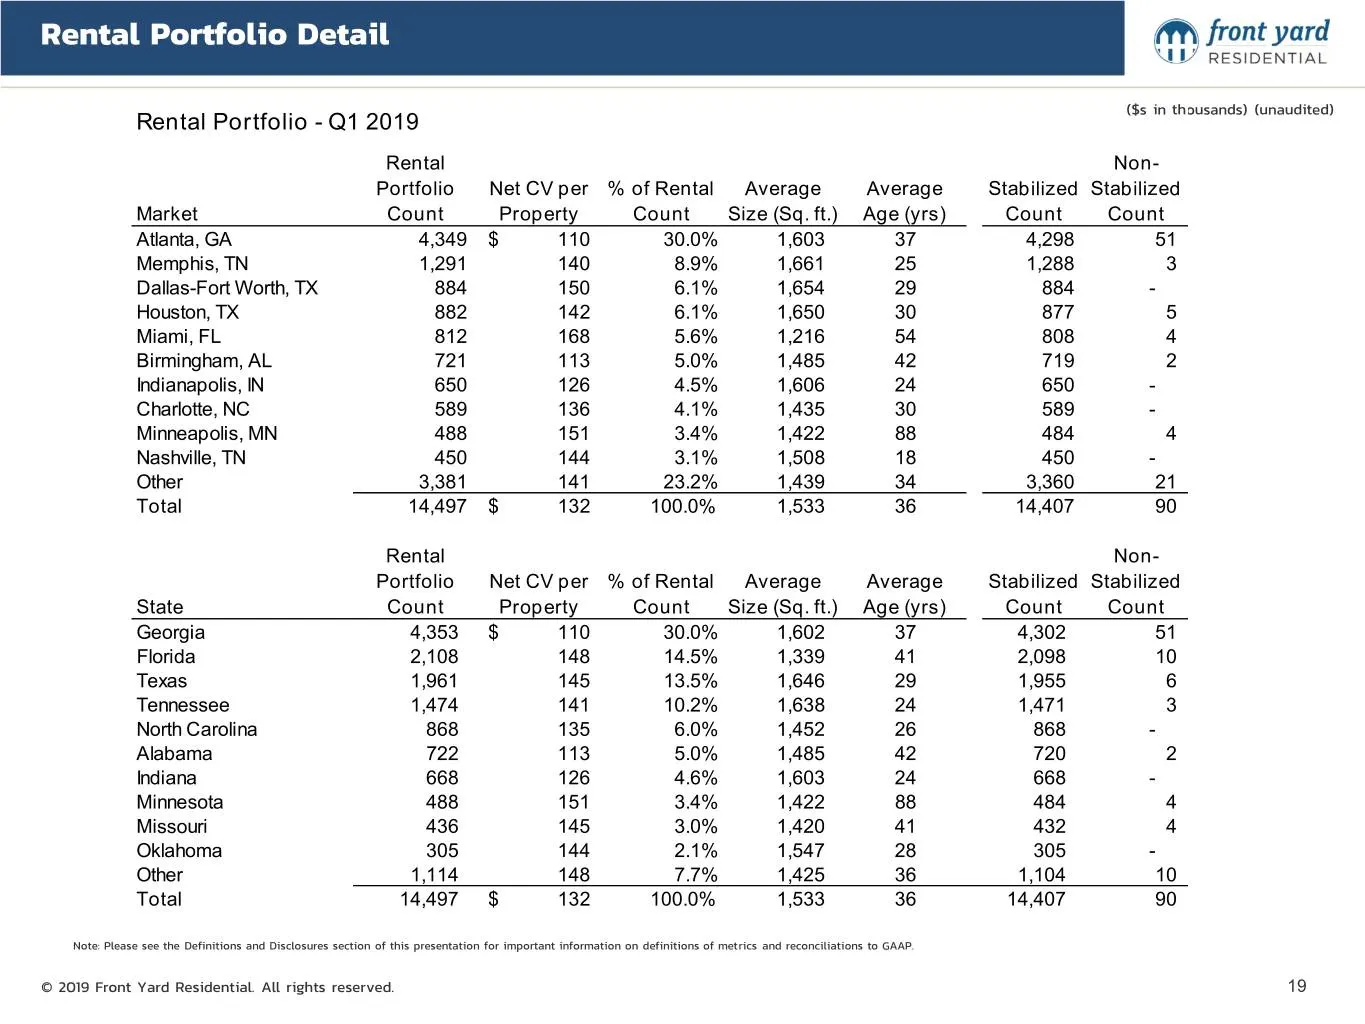
Rental Portfolio Detail ($s in thousands) (unaudited) Rental Portfolio - Q1 2019 Rental Non- Portfolio Net CV per % of Rental Average Average Stabilized Stabilized Market Count Property Count Size (Sq. ft.) Age (yrs) Count Count Atlanta, GA 4,349 $ 110 30.0% 1,603 37 4,298 51 Memphis, TN 1,291 140 8
Slide 20: Leasing Detail
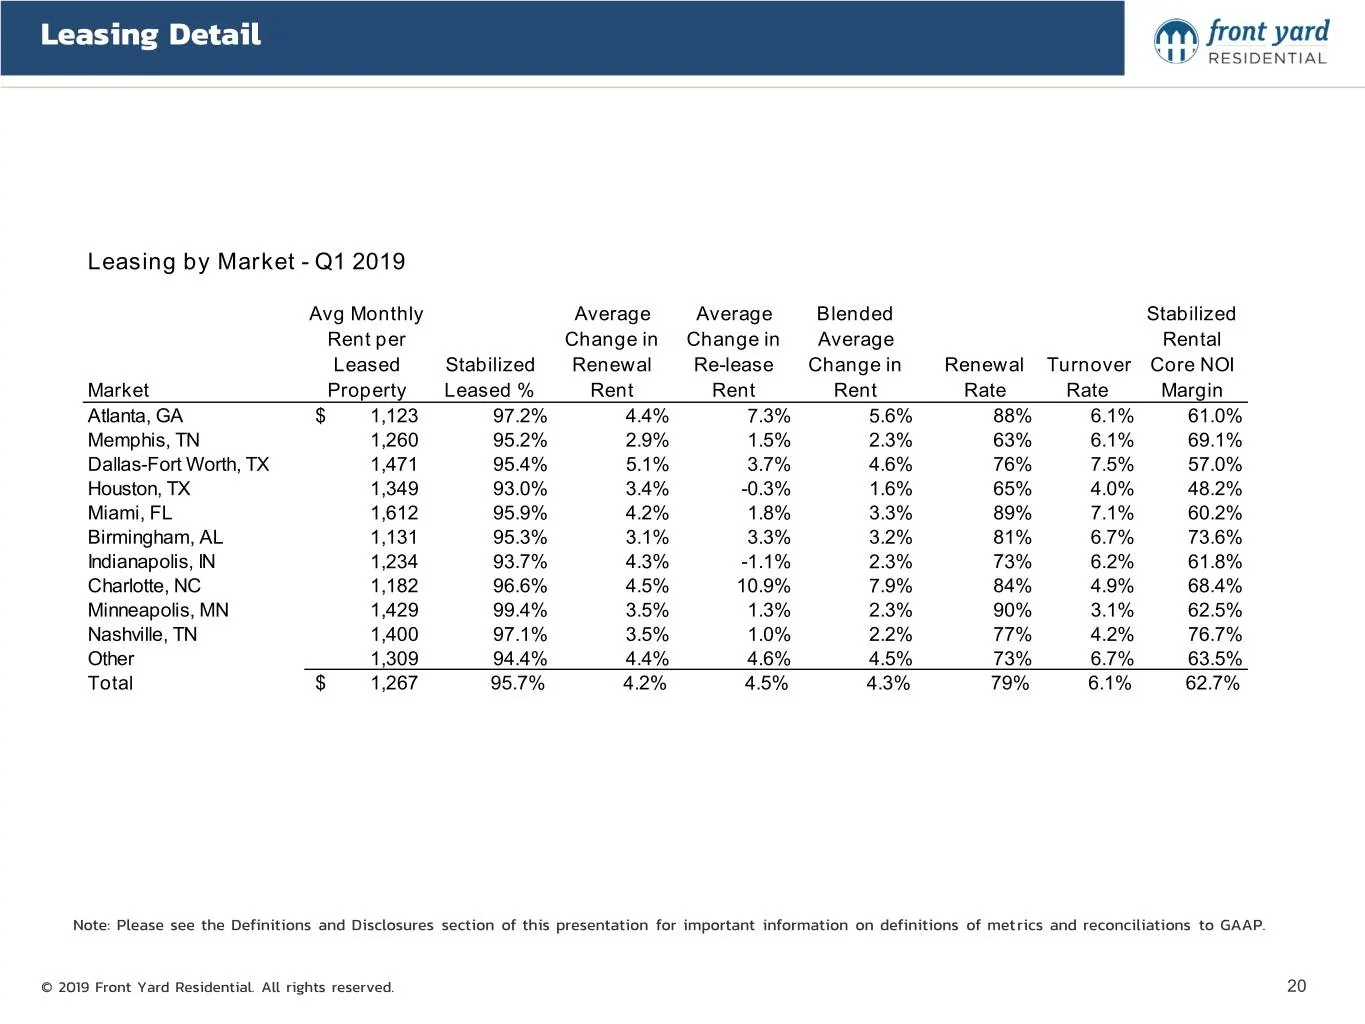
Leasing Detail Leasing by Market - Q1 2019 Avg Monthly Average Average Blended Stabilized Rent per Change in Change in Average Rental Leased Stabilized Renewal Re-lease Change in Renewal Turnover Core NOI Market Property Leased % Rent Rent Rent Rate Rate Margin Atlanta, GA $ 1,123 97.2% 4.4% 7.3% 5.
Slide 21: Definitions and Disclosures
Definitions and Disclosures © 2019 Front Yard Residential. All rights reserved. 21
Slide 22: Definitions and Disclosures
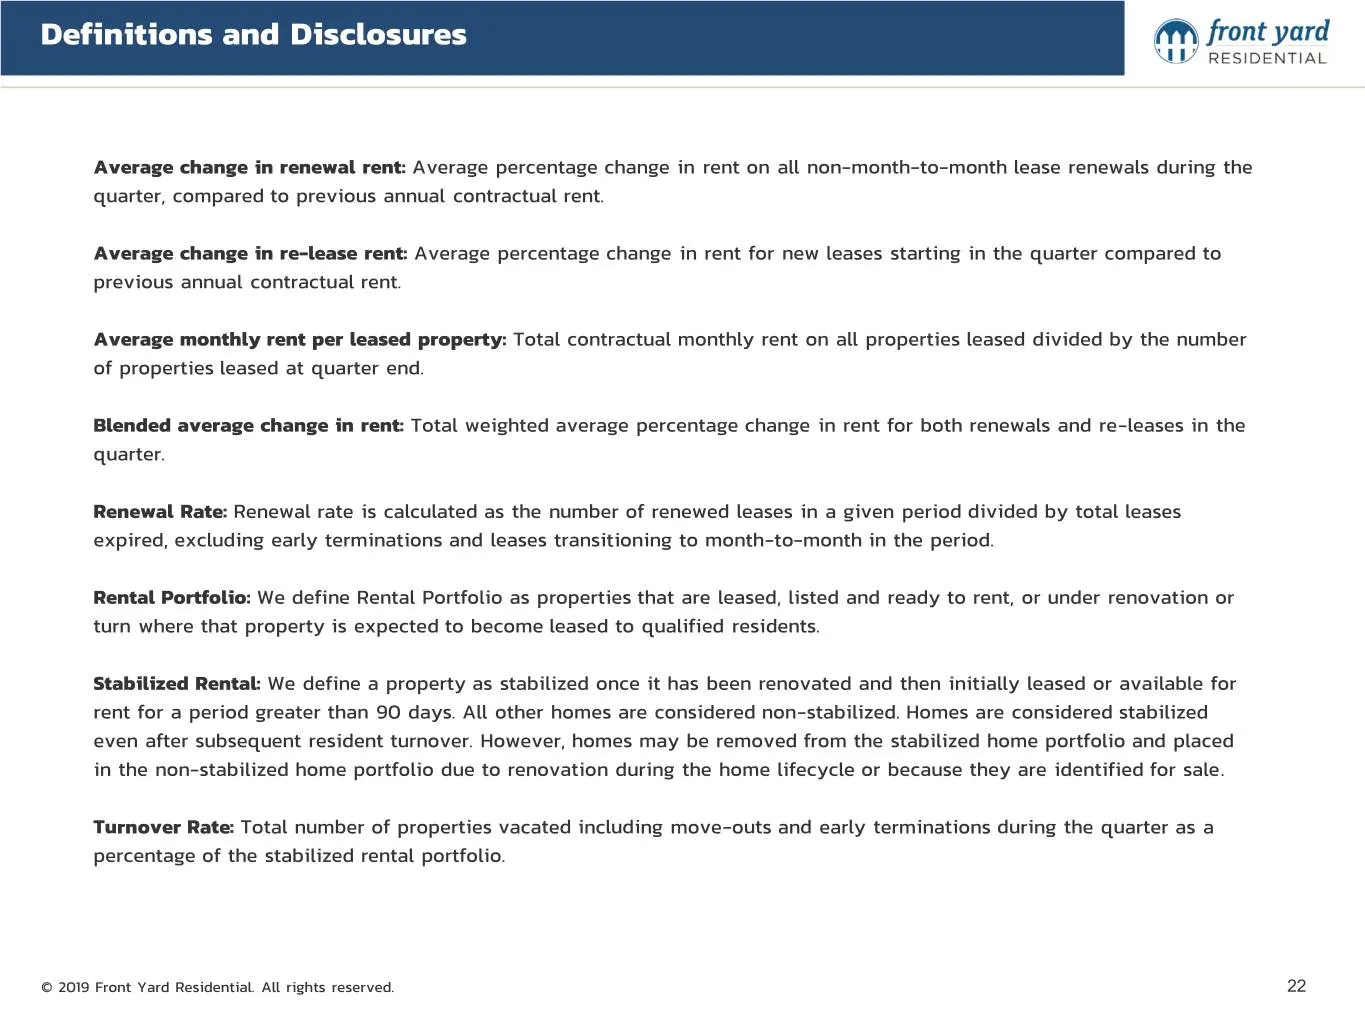
Definitions and Disclosures Average change in renewal rent: Average percentage change in rent on all non-month-to-month lease renewals during the quarter, compared to previous annual contractual rent. Average change in re-lease rent: Average percentage change in rent for new leases starting in the q
Slide 23: Definitions and Disclosures: FFO and Core FFO
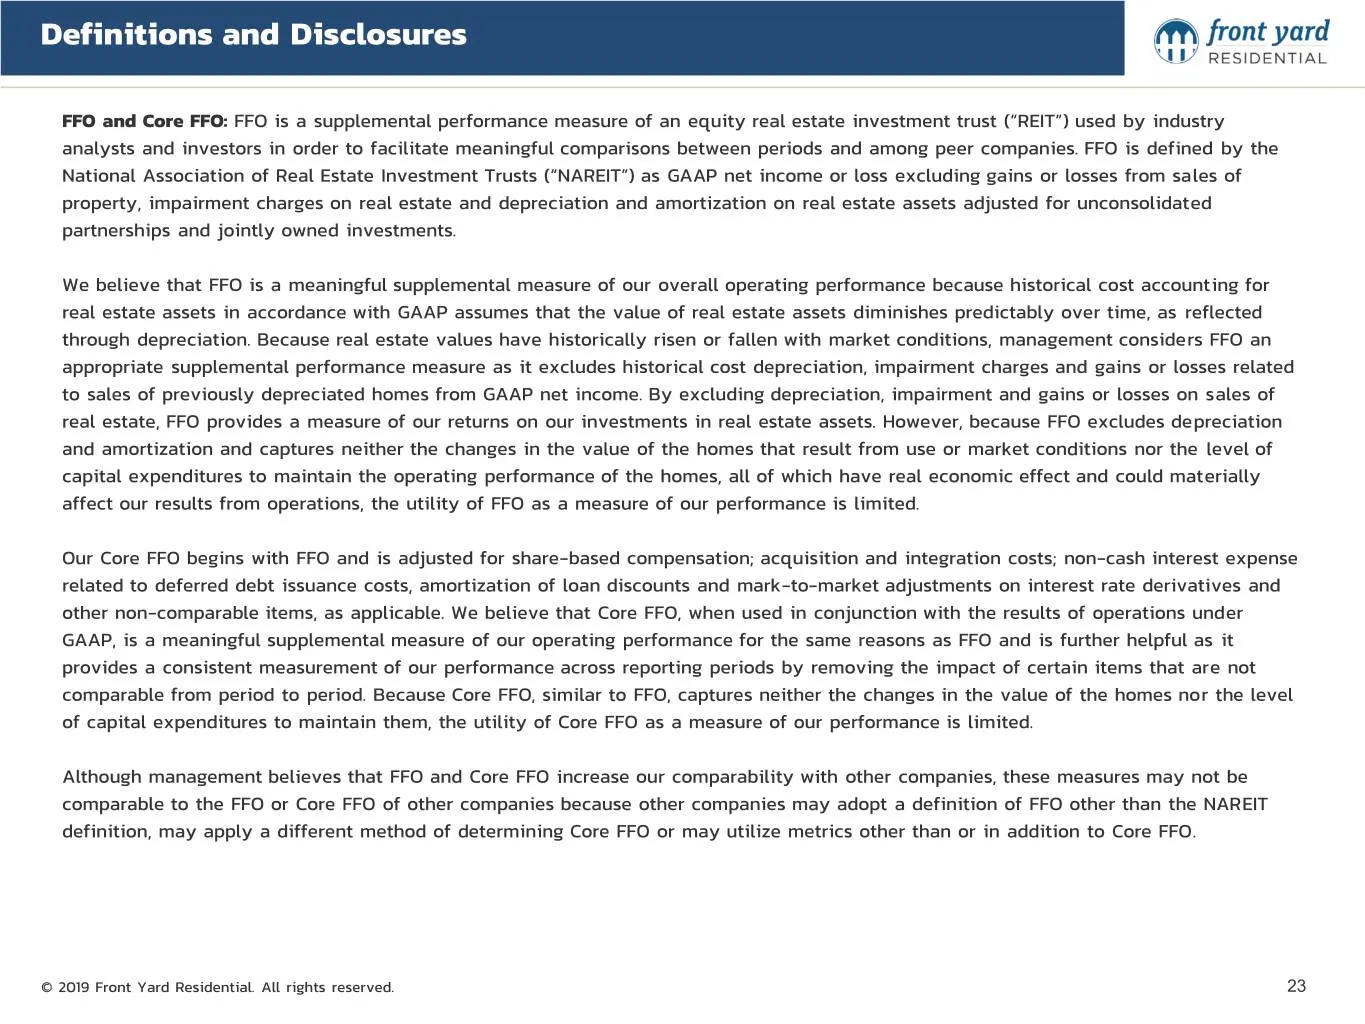
Definitions and Disclosures FFO and Core FFO: FFO is a supplemental performance measure of an equity real estate investment trust (“REIT”) used by industry analysts and investors in order to facilitate meaningful comparisons between periods and among peer companies. FFO is defined by the National As
Slide 24: Definitions and Disclosures: NOI and NOI Margin
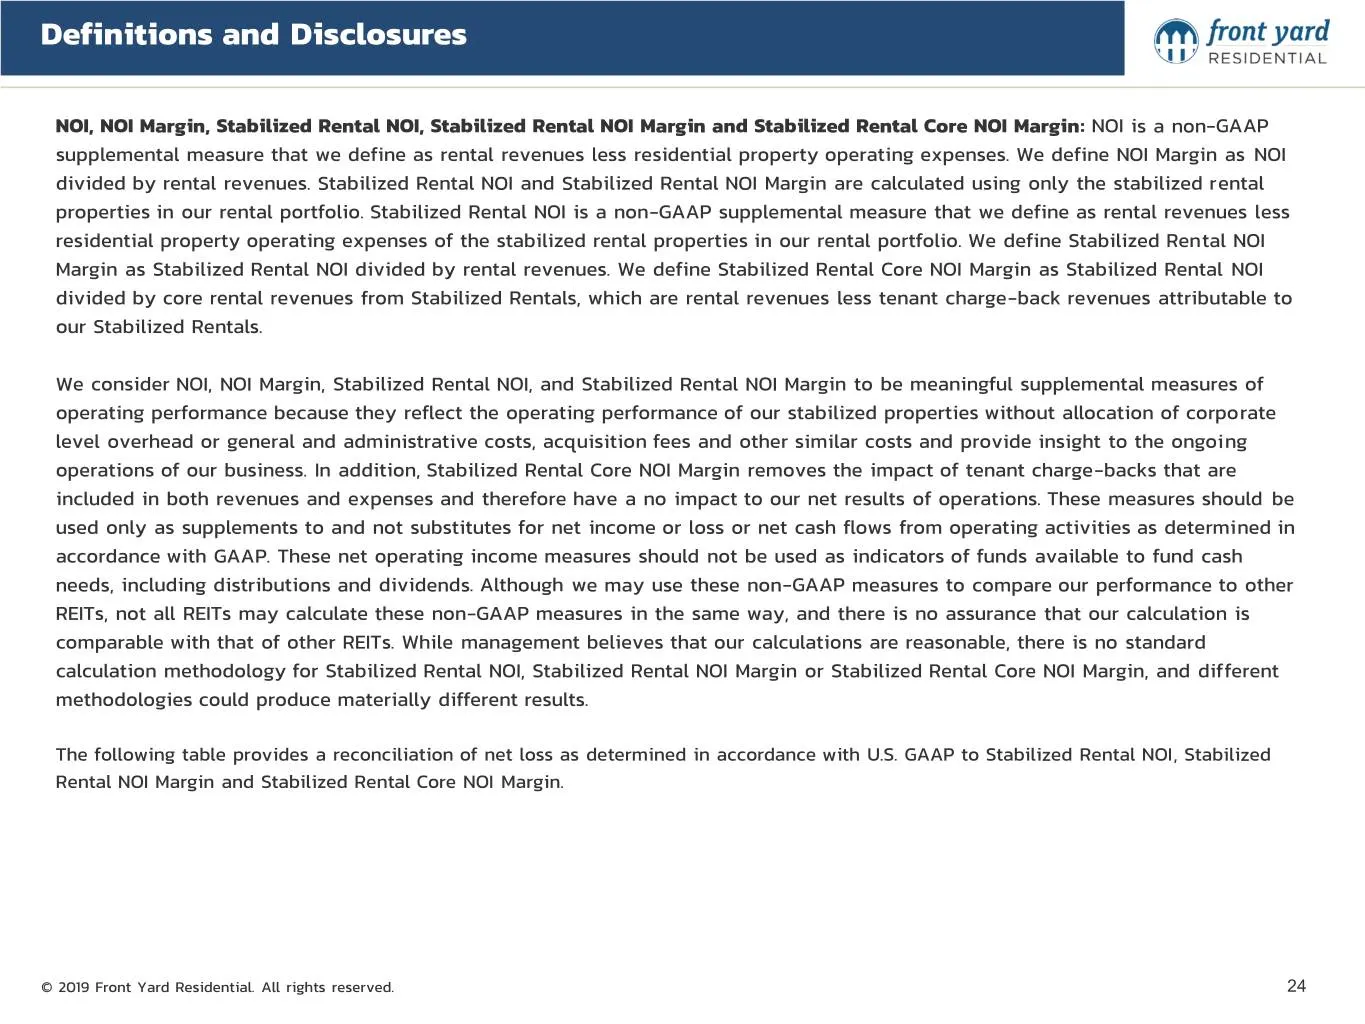
Definitions and Disclosures NOI, NOI Margin, Stabilized Rental NOI, Stabilized Rental NOI Margin and Stabilized Rental Core NOI Margin: NOI is a non-GAAP supplemental measure that we define as rental revenues less residential property operating expenses. We define NOI Margin as NOI divided by rental
Slide 25: Reconciliation of GAAP net loss to Stabilized Rental NOI
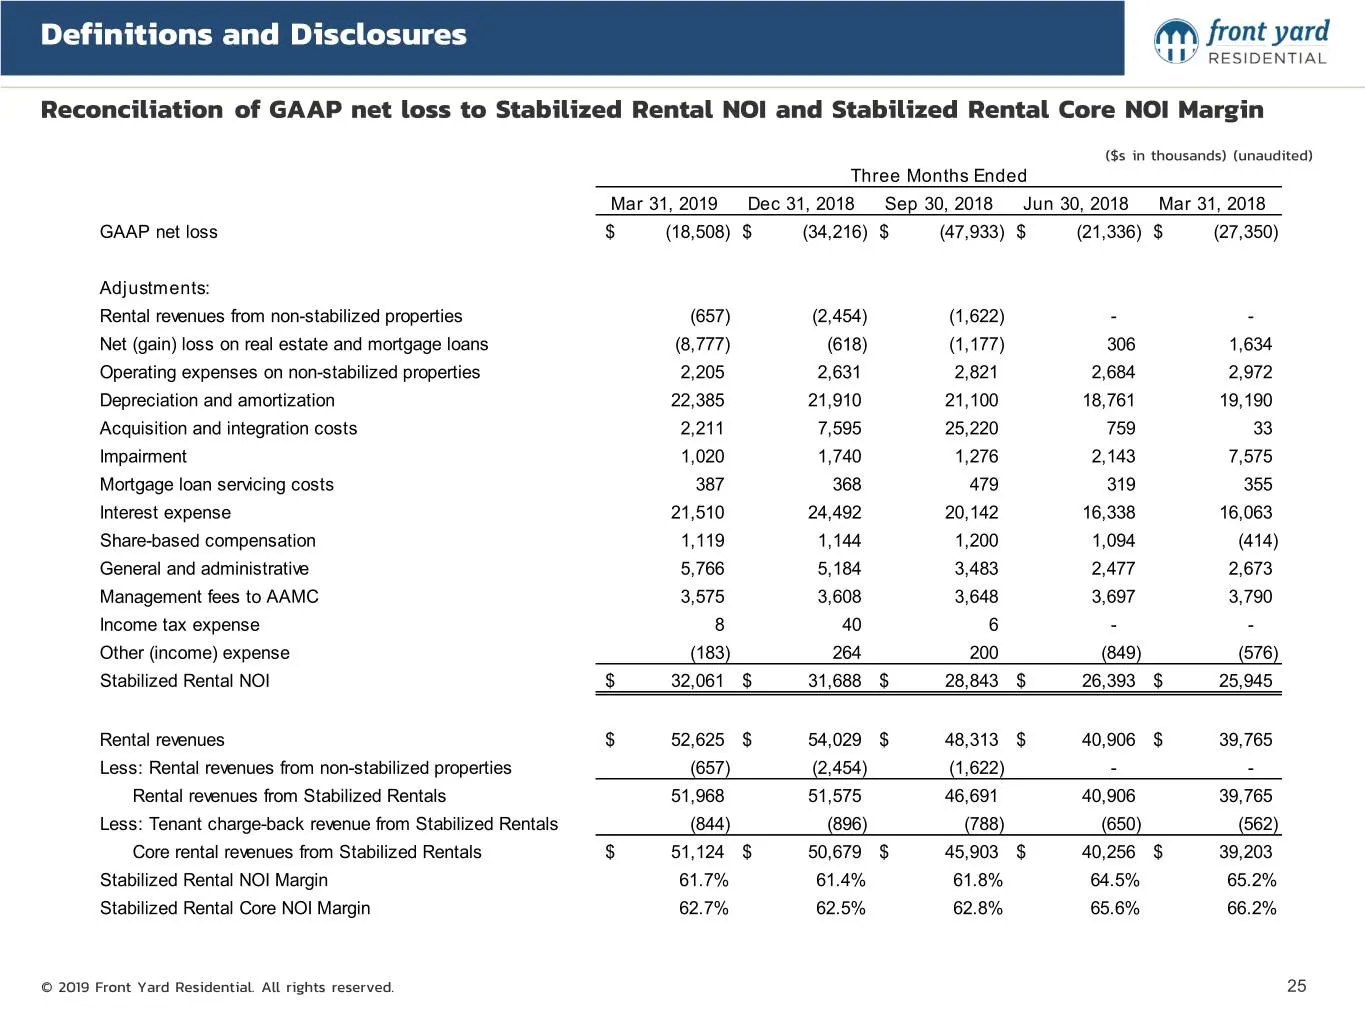
Definitions and Disclosures Reconciliation of GAAP net loss to Stabilized Rental NOI and Stabilized Rental Core NOI Margin ($s in thousands) (unaudited) Three Months Ended Mar 31, 2019 Dec 31, 2018 Sep 30, 2018 Jun 30, 2018 Mar 31, 2018 GAAP net loss $ (18,508) $ (34,216) $ (47,933) $ (21,336) $ (27
Slide 26: Thank you.
Thank you. © 2019 Front Yard Residential. All rights reserved. 26
Source: SEC EDGAR · 8-K filed Jun 4, 2019