El Paso — Lehman Brothers CEO Energy/Power Conference 2007
34 slides from El Paso's conference presentation, Sep 4, 2007
Slide 1: Lehman Brothers CEO Energy/Power Conference
Doug Foshee President and Chief Executive Officer Lehman Brothers CEO Energy/Power Conference September 4, 2007
Slide 2: Cautionary Statement Regarding Forward-looking Statements
Cautionary Statement Regarding Forward-looking Statements This presentation includes forward-looking statements and projections, made in reliance on the safe harbor provisions of the Private Securities Litigation Reform Act of 1995. The company has made every reasonable effort to ensure that the inf
Slide 3: Defining Our Purpose
Defining Our Purpose El Paso Corporation provides natural gas and related energy products in a safe, efficient, and dependable manner

Slide 4: Focus on Culture
the place to work the neighbor to have the company to own Focus on Culture
Slide 5: Leading Positions in Two Core Businesses
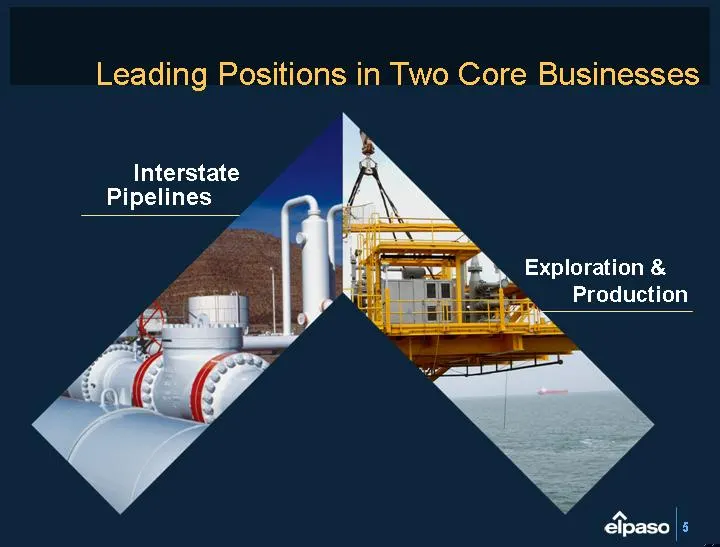
Leading Positions in Two Core Businesses Exploration & Production Interstate Pipelines
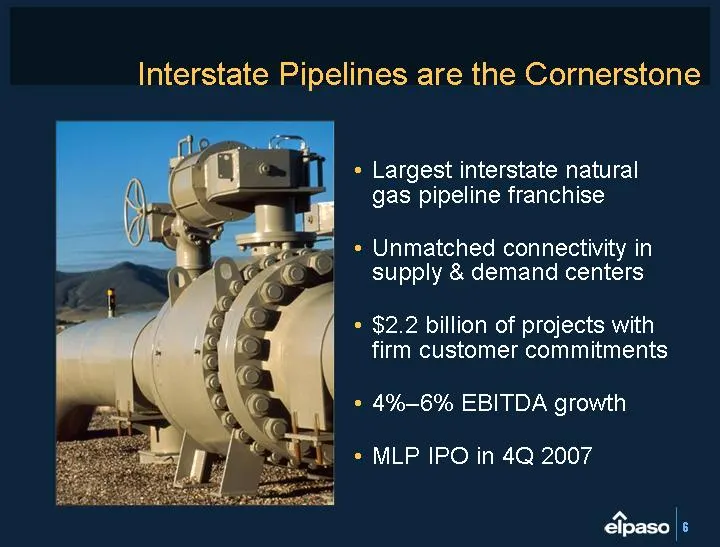
Slide 6: Interstate Pipelines are the Cornerstone
Interstate Pipelines are the Cornerstone Largest interstate natural gas pipeline franchise Unmatched connectivity in supply & demand centers $2.2 billion of projects with firm customer commitments 4%-6% EBITDA growth MLP IPO in 4Q 2007
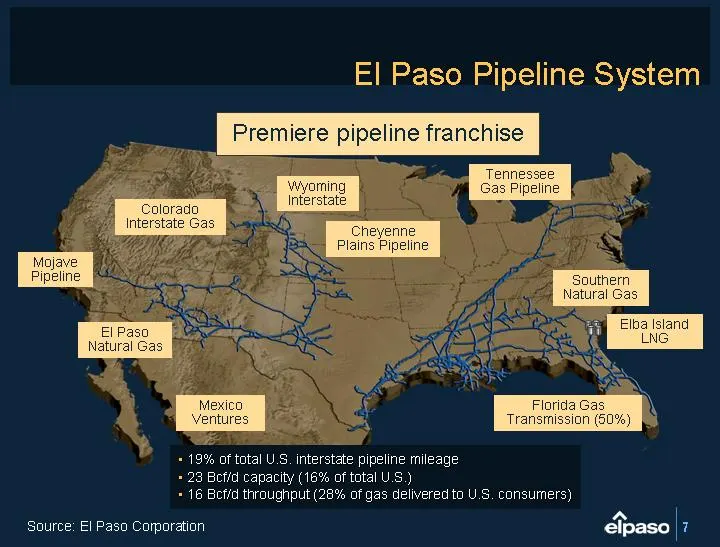
Slide 7: El Paso Pipeline System
El Paso Pipeline System El Paso Natural Gas Mexico Ventures Mojave Pipeline Colorado Interstate Gas Wyoming Interstate Cheyenne Plains Pipeline Tennessee Gas Pipeline Southern Natural Gas Florida Gas Transmission (50%) Elba Island LNG Source: El Paso Corporation Premiere pipeline franchise 19% of to
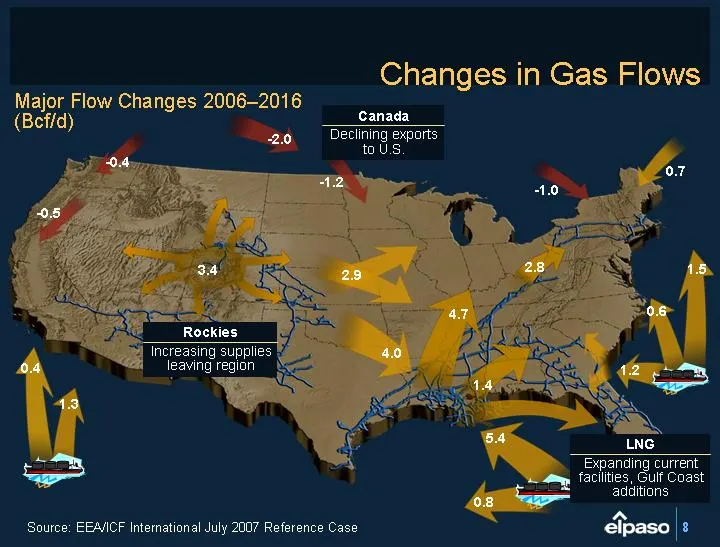
Slide 8: Changes in Gas Flows
Changes in Gas Flows Major Flow Changes 2006-2016 (Bcf/d) - -2.0 - -1.2 - -0.4 - -1.0 - -0.5 3.4 4.7 1.4 0.4 1.3 4.0 5.4 0.8 1.2 0.6 1.5 0.7 2.9 2.8 Source: EEA/ICF International July 2007 Reference Case Canada Declining exports to U.S. Rockies Increasing supplies leaving region LNG Expanding curren
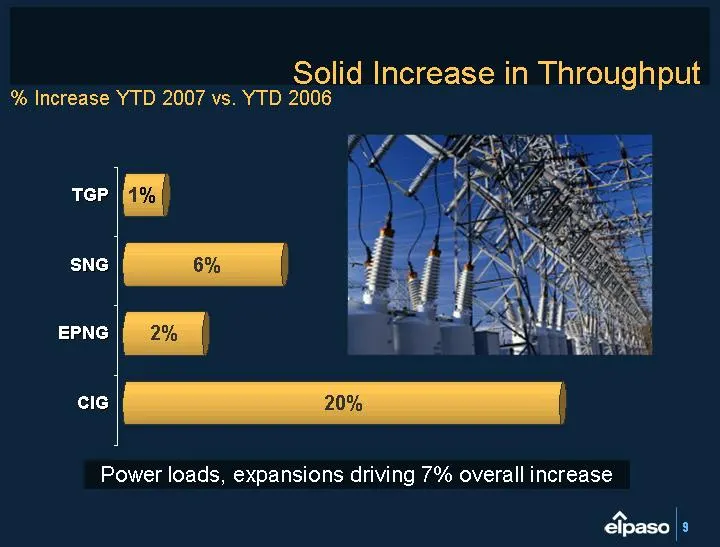
Slide 9: Solid Increase in Throughput
Solid Increase in Throughput YTD T-put 22 4 8 2 TGP SNG 6% 20% EPNG CIG Power loads, expansions driving 7% overall increase % Increase YTD 2007 vs. YTD 2006 2% 1%
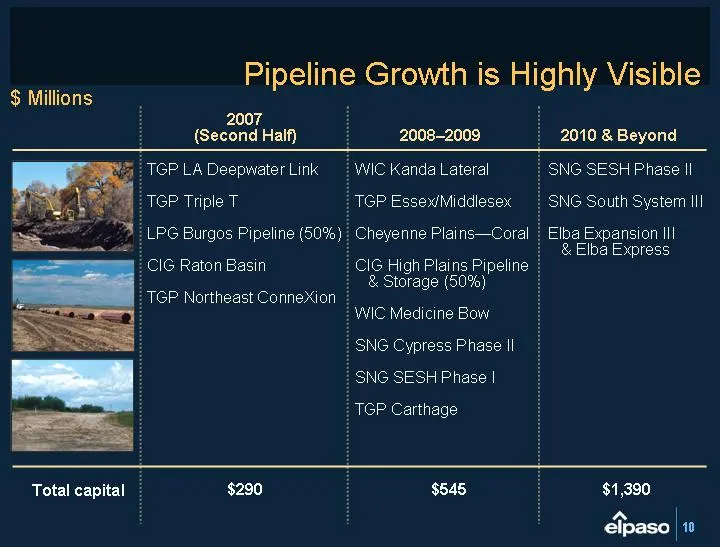
Slide 10: Pipeline Growth is Highly Visible
Total capital Pipeline Growth is Highly Visible 2007 (Second Half) 2008-2009 2010 & Beyond TGP LA Deepwater Link TGP Triple T LPG Burgos Pipeline (50%) CIG Raton Basin TGP Northeast ConneXion $290 WIC Kanda Lateral TGP Essex/Middlesex Cheyenne Plains-Coral CIG High Plains Pipeline & Storage (50%) WI
Slide 11: Pipeline Summary
Pipeline Summary Pipelines continue to deliver outstanding results Excellent inventory of committed growth projects Favorable macro environment creating additional growth opportunities Market connectivity Supply and LNG-related infrastructure
Slide 12: Rapidly Improving E&P Business
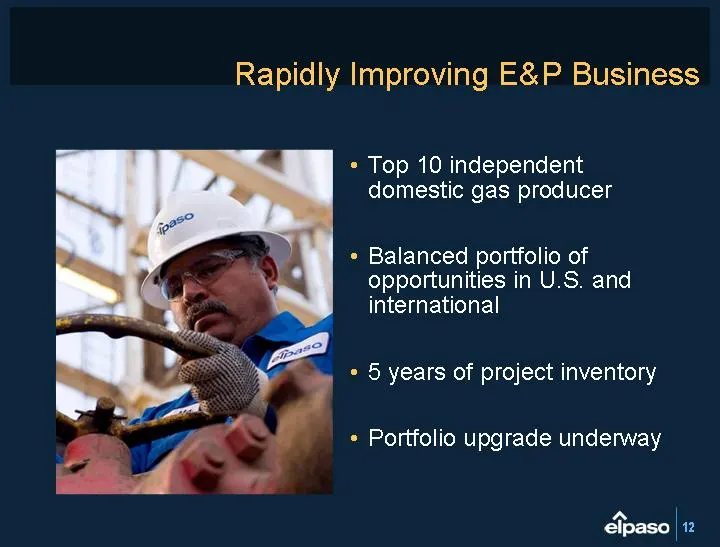
Rapidly Improving E&P Business Top 10 independent domestic gas producer Balanced portfolio of opportunities in U.S. and international 5 years of project inventory Portfolio upgrade underway Portfolio upgrade underway Portfolio upgrade underway Portfolio upgrade underway Portfolio upgrade underway Po
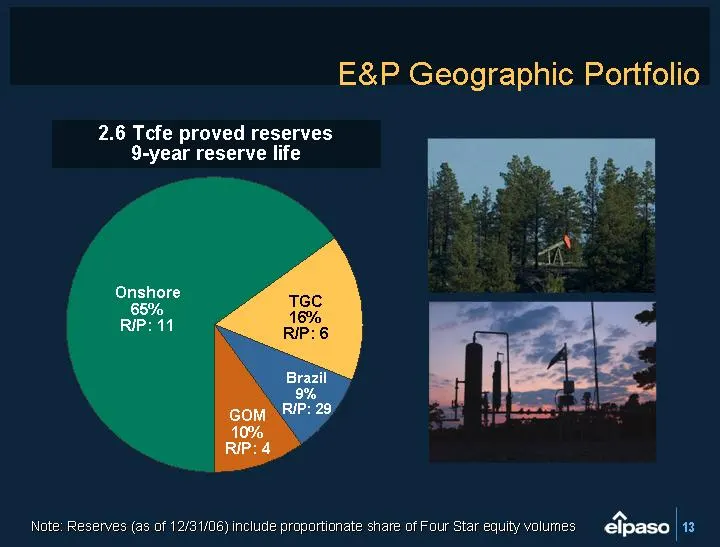
Slide 13: E&P Geographic Portfolio
E&P Geographic Portfolio Onshore TGC Brazil GOM 65 16 9 10 Onshore 65% R/P: 11 TGC 16% R/P: 6 Brazil 9% R/P: 29 GOM 10% R/P: 4 2.6 Tcfe proved reserves 9-year reserve life Note: Reserves (as of 12/31/06) include proportionate share of Four Star equity volumes
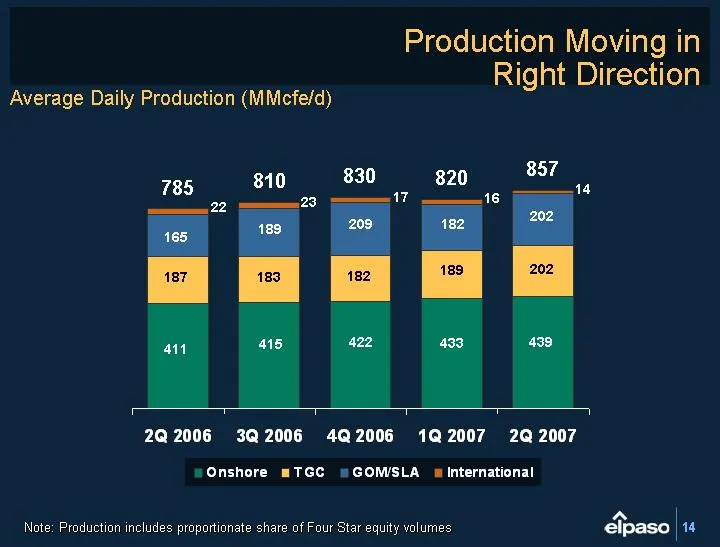
Slide 14: Production Moving in Right Direction
Production Moving in Right Direction 2Q 2006 3Q 2006 4Q 2006 1Q 2007 2Q 2007 Onshore 411 415 422 433 439 TGC 187 183 182 189 202 GOM/SLA 165 189 209 182 202 International 22 23 17 16 14 411 187 165 22 810 415 422 433 439 183 182 189 202 189 209 182 202 23 17 16 14 785 830 820 857 Note: Production in
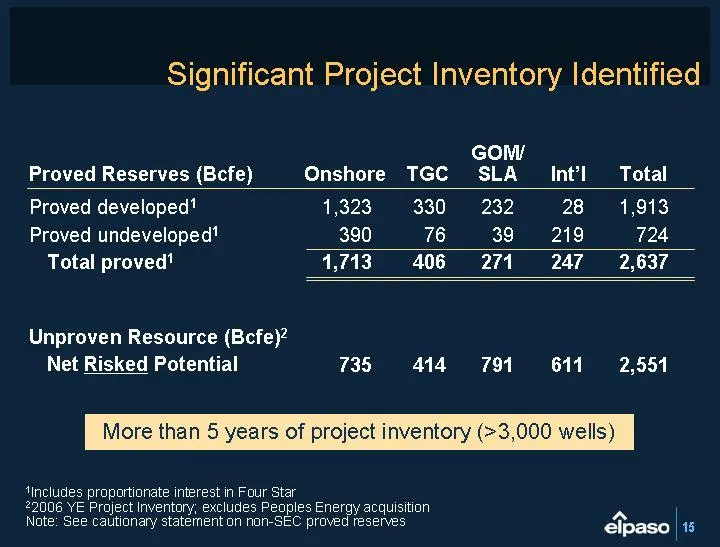
Slide 15: Significant Project Inventory Identified
Significant Project Inventory Identified Proved developed1 Proved undeveloped1 Total proved1 Unproven Resource (Bcfe)2 Net Risked Potential 1,323 390 1,713 735 330 76 406 414 232 39 271 791 28 219 247 611 1,913 724 2,637 2,551 Onshore TGC GOM/ SLA Int'l Total 1Includes proportionate interest in Four
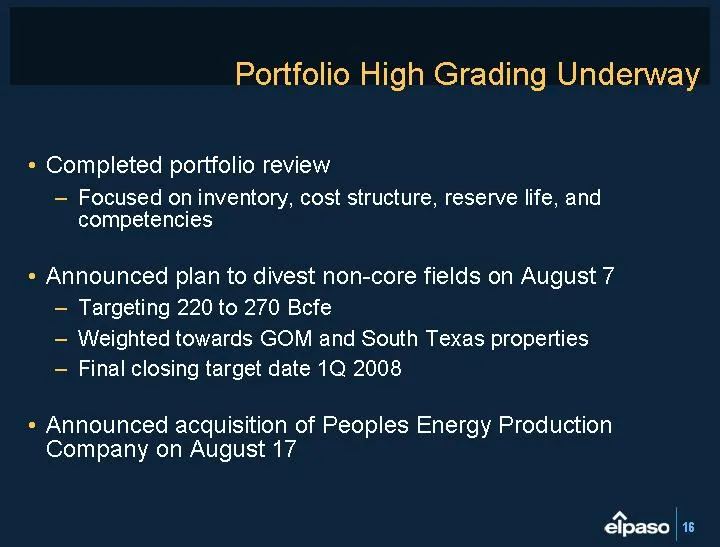
Slide 16: Portfolio High Grading Underway
Portfolio High Grading Underway Completed portfolio review Focused on inventory, cost structure, reserve life, and competencies Announced plan to divest non-core fields on August 7 Targeting 220 to 270 Bcfe Weighted towards GOM and South Texas properties Final closing target date 1Q 2008 Announced a
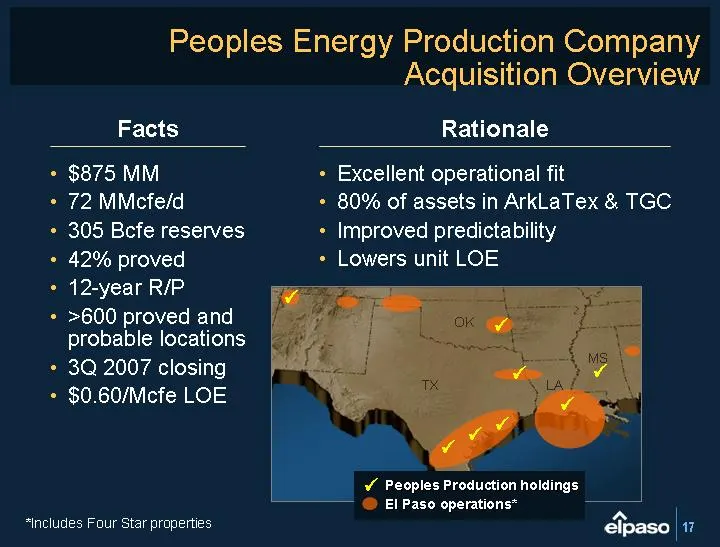
Slide 17: Peoples Energy Production Company Acquisition Overview
Peoples Energy Production Company Acquisition Overview $875 MM 72 MMcfe/d 305 Bcfe reserves 42% proved 12-year R/P >600 proved and probable locations 3Q 2007 closing $0.60/Mcfe LOE Excellent operational fit 80% of assets in ArkLaTex & TGC Improved predictability Lowers unit LOE ? Facts Rationale *In
Slide 18: ArkLaTex Becomes Largest Base of Production
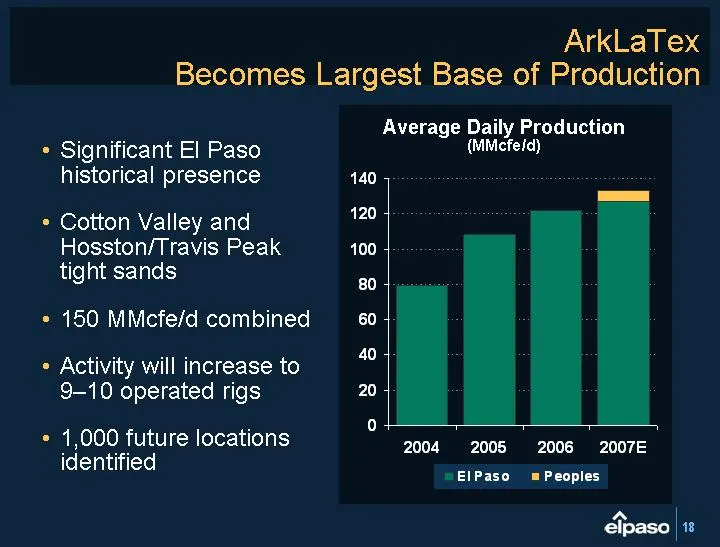
ArkLaTex Becomes Largest Base of Production Significant El Paso historical presence Cotton Valley and Hosston/Travis Peak tight sands 150 MMcfe/d combined Activity will increase to 9-10 operated rigs 1,000 future locations identified 2004 2005 2006 2007E El Paso 79 108 122 127 Peoples 6.3 Average Da
Slide 19: Tight-Gas Reservoirs Offer Attractive Returns
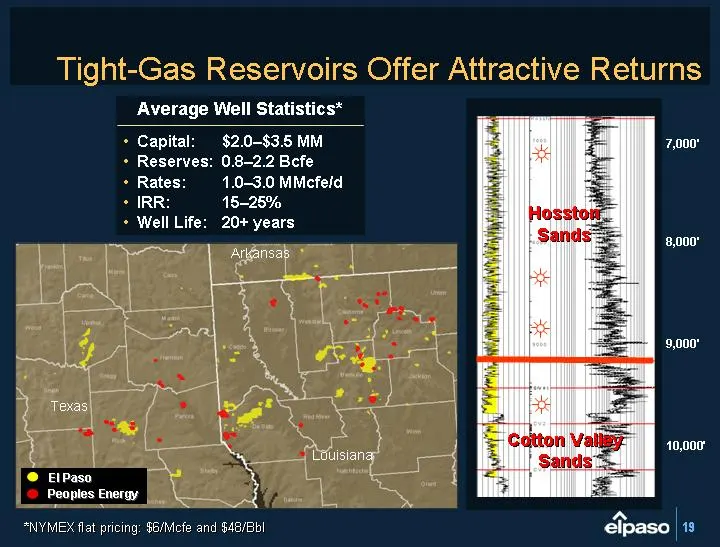
Tight-Gas Reservoirs Offer Attractive Returns Hosston Sands Cotton Valley Sands 7,000' 8,000' 9,000' 10,000' Texas Arkansas Louisiana *NYMEX flat pricing: $6/Mcfe and $48/Bbl El Paso Peoples Energy Average Well Statistics* Capital: $2.0-$3.5 MM Reserves: 0.8-2.2 Bcfe Rates: 1.0-3.0 MMcfe/d IRR: 15-2
Slide 20: E&P Summary
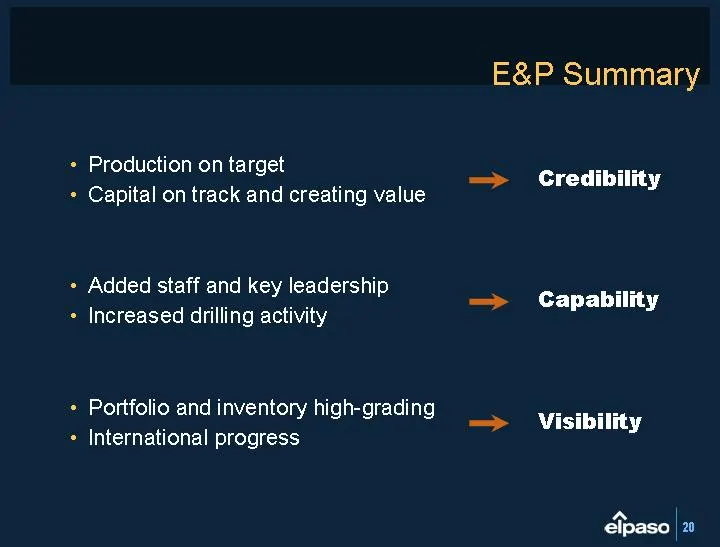
E&P Summary Production on target Capital on track and creating value Added staff and key leadership Increased drilling activity Portfolio and inventory high-grading International progress Credibility Capability Visibility
Slide 21: Financial Progress and Outlook
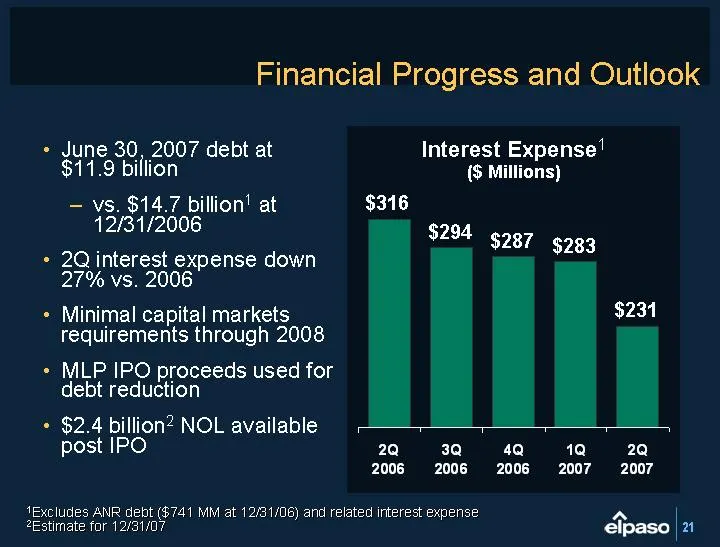
Financial Progress and Outlook June 30, 2007 debt at $11.9 billion vs. $14.7 billion1 at 12/31/2006 2Q interest expense down 27% vs. 2006 Minimal capital markets requirements through 2008 MLP IPO proceeds used for debt reduction $2.4 billion2 NOL available post IPO 2Q 2006 3Q 2006 4Q 2006 1Q 2007 2Q
Slide 22: Summary
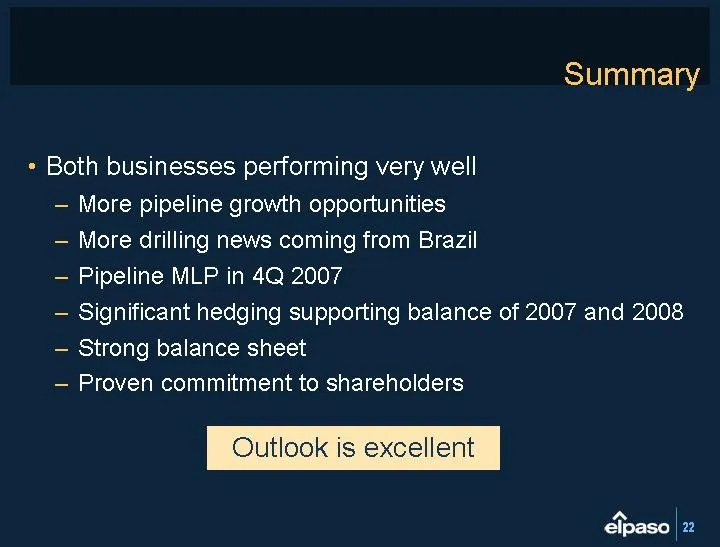
Summary Both businesses performing very well More pipeline growth opportunities More drilling news coming from Brazil Pipeline MLP in 4Q 2007 Significant hedging supporting balance of 2007 and 2008 Strong balance sheet Proven commitment to shareholders Outlook is excellent
Slide 23: Doug Foshee, Lehman Brothers CEO Energy/Power Conference
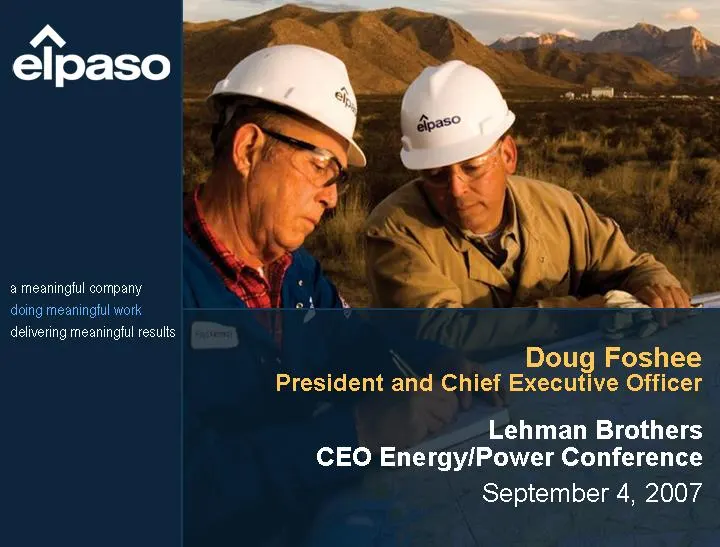
Doug Foshee President and Chief Executive Officer Lehman Brothers CEO Energy/Power Conference September 4, 2007
Slide 24: Appendix
Appendix
Slide 25: 25
25
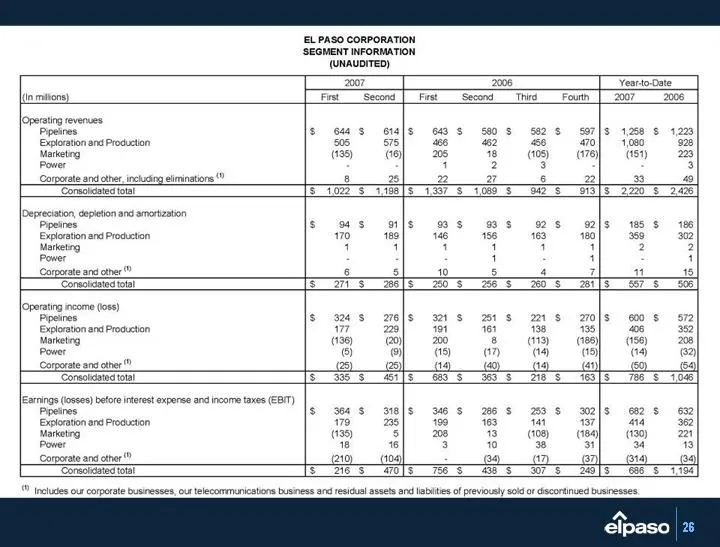
Slide 26: Segment Information (Unaudited)
ELPASO CORPORATION ‘SEGMENT INFORMATION (UNAUDITED) or 2 Yearto Date in mations) Fiat Second | Fst Seeons Tw Foun | 2007 2006 [operating everves Pipeires s ous cals cos sos 5025 S158 8 120 Elerion and Production so 67s ass asso 70] 10008 Marketog (35) to} 05808) 76] SH) OD Power 1 2 3 3 Corporate an
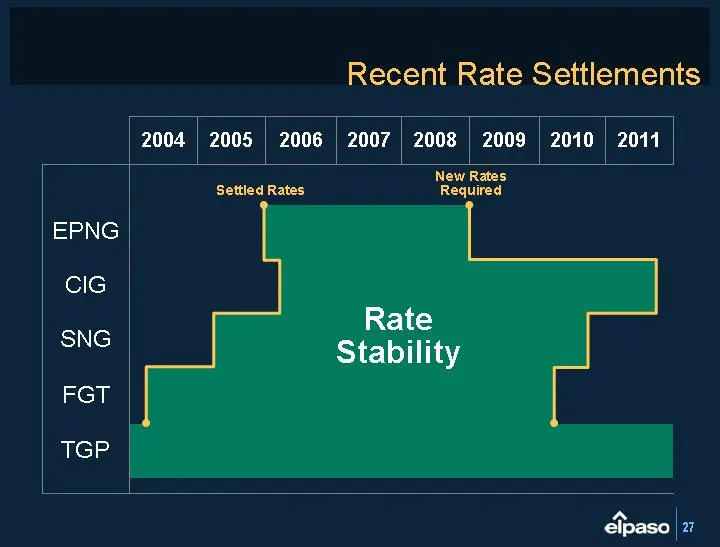
Slide 27: Recent Rate Settlements and Rate Stability
2004 2004 2004 2004 2005 2005 2005 2005 2006 2006 2006 2006 2006 2007 2007 2007 2007 2008 2008 2008 2008 2009 2009 2009 2009 2010 2010 2010 2010 2011 2011 2011 2011 EPNG CIG SNG FGT TGP Recent Rate Settlements New Rates Required Settled Rates Rate Stability
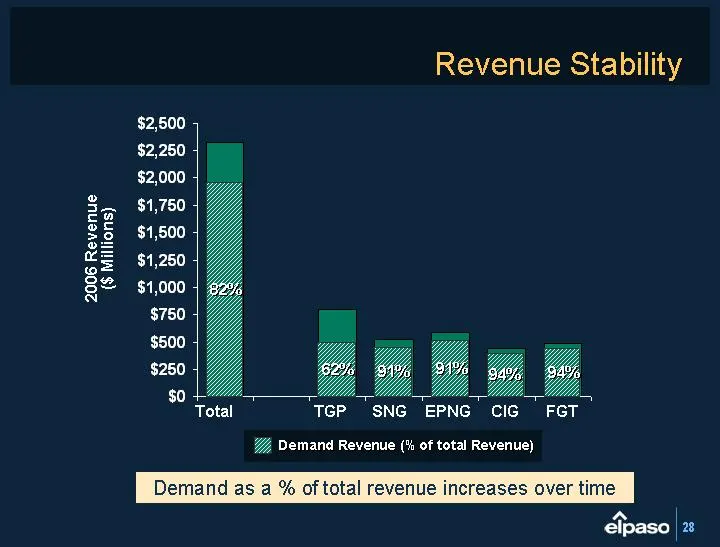
Slide 28: Revenue Stability
Total NA TGP SNG EPNG CIG FGT 2330 793 517 584 436 485 Revenue Stability Demand Revenue (% of total Revenue) Demand as a % of total revenue increases over time 62% 91% 94% 91% 82% Total SNG EPNG CIG TGP FGT 94% 2006 Revenue ($ Millions)
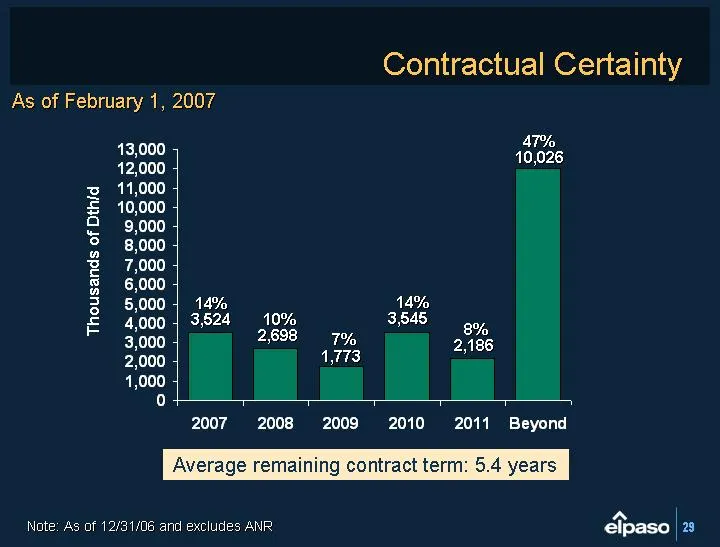
Slide 29: Contractual Certainty
2007 2008 2009 2010 2011 Beyond 3524 2698 1773 3545 2186 12026 Contractual Certainty 14% 3,524 10% 2,698 7% 1,773 14% 3,545 8% 2,186 47% 10,026 Average remaining contract term: 5.4 years As of February 1, 2007 Thousands of Dth/d Note: As of 12/31/06 and excludes ANR
Slide 30: 2007 Natural Gas Hedge Program
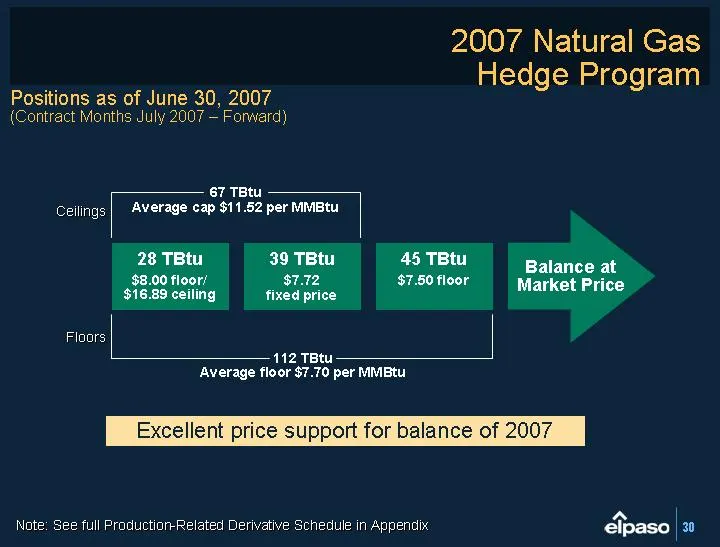
2007 Natural Gas Hedge Program 28 TBtu $8.00 floor/ $16.89 ceiling 39 TBtu $7.72 fixed price 45 TBtu $7.50 floor Balance at Market Price Ceilings Floors 67 TBtu Average cap $11.52 per MMBtu 112 TBtu Average floor $7.70 per MMBtu Positions as of June 30, 2007 (Contract Months July 2007 - Forward) Exc
Slide 31: 2008 Natural Gas Hedge Activities
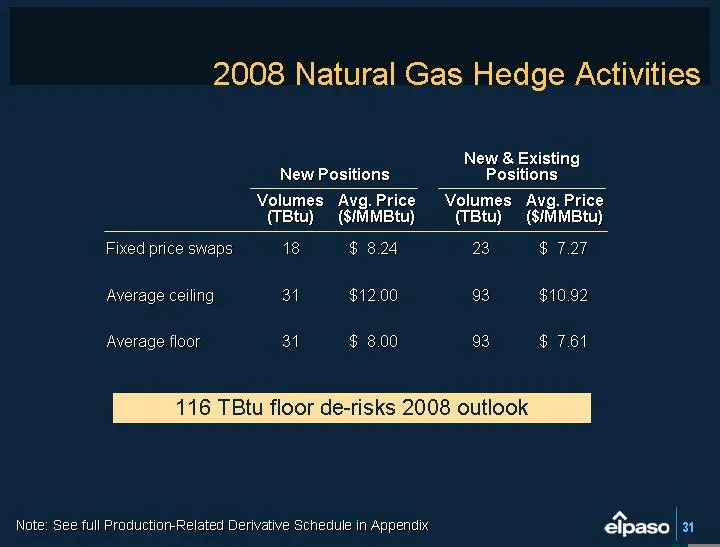
2008 Natural Gas Hedge Activities 18 31 31 Fixed price swaps Average ceiling Average floor $ 8.24 $ 12.00 $ 8.00 Volumes (TBtu) Avg. Price ($/MMBtu) 23 93 93 Volumes (TBtu) Avg. Price ($/MMBtu) New Positions $ 7.27 $ 10.92 $ 7.61 116 TBtu floor de-risks 2008 outlook Note: See full Production-Related
Slide 32: Production-Related Derivative Schedule
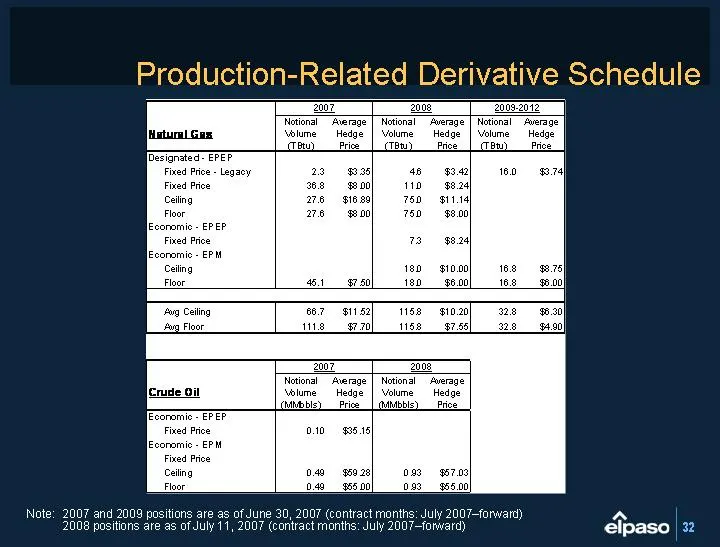
Production-Related Derivative Schedule Note: 2007 and 2009 positions are as of June 30, 2007 (contract months: July 2007-forward) 2008 positions are as of July 11, 2007 (contract months: July 2007-forward)
Slide 33: Pinauna Upside Exploration
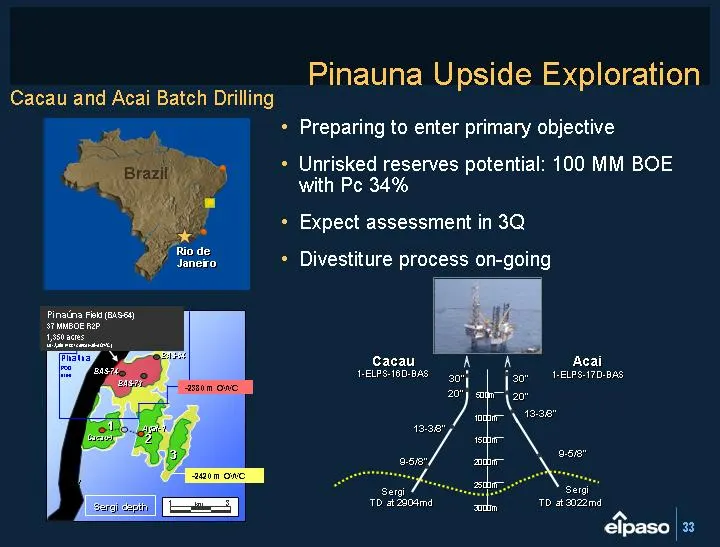
Pinauna Upside Exploration Preparing to enter primary objective Unrisked reserves potential: 100 MM BOE with Pc 34% Expect assessment in 3Q Divestiture process on-going 3D survey outline Pinauna POD area BAS-73 BAS-73 2 3 Pinauna Field (BAS-64) 37 MMBOE R2P 1,350 acres (at -2,380 m ss / conservative
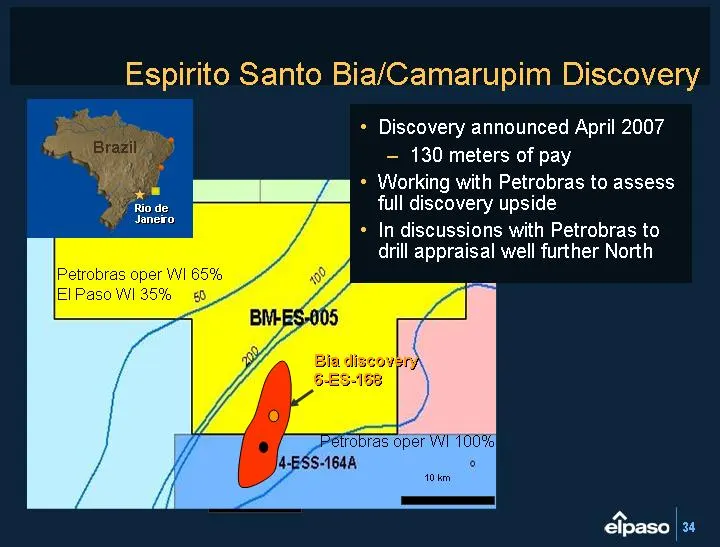
Slide 34: Espirito Santo Bia/Camarupim Discovery
Espirito Santo Bia/Camarupim Discovery 10 km Petrobras oper WI 65% El Paso WI 35% 10 km Petrobras oper WI 65% El Paso WI 35% Petrobras oper WI 100% Bia discovery 6-ES-168 Rio de Janeiro Brazil Discovery announced April 2007 130 meters of pay Working with Petrobras to assess full discovery upside In
Source: SEC EDGAR · 8-K filed Sep 4, 2007
More decks from El Paso Corp.
 Corporate Update (March 2012)53 slides · Mar 28, 2012
 Merger or Acquisition (December 2011)39 slides · Dec 6, 2011
 Merger or Acquisition (October 2011)20 slides · Oct 17, 2011
 Investor Day (May 2011)170 slides · May 24, 2011
 Technical Presentation (October 2009)30 slides · Oct 15, 2009
 Investor Presentation (June 2009)27 slides · Jun 5, 2009