Strategic Hotels and Resorts Inc
Strategic Hotels and Resorts — Strategic Hotel Capital — Investor Presentation (November 2005)
28 slides from Strategic Hotels and Resorts's investor presentation, Nov 16, 2005
Slide 1: Strategic Hotels & Resorts
STRATEGIC Hotels & Resorts

Slide 2: Forward-Looking Statements
Forward-Looking Statements Statements in this presentation that are not reported financial results or other historical information are “forward-looking statements” within the meaning of the Private Securities Litigation Reform Act of 1995. They include, for example, statements about our business out
Slide 3: Company Overview
Company Overview Intensive asset managers High quality portfolio; intrinsic real estate value Embedded internal growth opportunities $1.3 billion acquisition track record since IPO “Life cycle” driven capital recycling program Building Long-Term Earnings Growth

Slide 4: Company Highlights
Strategic Hotels & Resorts Company Highlights

Slide 5: Value Creators
Value Creators Real estate focused Operating upside through asset management Physical changes Repositioning and remarketing
Slide 6: Portfolio Overview Hotels and Resorts
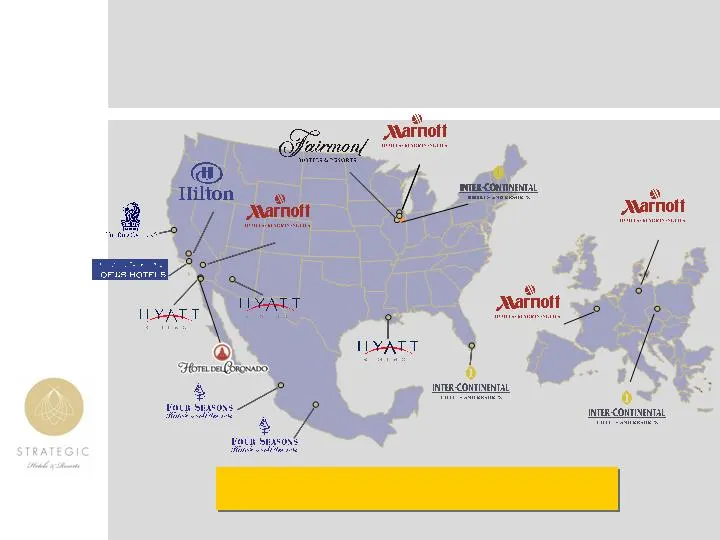
Portfolio Overview 17 Hotels and Resorts (1) 8,273 Rooms Champes, Elyseés France Hamburg, Germany Prague, Czech Republic Chicago Mexico City Punta Mita Resort New Orleans Phoenix at Civic Plaza Lincolnshire Resort Miami Santa Monica Beach Hotel Burbank Airport Half Moon Bay Mexico City Punta Mita Re
Slide 7: Improving Portfolio Metrics
Improving Portfolio Metrics Note: Figures represent North American Same Store metrics. Q3 2004 Q3 2005 RevPAR $103.98 +13% $117.12 Total RevPAR $192.60 +12% $216.41 EBITDA/room $2,884 +35% $3,905 EBITDA margin 16.6% +21% 20.1%

Slide 8: Seasoned Management Team
Seasoned Management Team Title Experience Laurence Geller President, CEO and founder James Mead Chief Financial Officer Richard Moreau SVP, Asset Management Paul White VP, Asset Manager Dave Hogin VP, Asset Manager Ken Barrett VP, Asset Manager Tim Taylor VP, Capital Projects Jean Shore Senior Direc

Slide 9: Industry Update
Strategic Hotels & Resorts Industry Update
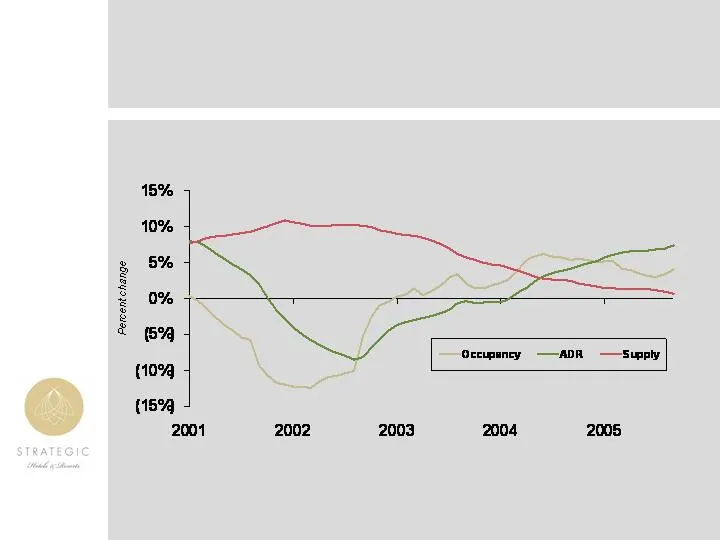
Slide 10: U.S. Luxury
U.S. Luxury Occupancy, ADR, and Supply Percent Change: 2001 – 2005E Source: Smith Travel Research 7.4% 4.0% 0.7%
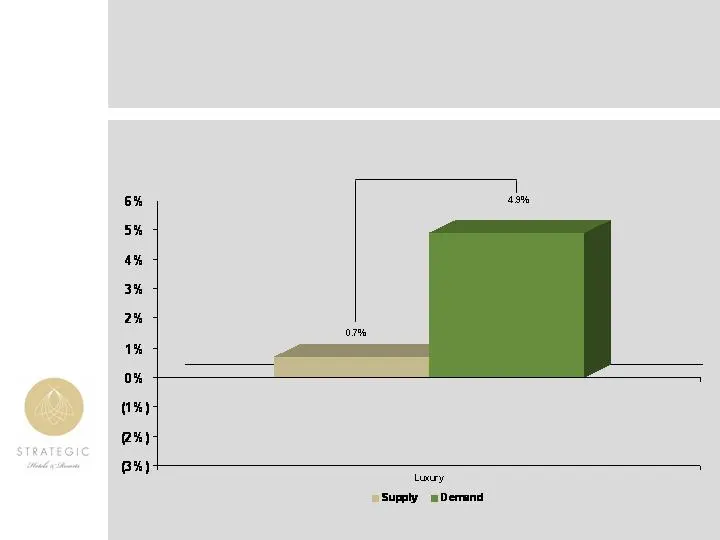
Slide 11: U.S. Supply / Demand Imbalance
U.S. Supply / Demand Imbalance Source: Smith Travel Research; September 2005 year-to-date Gap: 4.2%

Slide 12: Operating Strategy
Strategic Hotels & Resorts Operating Strategy

Slide 13: Operating Strategy
Operating Strategy Asset management focus Capital allocation External growth through acquisitions Internal growth Capital recycling
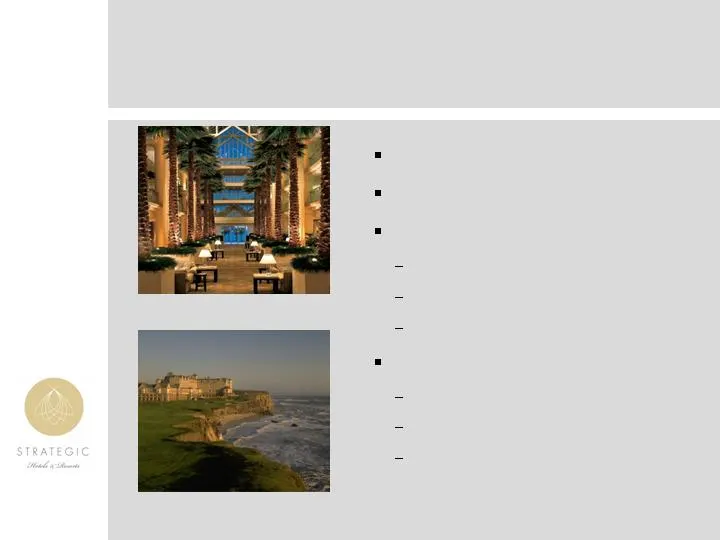
Slide 14: Asset Management Focus
Asset Management Focus Case Studies Rebranding and repositioning Building group demand Loews Santa Monica: 17% RevPAR growth 311 bps increase in EBITDA margin 22% growth in PACE Ritz-Carlton Half Moon Bay: 9% RevPAR growth 370 bps increase in EBITDA margin 35% growth in PACE Loews Santa Monica Beach
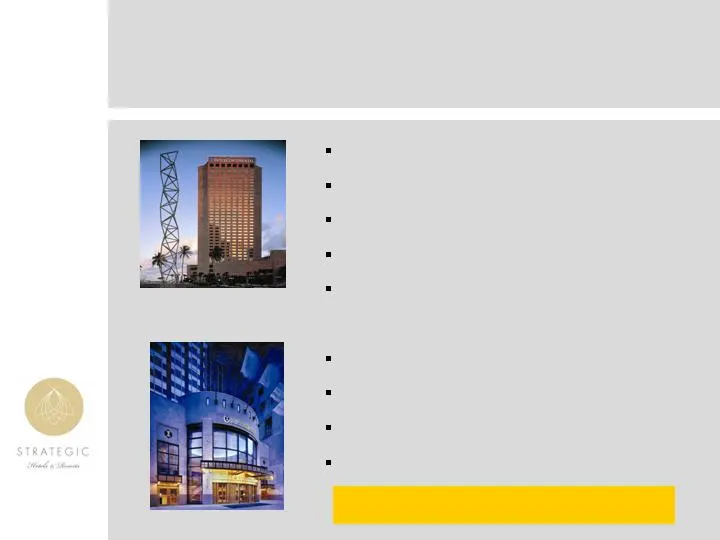
Slide 15: External Growth: InterContinental Miami & Chicago
External Growth InterContinental Miami & Chicago Supply coming out of market High growth; dominant meetings hotel 2+ acres undeveloped land 45% RevPAR growth 50% growth in PACE Michigan Avenue frontage 42,370 square feet of meetings space Redevelopment opportunities 12% RevPAR growth InterContinenta
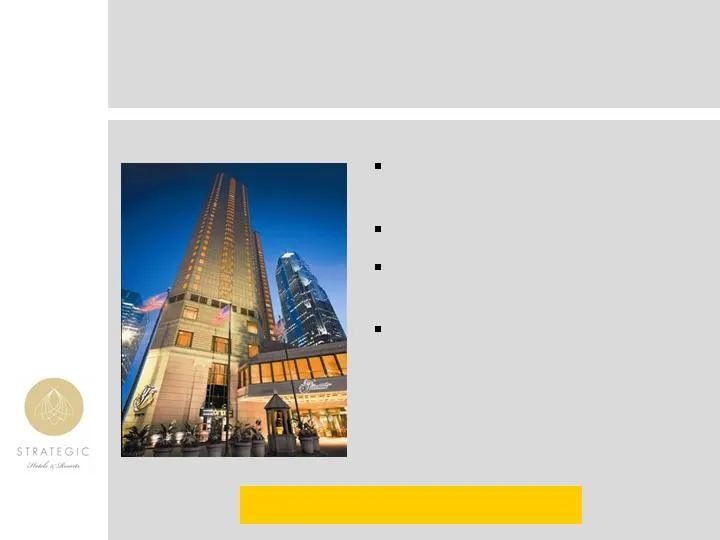
Slide 16: External Growth: Fairmont Chicago
External Growth Fairmont Chicago Adjacent to Millennium Park and Lakeshore East Premier meetings hotel Unused space, multiple opportunities 21% RevPAR growth 692 rooms $156 million - $224,000 per key
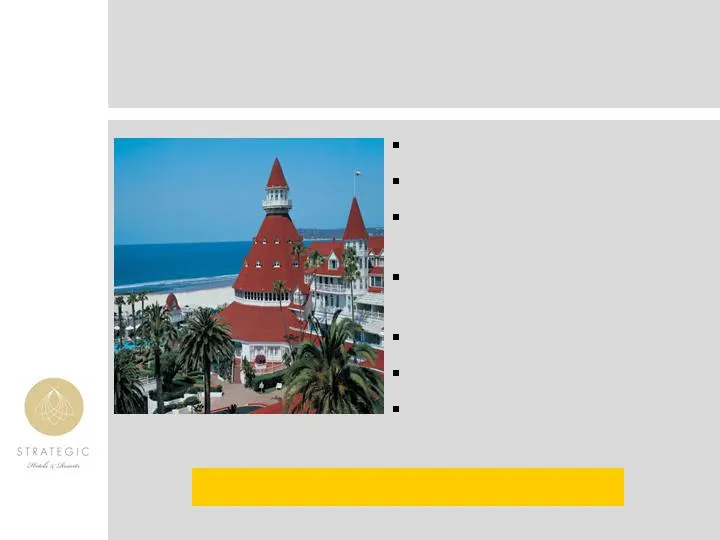
Slide 17: External Growth: Hotel del Coronado
External Growth Hotel del Coronado San Diego landmark hotel 28 fee simple beach-front acres 78-unit condo-hotel, spa and beachclub under construction Future 144-room hotel; ballroom and retail expansion Private equity style transaction 45% managing interest KKR, KSL Resorts as partners $745 million;
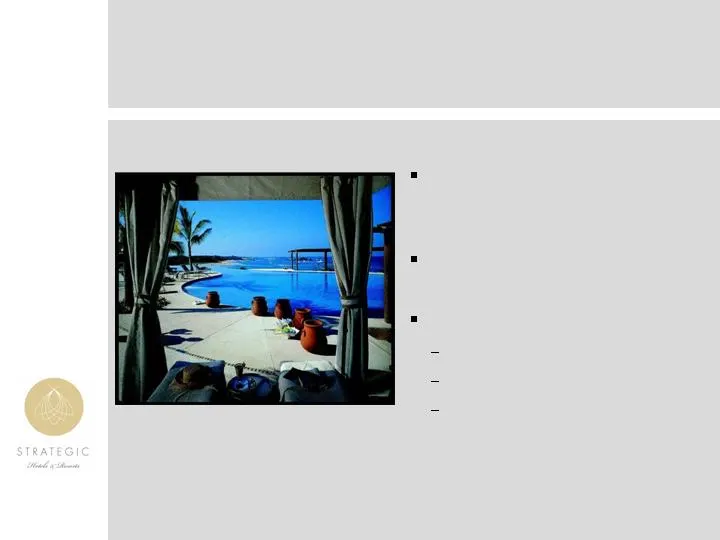
Slide 18: Internal Growth: Four Seasons Punta Mita
Internal Growth Four Seasons Punta Mita December opening of ocean front suites, infinity pool and champagne and sushi bar 24 additional rooms to be completed by year end 2006 Third quarter results: 37% RevPAR growth 88% growth in EBITDA 678 bps increase in EBITDA margin Nayarit, Mexico 140 Rooms
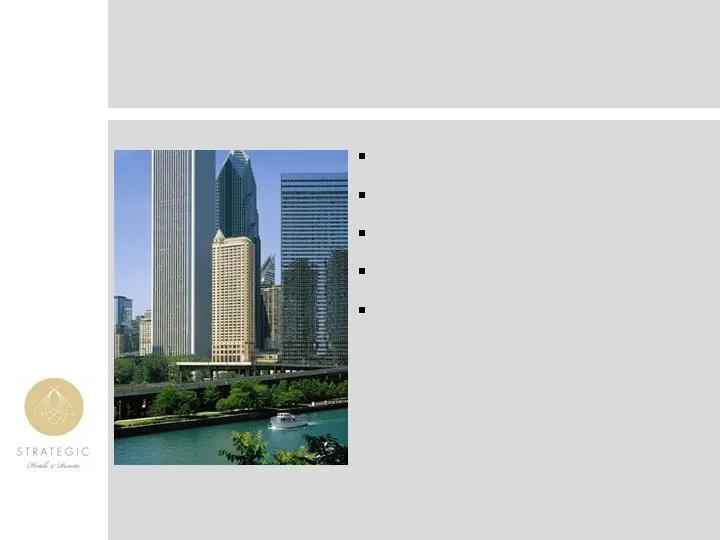
Slide 19: Internal Growth: Fairmont Chicago
Internal Growth Fairmont Chicago Fairmont Gold rooms and lounge 10,000 sf spa and fitness center Gateway into Millennium Park Soft goods renovation Opportunistic hotel/condo and fractional ownership conversion
Slide 20: Internal Growth: Proposed InterContinental Tower
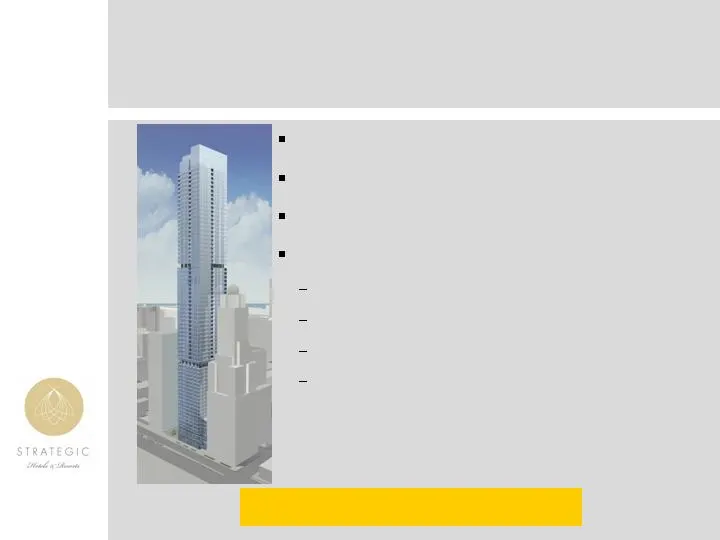
Internal Growth Proposed InterContinental Tower Opportunistic redevelopment Residential subsidy to transform hotel 71-story mixed use residential, hotel, retail Key execution criteria: Substantial transfer of risk Experienced, credit-worthy partner Risk adjusted IRR increment Long term accelerated e

Slide 21: Capital Recycling
Capital Recycling Disciplined “life cycle” approach Acquire, reposition, stabilize, and sell Strategic redeployment of capital 2005 dispositions: Embassy Suites Lake Buena Vista Marriott Schaumberg $900 Million in Hotels Sold Since 1997

Slide 22: Financial Overview
Strategic Hotels & Resorts Financial Overview
Slide 23: Hyatt Regency New Orleans
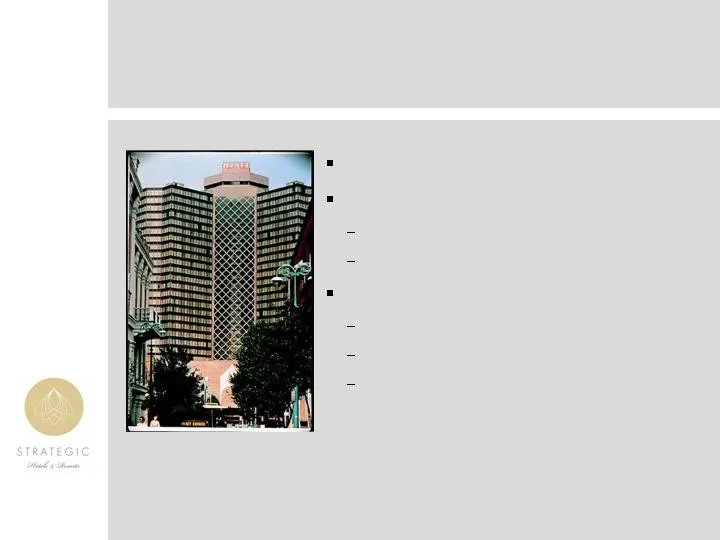
Hyatt Regency New Orleans New Orleans, Louisiana 1,184 Rooms Taken out of service August 29 Accounting as under development: EBITDA = $0 Capitalize interest Insurance is adequate for loss: $350 million loss limit $11 million deductible No time limit on business interruption
Slide 24: Third Quarter 2005 Results
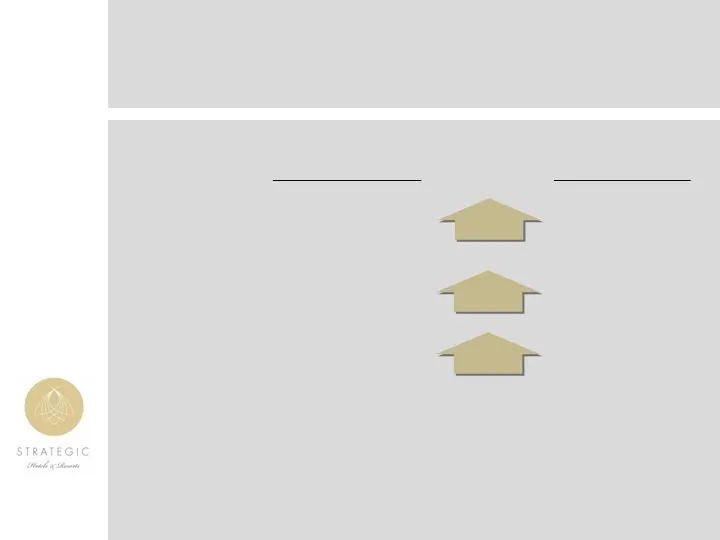
Third Quarter 2005 Results ($ in millions, except per share figures) Q3 2004 Q3 2005 EBITDA $13.8 +91% $26.3 FFO $6.7 +94% $13.0 FFO/share $0.17 +65% $0.28

Slide 25: 2005 Guidance
2005 Guidance ($ in millions, except per share figures) Q4 2005 FY 2005 EBITDA $24.3 – $25.9 $113.7 – $115.2 FFO $12.8 – $14.4 $65.0 – $66.5 FFO/share $0.24 – $0.27 $1.45 – $1.49

Slide 26: Capital Structure
Capital Structure 39% Debt / Total Enterprise Value 80% fixed rate debt $255 million availability under lines 5.1 years average maturity of debt

Slide 27: Summary
Summary Real estate focused strategy Hands-on intensive management Upside from cycle Internal growth opportunities Investing to ensure sustainable earnings growth
Slide 28: Strategic Hotels & Resorts
STRATEGIC Hotels & Resorts
Source: SEC EDGAR · 8-K filed Nov 16, 2005
More decks from Strategic Hotels and Resorts Inc
 Investor Presentation (June 2015)43 slides · Jun 1, 2015
 Investor Presentation (February 2015)43 slides · Feb 24, 2015
 Investor Presentation (January 2015)44 slides · Jan 26, 2015
 Investor Presentation (November 2014)50 slides · Nov 5, 2014
 Investor Presentation (October 2014)50 slides · Oct 3, 2014
 Investor Day (September 2014)67 slides · Sep 22, 2014