Diamond Foods — Investor Presentation (September 2009)
35 slides from Diamond Foods's investor presentation, Sep 9, 2009
Slide 1: Driving Sustainable, Long-Term Growth
Driving Sustainable, Long-Term Growth Michael J. Mendes President and Chief Executive Officer DF_Investor_9-3-09v2 September 2009
Slide 2
Slide 3: Important Information
Important Information This material contains forward-looking statements, including forecasts of growth, long- term financial goals, expanding margins, industry growth and our strategic plans, that involve known and unknown risks and uncertainties that may cause actual results, levels of activity, pe
Slide 4: Branded, Consumer Packaged Food Company Delivering Value to Retailers and Consumers
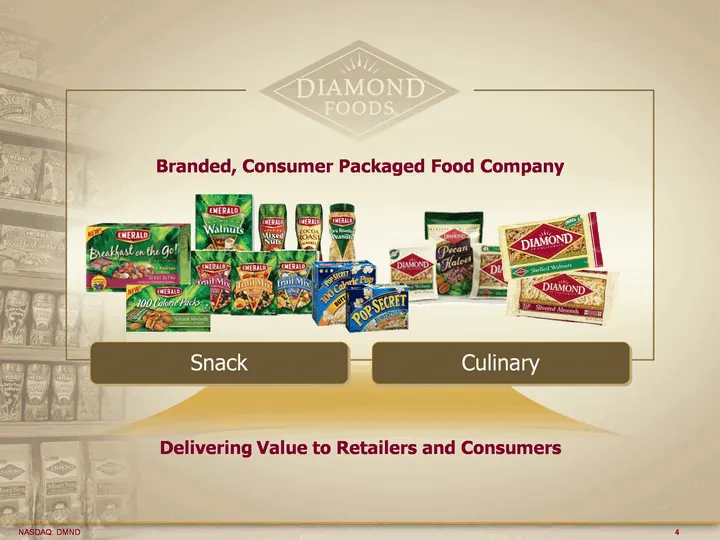
Branded, Consumer Packaged Food Company Delivering Value to Retailers and Consumers Snack Culinary
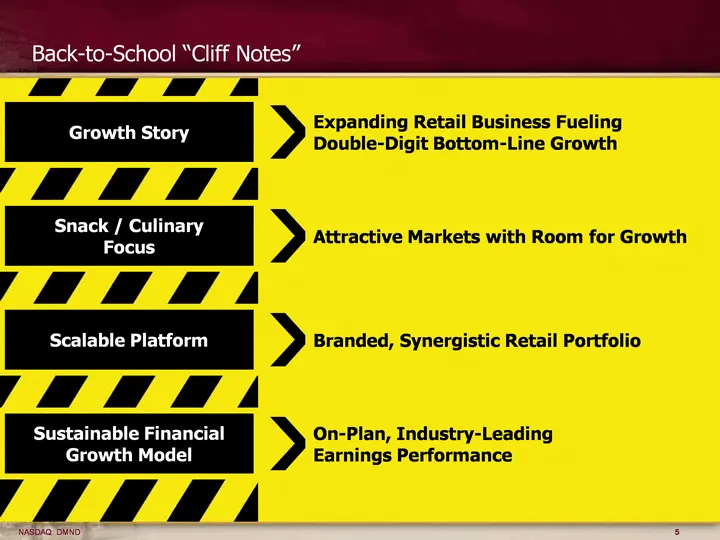
Slide 5: Back-to-School "Cliff Notes"
Back-to-School "Cliff Notes" Expanding Retail Business Fueling Double-Digit Bottom-Line Growth Growth Story Attractive Markets with Room for Growth Snack / Culinary Focus Branded, Synergistic Retail Portfolio Scalable Platform Sustainable Financial Growth Model On-Plan, Industry-Leading Earnings Per
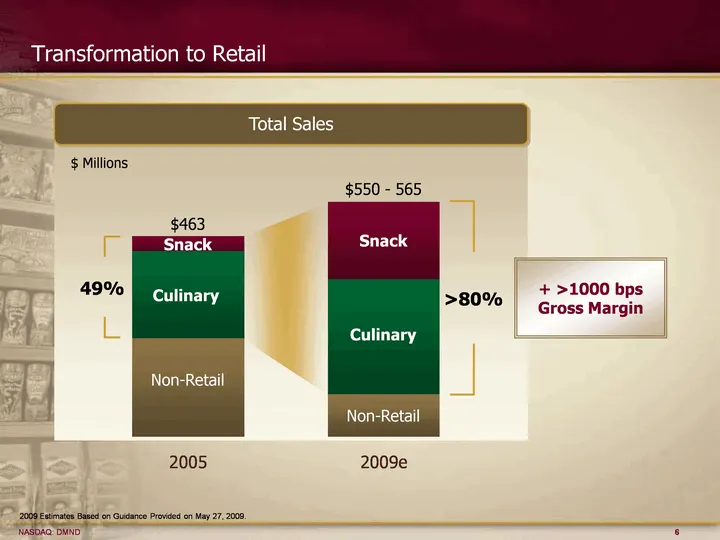
Slide 6: Transformation to Retail
Transformation to Retail Total Sales 2005 2009e non-retail 234 101 culinary 207 273 snack 35 183 $463 Snack Culinary Non-Retail $550 - 565 Snack Culinary Non-Retail 49% >80% + >1000 bps Gross Margin $ Millions 2009 Estimates Based on Guidance Provided on May 27, 2009.
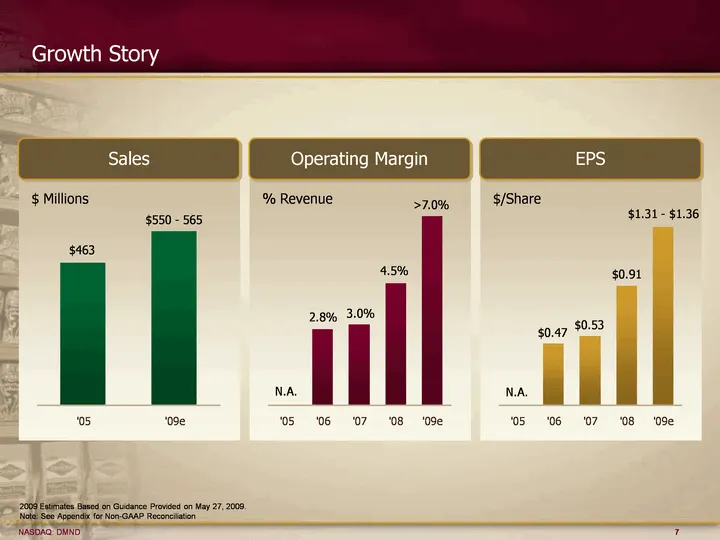
Slide 7: Growth Story
Growth Story Sales '05 '09e sales 463 565 $ Millions $463 $550 - 565 Operating Margin '05 '06 '07 '08 '09e Operating 0.028 0.03 0.045 0.07 % Revenue N.A. 2.8% EPS '05 '06 '07 '08 '09e eps 0 0.47 0.53 0.91 1.36 $/Share 3.0% 4.5% >7.0% N.A. $0.47 $0.53 $0.91 $1.31 - $1.36 2009 Estimates Based on Guida
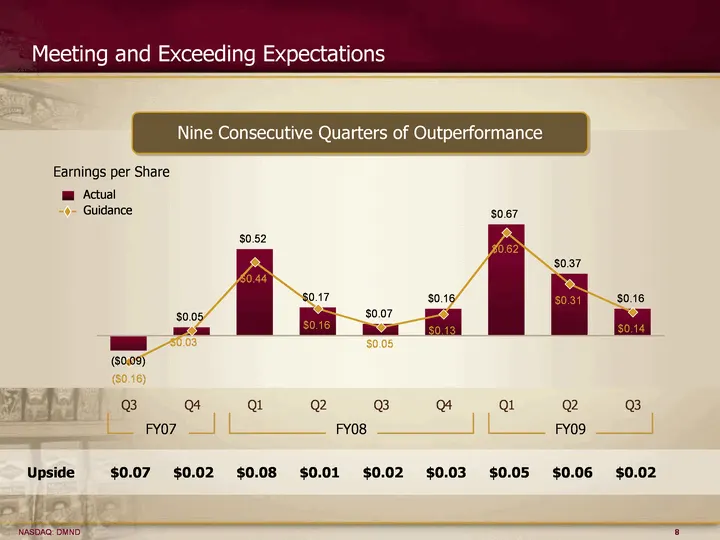
Slide 8: Meeting and Exceeding Expectations
Meeting and Exceeding Expectations Nine Consecutive Quarters of Outperformance Q3 -0.09 -0.16 Q4 0.05 0.03 Q1 0.52 0.44 Q2 0.17 0.16 Q3 0.07 0.05 Q4 0.16 0.13 Q1 0.67 0.62 Q2 0.37 0.31 Q3 0.16 0.14 Earnings per Share FY08 FY09 Actual Guidance FY07 Upside $0.07 $0.02 $0.08 $0.01 $0.02 $0.03 $0.05 $0.
Slide 9: Expanding Retail Presence
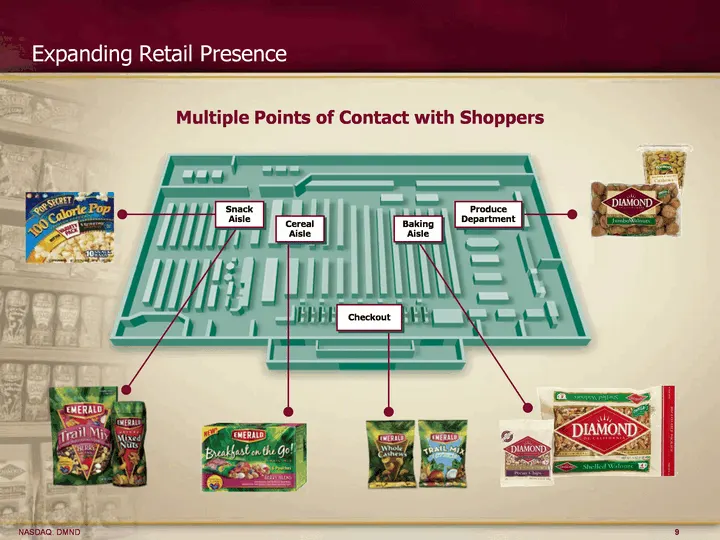
Expanding Retail Presence Multiple Points of Contact with Shoppers Cereal Aisle Checkout Baking Aisle Snack Aisle Produce Department
Slide 10: Large Addressable Markets
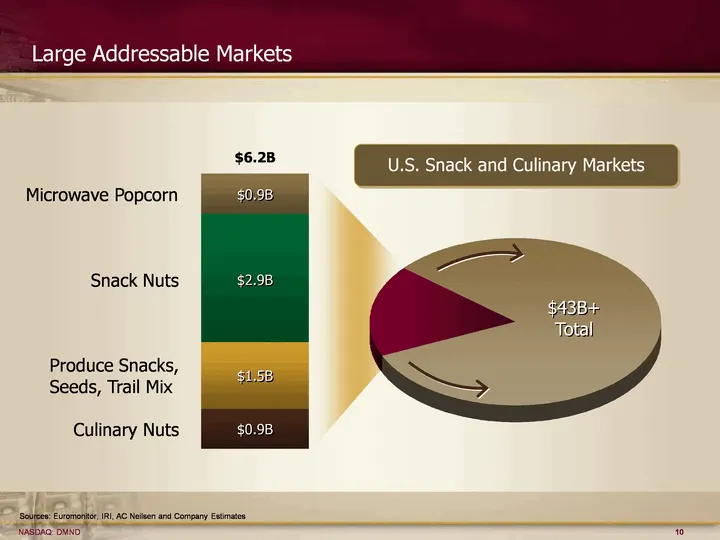
Large Addressable Markets Produce Snacks, Seeds, Trail Mix Culinary Nuts Category total 24.7 Snack 5.3 $43B+ Total 0.9 1.5 2.9 0.9 $0.9B $1.5B $0.9B $6.2B U.S. Snack and Culinary Markets Microwave Popcorn Snack Nuts $2.9B Sources: Euromonitor, IRI, AC Neilsen and Company Estimates
Slide 11: Snack: Bringing Excitement to the Category
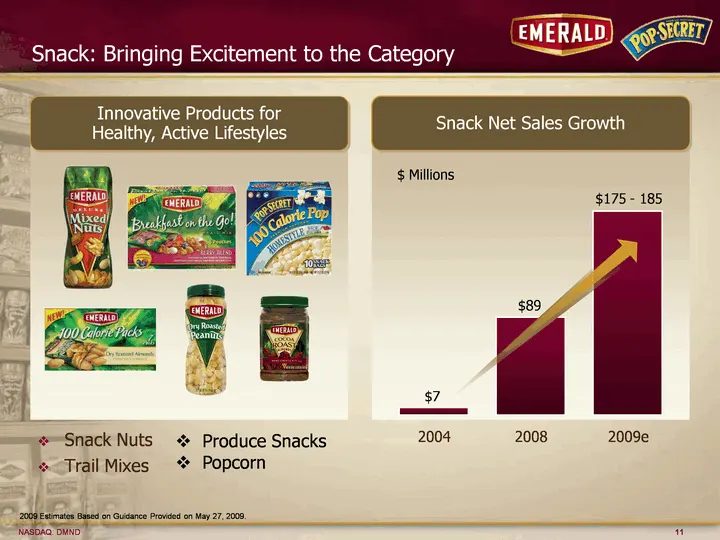
2004 2008 2009e 7 89 185 Snack Net Sales Growth Snack: Bringing Excitement to the Category Snack Nuts Trail Mixes $7 $89 $175 - 185 Snack Net Sales Growth $ Millions Innovative Products for Healthy, Active Lifestyles Produce Snacks Popcorn 2009 Estimates Based on Guidance Provided on May 27, 2009.
Slide 12: Culinary: History of Quality and Commitment
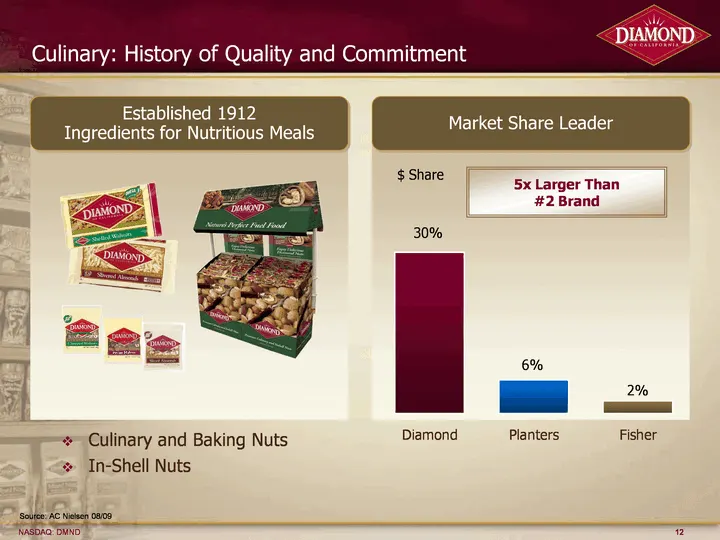
Culinary: History of Quality and Commitment Culinary and Baking Nuts In-Shell Nuts Market Share Leader $ Share Source: AC Nielsen 08/09 Established 1912 Ingredients for Nutritious Meals 30% 2% 5x Larger Than #2 Brand 6%
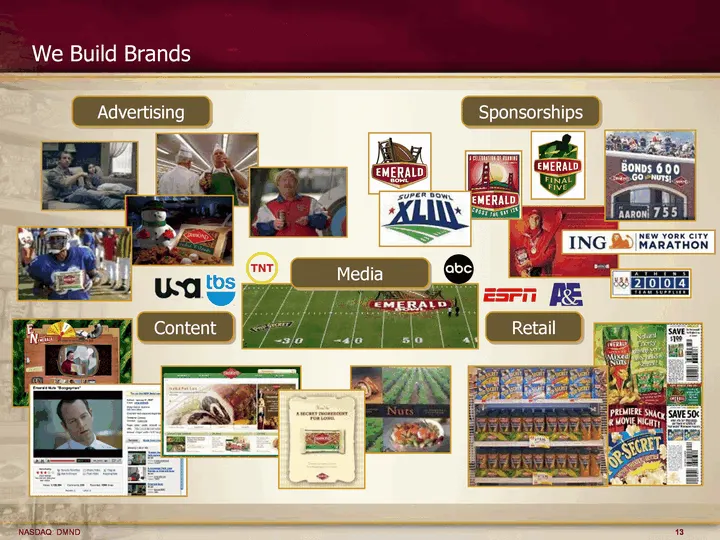
Slide 13: We Build Brands
We Build Brands Advertising Media Sponsorships Retail Content

Slide 14
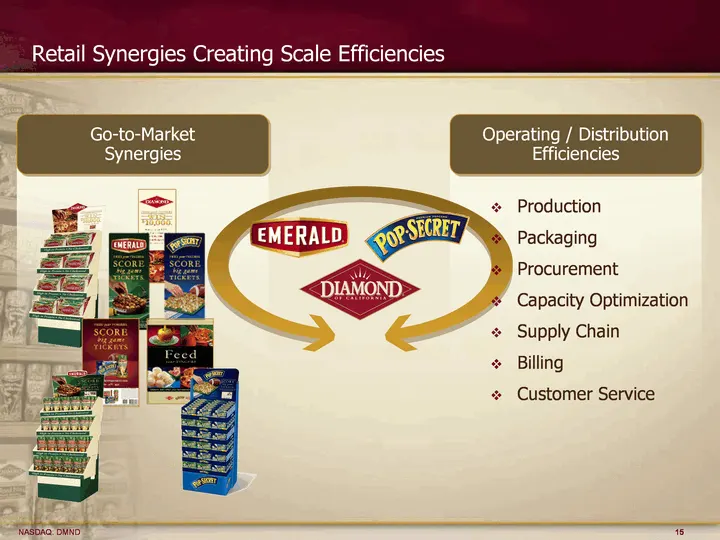
Slide 15: Operating / Distribution Efficiencies
Operating / Distribution Efficiencies Retail Synergies Creating Scale Efficiencies Production Packaging Procurement Capacity Optimization Supply Chain Billing Customer Service
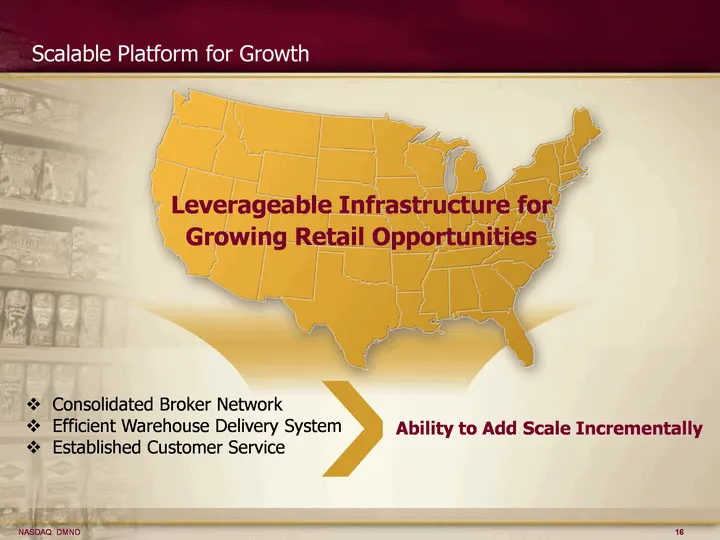
Slide 16: Scalable Platform for Growth
Scalable Platform for Growth Consolidated Broker Network Efficient Warehouse Delivery System Established Customer Service Leverageable Infrastructure for Growing Retail Opportunities Ability to Add Scale Incrementally

Slide 17: Lloyd J. Johnson, Executive Vice President, Chief Sales Officer
Lloyd J. Johnson Executive Vice President Chief Sales Officer
Slide 18: Building Retail Strength
Building Retail Strength Core Product Distribution Optimal Shelf Location Effective Merchandising Keys to Success
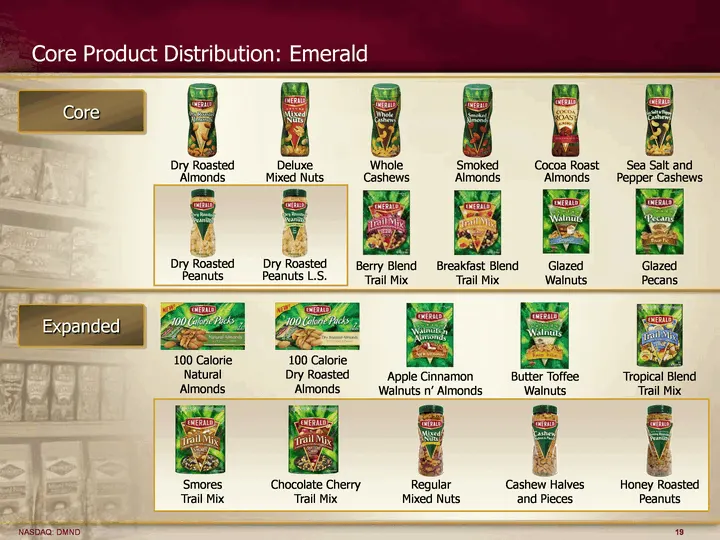
Slide 19: Core Product Distribution: Emerald
Core Product Distribution: Emerald Dry Roasted Almonds Deluxe Mixed Nuts Smoked Almonds Whole Cashews Cocoa Roast Almonds Sea Salt and Pepper Cashews Dry Roasted Peanuts Dry Roasted Peanuts L.S. Berry Blend Trail Mix Breakfast Blend Trail Mix Glazed Walnuts Glazed Pecans 100 Calorie Natural Almonds
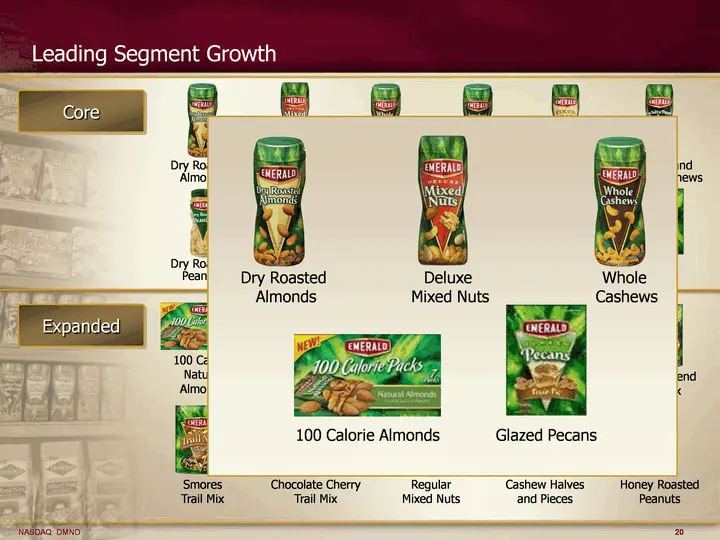
Slide 20: Leading Segment Growth
Leading Segment Growth Dry Roasted Almonds Deluxe Mixed Nuts Smoked Almonds Whole Cashews Cocoa Roast Almonds Sea Salt and Pepper Cashews Dry Roasted Peanuts Dry Roasted Peanuts L.S. Berry Blend Trail Mix Breakfast Blend Trail Mix Glazed Walnuts Glazed Pecans 100 Calorie Natural Almonds 100 Calorie
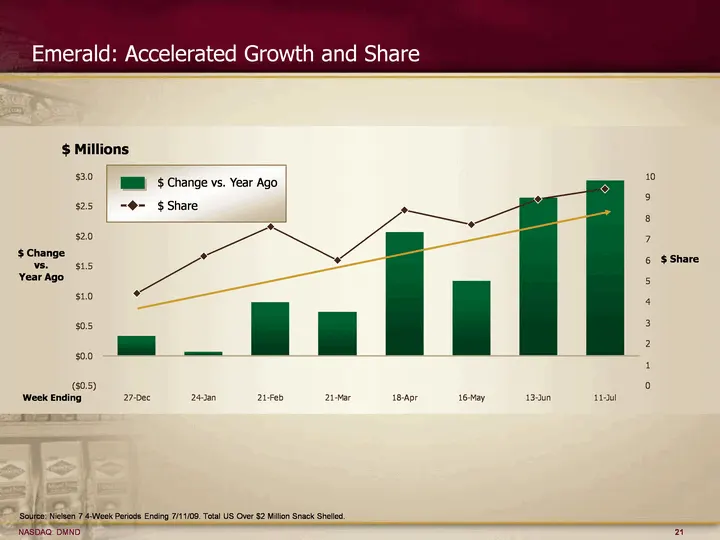
Slide 21: Emerald: Accelerated Growth and Share
12/27/2009 1/24/2009 2/21/2009 3/21/2009 4/18/2009 5/16/2009 6/13/2009 7/11/2009 3/22/2008 0.333472 0.0695 0.894 0.7262 2.064707 1.245672 2.641399 2.93 4.4 6.2 7.6 6 8.4 7.7 8.9 9.4 Emerald: Accelerated Growth and Share $ Millions Source: Nielsen 7 4-Week Periods Ending 7/11/09. Total US Over $2 Mil
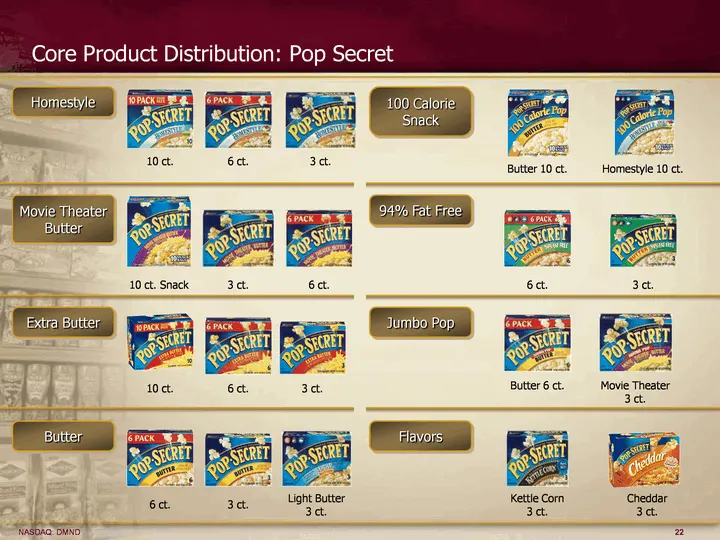
Slide 22: Core Product Distribution: Pop Secret
10 ct. Snack Core Product Distribution: Pop Secret Kettle Corn 3 ct. Movie Theater 3 ct. Cheddar 3 ct. Light Butter 3 ct. 6 ct. 3 ct. 6 ct. 3 ct. 6 ct. 3 ct. 6 ct. 3 ct. 6 ct. 3 ct. 10 ct. 10 ct. Butter 10 ct. Butter 6 ct. Homestyle Movie Theater Butter Extra Butter Butter 100 Calorie Snack 94% Fat
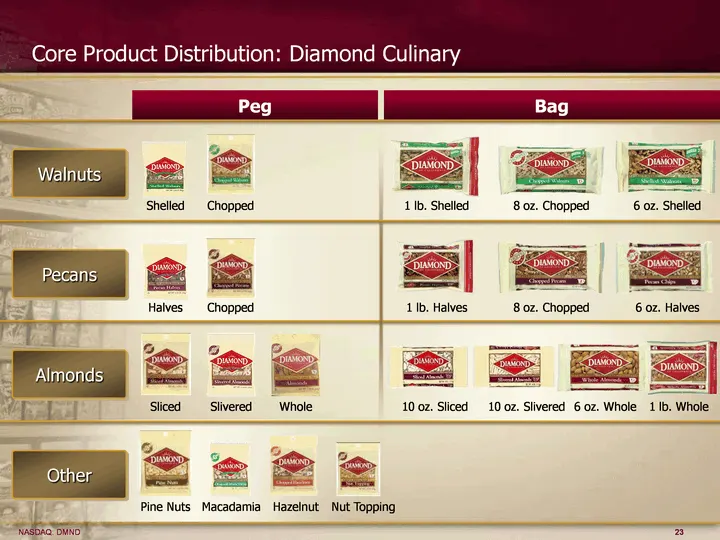
Slide 23: Core Product Distribution: Diamond Culinary
Core Product Distribution: Diamond Culinary Other Pine Nuts Macadamia Hazelnut Nut Topping Pecans Halves Chopped 1 lb. Halves 8 oz. Chopped 6 oz. Halves Peg Bag Walnuts Shelled Chopped 1 lb. Shelled 8 oz. Chopped 6 oz. Shelled Slivered Almonds
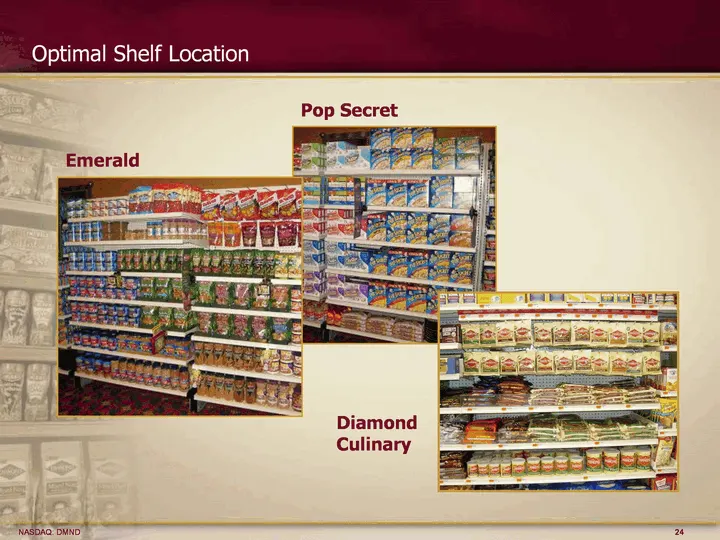
Slide 24: Optimal Shelf Location
Optimal Shelf Location Pop Secret Emerald Diamond Culinary
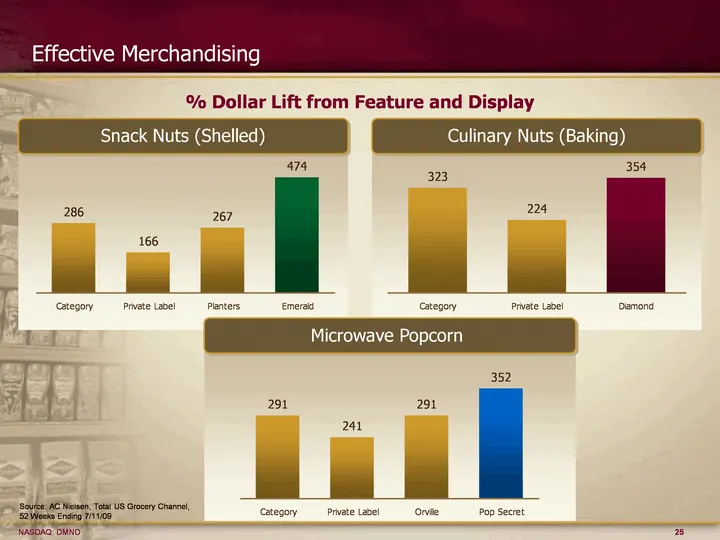
Slide 25: Effective Merchandising
Culinary Nuts (Baking) Category Private Label Diamond 323 224 354 Snack Nuts (Shelled) Category Private Label Planters Emerald 286 166 267 474 Effective Merchandising Microwave Popcorn Category Private Label Orville Pop Secret 291 241 291 352 % Dollar Lift from Feature and Display Source: AC Nielsen
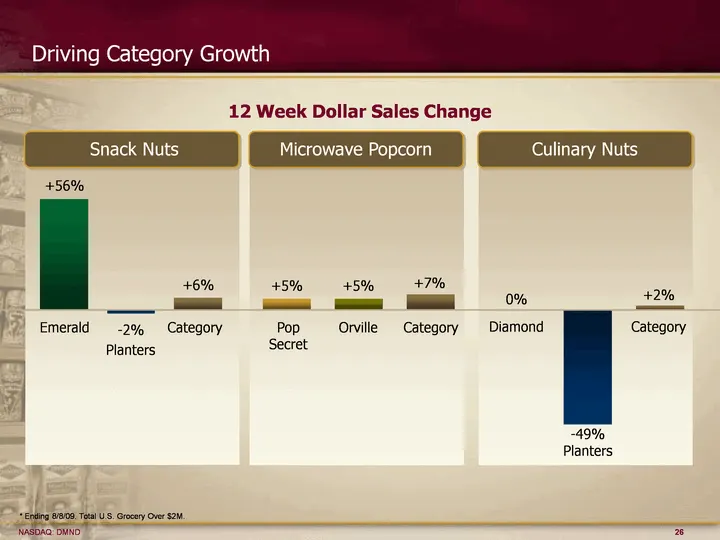
Slide 26: Driving Category Growth
Driving Category Growth 12 Week Dollar Sales Change * Ending 8/8/09. Total U.S. Grocery Over $2M. Microwave Popcorn Pop Secret Orville Category 5 5 7 +5% +5% +7% Pop Secret Orville Category Snack Nuts EN Plant Category 56 -2 6 +56% - -2% +6% Emerald Planters Category Culinary Nuts Diamond Planters C

Slide 27: Steve M. Neil, Executive Vice President, Chief Financial & Administrative Officer
Steve M. Neil Executive Vice President Chief Financial & Administrative Officer
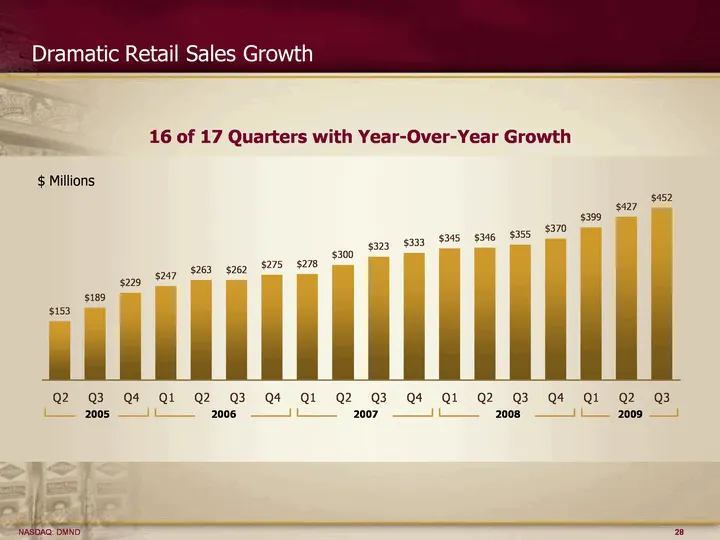
Slide 28: Dramatic Retail Sales Growth
Dramatic Retail Sales Growth $ Millions 2005 Q2 Q3 Q4 Q1 Q2 Q3 Q4 Q1 Q2 Q3 Q4 Q1 Q2 Q3 Q4 Q1 Q2 Q3 153.1 188.5 228.5 246.7 262.6 262.1 274.9 278.2 300.4 322.8 333.1 344.5 346.2 355.2 370.4 398.8 427 451.5 2006 2007 2008 2009 16 of 17 Quarters with Year-Over-Year Growth
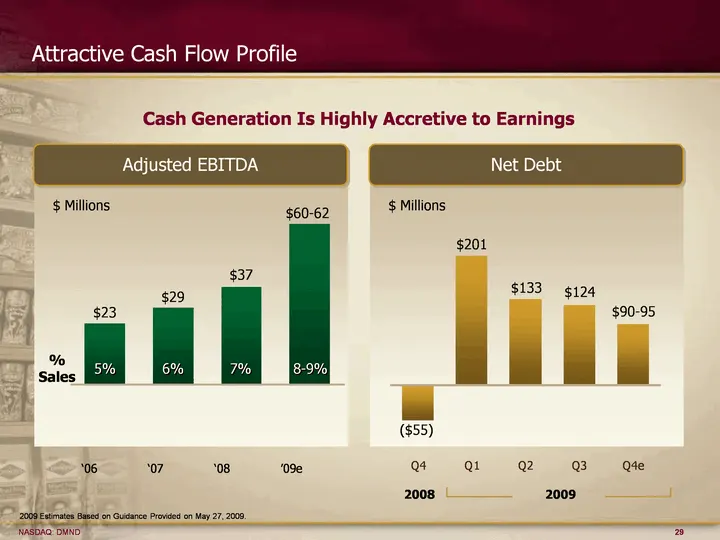
Slide 29: Attractive Cash Flow Profile
Attractive Cash Flow Profile Adjusted EBITDA '06 '07 '08 '09e 23 29 37 61 $ Millions $23 $60-62 $29 $37 % Sales 5% 6% 7% 8-9% Cash Generation Is Highly Accretive to Earnings Net Debt Q4 Q1 Q2 Q3 Q4e -55 201 133 124 95 $ Millions ($55) $124 $201 $133 $90-95 2009 2008 2009 Estimates Based on Guidance
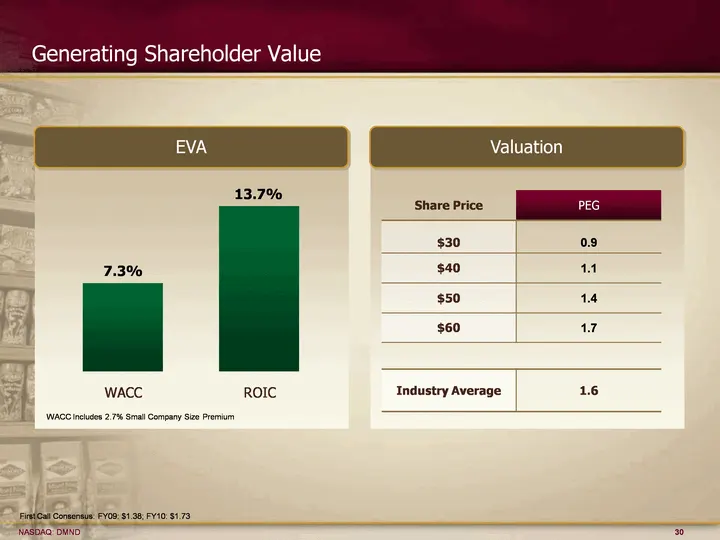
Slide 30: Generating Shareholder Value
Generating Shareholder Value EVA Valuation First Call Consensus: FY09: $1.38; FY10: $1.73 WACC Includes 2.7% Small Company Size Premium WACC ROIC 7.3 13.7 7.3% 13.7% Share Price PEG $30 0.9 $40 1.1 $50 1.4 $60 1.7 Industry Average 1.6
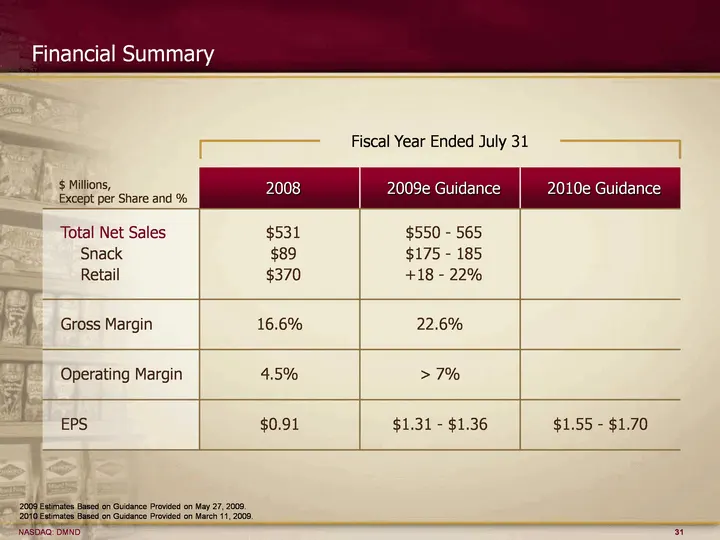
Slide 31: Financial Summary
Financial Summary $ Millions, Except per Share and % 2008 2009e Guidance 2010e Guidance Total Net Sales Snack Retail $531$89 $370 $550 - 565$175 - 185+18 - 22% Gross Margin 16.6% 22.6% Operating Margin 4.5% > 7% EPS $0.91 $1.31 - $1.36 $1.55 - $1.70 Fiscal Year Ended July 31 2009 Estimates Based on
Slide 32: Ahead of Initial Long-Term Targets
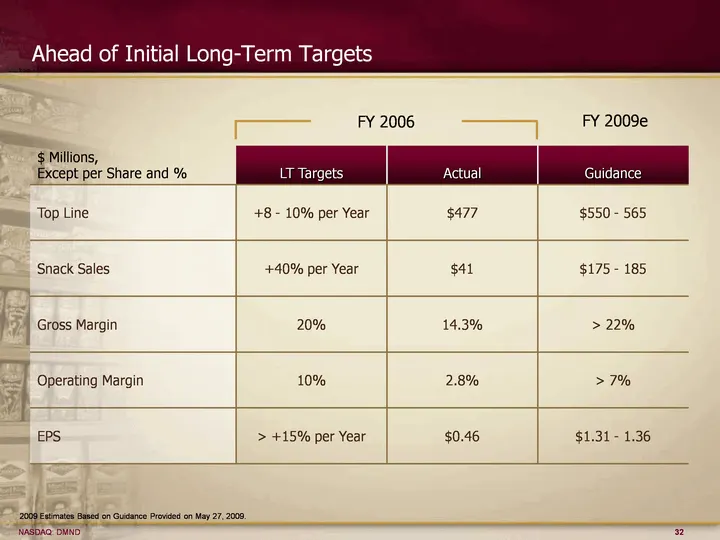
Ahead of Initial Long-Term Targets $ Millions, Except per Share and % LT Targets Actual Guidance Top Line +8 - 10% per Year $477 $550 - 565 Snack Sales +40% per Year $41 $175 - 185 Gross Margin 20% 14.3% > 22% Operating Margin 10% 2.8% > 7% EPS > +15% per Year $0.46 $1.31 - 1.36 FY 2006 FY 2009e 200
Slide 33: A Transformational Company
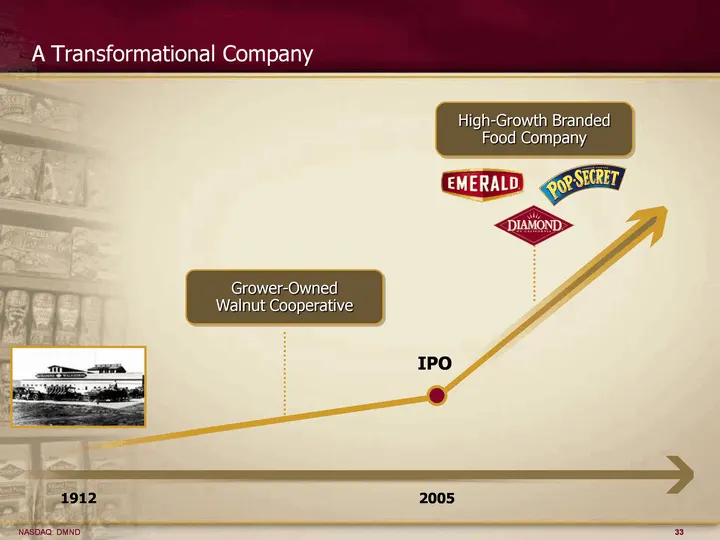
A Transformational Company 1912 2005 IPO Grower-Owned Walnut Cooperative High-Growth Branded Food Company
Slide 34: Driving Sustainable, Long-Term Growth Appendix
Driving Sustainable, Long-Term Growth Appendix
Slide 35: Non-GAAP Reconciliation
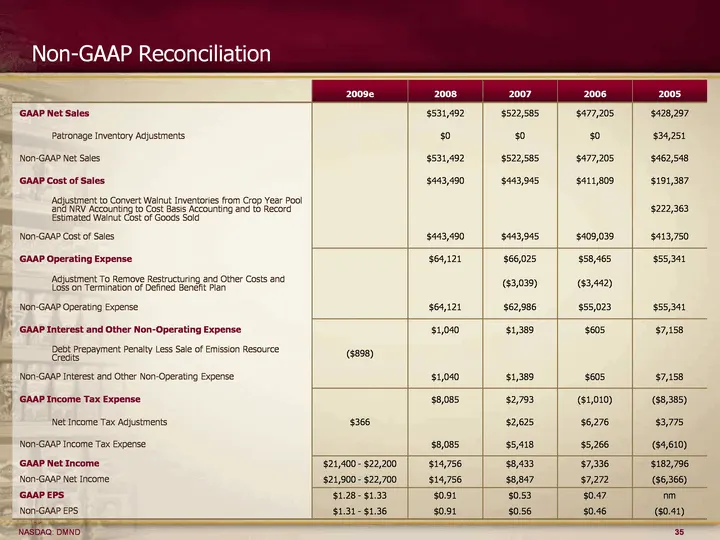
Non-GAAP Reconciliation 2009e 2008 2007 2006 2005 GAAP Net Sales GAAP Net Sales GAAP Net Sales $531,492 $522,585 $477,205 $428,297 Patronage Inventory Adjustments $0 $0 $0 $34,251 Non-GAAP Net Sales Non-GAAP Net Sales Non-GAAP Net Sales $531,492 $522,585 $477,205 $462,548 GAAP Cost of Sales GAAP Cos
Source: SEC EDGAR · 8-K filed Sep 9, 2009
More decks from Diamond Foods Inc
 Investor Presentation (June 2013)21 slides · Jun 17, 2013
 Investor Presentation (April 2013)21 slides · Apr 29, 2013
 Investor Presentation (February 2013)20 slides · Feb 26, 2013
 Q3 2012 Earnings Presentation18 slides · Nov 14, 2012
 Debt Investor Presentation (May 2012)18 slides · May 23, 2012
 Barclays Capital Back-to-School Consumer Conference 201141 slides · Sep 7, 2011