Diamond Foods — Merger or Acquisition (June 2011)
23 slides from Diamond Foods's merger presentation, Jun 21, 2011
Slide 1: Investing for a Strong Future June 2011
Investing for a Strong Future June 2011
Slide 2: Forward-looking statements
This document contains forward-looking statements as defined by the Private Securities Litigation Reform Act of 1995, including projections of Diamond’s results. The words “anticipate,” “expect,” “believe,” “goal,” “plan,” “intend,” “estimate,” “may,” “will,” “would” and similar expressions and vari
Slide 3: Additional information about the proposed transaction
In connection with the proposed transaction between Diamond and P&G, Diamond filed a registration statement on Form S-4 with the SEC, but this registration statement has not become effective. This registration statement included a proxy statement of Diamond that also constitutes a prospectus of Diam
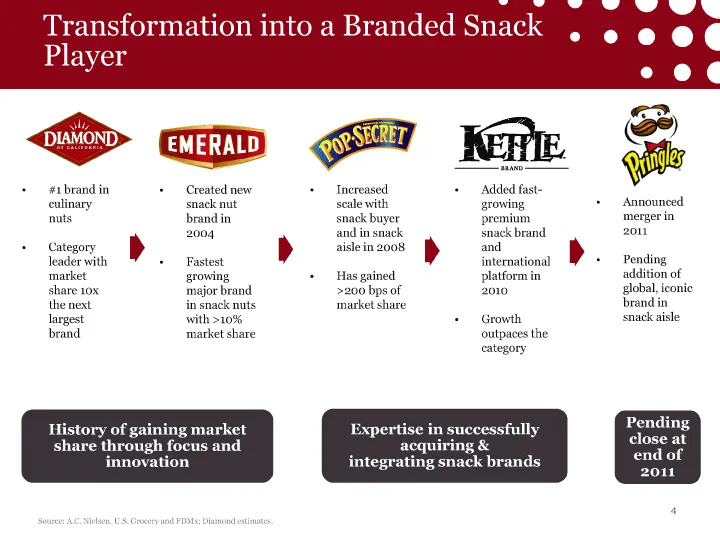
Slide 4: Diamond brand positions and market share
Created new snack nut brand in 2004 • Fastest growing major brand in snack nuts with >10% market share • Increased scale with snack buyer and in snack aisle in 2008 • Has gained >200 bps of market share • #1 brand in culinary nuts • Category leader with market share 10x the next largest brand • Adde
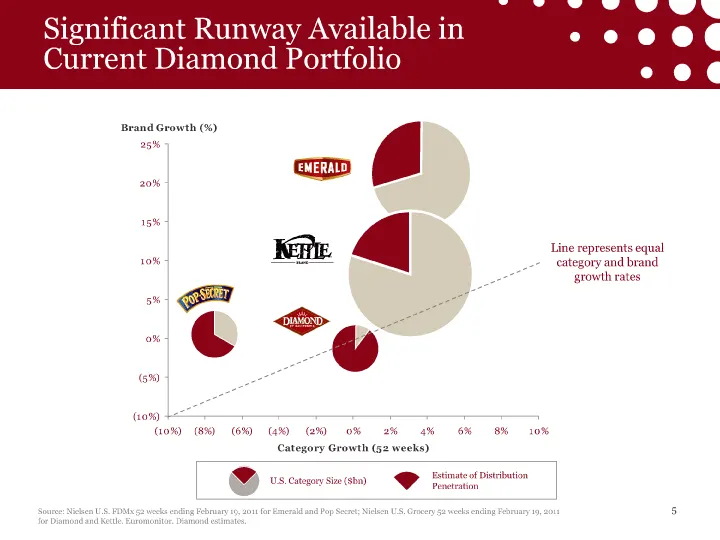
Slide 5: Significant Runway Available in Current Diamond Portfolio
Sinificant Runway Avaiblable in Current Diamond Portfolio Pending close at end of 2011
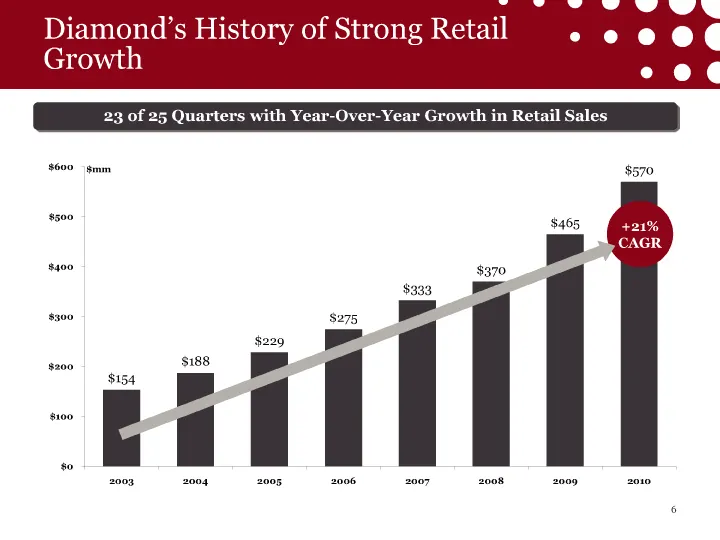
Slide 6: Brand growth versus category growth
Estimate of Distribution Penetration(10%)(5%)0%5%10%15%20%25%(10%)(8%)(6%)(4%)(2%)0%2%4%6%8%10%Category Growth (52 weeks)Brand Growth (%) 5Source: Nielsen U.S. FDMx 52 weeks ending February 19, 2011 for Emerald and Pop Secret; Nielsen U.S. Grocery 52 weeks ending February 19, 2011for Diamond and Ket
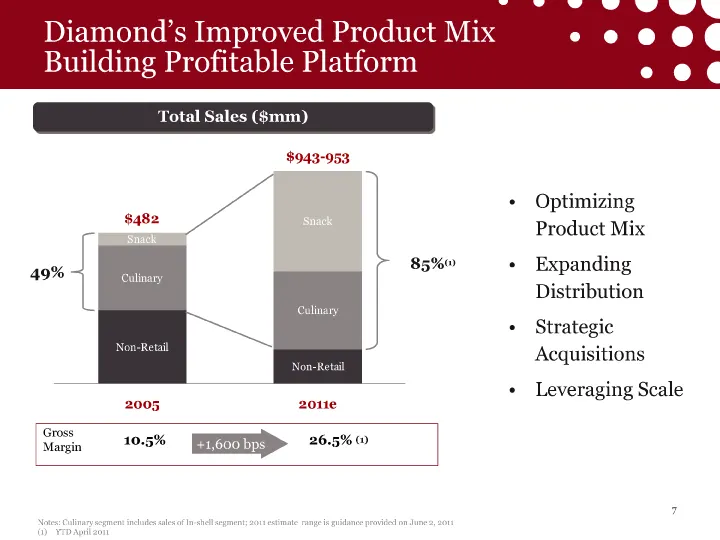
Slide 7: Diamond net sales and gross margin growth
$482$943-95320052011e P Notes: Culinary segment includes sales of In-shell segment; 2011 estimate range is guidance provided on June 2, 2011 (1)YTD April 2011 • Optimizing Product Mix • Expanding Distribution • Strategic Acquisitions • Leveraging Scale 85%(1) Gross Margin10.5% 26.5% 49% (1)
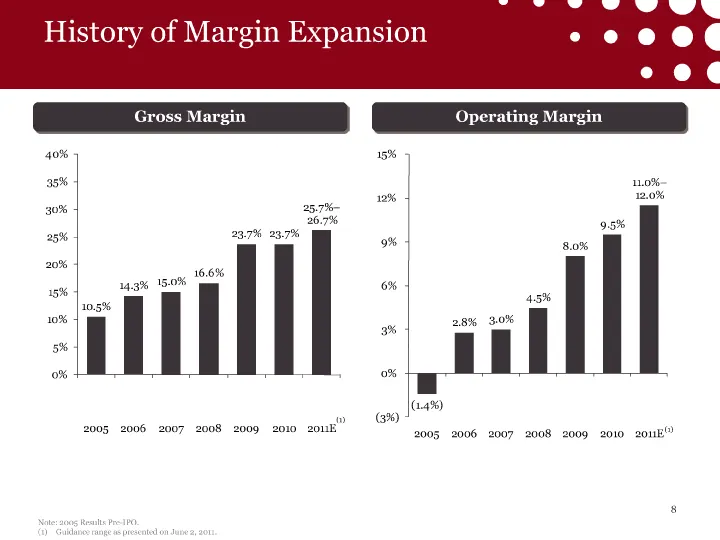
Slide 8: Gross margin and EBITDA margin history
n10.5%14.3%15.0%16.6%23.7%23.7%25.7%—26.7%0%5%10%15%20%25%30%35%40%2005200620072008200920102011E Note: 2005 Results Pre-IPO. (1)Guidance range as presented on June 2, 2011.(1.4%)2.8%3.0%4.5%8.0%9.5%11.0%—12.0%(3%)0% 3% 6% 9% 12% 15% 2005200620072008200920102011E(1) (1) Gross
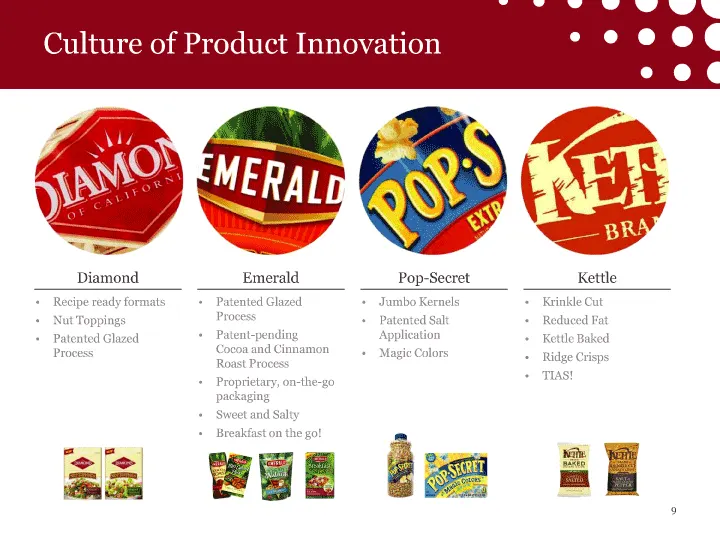
Slide 9: Brand innovation and patented processes
Emerald • Patented Glazed Process • Patent-pendingCocoa and Cinnamon Roast Process • Proprietary, on-the-go packaging • Sweet and Salty • Breakfast on the go! Diamond • Recipe ready formats • Nut Toppings • Patented Glazed Process Pop-Secret • Jumbo Kernels • Patented Salt Application • Magic Colors
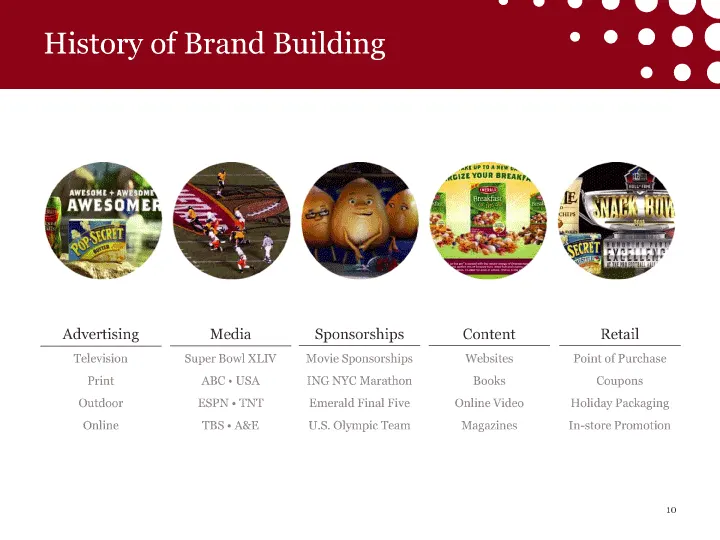
Slide 10: Advertising and sponsorships
Advertising Television Print Outdoor Online Sponsorships Movie Sponsorships ING NYC Marathon Emerald Final Five U.S. Olympic TeamContentWebsitesBooksOnline VideoMagazines Retail Point of Purchase Coupons Holiday Packaging In-store Promotion Media Super Bowl XLIV ABC • USA ESPN • TNT TBS • A&E
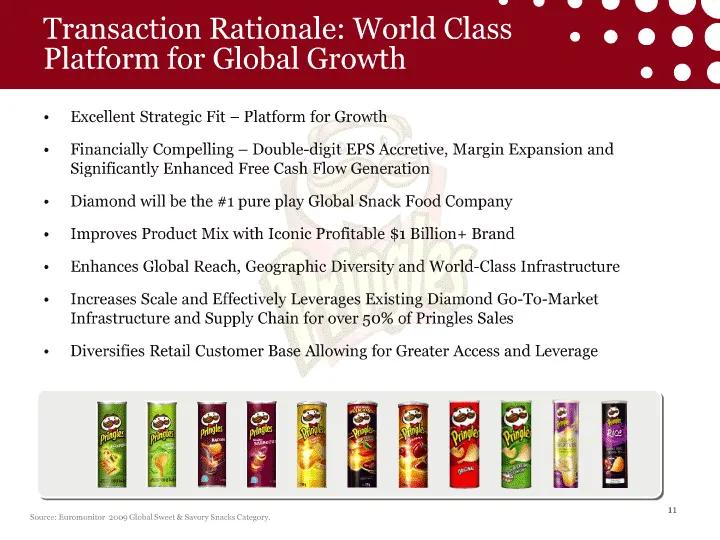
Slide 11: Excellent Strategic Fit and Financially Compelling
Excellent Strategic Fit —Platform for Growth • Financially Compelling —Double-digit EPS Accretive, Margin Expansion and Significantly Enhanced Free Cash Flow Generation • Diamond will be the #1 pure play Global Snack Food Company • Improves Product Mix with Iconic Profitable $1 Billion+ Brand • Enha
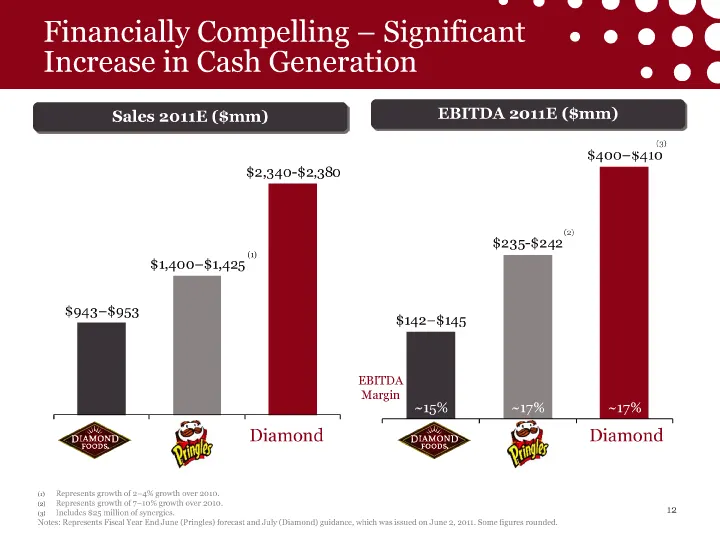
Slide 12: Combined net sales and EBITDA
EBITDA Margin$943—$953$1,400—$1,425$2,340-$2,380 $142—$145$235-$242$400—$410n (1)Represents growth of 2—4% growth over 2010. (2)Represents growth of 7—10% growth over 2010. (3)Includes $25 million of synergies. Notes: Represents Fiscal Year End June (Pringles) forecast and July (Diamond) guidance, w
Slide 13: Pro forma margins and leverage
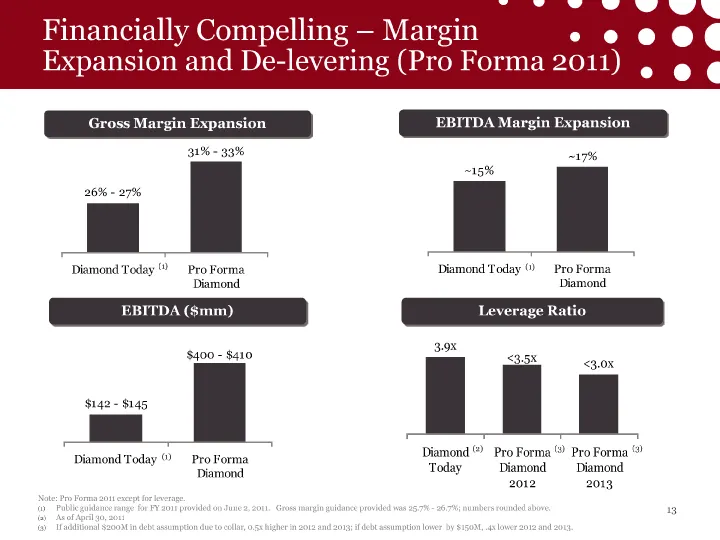
17%~15%Diamond TodayPro FormaDiamond31% — 33%26% — 27%Diamond TodayPro FormaDiamond<3.0x <3.5x3.9xDiamondTodayPro FormaDiamond2012Pro FormaDiamond2013 (3) (1) (1) (1) Note: Pro Forma 2011 except for leverage. (1)Public guidance range for FY 2011 provided on June 2, 2011. Gross margin guidance provid
Slide 14: Global snack rankings by retail sales
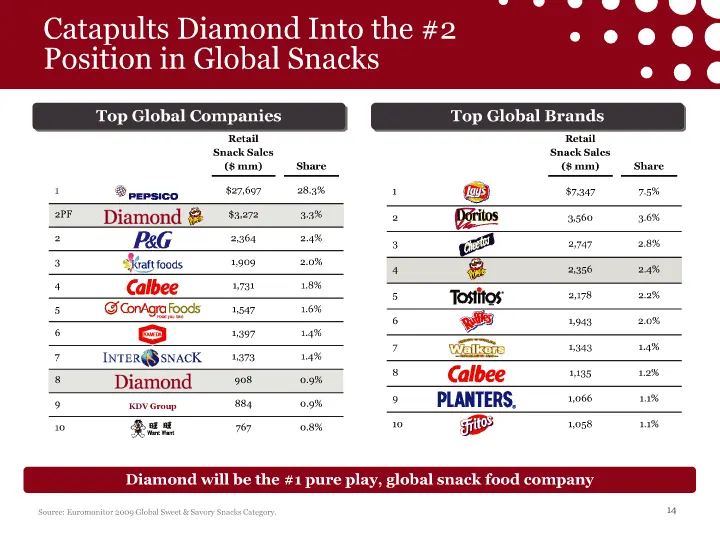
KDV Group Retail Snack Sales ($ mm) Share 1 $27,697 28.3% 2PF $3,272 3.3% 2 2,364 2.4% 3 1,909 2.0% 4 1,731 1.8% 5 1,547 1.6% 6 1,397 1.4% 7 1,373 1.4% 8 908 0.9% 9 884 0.9% 10 767 0.8% C Source: Euromonitor 2009 Global Sweet & Savory Snacks Category. s Retail Snack Sales ($ mm) Share 1 $7,347 7.5%
Slide 15: Leader in brand awareness
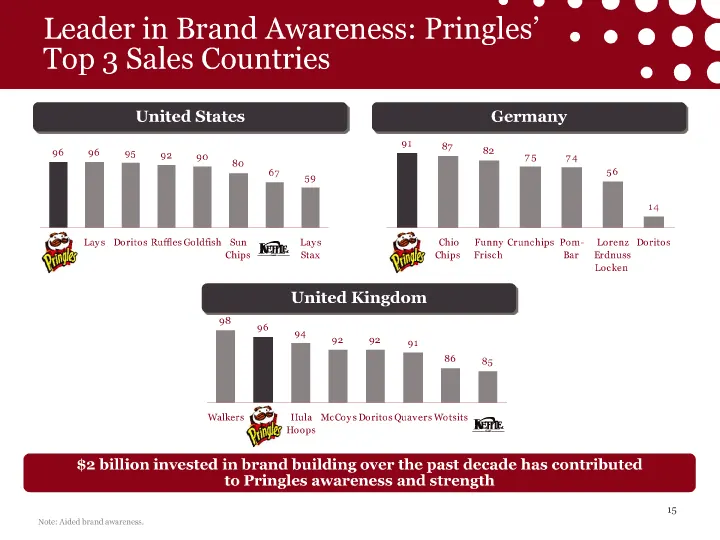
91878275745614PChioChips FunnyFrisch Crunchips Pom-Bar LorenzErdnussLocken Doritos9696959290806759PLaysDoritosRufflesGoldfishSunChipsKettleChipsLaysStax9698949292918685Walkers PHulaHoopsMcCoysDoritosQuaversWotsitsKettleChips Note: Aided brand awareness.Leader in Brand Awareness: Pringles’ Top 3 Sale
Slide 16: criss in every can!
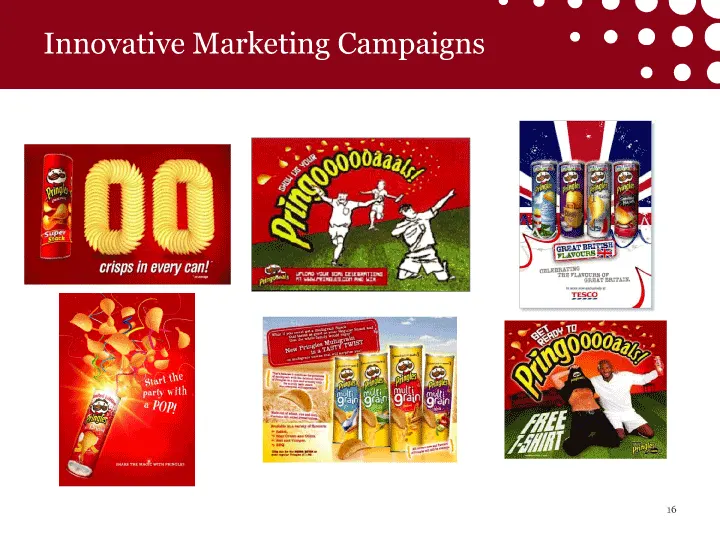
; criss in every can! {14 Jl
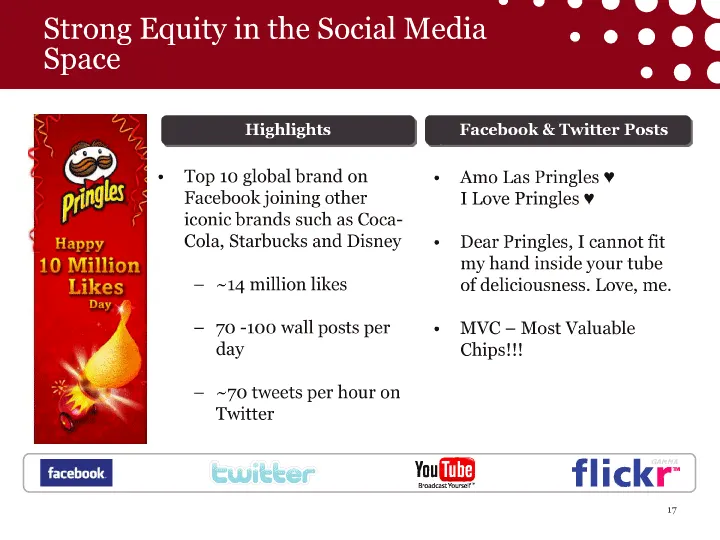
Slide 17: Top global brand on Facebook
Top 10 global brand on Facebookjoining other iconic brands such as Coca-Cola, Starbucks and Disney—14 million likes —70 -100 wall posts per day 70 tweets per hour on Twitter Amo Las Pringles I Love Pringles Dear Pringles, I cannot fit my hand inside your tube of deliciousness. Love, me. • MVC —Most
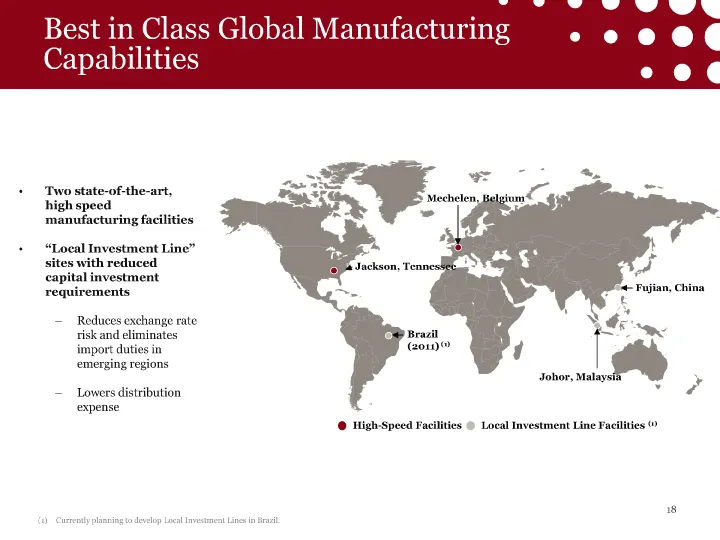
Slide 18: High-speed and Local Investment Line manufacturing facilities
Two state-of-the-art, high speed manufacturing facilities • “Local Investment Line” sites with reduced capital investment requirements—Reduces exchange rate risk and eliminates import duties in emerging regions —Lowers distribution expense (1)Currently planning to develop Local Investment Lines in B
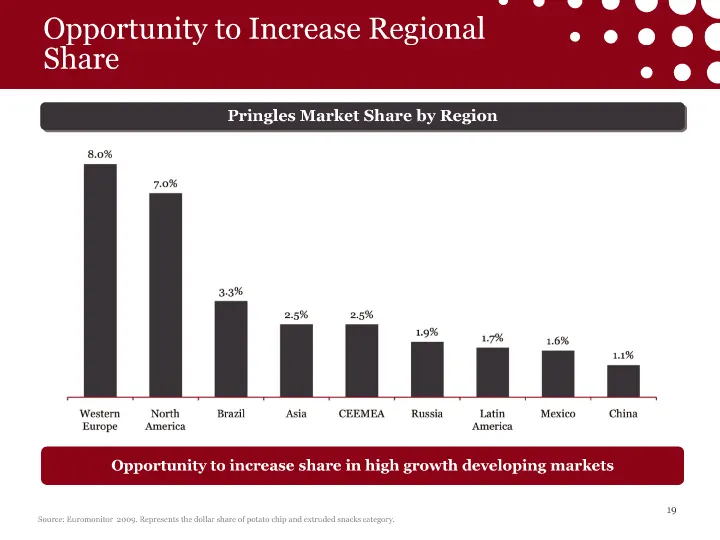
Slide 19: Opportunity to increase share
Source: Euromonitor 2009. Represents the dollar share of potato chip and extruded snacks category. Opportunity to increase share in
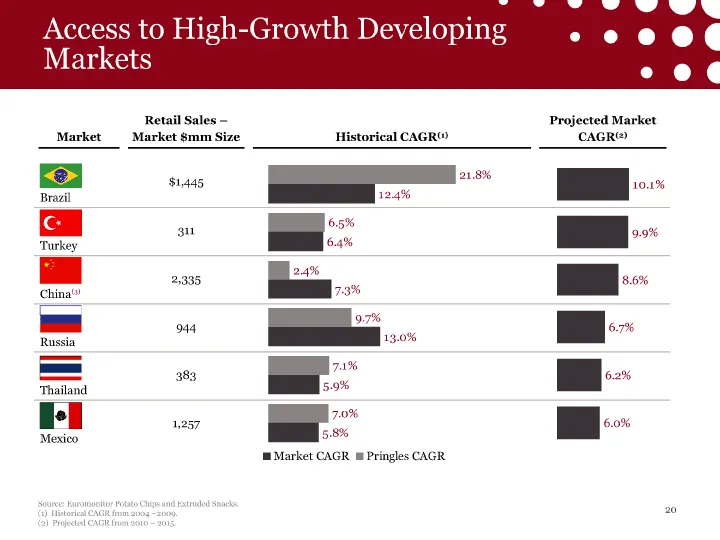
Slide 20: Emerging market sales and growth rates
AcMarket Retail Sales —Market $mm Size Historical CAGR(1) Projected Market CAGR(2) Brazil $1,445 Turkey 311 China 2,335 Russia 944 Thailand 383 Mexico 1,257 6.0%6.2%6.7%8.6%9.9%10.1%5.8%5.9%13.0%7.3%6.4%12.4%7.0%7.1%9.7%2.4%6.5%21.8%Market CAGRPringles CAGR Source: Euromonitor Potato Chips and Extru
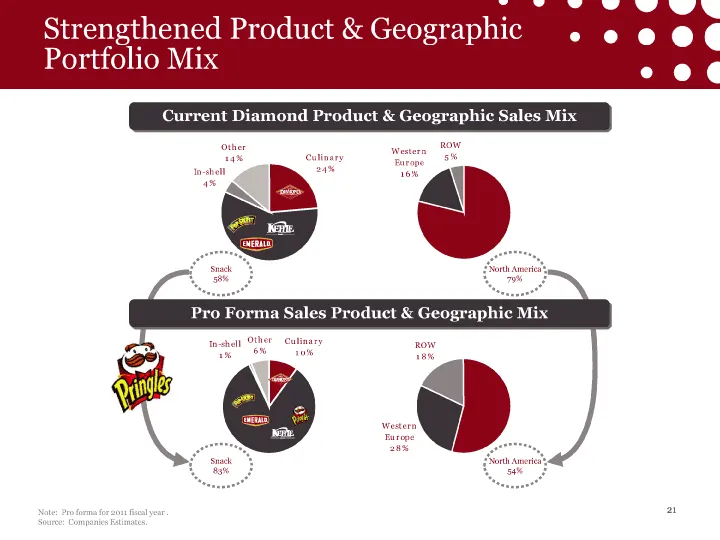
Slide 21: Pro forma sales mix by segment and region
Note: Pro forma for 2011 fiscal year . Source: Companies Estimates. Culinary24%In-shell4%Other14%Western Europe16%ROW5%Culinary10%In-shell1%Other6% Western Europe28%ROW18% Snack58% North America 79% Snack 83%North America54%
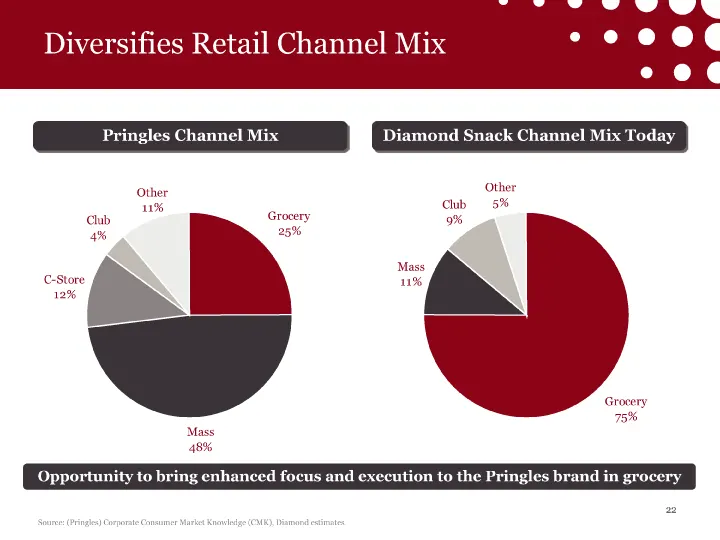
Slide 22: Retail channel mix and grocery opportunity
Source: (Pringles) Corporate Consumer Market Knowledge (CMK), Diamond estimatesGrocery25%Mass48%C-Store12%Club4%Other11%Pringles Grocery75%Mass11%Club9%Other5%Opportunity to bring enhanced focus and execution to the Pringles brand in grocery
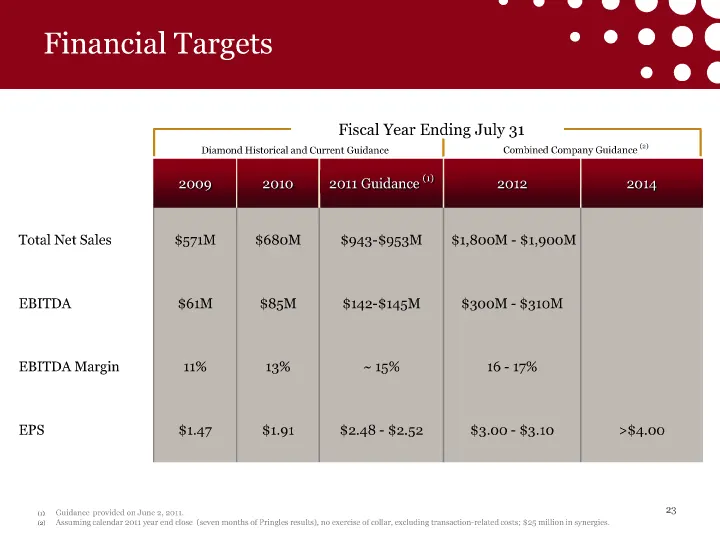
Slide 23: Diamond historical and combined company guidance
Fiscal Year Ending July 31 Total Net Sales $571M $680M $943-$953M $1,800M -$1,900M EBITDA $61M $85M $142-$145M $300M -$310M EBITDA Margin 11% 13% ~ 15% 16 -17% EPS $1.47 $1.91 $2.48 -$2.52 $3.00 -$3.10 >$4.00 Diamond Historical and Current Guidance (1)Guidance provided on June 2, 2011. (2)Assuming c
Source: SEC EDGAR · 8-K filed Jun 21, 2011
More decks from Diamond Foods Inc
 Investor Presentation (June 2013)21 slides · Jun 17, 2013
 Investor Presentation (April 2013)21 slides · Apr 29, 2013
 Investor Presentation (February 2013)20 slides · Feb 26, 2013
 Q3 2012 Earnings Presentation18 slides · Nov 14, 2012
 Debt Investor Presentation (May 2012)18 slides · May 23, 2012
 Barclays Capital Back-to-School Consumer Conference 201141 slides · Sep 7, 2011