Tompkins Financial Corporation · AMEX:TMP
Tompkins Financial — Piper Sandler Financial Services Conference 2026
24 slides from Tompkins Financial's conference presentation, Nov 16, 2026

Slide 1: Investor Presentation, Piper Sandler Financial Services Conference
Investor Presentation Date Piper Sandler Financial Services Conference November 17-18
Slide 2: Safe Harbor
2 Safe Harbor This presentation contains "forward-looking statements" within the meaning of the Private Securities Litigation Reform Act of 1995. The statements contained in this presentation that are not statements of historical fact may include forward-looking statements that involve a number of r
Slide 3: Tompkins Financial Corporation: Strength, Stability and Scale
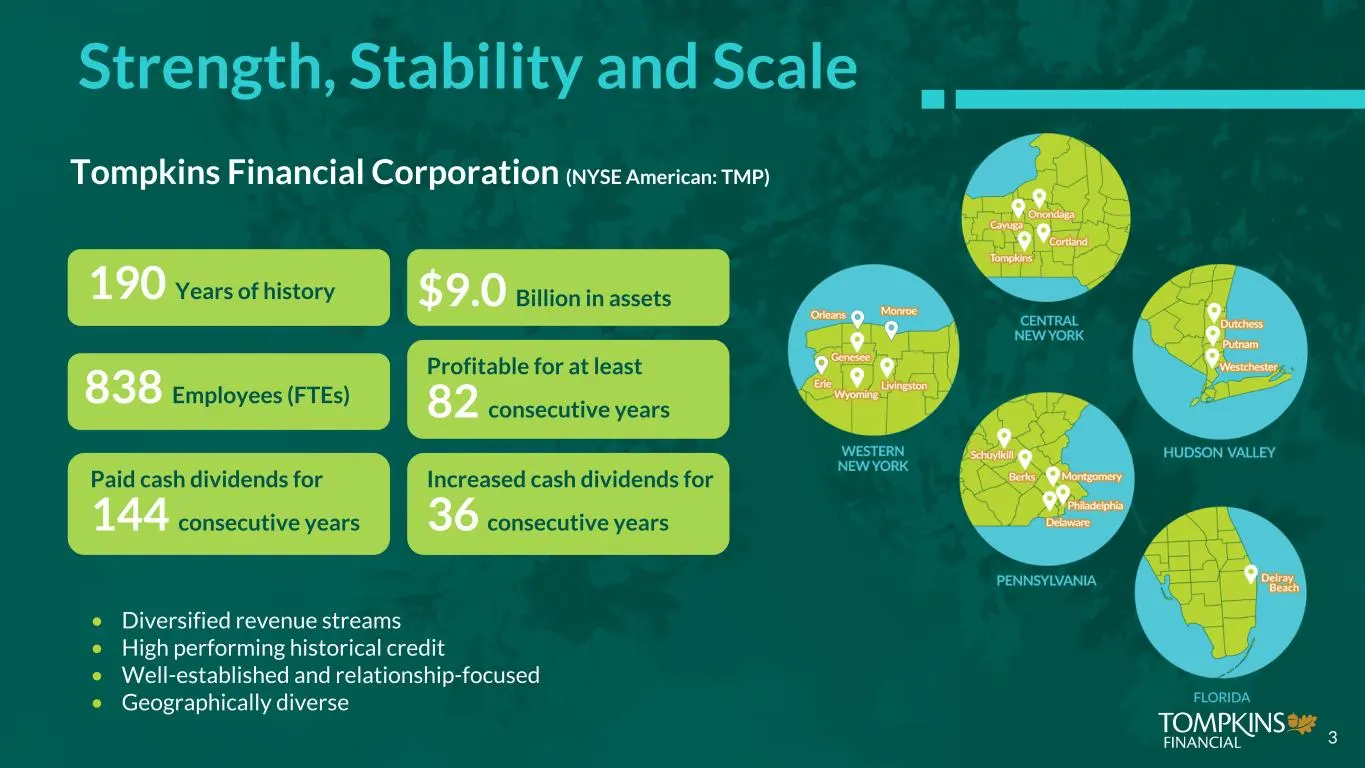
Tompkins Financial Corporation (NYSE American: TMP) 190 Years of history 838 Employees (FTEs) 82 consecutive years Profitable for at least 144 consecutive years Paid cash dividends for 36 consecutive years Increased cash dividends for Strength, Stability and Scale • Diversified revenue streams • Hig
Slide 4: One Tompkins
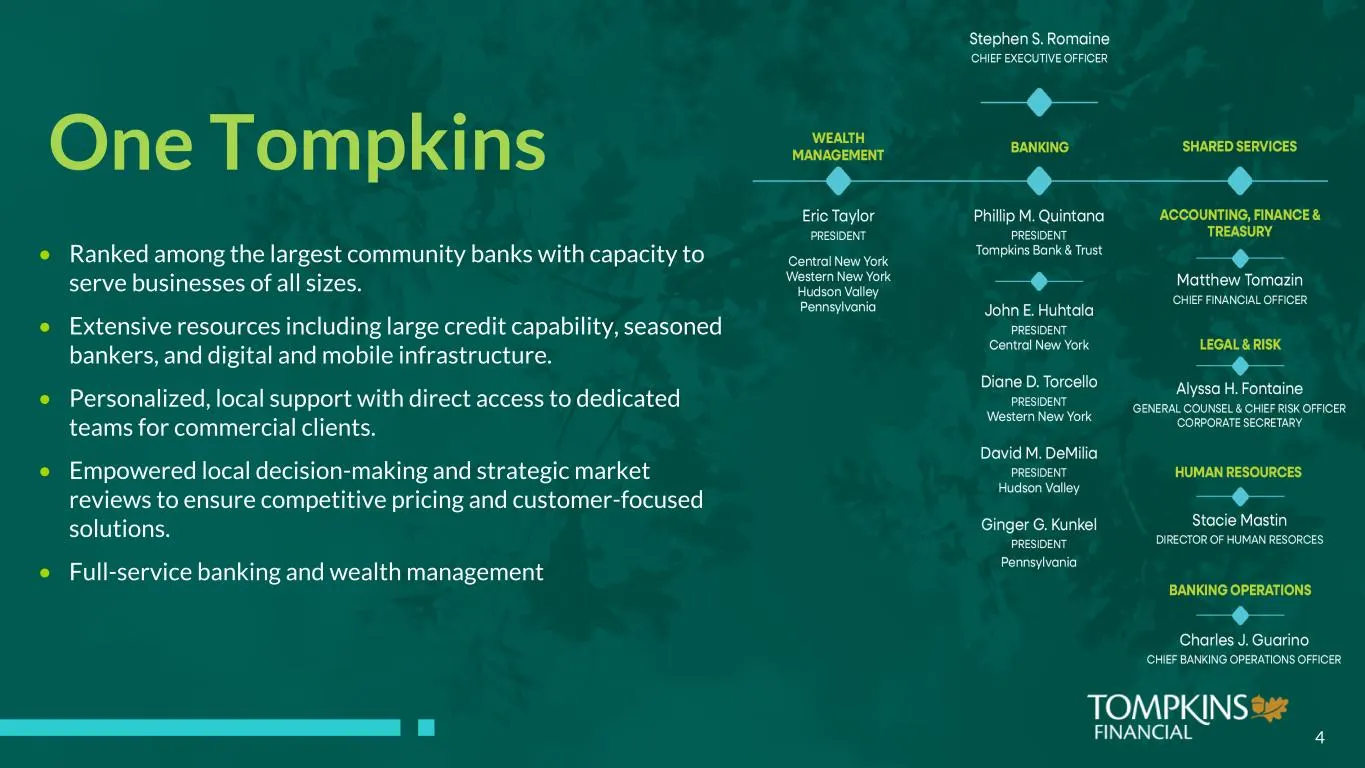
4 • Ranked among the largest community banks with capacity to serve businesses of all sizes. • Extensive resources including large credit capability, seasoned bankers, and digital and mobile infrastructure. • Personalized, local support with direct access to dedicated teams for commercial clients. •
Slide 5: Our History
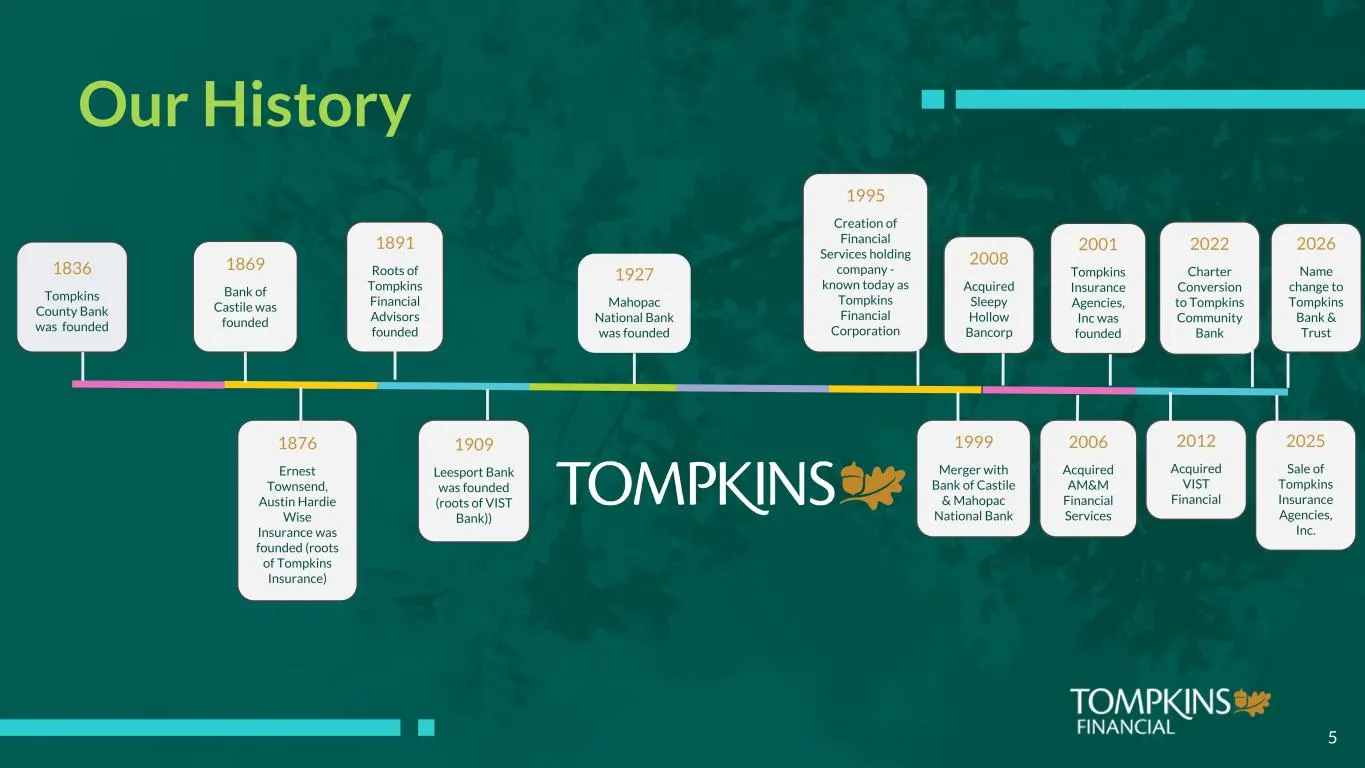
5 Our History 1836 Tompkins County Bank was founded 1869 Bank of Castile was founded 1891 Roots of Tompkins Financial Advisors founded 1995 Creation of Financial Services holding company - known today as Tompkins Financial Corporation 1876 Ernest Townsend, Austin Hardie Wise Insurance was founded (r
Slide 6: Our Values: Mission, Vision, Core Values
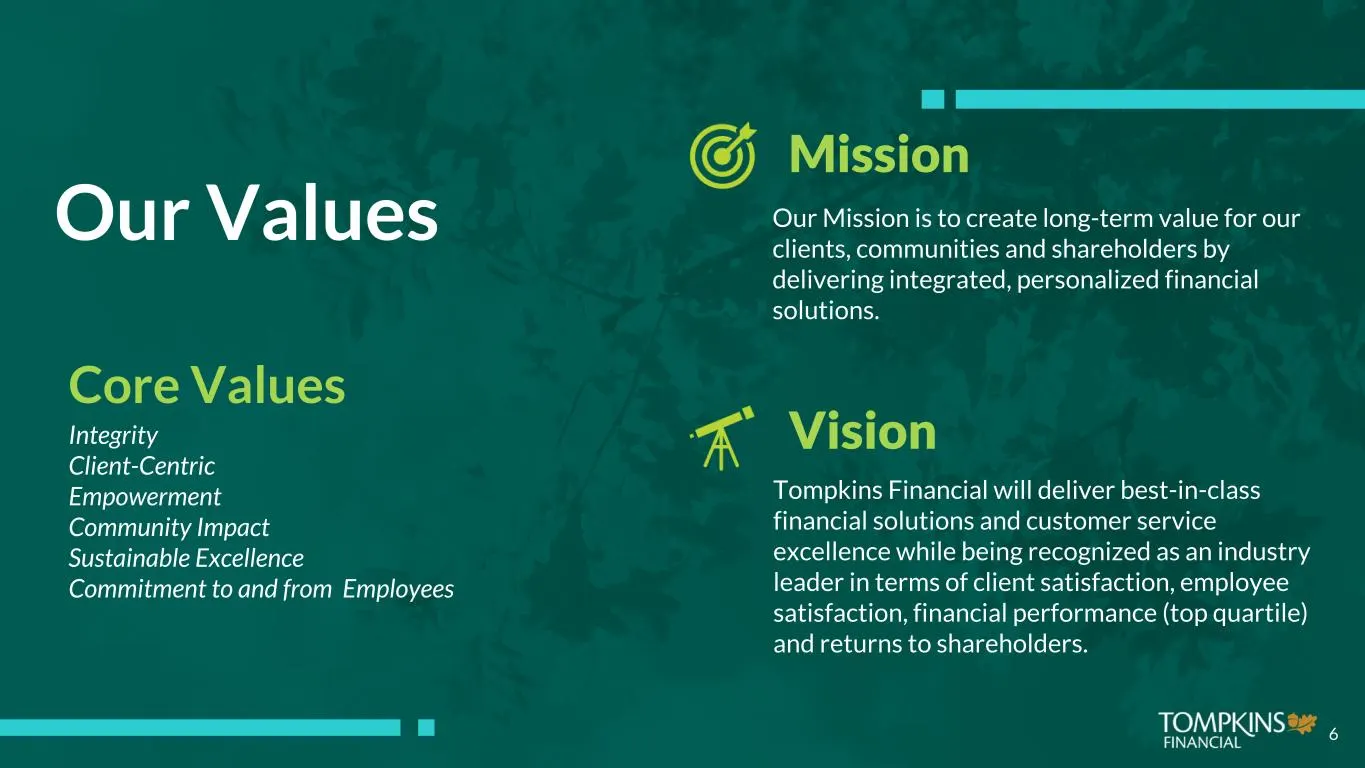
6 Our Values Mission Our Mission is to create long-term value for our clients, communities and shareholders by delivering integrated, personalized financial solutions. Vision Tompkins Financial will deliver best-in-class financial solutions and customer service excellence while being recognized as a
Slide 7: Tompkins Bank & Trust
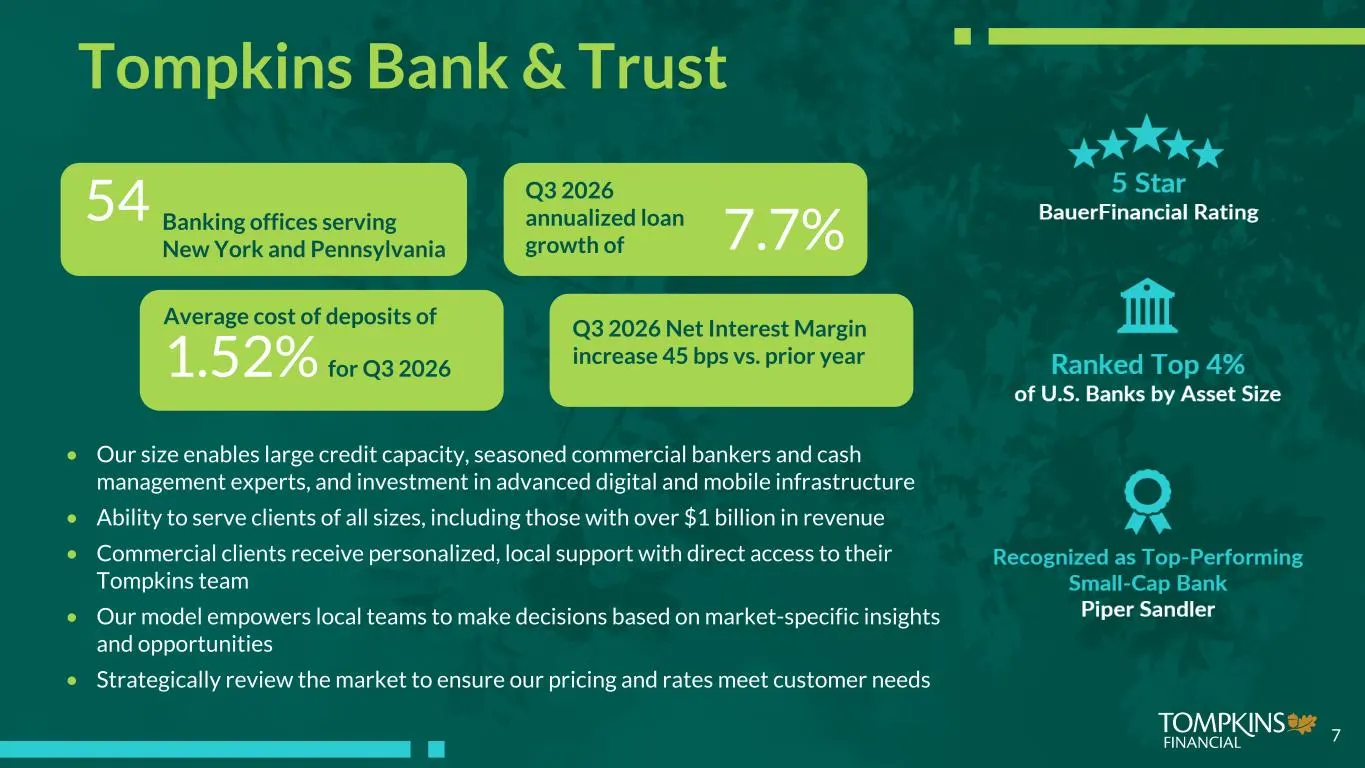
54 Banking offices serving New York and Pennsylvania • Our size enables large credit capacity, seasoned commercial bankers and cash management experts, and investment in advanced digital and mobile infrastructure • Ability to serve clients of all sizes, including those with over $1 billion in revenu
Slide 8: Tompkins Financial Advisors
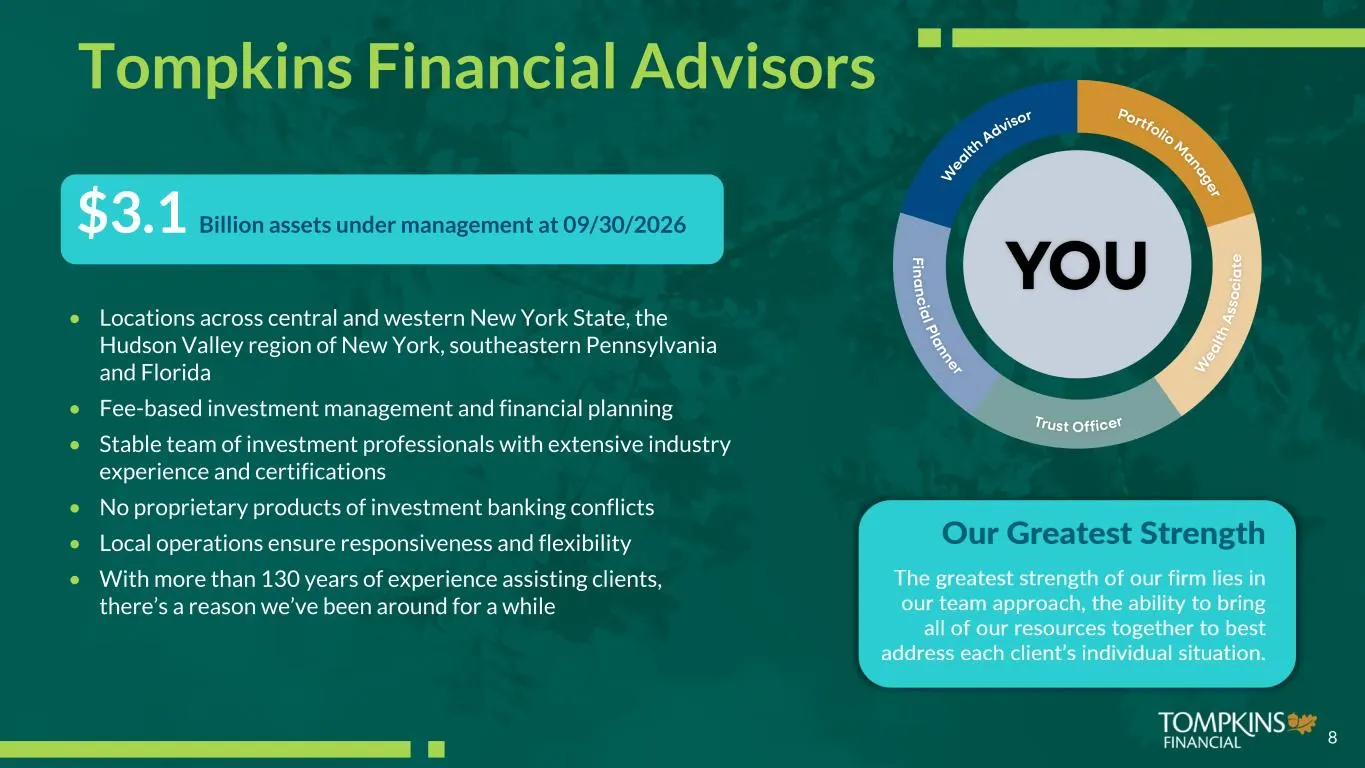
• Locations across central and western New York State, the Hudson Valley region of New York, southeastern Pennsylvania and Florida • Fee-based investment management and financial planning • Stable team of investment professionals with extensive industry experience and certifications • No proprietary
Slide 9: Culture of Sustainably Generating Top Performing Return on Equity
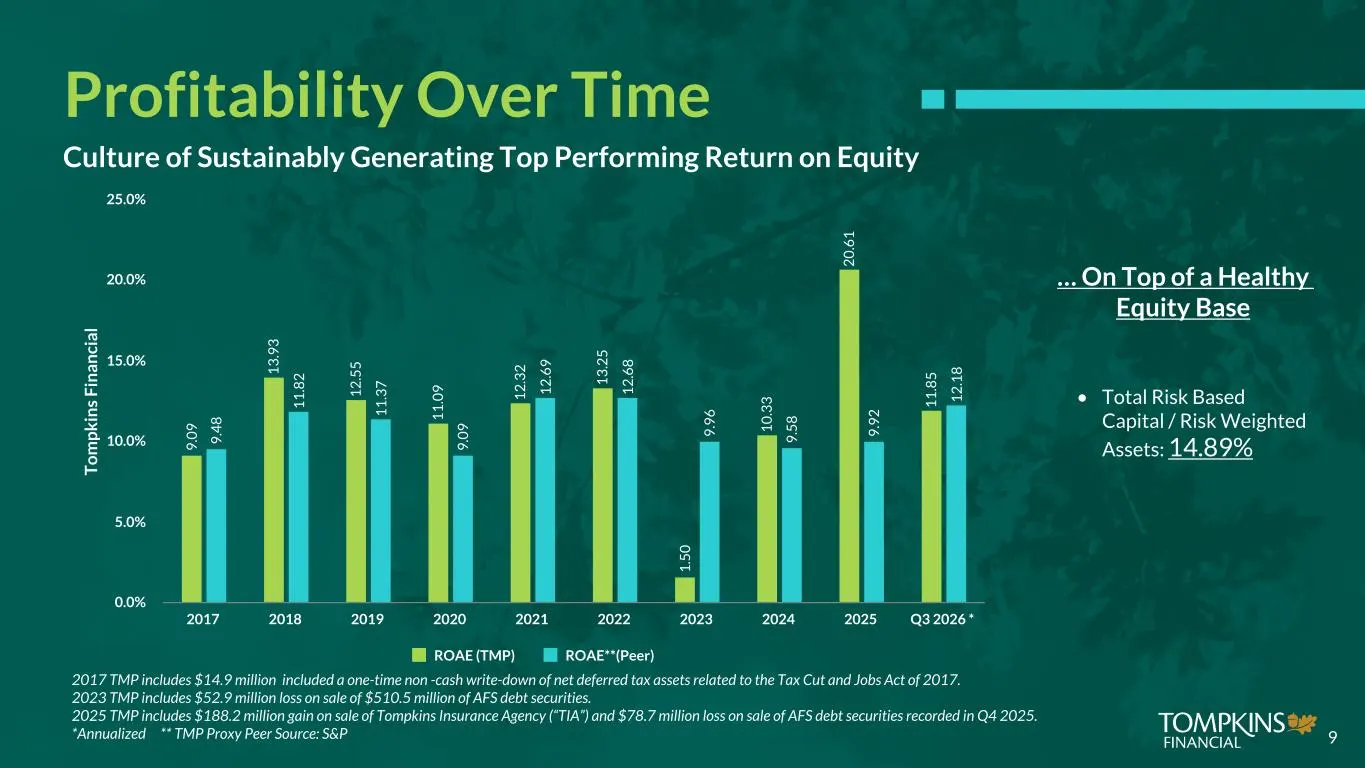
Culture of Sustainably Generating Top Performing Return on Equity 2017 TMP includes $14.9 million included a one-time non -cash write-down of net deferred tax assets related to the Tax Cut and Jobs Act of 2017. 2023 TMP includes $52.9 million loss on sale of $510.5 million of AFS debt securities. 20
Slide 10: Continued Healthy Loan Growth
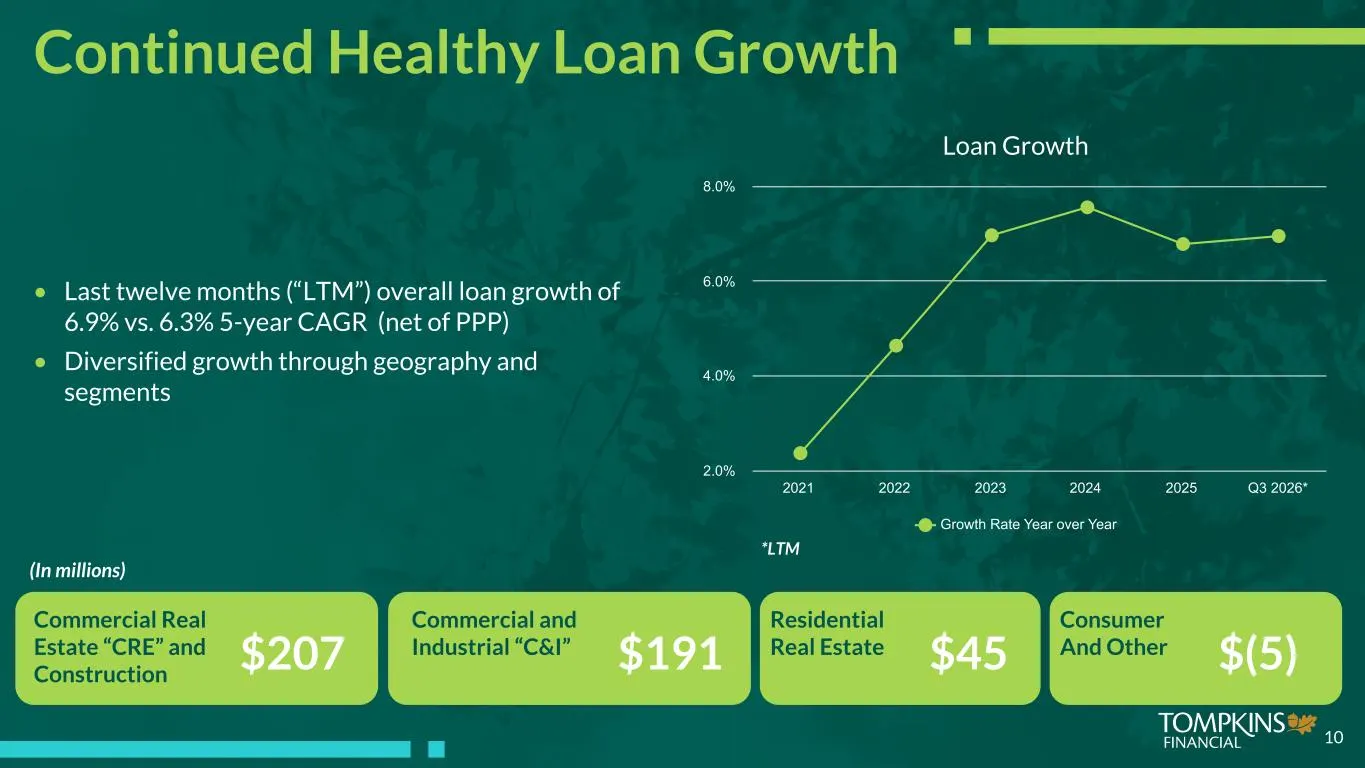
• Last twelve months (“LTM”) overall loan growth of 6.9% vs. 6.3% 5-year CAGR (net of PPP) • Diversified growth through geography and segments $207 Commercial Real Estate “CRE” and Construction $191 Commercial and Industrial “C&I” $45 Residential Real Estate $(5) Consumer And Other 10 Continued Heal
Slide 11: Diversified Loan Portfolio
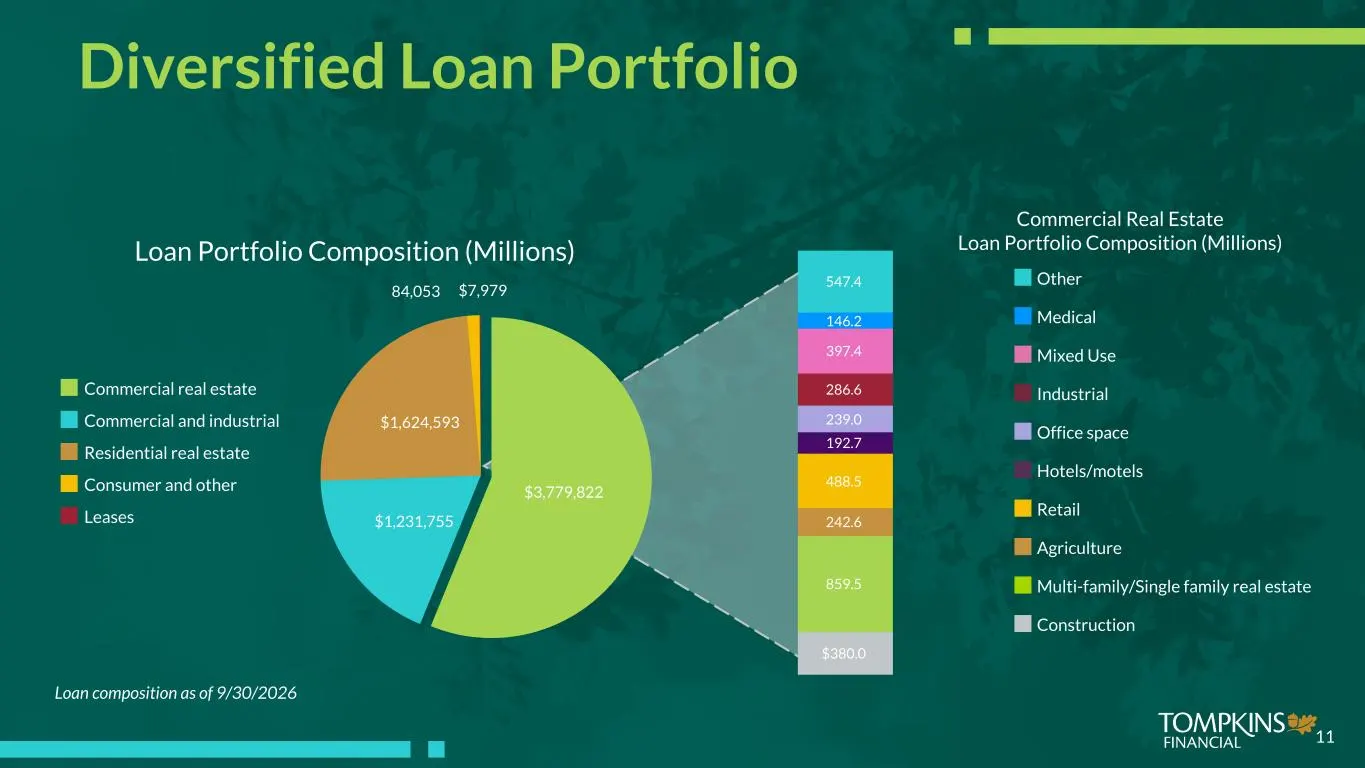
Loan composition as of 9/30/2026 11 Diversified Loan Portfolio Loan Portfolio Composition (Millions) $3,779,822 $1,231,755 $1,624,593 84,053 $7,979 Commercial real estate Commercial and industrial Residential real estate Consumer and other Leases $380.0 859.5 242.6 488.5 192.7 239.0 286.6 397.4 146.
Slide 12: Disciplined Credit Culture
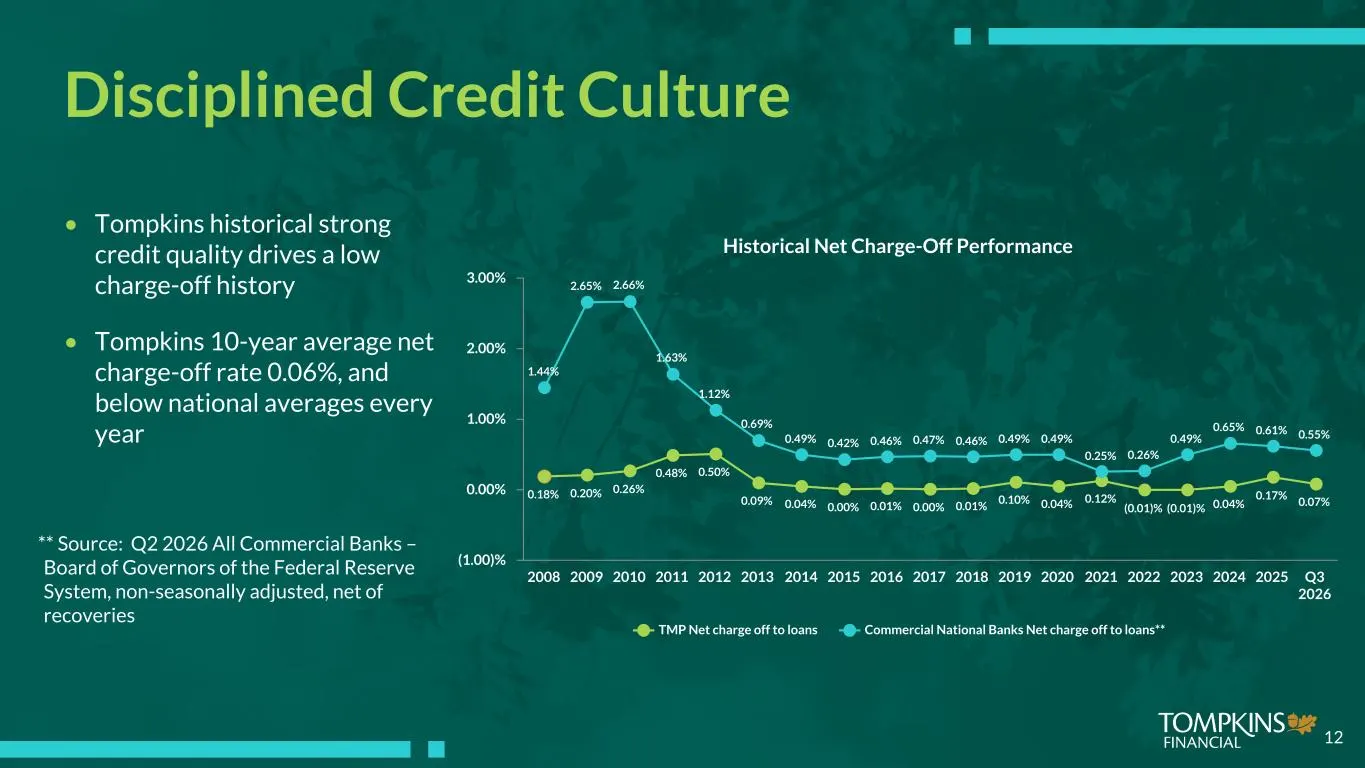
• Tompkins historical strong credit quality drives a low charge-off history • Tompkins 10-year average net charge-off rate 0.06%, and below national averages every year ** Source: Q2 2026 All Commercial Banks – Board of Governors of the Federal Reserve System, non-seasonally adjusted, net of recover
Slide 13: Current Allowance
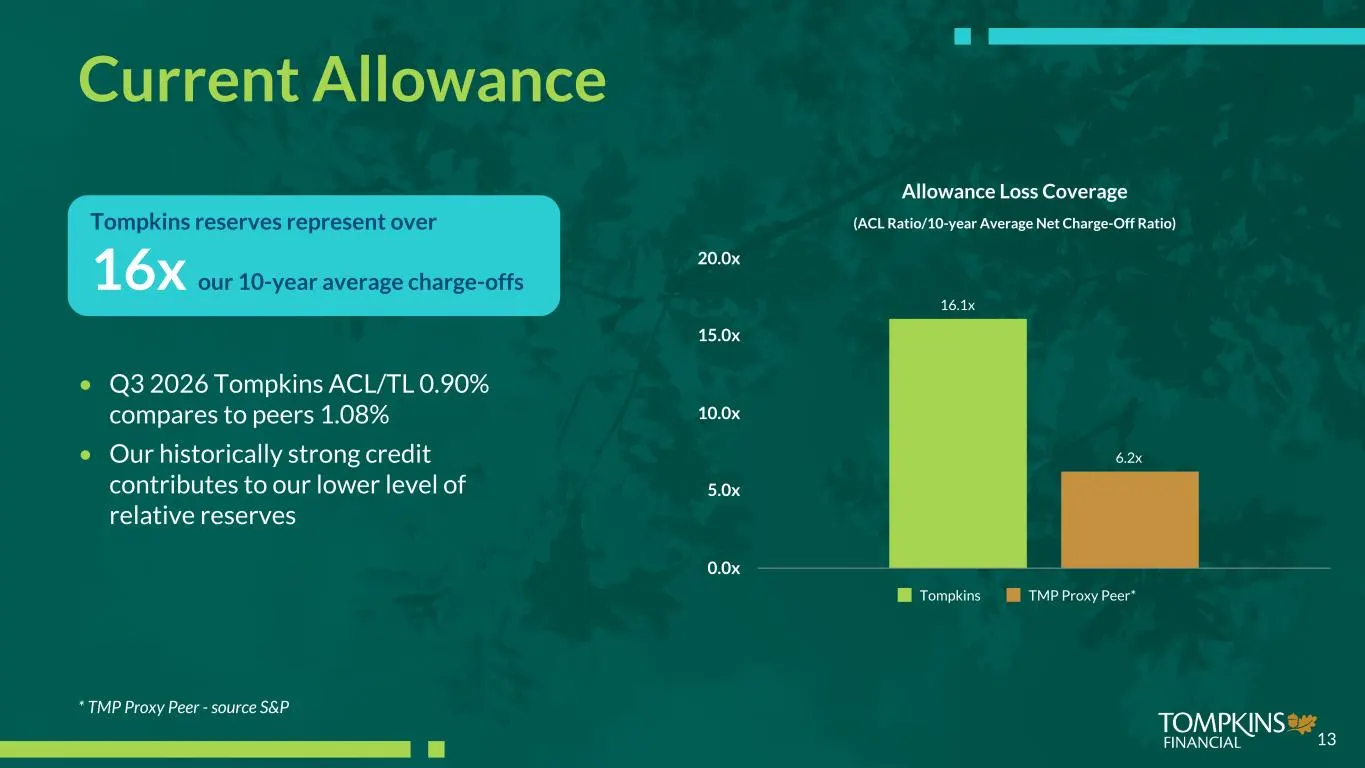
Current Allowance Allowance Loss Coverage (ACL Ratio/10-year Average Net Charge-Off Ratio) • Q3 2026 Tompkins ACL/TL 0.90% compares to peers 1.08% • Our historically strong credit contributes to our lower level of relative reserves * TMP Proxy Peer - source S&P 16x our 10-year average charge-offs To
Slide 14: Deposit Strength
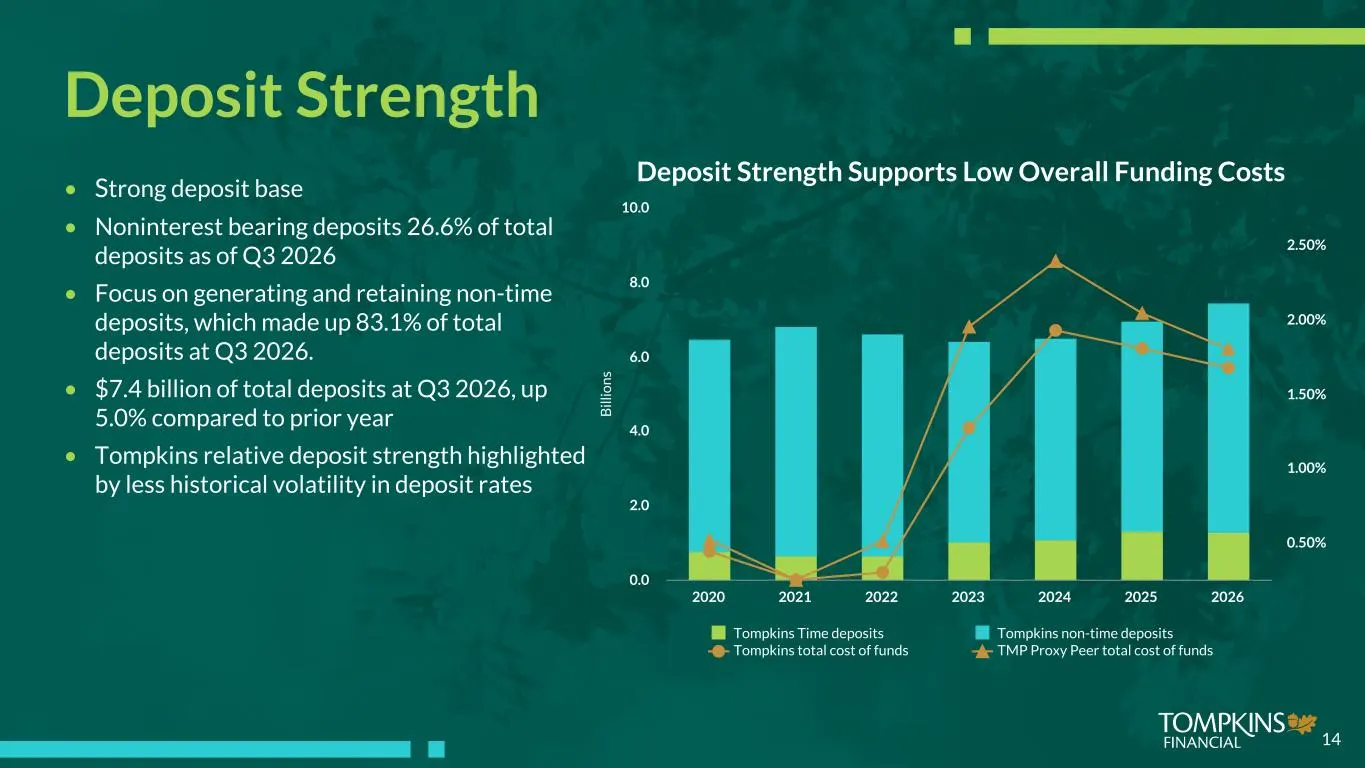
Deposit Strength • Strong deposit base • Noninterest bearing deposits 26.6% of total deposits as of Q3 2026 • Focus on generating and retaining non-time deposits, which made up 83.1% of total deposits at Q3 2026. • $7.4 billion of total deposits at Q3 2026, up 5.0% compared to prior year • Tompkins
Slide 15: Reliable Noninterest Income Sources
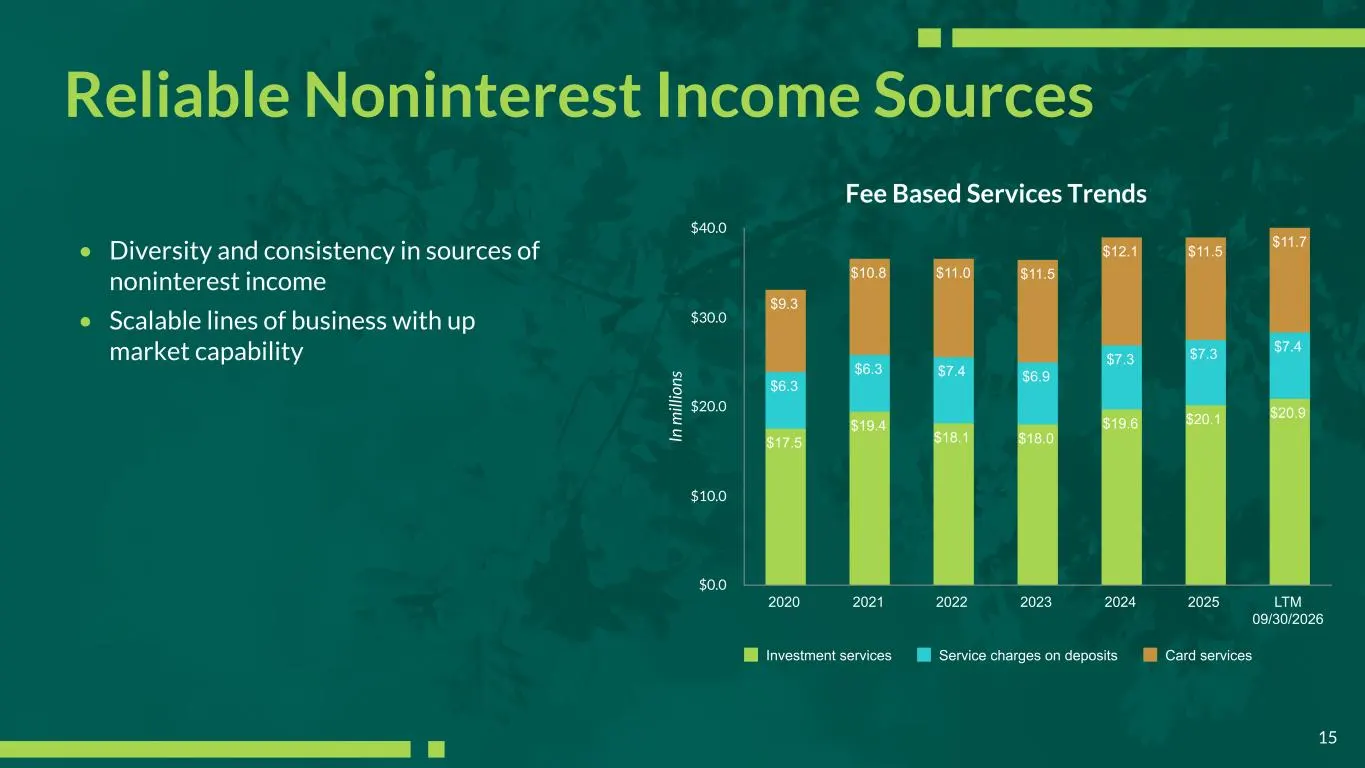
Reliable Noninterest Income Sources • Diversity and consistency in sources of noninterest income • Scalable lines of business with up market capability 15 In m ill io ns Fee Based Services Trends $17.5 $19.4 $18.1 $18.0 $19.6 $20.1 $20.9 $6.3 $6.3 $7.4 $6.9 $7.3 $7.3 $7.4 $9.3 $10.8 $11.0 $11.5 $12.
Slide 16: Disciplined Culture of Expense Management
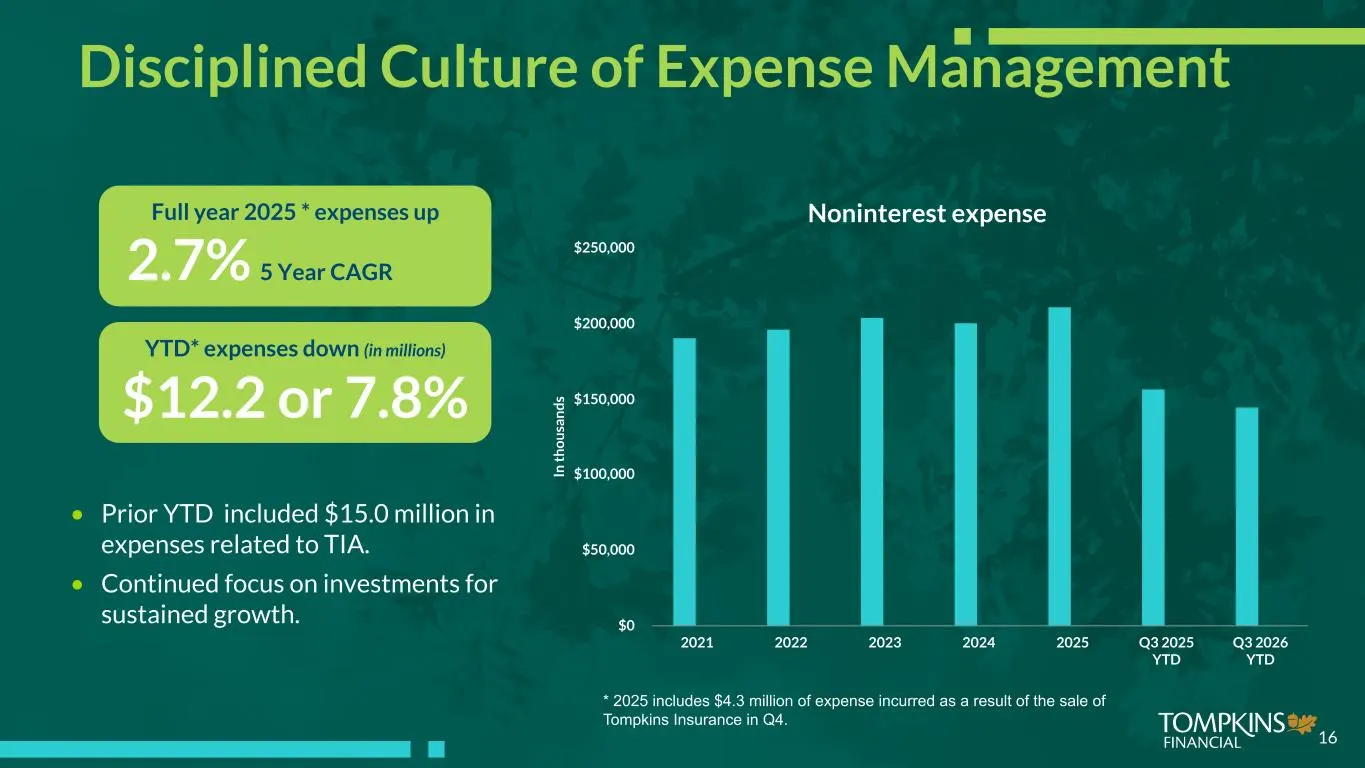
Disciplined Culture of Expense Management • Prior YTD included $15.0 million in expenses related to TIA. • Continued focus on investments for sustained growth. 2.7% 5 Year CAGR Full year 2025 * expenses up YTD* expenses down (in millions) 16 In t h o u sa n d s Noninterest expense 2021 2022 2023 202
Slide 17: Strong Liquidity Providing Relative Balance Sheet Strength
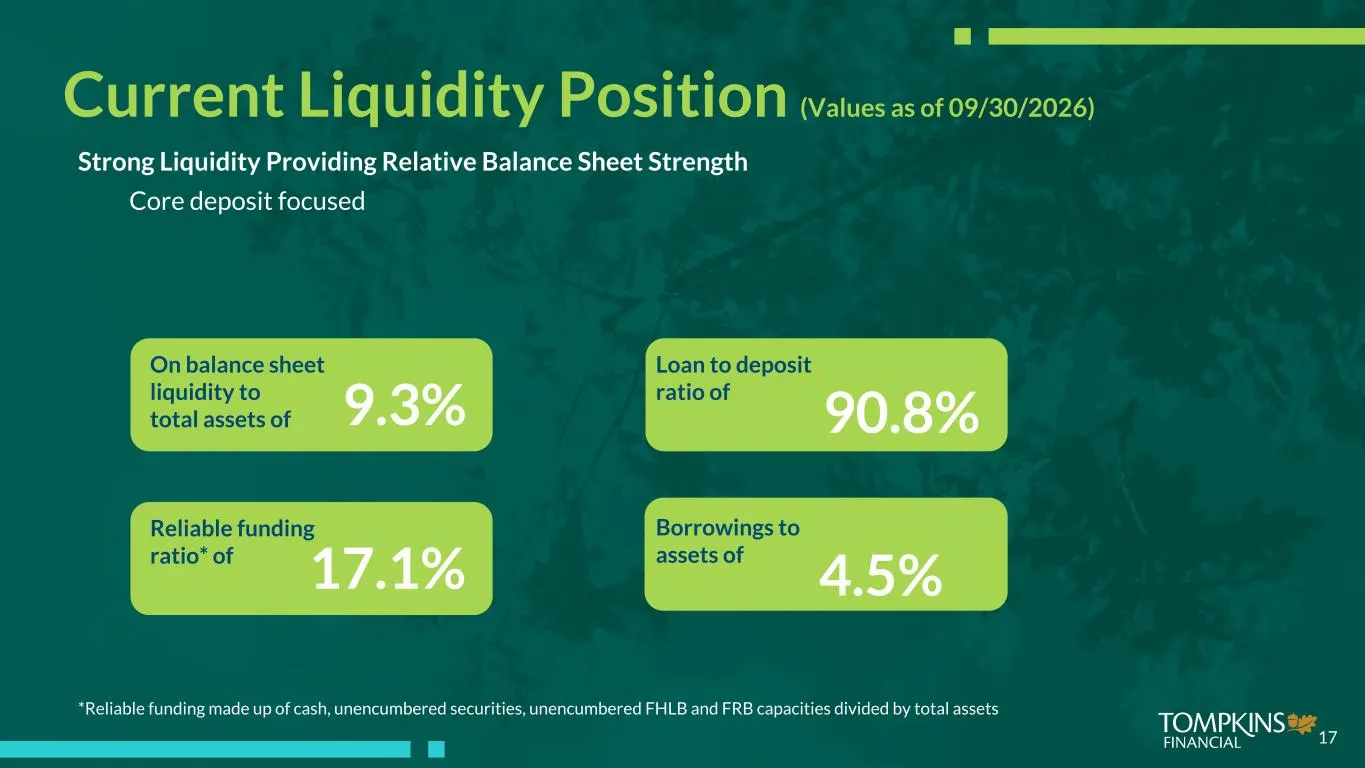
9.3% On balance sheet liquidity to total assets of 90.8% Loan to deposit ratio of 17.1% Reliable funding ratio* of Borrowings to assets of 4.5% *Reliable funding made up of cash, unencumbered securities, unencumbered FHLB and FRB capacities divided by total assets 17 Current Liquidity Position (Valu
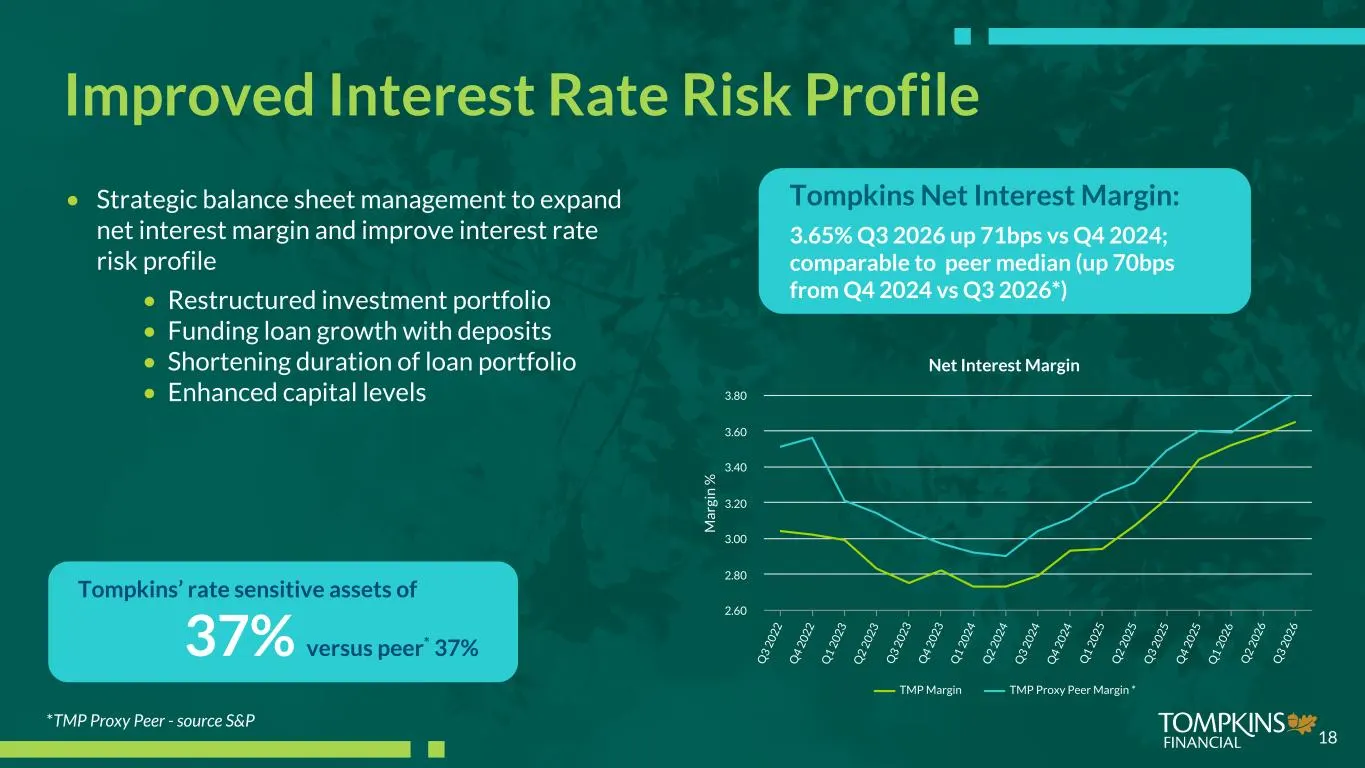
Slide 18: Net Interest Margin
18 M ar gi n % Net Interest Margin TMP Margin TMP Proxy Peer Margin * Q 3 20 22 Q 4 20 22 Q 1 20 23 Q 2 20 23 Q 3 20 23 Q 4 20 23 Q 1 20 24 Q 2 20 24 Q 3 20 24 Q 4 20 24 Q 1 20 25 Q 2 20 25 Q 3 20 25 Q 4 20 25 Q 1 20 26 Q 2 20 26 Q 3 20 26 2.60 2.80 3.00 3.20 3.40 3.60 3.80 *TMP Proxy Peer - source
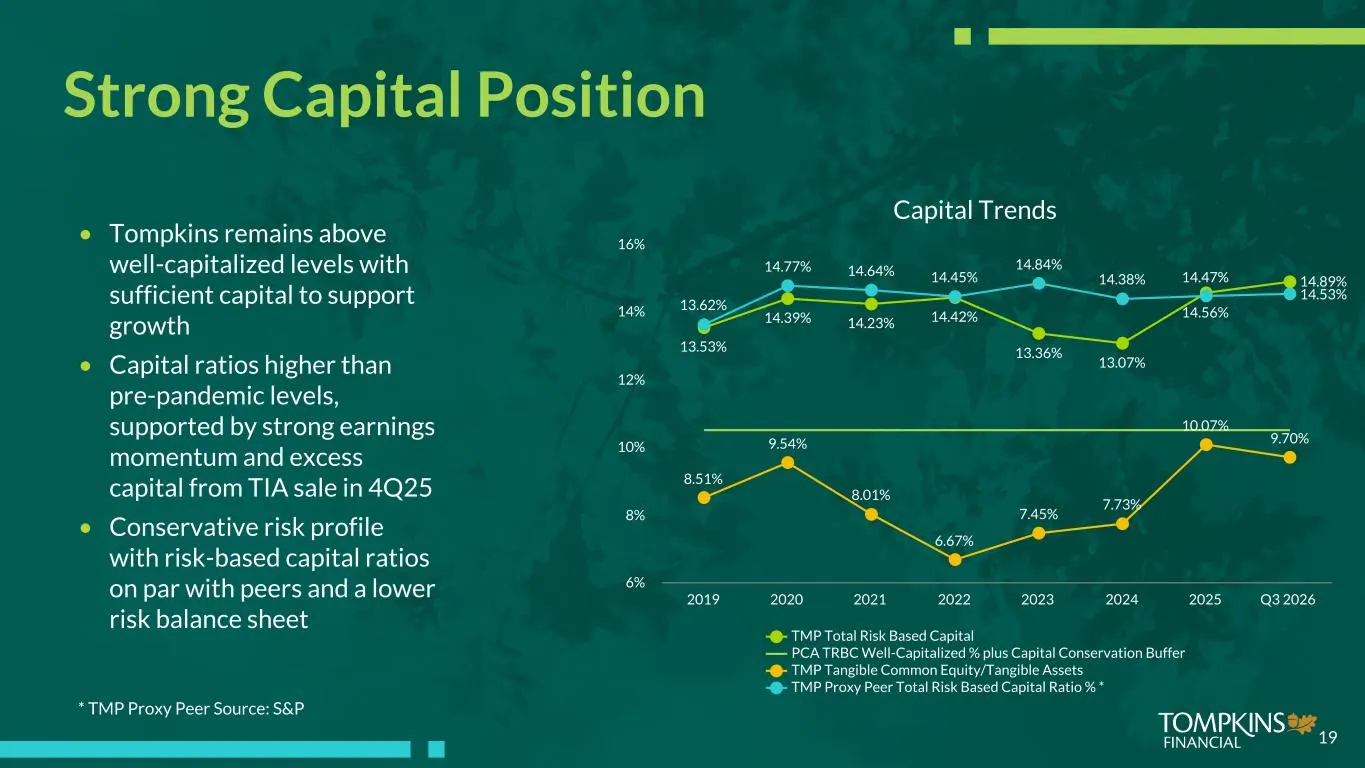
Slide 19: Strong Capital Position
* TMP Proxy Peer Source: S&P 19 Capital Trends 13.53% 14.39% 14.23% 14.42% 13.36% 13.07% 14.56% 14.89% 8.51% 9.54% 8.01% 6.67% 7.45% 7.73% 10.07% 9.70% 13.62% 14.77% 14.64% 14.45% 14.84% 14.38% 14.47% 14.53% TMP Total Risk Based Capital PCA TRBC Well-Capitalized % plus Capital Conservation Buffer TM
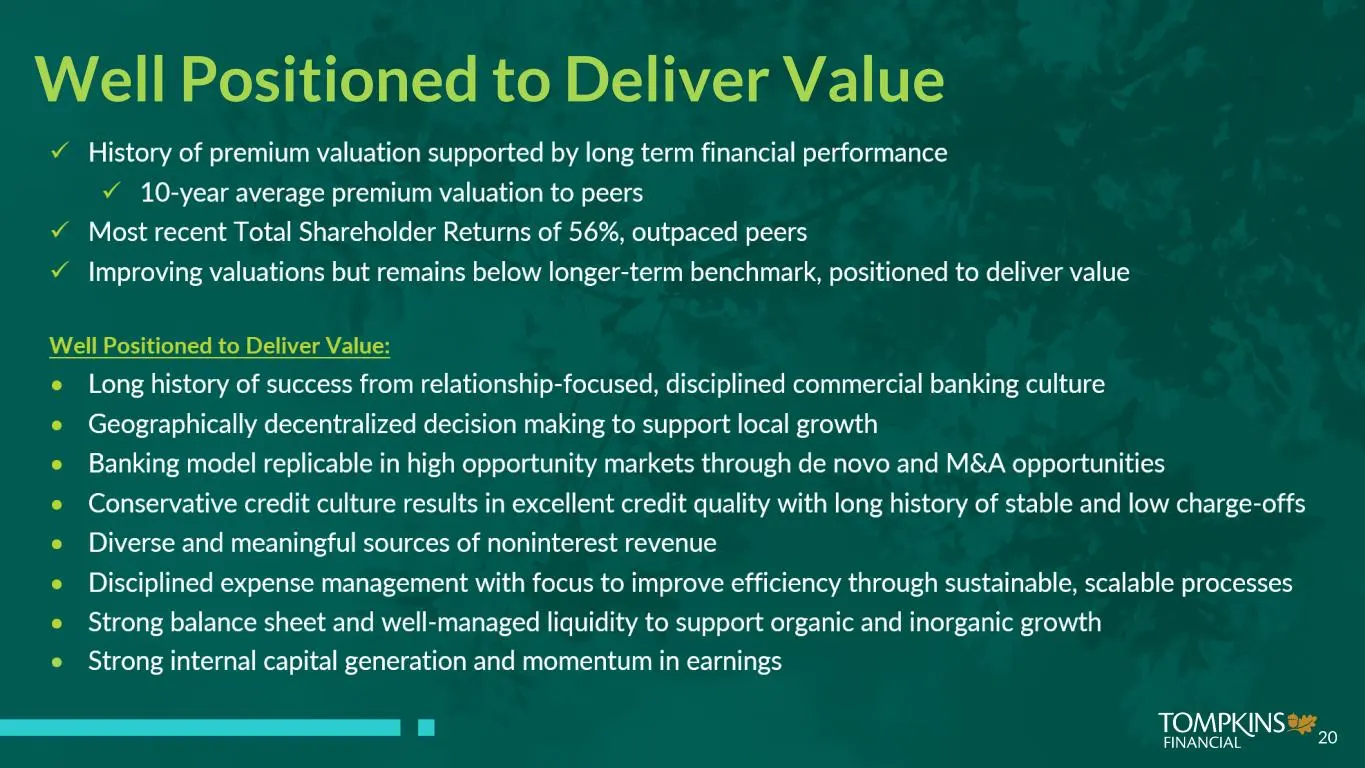
Slide 20: Well Positioned to Deliver Value
20 Well Positioned to Deliver Value
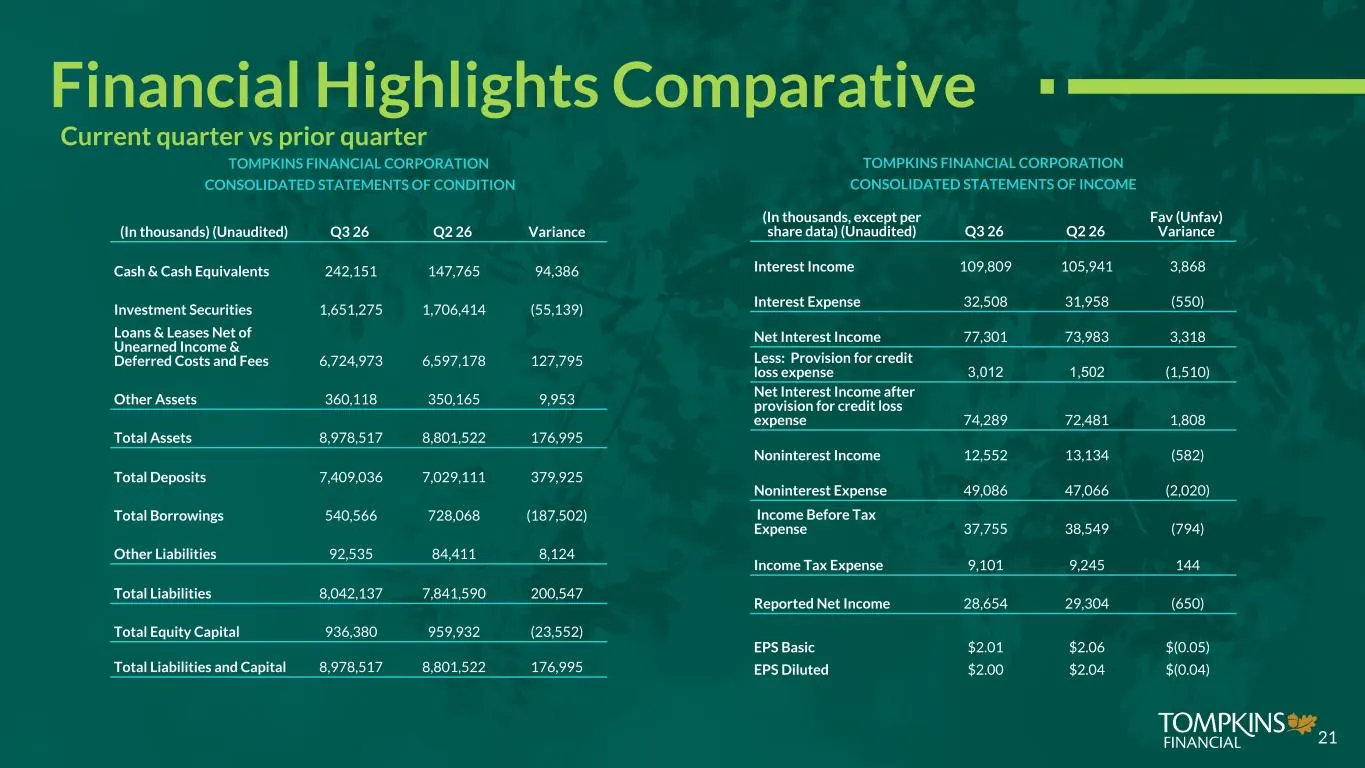
Slide 21: Consolidated Statements of Condition and Income, Q3 26 vs Q2 26
TOMPKINS FINANCIAL CORPORATION CONSOLIDATED STATEMENTS OF CONDITION (In thousands) (Unaudited) Q3 26 Q2 26 Variance Cash & Cash Equivalents 242,151 147,765 94,386 Investment Securities 1,651,275 1,706,414 (55,139) Loans & Leases Net of Unearned Income & Deferred Costs and Fees 6,724,973 6,597,178 12
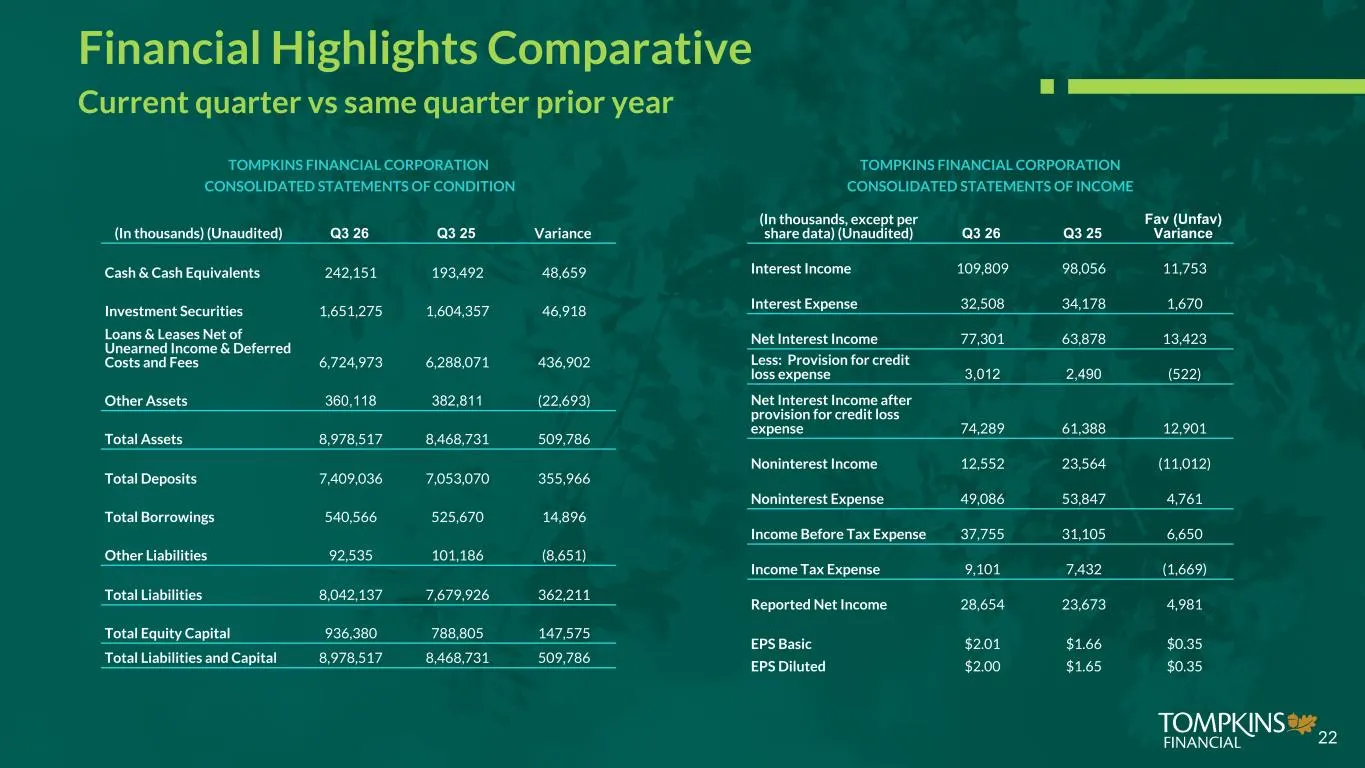
Slide 22: Financial Highlights Comparative, Q3 26 vs Q3 25
Financial Highlights Comparative Current quarter vs same quarter prior year TOMPKINS FINANCIAL CORPORATION CONSOLIDATED STATEMENTS OF CONDITION (In thousands) (Unaudited) Q3 26 Q3 25 Variance Cash & Cash Equivalents 242,151 193,492 48,659 Investment Securities 1,651,275 1,604,357 46,918 Loans & Leas
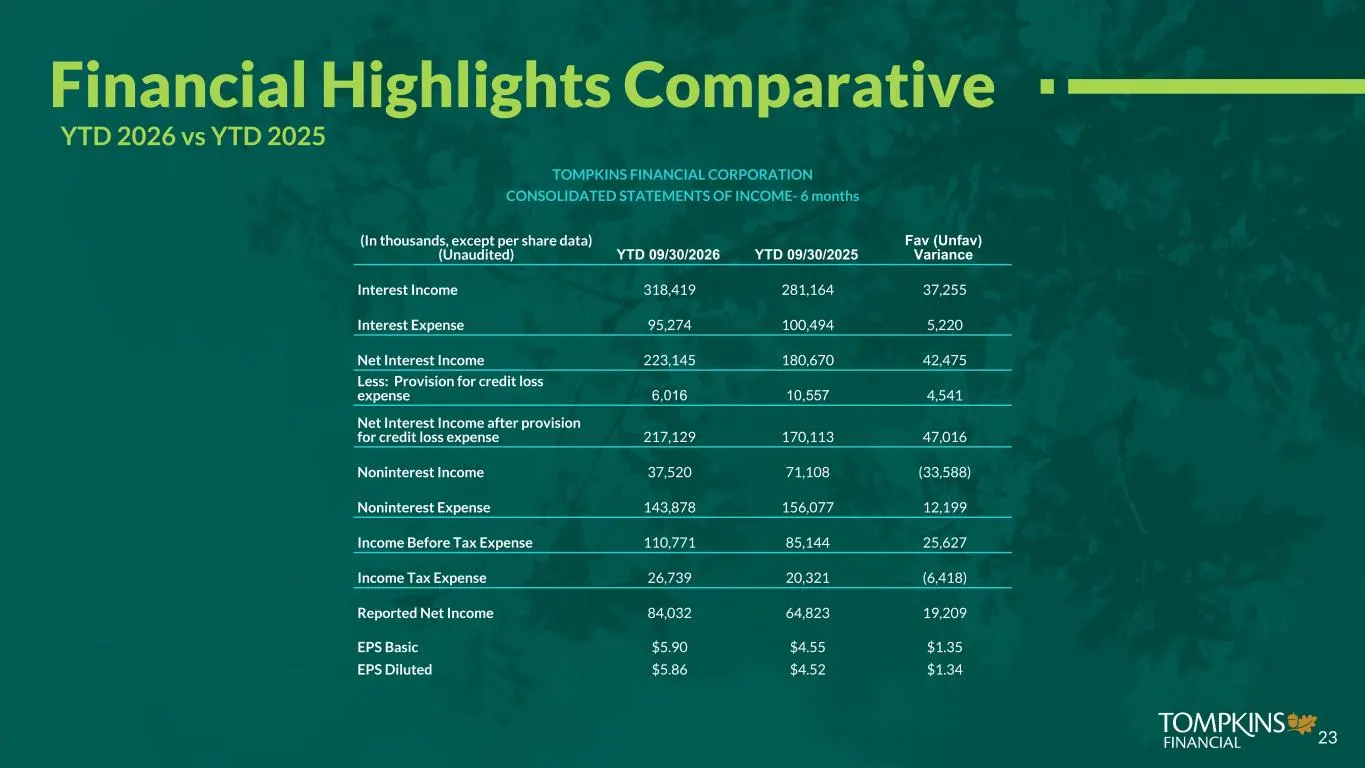
Slide 23: Consolidated Statements of Income, YTD 2026 vs YTD 2025
TOMPKINS FINANCIAL CORPORATION CONSOLIDATED STATEMENTS OF INCOME- 6 months (In thousands, except per share data) (Unaudited) YTD 09/30/2026 YTD 09/30/2025 Fav (Unfav) Variance Interest Income 318,419 281,164 37,255 Interest Expense 95,274 100,494 5,220 Net Interest Income 223,145 180,670 42,475 Less
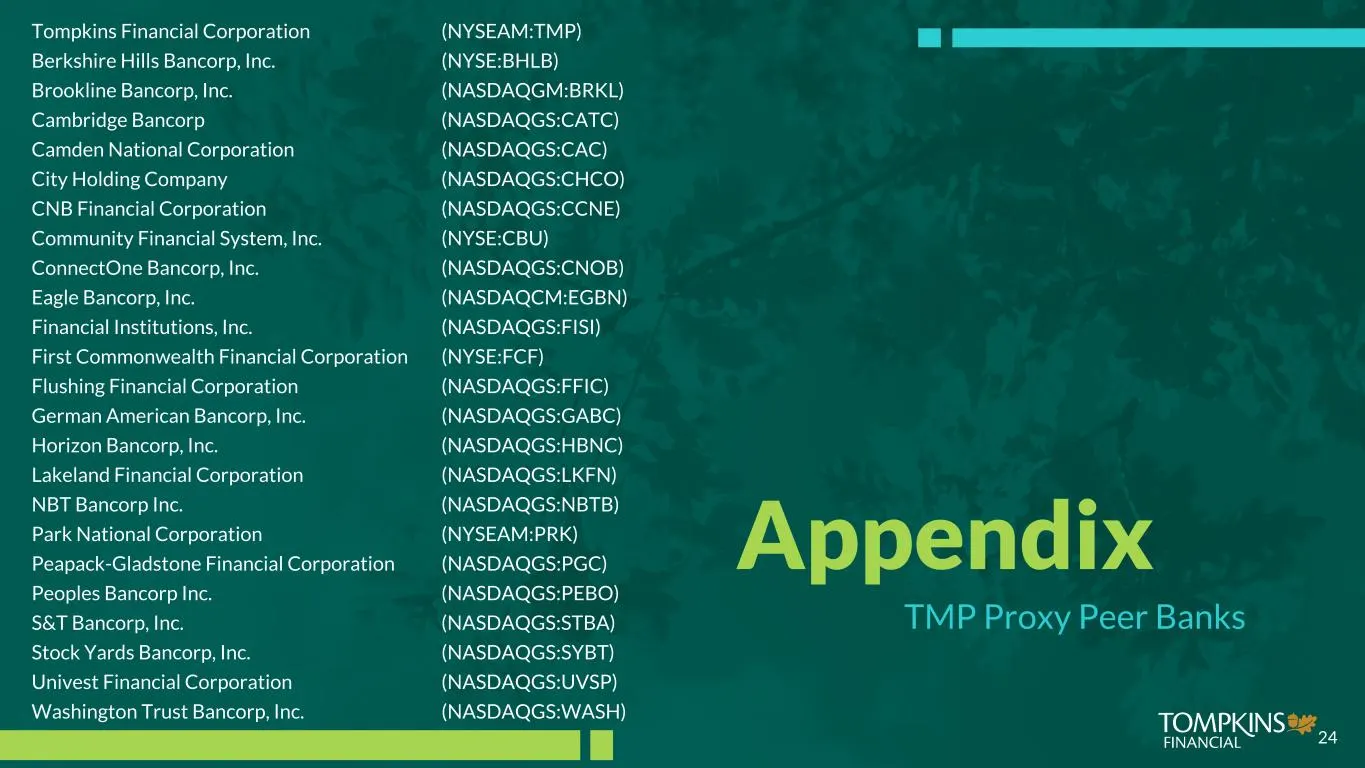
Slide 24: Appendix: TMP Proxy Peer Banks
Appendix TMP Proxy Peer Banks 24 Tompkins Financial Corporation (NYSEAM:TMP) Berkshire Hills Bancorp, Inc. (NYSE:BHLB) Brookline Bancorp, Inc. (NASDAQGM:BRKL) Cambridge Bancorp (NASDAQGS:CATC) Camden National Corporation (NASDAQGS:CAC) City Holding Company (NASDAQGS:CHCO) CNB Financial Corporation (
Source: SEC EDGAR · 8-K filed Nov 16, 2026
More decks from Tompkins Financial Corporation
 KBW Summer Bank Conference 202624 slides · Jul 28, 2026
 Shareholder Meeting (May 2026)14 slides · May 19, 2026
 Shareholder Meeting (May 2025)13 slides · May 13, 2025
 Shareholder Meeting (May 2024)13 slides · May 14, 2024
 Shareholder Meeting (May 2023)37 slides · May 9, 2023
 2014 KBW Community Bank Investor Conference21 slides · Jul 29, 2014