Tompkins Financial Corporation · AMEX:TMP
Tompkins Financial — 2014 KBW Community Bank Investor Conference
21 slides from Tompkins Financial's conference presentation, Jul 29, 2014
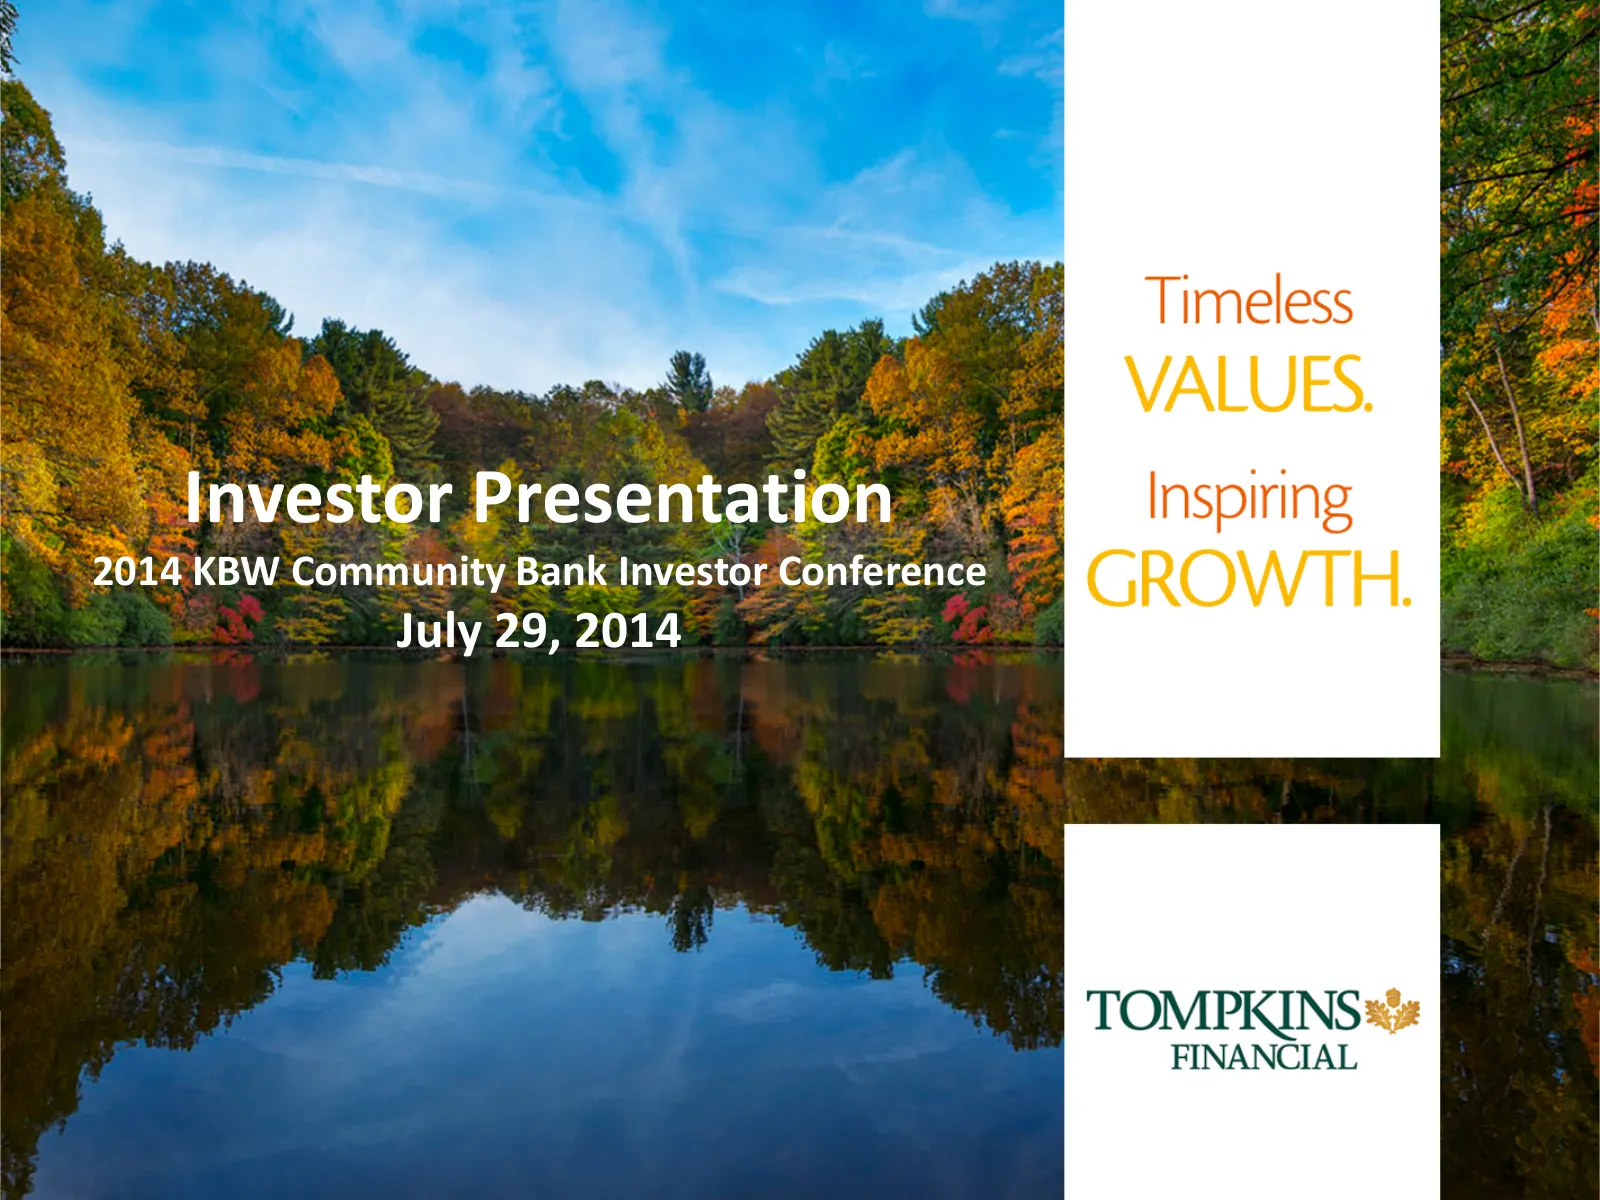
Slide 1: Investor Presentation – 2014 KBW Community Bank Investor Conference
Investor Presentation 2014 KBW Community Bank Investor Conference July 29, 2014
Slide 2: Frank Fetsko, EVP, Chief Financial & Operating Officer
Frank Fetsko, EVP Chief Financial & Operating Officer Tompkins Financial Corporation
Slide 3: Forward Looking Information – Safe Harbor
Forward Looking Information – Safe Harbor Today’s presentation and discussion, including related questions and answers, may contain estimates of future results, plans or events for Tompkins Financial Corporation. These estimates constitute forward-looking statements as defined by the Private Securit
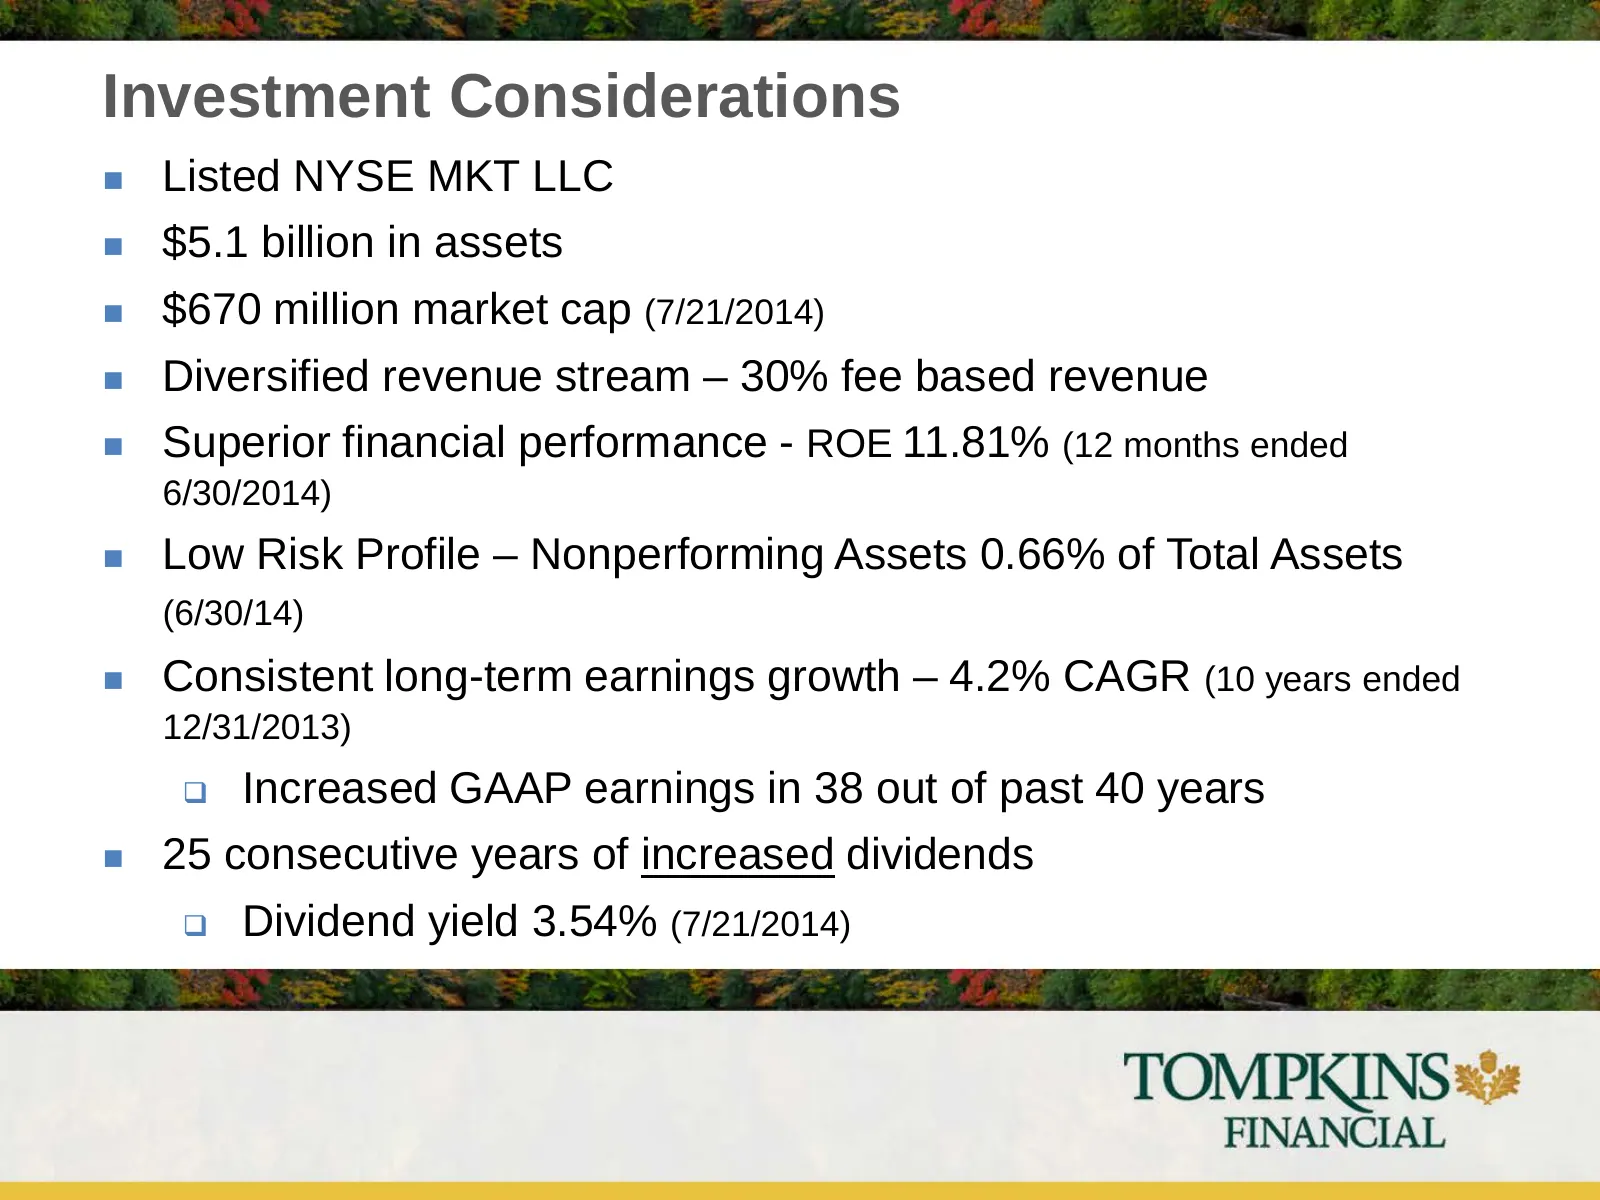
Slide 4: Investment Considerations
Investment Considerations Listed NYSE MKT LLC $5.1 billion in assets $670 million market cap (7/21/2014) Diversified revenue stream – 30% fee based revenue Superior financial performance - ROE 11.81% (12 months ended 6/30/2014) Low Risk Profile – Nonperforming Assets 0.66% of Total Asset
Slide 5: Markets
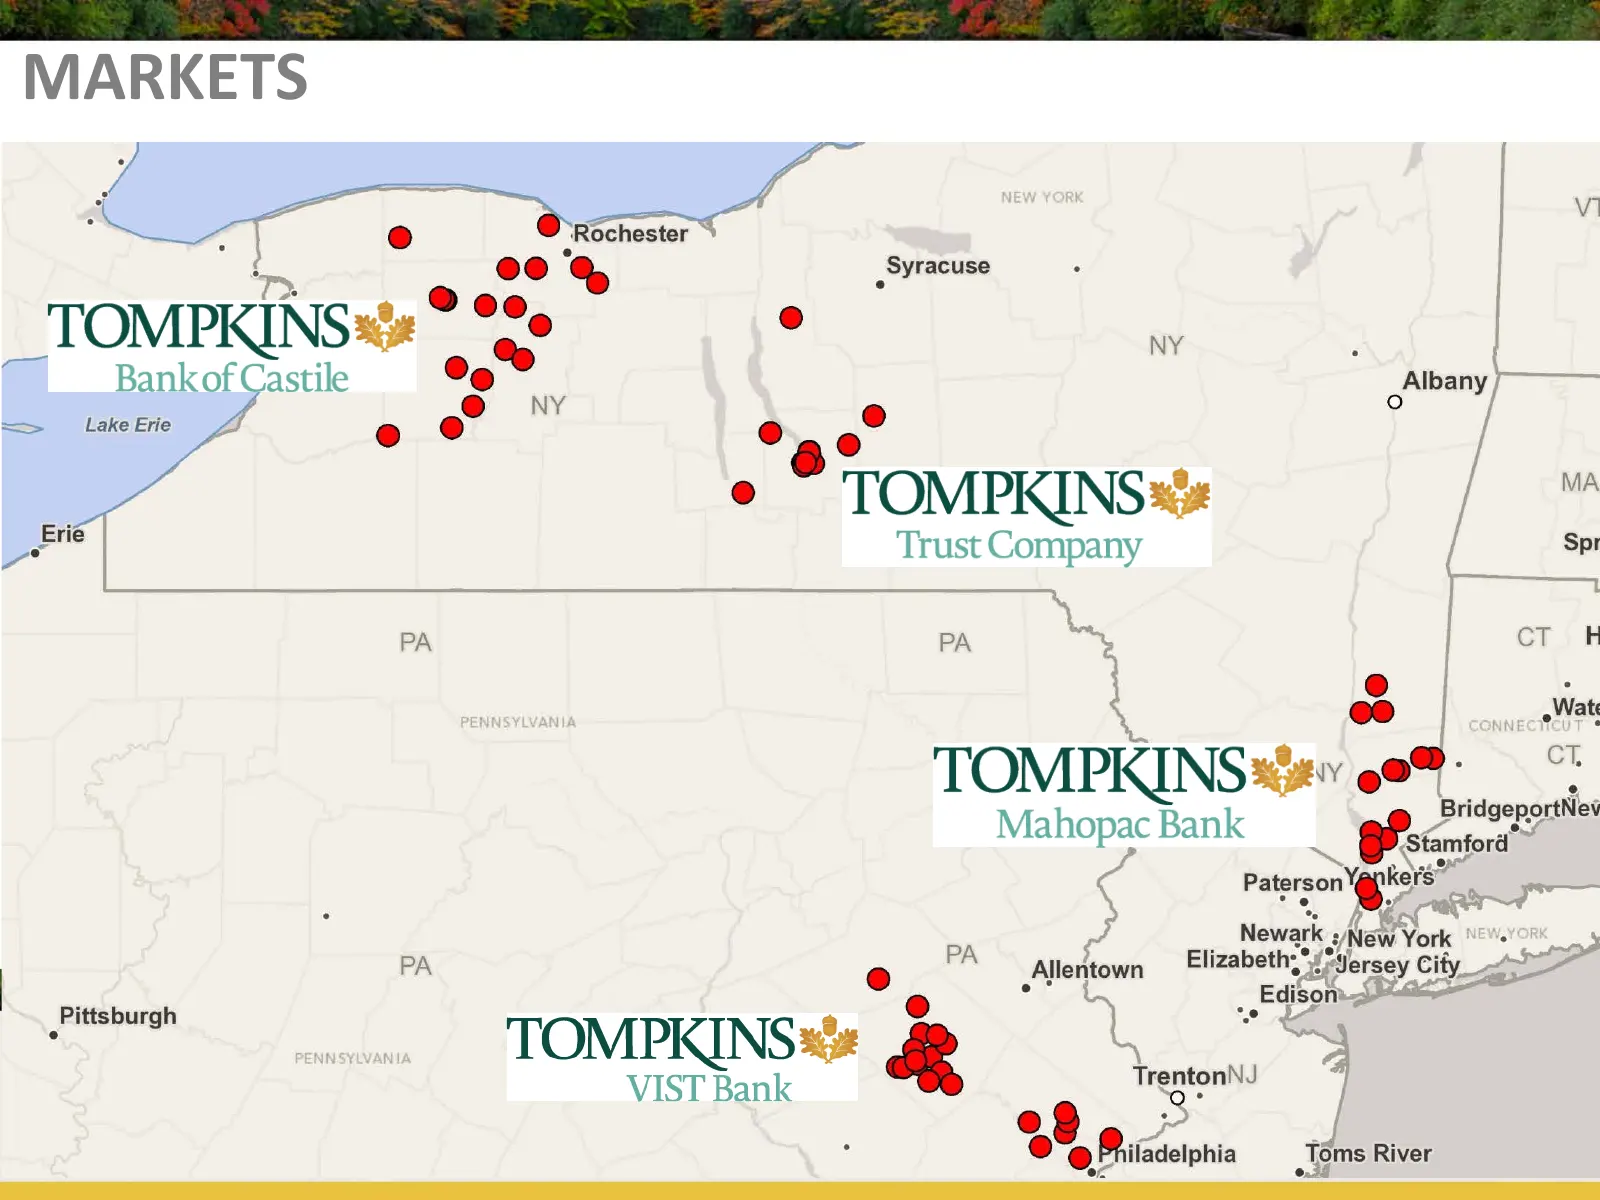
GPSS A Ss a a lal a a i le i MARKETS ( aa yy vi : a . ee ® Syracuse _TOMPKINS%# ° °8e ° a Bank of Castile ee” ‘ fibany <> Lake Erie @ e) NY O° 8 a’ / TOMPKINS = j <M Erie T Ss ye rust Company [ pt i PA “~ crs k io Wate TOMPRINS =’ oo , ridgeportNev Mahopac Bank Centar Patpraon ag aa PA r Newark 3/Ne
Slide 6: Tompkins Financial brands
TOMPKINS FINANCIAL TOMPKINS TOMPKINS» Trust Company VIST Bank TOMPKINS 8 TOMPKINS sé Bank of Castile Insurance TOMPKINS TOMPKINS#3# Mahopac Bank Financial Advisors TOMPKINS» FINANCIAL
Slide 7: Mission Statement
MISSION STATEMENT Our Mission is to create long term value for our clients, communities and shareholders by delivering integrated, personalized financial solutions.
Slide 8: Focused Growth
Focused Growth Grow our current businesses Deliver full capabilities of Tompkins Financial to our clients Remain open to acquisition opportunities
Slide 9: Grow our Current Banking Businesses
Grow our Current Banking Businesses Expansion within our footprint Increased lending capabilities Accelerate progress in Pennsylvania
Slide 10: Mature Fee Based Businesses
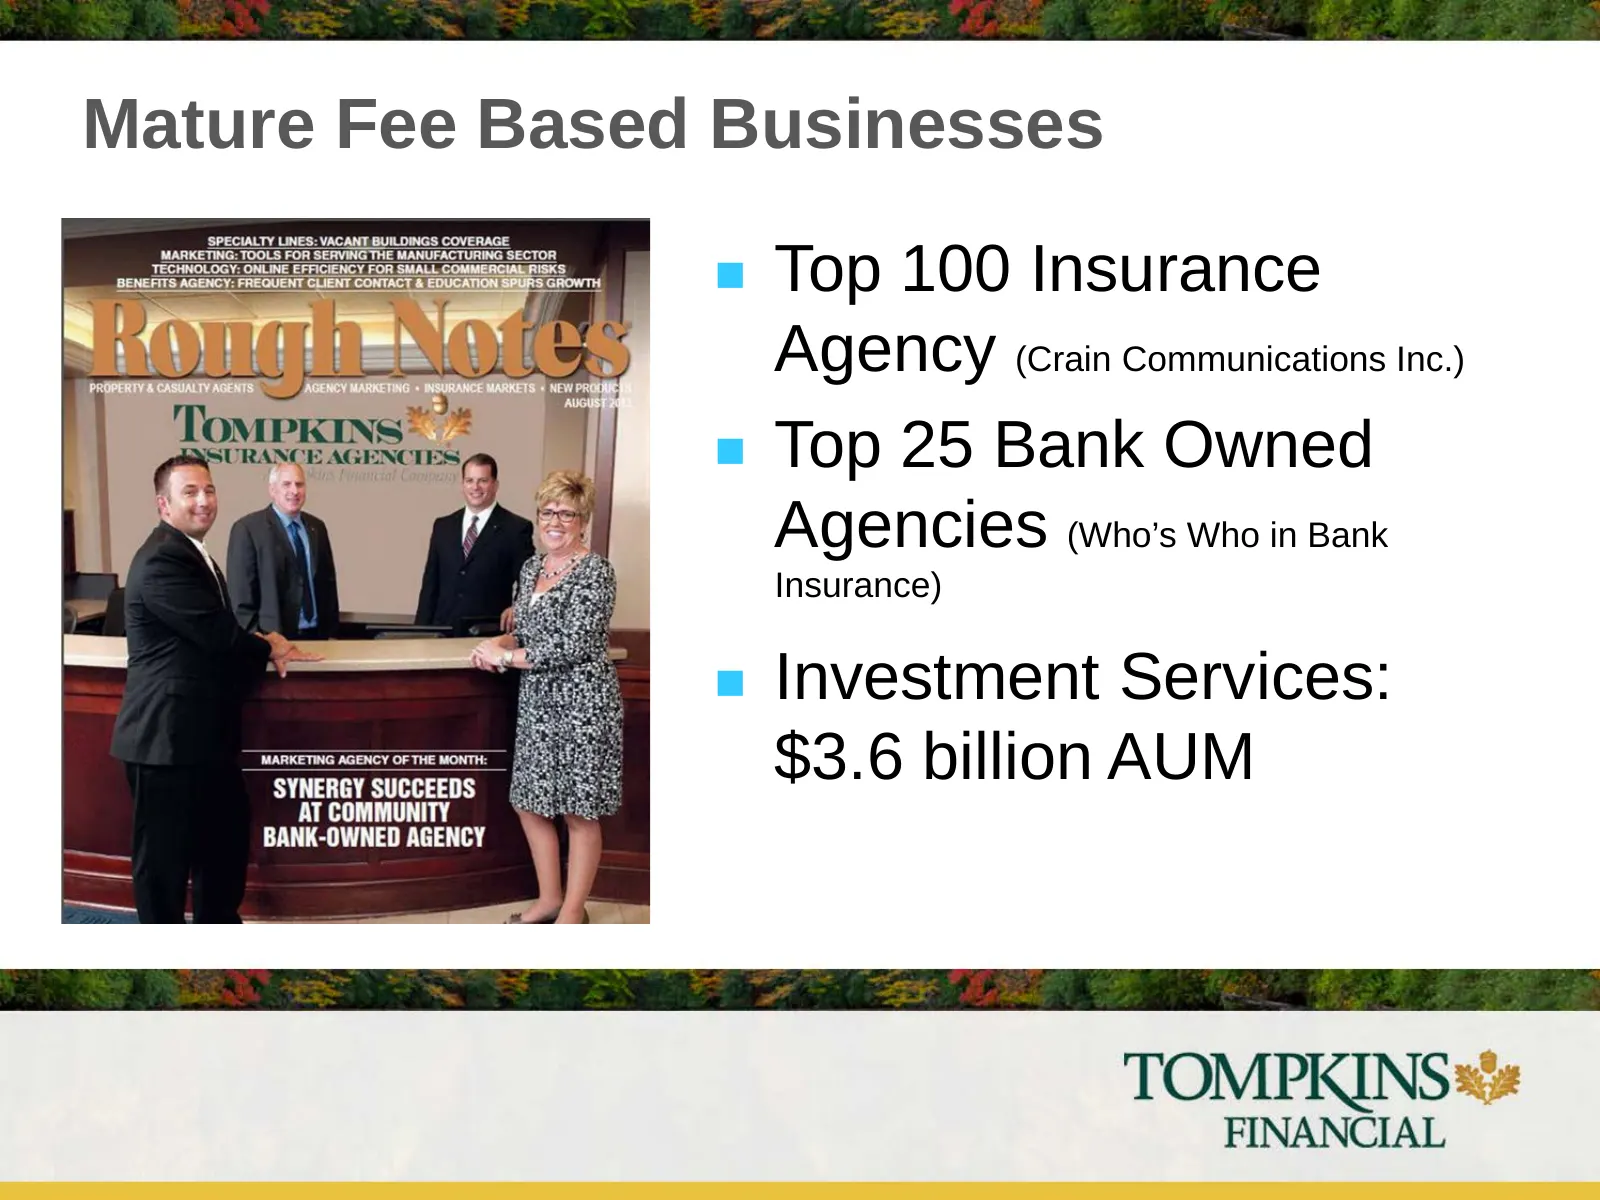
Mature Fee Based Businesses Top 100 Insurance Agency (Crain Communications Inc.) Top 25 Bank Owned Agencies (Who’s Who in Bank Insurance) Investment Services: $3.6 billion AUM
Slide 11: Remain Open to Acquisition Opportunities
Remain Open to Acquisition Opportunities Focus on Long-term Sustainable Growth Contiguous Geographies Compatible Cultures
Slide 12: Earnings Trends: Tompkins Financial
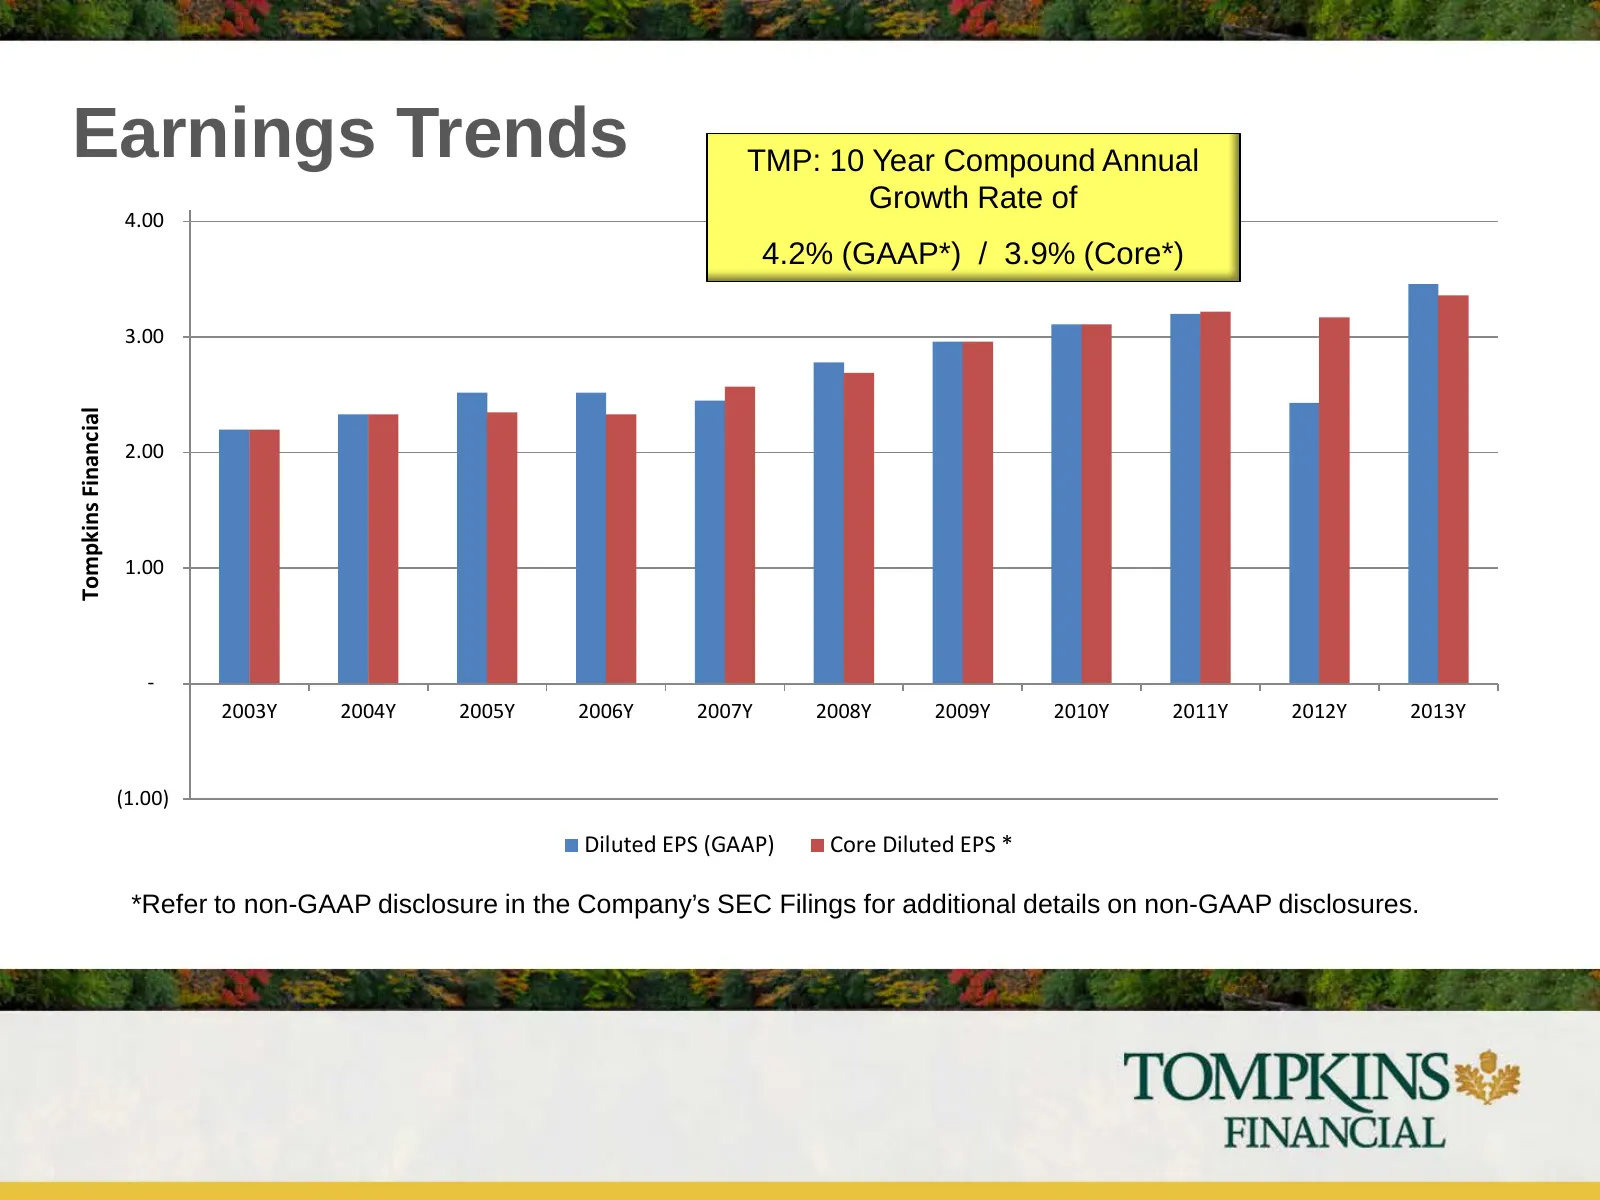
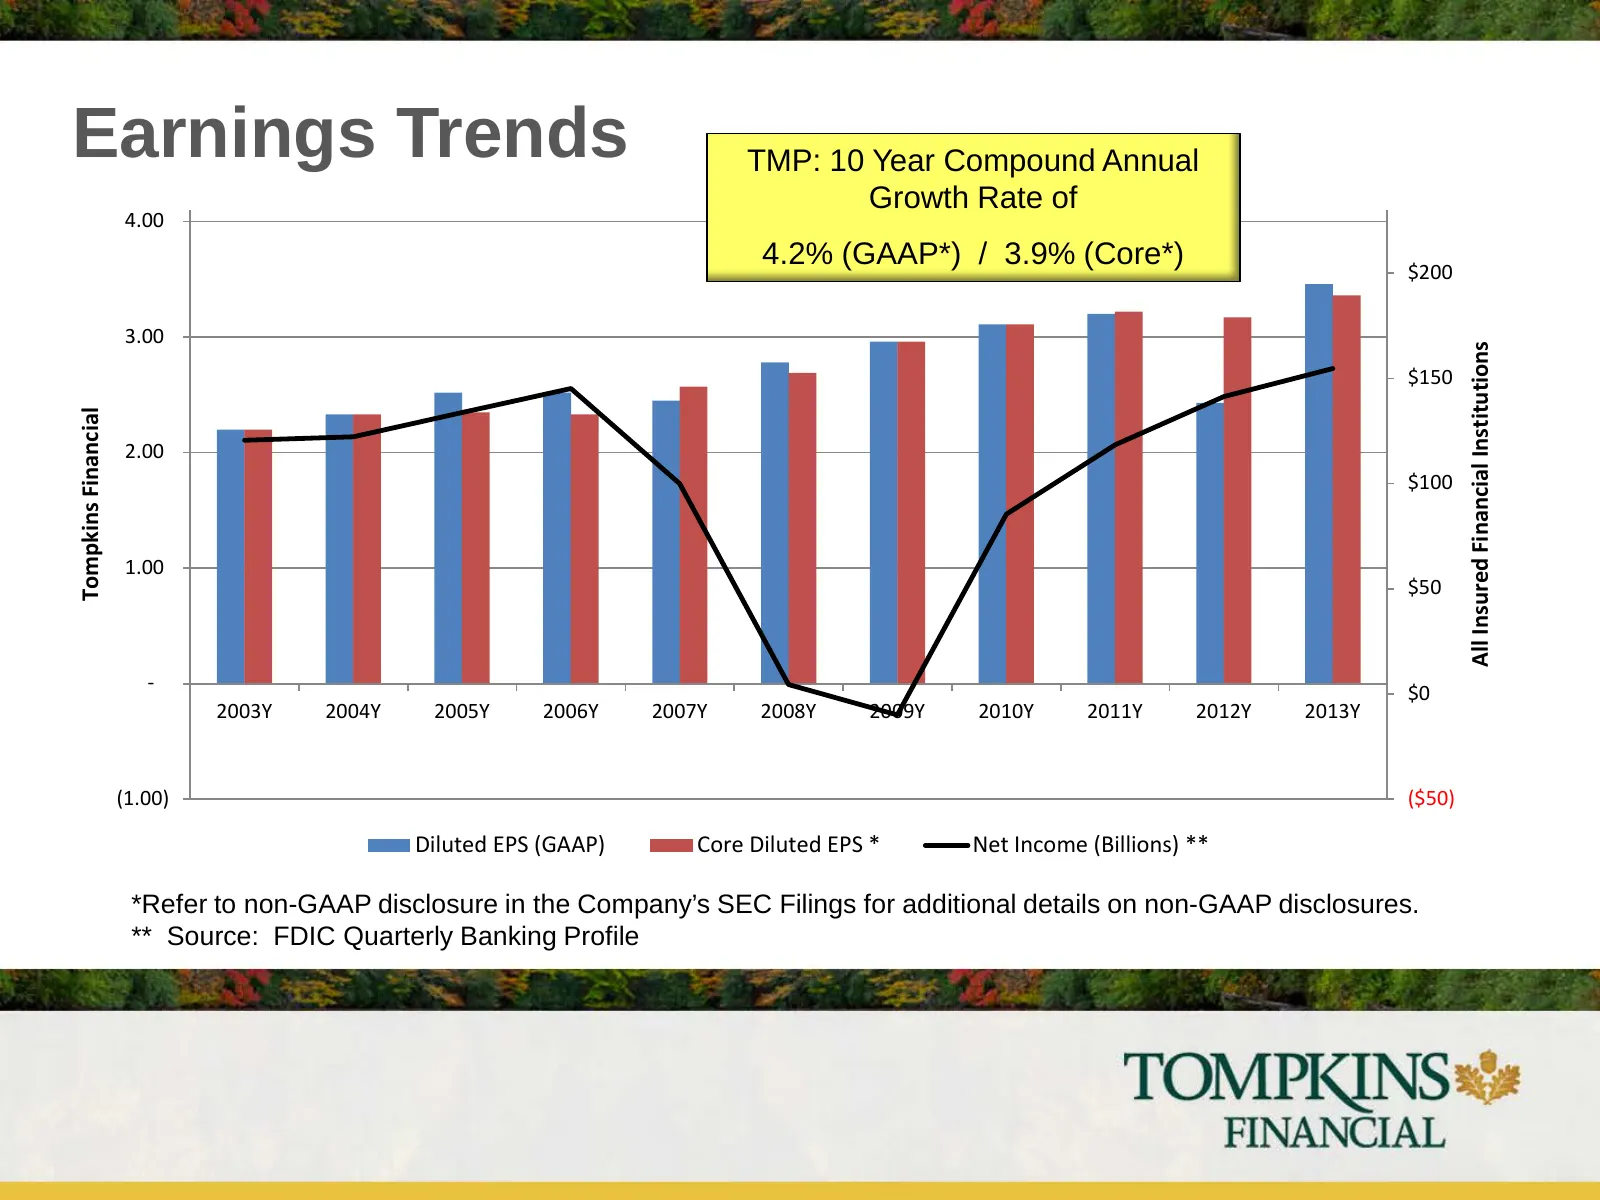
Earnings Trends TMP: 10 Year Compound Annual Growth Rate of 4.00 4.2% (GAAP*) / 3.9% (Core*) 3.00 Tompkins Financial 2.00 1.00 - 2003Y 2004Y 2005Y 2006Y 2007Y 2008Y 2009Y 2010Y 2011Y 2012Y 2013Y (1.00) Diluted EPS (GAAP) Core Diluted EPS * *Refer to non-GAAP disclosure in the Company’s SEC Filings f
Slide 13: Earnings Trends vs All Insured Financial Institutions
Earnings Trends TMP: 10 Year Compound Annual Growth Rate of 4.00 4.2% (GAAP*) / 3.9% (Core*) $200 3.00 All Insured Financial Institutions $150 Tompkins Financial 2.00 $100 1.00 $50 - $0 2003Y 2004Y 2005Y 2006Y 2007Y 2008Y 2009Y 2010Y 2011Y 2012Y 2013Y (1.00) ($50) Diluted EPS (GAAP) Core Diluted EPS
Slide 14: Quarterly Results
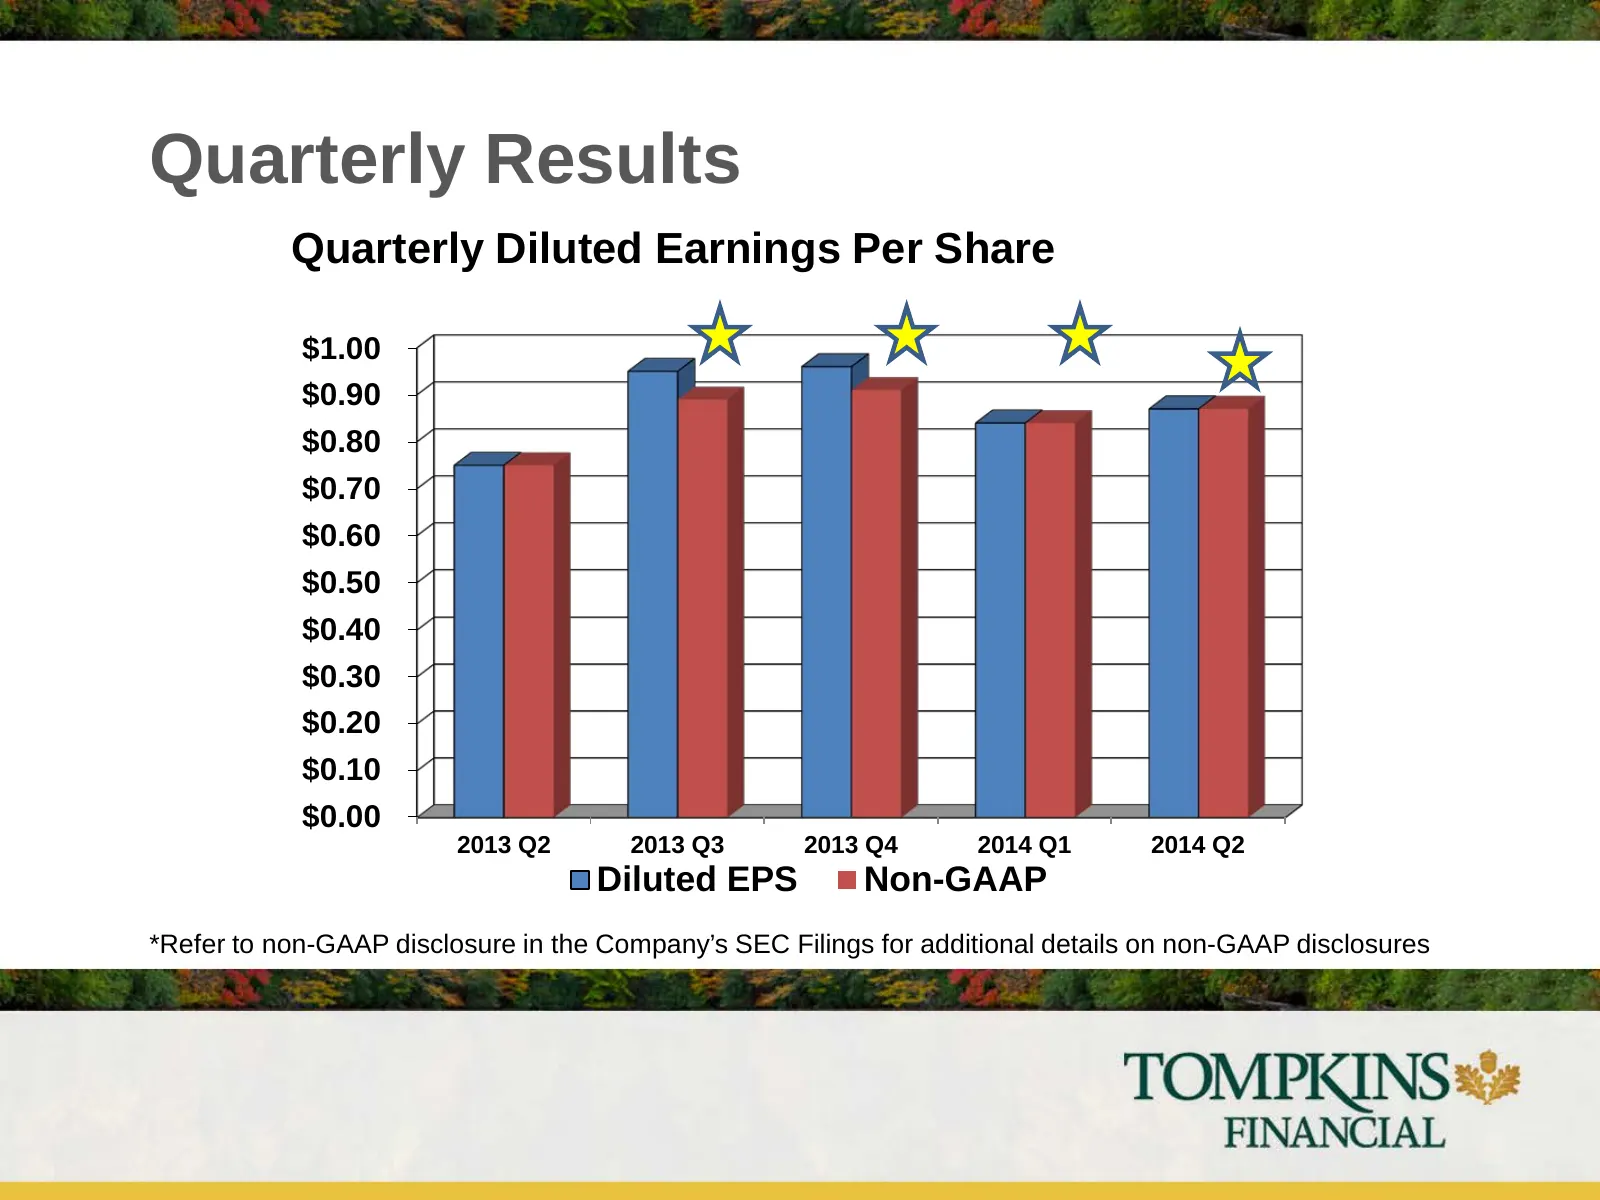
Quarterly Results Quarterly Diluted Earnings Per Share $1.00 $0.90 $0.80 $0.70 $0.60 $0.50 $0.40 $0.30 $0.20 $0.10 $0.00 2013 Q2 2013 Q3 2013 Q4 2014 Q1 2014 Q2 Diluted EPS Non-GAAP *Refer to non-GAAP disclosure in the Company’s SEC Filings for additional details on non-GAAP disclosures
Slide 15: VIST Impact
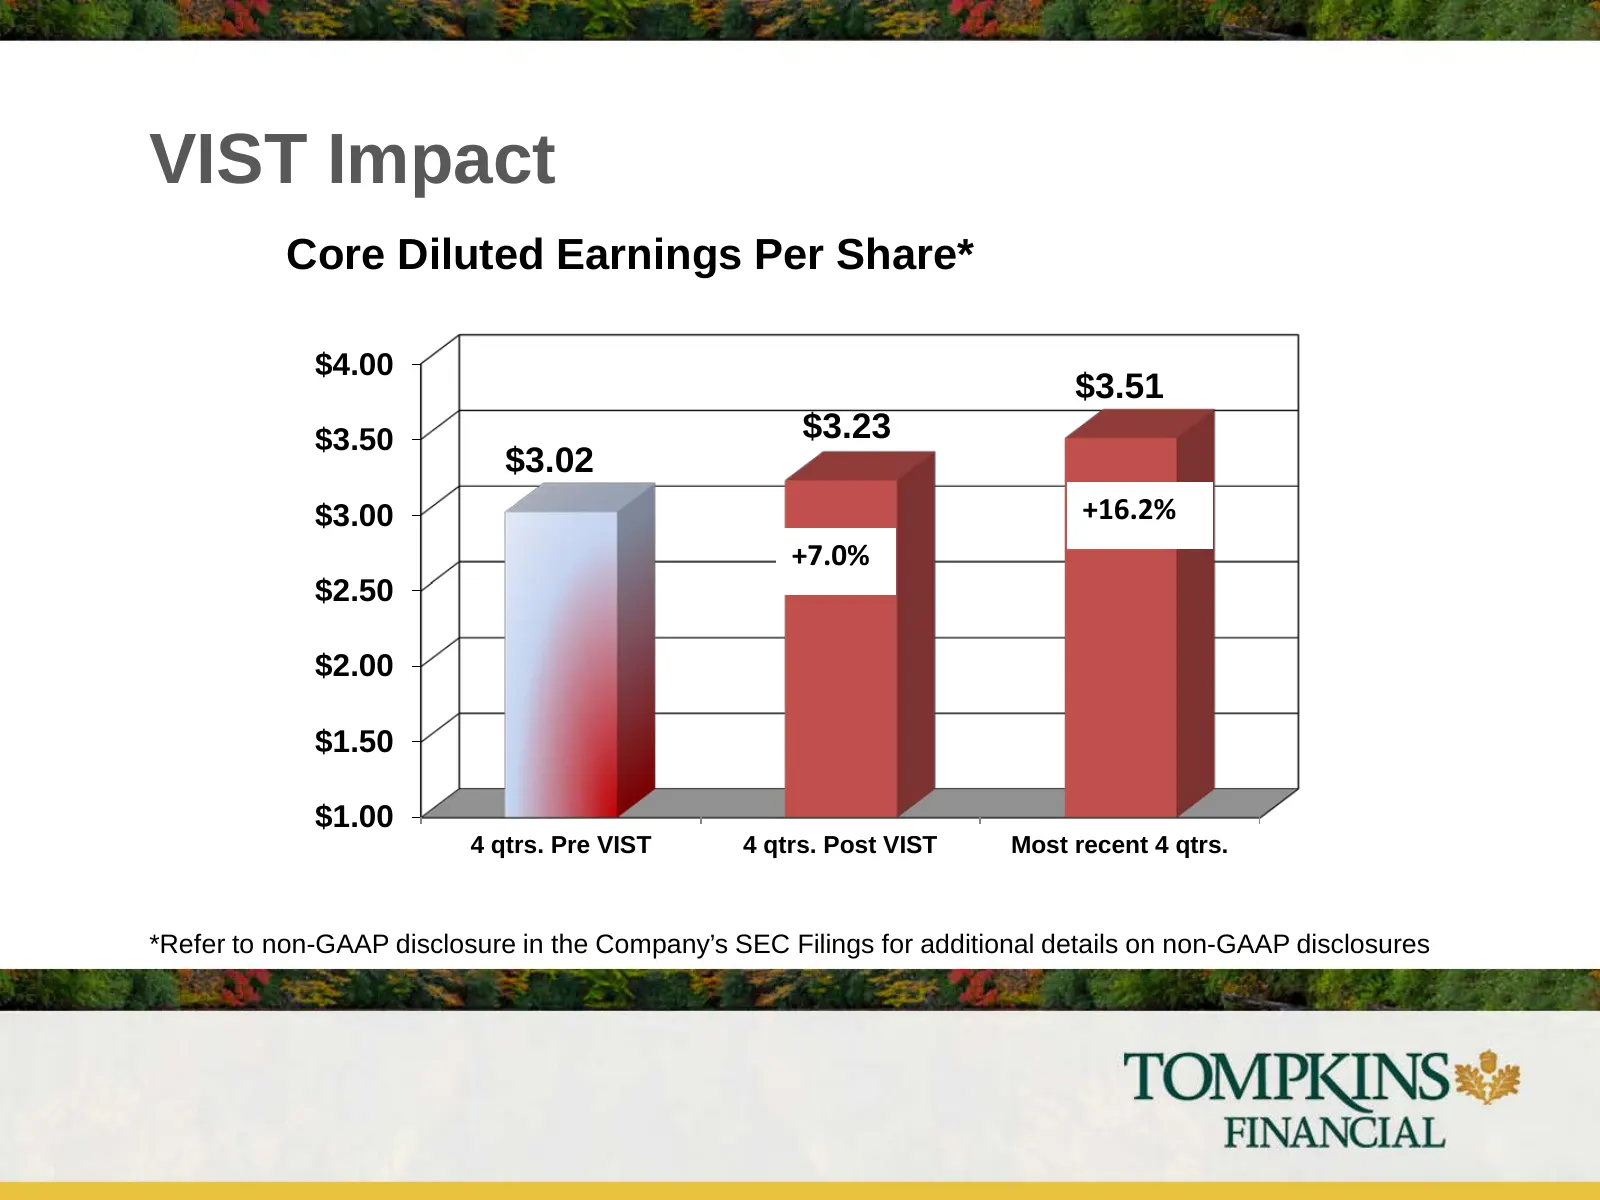
VIST Impact Core Diluted Earnings Per Share* $4.00 $3.51 $3.50 $3.23 $3.02 $3.00 +16.2% +7.0% $2.50 $2.00 $1.50 $1.00 4 qtrs. Pre VIST 4 qtrs. Post VIST Most recent 4 qtrs. *Refer to non-GAAP disclosure in the Company’s SEC Filings for additional details on non-GAAP disclosures
Slide 16: Consistent Track Record of Profitability
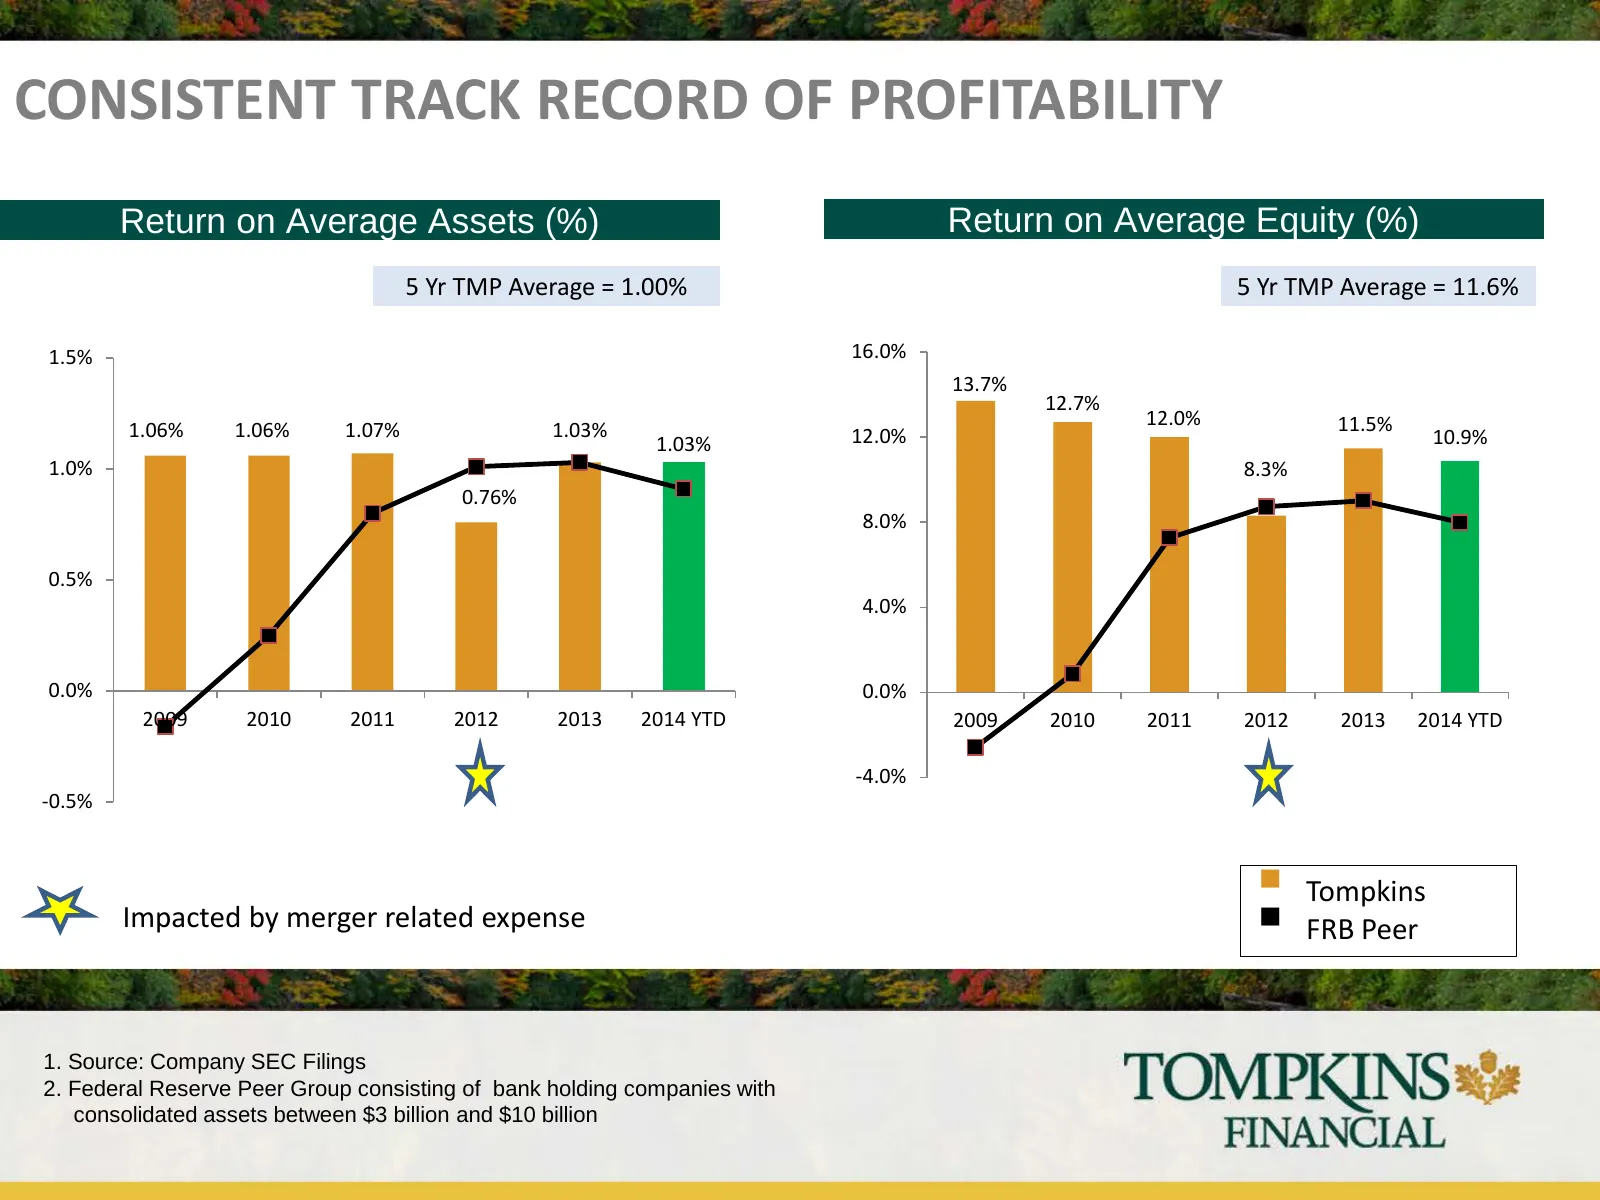
CONSISTENT TRACK RECORD OF PROFITABILITY Return on Average Assets (%) Return on Average Equity (%) 5 Yr TMP Average = 1.00% 5 Yr TMP Average = 11.6% 1.5% 16.0% 13.7% 12.7% 12.0% 11.5% 1.06% 1.06% 1.07% 1.03% 12.0% 10.9% 1.03% 1.0% 8.3% 0.76% 8.0% 0.5% 4.0% 0.0% 0.0% 2009 2010 2011 2012 2013 2014 YTD
Slide 17: Disciplined Credit Culture
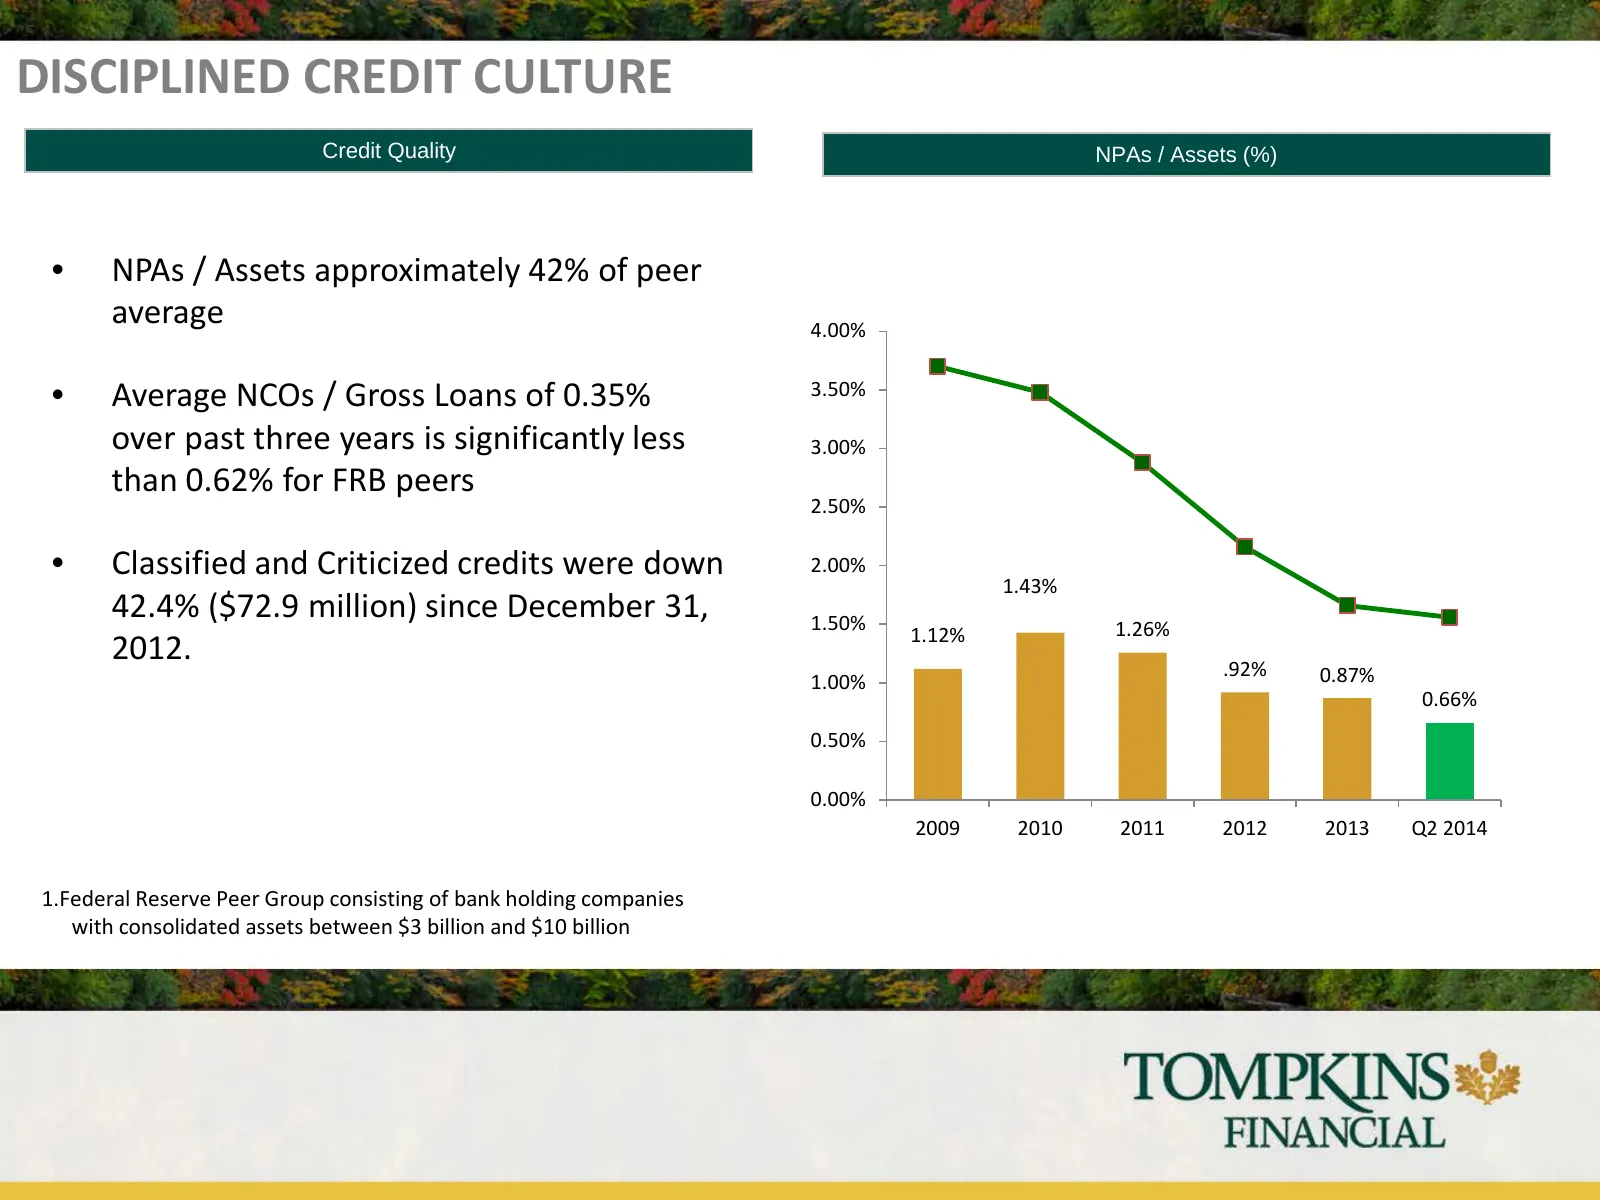
DISCIPLINED CREDIT CULTURE Credit Quality NPAs / Assets (%) • NPAs / Assets approximately 42% of peer average 4.00% • Average NCOs / Gross Loans of 0.35% 3.50% over past three years is significantly less 3.00% than 0.62% for FRB peers 2.50% • Classified and Criticized credits were down 2.00% 1.43% 4
Slide 18: Diversified Revenue: Strong Fee Income
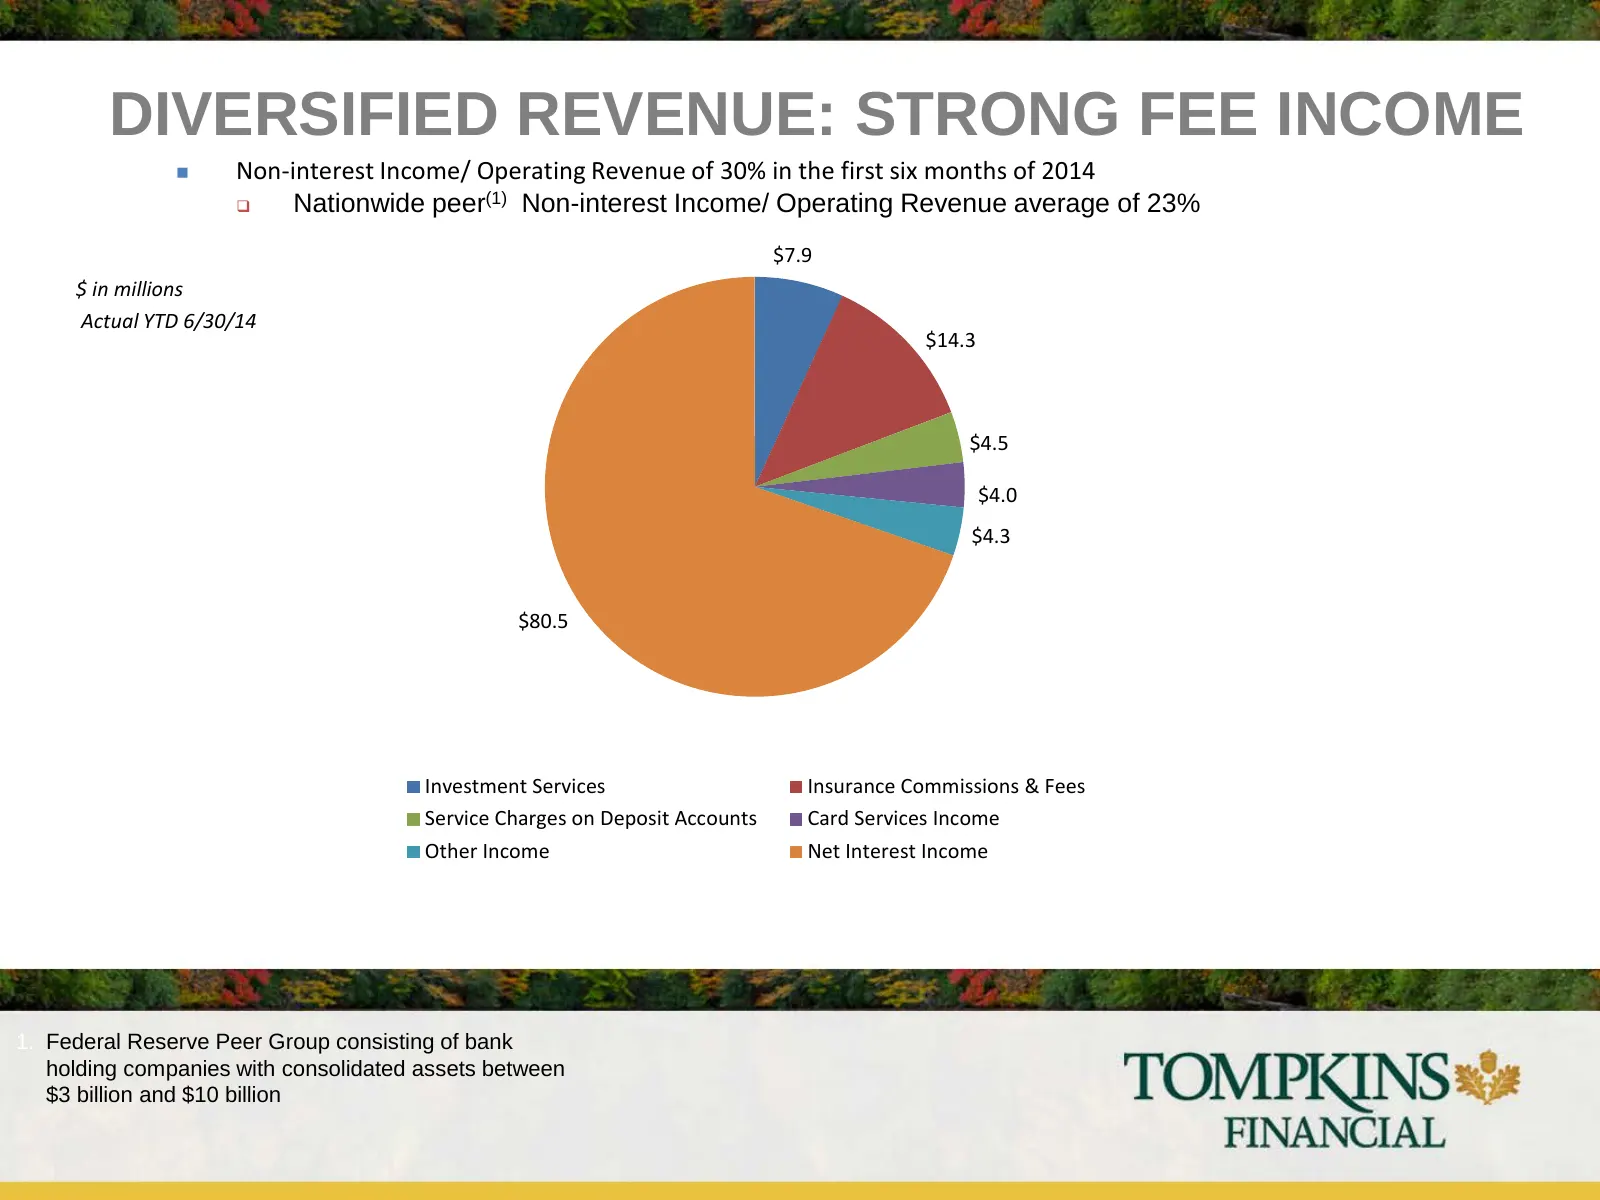
DIVERSIFIED REVENUE: STRONG FEE INCOME Non-interest Income/ Operating Revenue of 30% in the first six months of 2014 Nationwide peer(1) Non-interest Income/ Operating Revenue average of 23% $7.9 $ in millions Actual YTD 6/30/14 $14.3 $4.5 $4.0 $4.3 $80.5 Investment Services Insurance Commissions
Slide 19: Long Term Focus
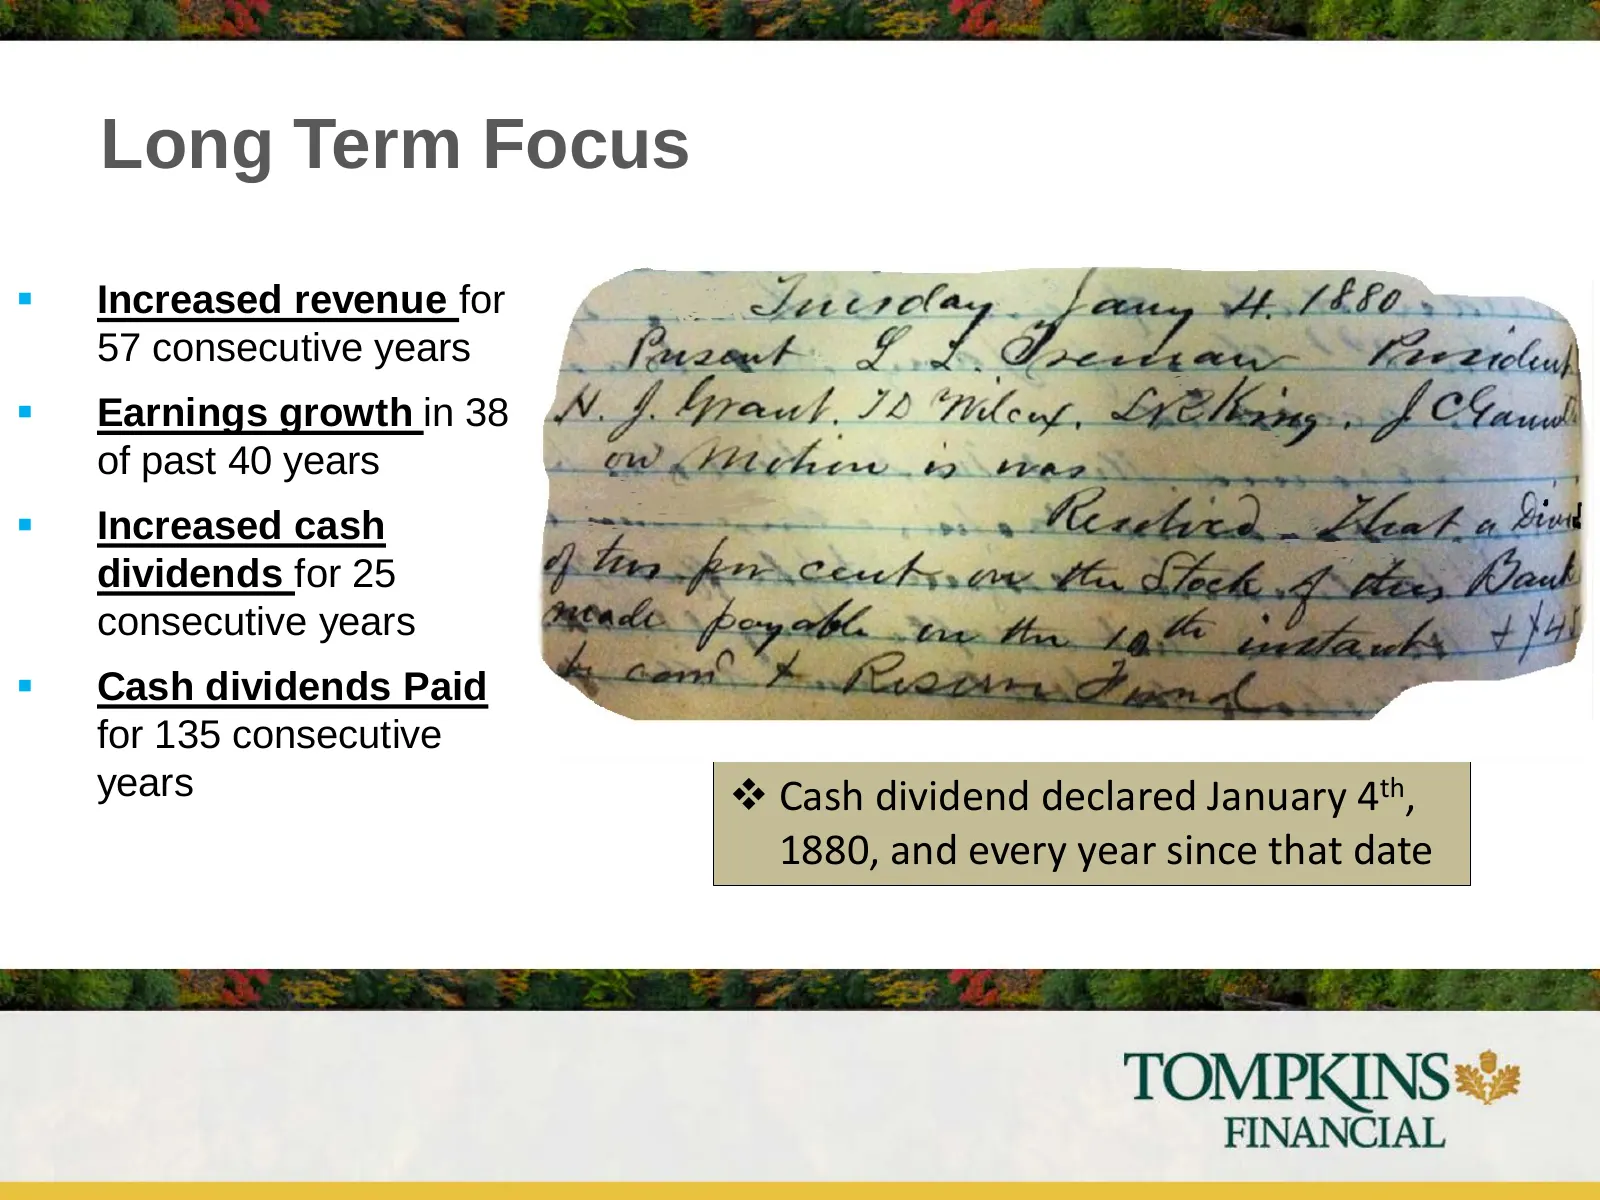
Long Term Focus Increased revenue for 57 consecutive years Earnings growth in 38 of past 40 years Increased cash dividends for 25 consecutive years Cash dividends Paid for 135 consecutive years Cash dividend declared January 4th, 1880, and every year since that date
Slide 20: Conclusion
Conclusion Proven track record of delivering industry leading results Commitment to continuing legacy of superior shareholder value creation Meaningful contribution from non-interest income sources Disciplined credit culture Expectation of strong financial returns and improved growth oppor
Slide 21: Investor Presentation – 2014 KBW Community Bank Investor Conference
Investor Presentation 2014 KBW Community Bank Investor Conference July 29, 2014
Source: Internet Archive copy of tompkinsfinancial.com
More decks from Tompkins Financial Corporation
 Piper Sandler Financial Services Conference 202624 slides · Nov 16, 2026
 KBW Summer Bank Conference 202624 slides · Jul 28, 2026
 Shareholder Meeting (May 2026)14 slides · May 19, 2026
 Shareholder Meeting (May 2025)13 slides · May 13, 2025
 Shareholder Meeting (May 2024)13 slides · May 14, 2024
 Shareholder Meeting (May 2023)37 slides · May 9, 2023