Gramercy Property Trust — REITWeek 2013: NAREIT's Investor Forum
40 slides from Gramercy Property Trust's conference presentation, Jun 5, 2013
Slide 1: REITWeek 2013: NAREIT's Investor Forum June 2013
REITWeek 2013: NAREIT’s Investor Forum June 2013
Slide 2: Forward-Looking Information/NOI and Cap Rate Disclaimers
Forward - Looking Information/NOI and Cap Rate Disclaimers Cautionary Note Regarding Forward - Looking Information This investment presentation contains "forward - looking statements" based upon the Company's current best judgment and expectations . You can identify forward - looking statements by t
Slide 3: Business Plan – 2013-2015
Business Plan – 2013 - 2015 ▪ Sell CDOs ▪ Invest cash to create recurring cash flow ▪ Maximize Gramercy Asset Management profit center ▪ Significantly reduce MG&A ▪ Grow equity base ▪ Streamline business, simplify story ▪ Create durable, growing dividends 3
Slide 4: Gramercy Property Trust
Gramercy Property Trust ▪ March 2013 – CDOs sold ▪ April 15, 2013 ▪ Changed name to reflect business as pure play equity REIT ▪ Changed NYSE ticker to “GPT” from “GKK” 4
Slide 5: Investment Update
Investment Update GRAMERCY PROPERTY TRUST 2
Slide 6: Target Markets
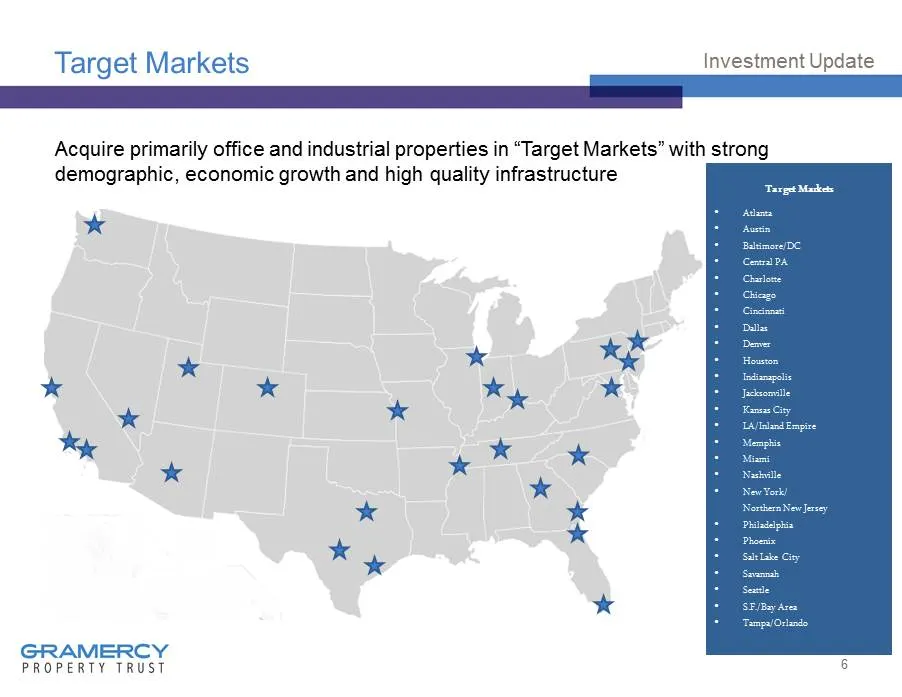
Target Markets Acquire primarily office and industrial properties in “Target Markets” with strong demographic, economic growth and high quality infrastructure 6 Investment Update Target Markets • Atlanta • Austin • Baltimore/DC • Central PA • Charlotte • Chicago • Cincinnati • Dallas • Denver • Hous
Slide 7: Investment Focus
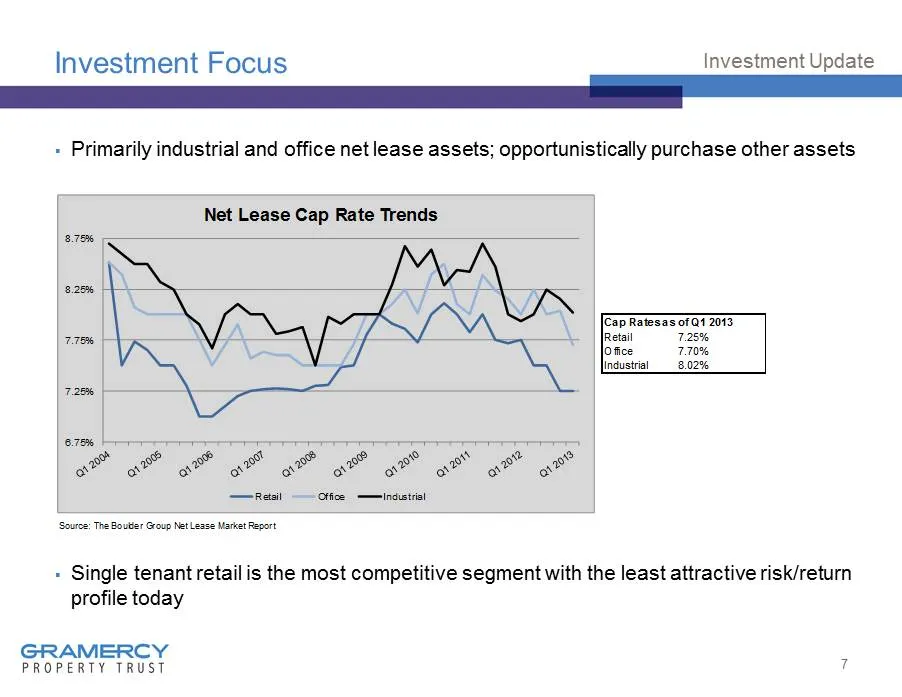
Investment Focus ▪ Primarily industrial and office net lease assets; opportunistically purchase other assets ▪ Single tenant retail is the most competitive segment with the least attractive risk/return profile today 7 Investment Update Cap Rates as of Q1 2013 Retail 7.25% Office 7.70% Industrial 8.0
Slide 8: Gramercy Transaction Capability
Gramercy Transaction Capability Capability » Invested in 122 properties 1 totaling $ 580 million since new management team began » Sold 93 properties totaling $408 million in 2012 2 Experience » 20+ years average real estate experience among top executives » Led by Gordon DuGan – 25 years of experie
Slide 9: Investment Update – Current Pipeline
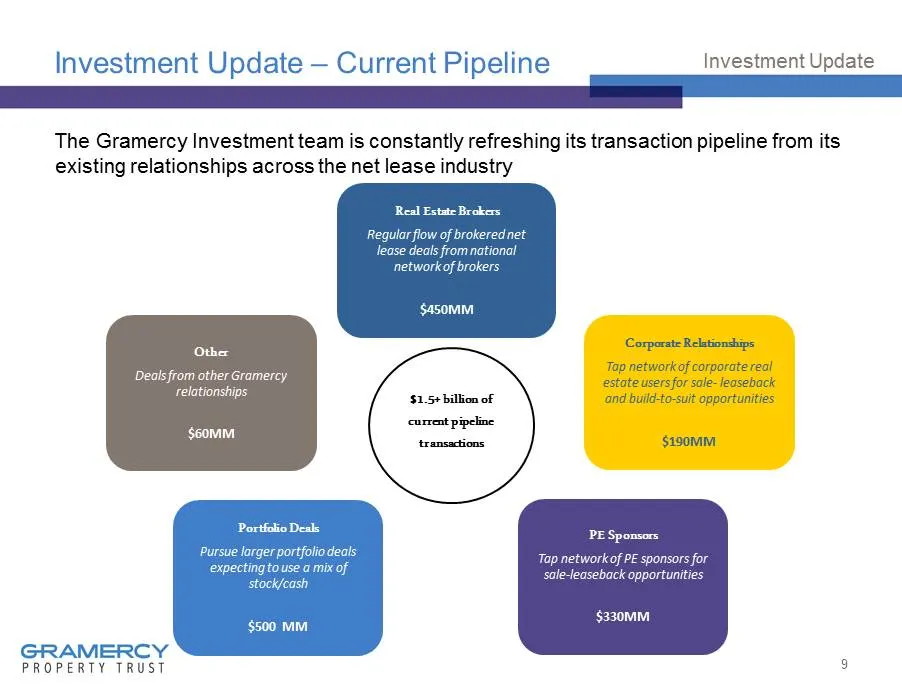
Investment Update – Current Pipeline The Gramercy Investment team is constantly refreshing its transaction pipeline from its existing relationships across the net lease industry 9 Investment Update Real Estate Brokers Regular flow of brokered net lease deals from national network of brokers $450MM C
Slide 10: Gramercy Disciplined Underwriting
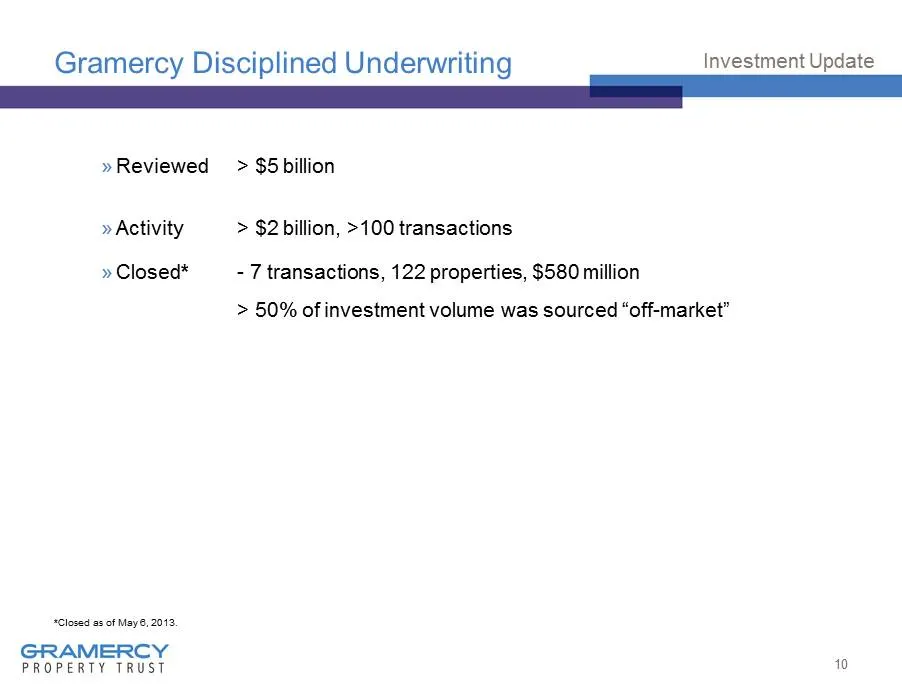
Gramercy Disciplined Underwriting » Reviewed > $5 billion » Activity > $2 billion, >100 transactions » Closed * - 7 transactions, 122 properties, $580 million > 50% of investment volume was sourced “off - market” 10 Investment Update * Closed as of May 6, 2013.
Slide 11: Bank of America Portfolio – Core
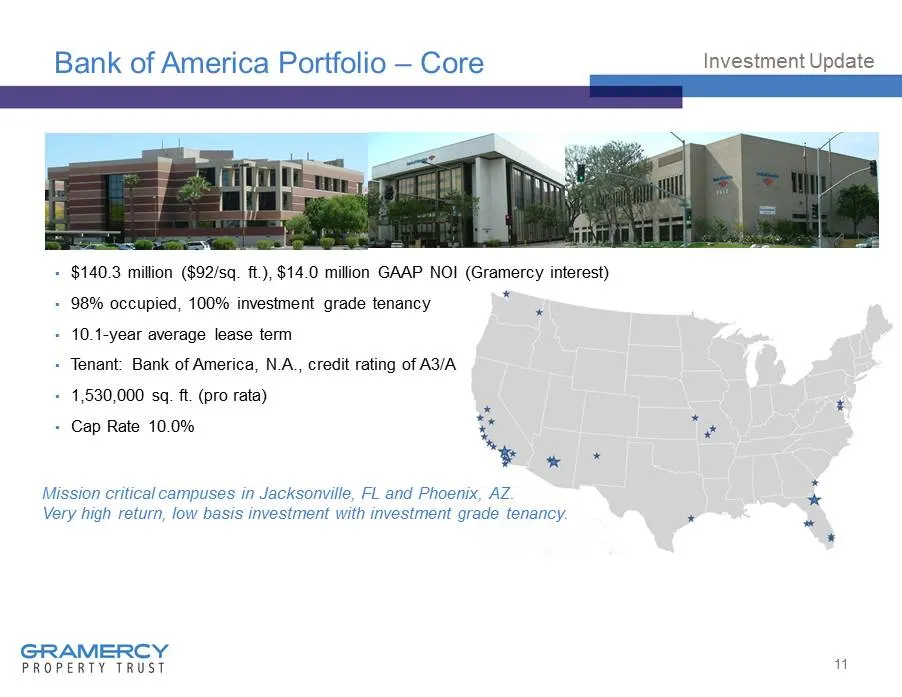
Bank of America Portfolio – Core ▪ $140.3 million ($92/sq. ft.), $14.0 million GAAP NOI (Gramercy interest) ▪ 98% occupied, 100% investment grade tenancy ▪ 10.1 - year average lease term ▪ Tenant: Bank of America, N.A., credit rating of A 3/A ▪ 1,530,000 sq. ft. (pro rata) ▪ Cap Rate 10.0% 11 Invest
Slide 12: Indianapolis Industrial Portfolio
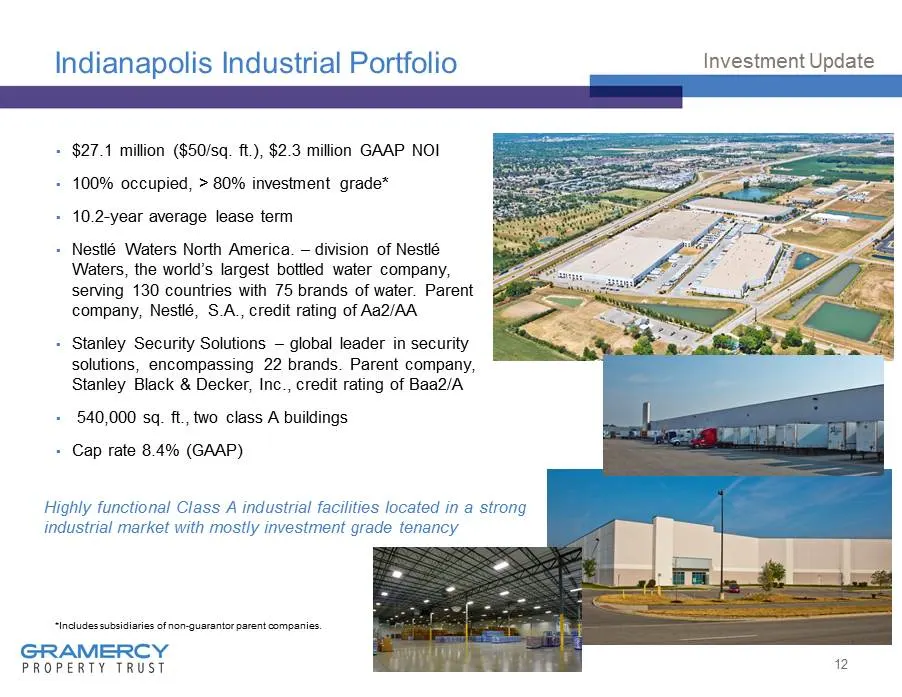
Indianapolis Industrial Portfolio ▪ $27.1 million ($50/sq. ft.), $2.3 million GAAP NOI ▪ 100 % occupied, > 80% investment grade * ▪ 10.2 - year average lease term ▪ Nestlé Waters North America. – division of Nestlé Waters, the world’s largest bottled water company, serving 130 countries with 75 bran
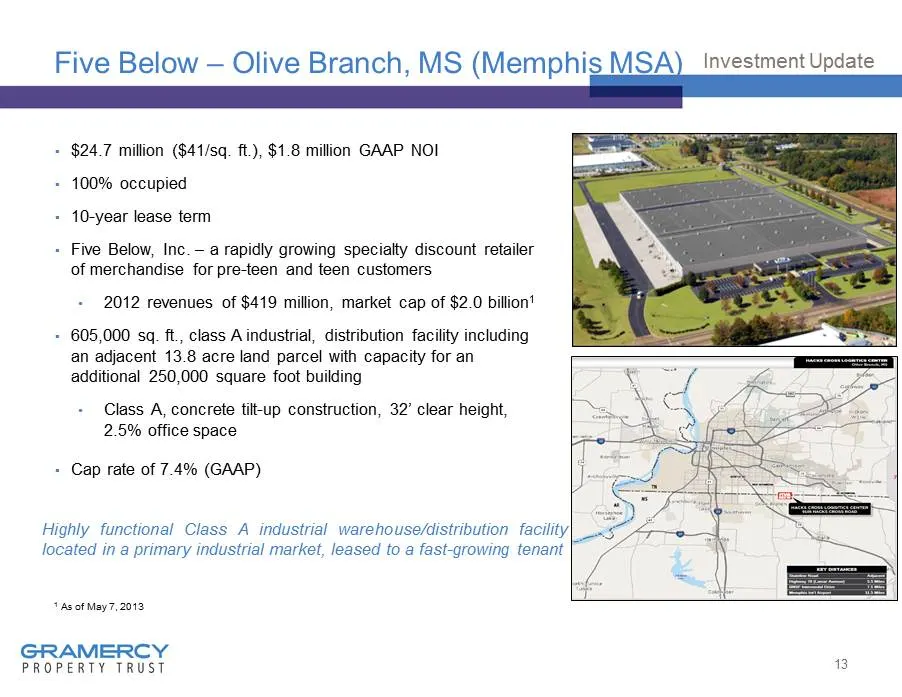
Slide 13: Five Below – Olive Branch, MS (Memphis MSA)
Five Below – Olive Branch, MS (Memphis MSA) ▪ $24.7 million ($ 41/sq . ft .), $1.8 million GAAP NOI ▪ 100 % occupied ▪ 10 - year lease term ▪ Five Below, Inc. – a rapidly growing specialty discount retailer of merchandise for pre - teen and teen customers • 2012 revenues of $419 million, market cap
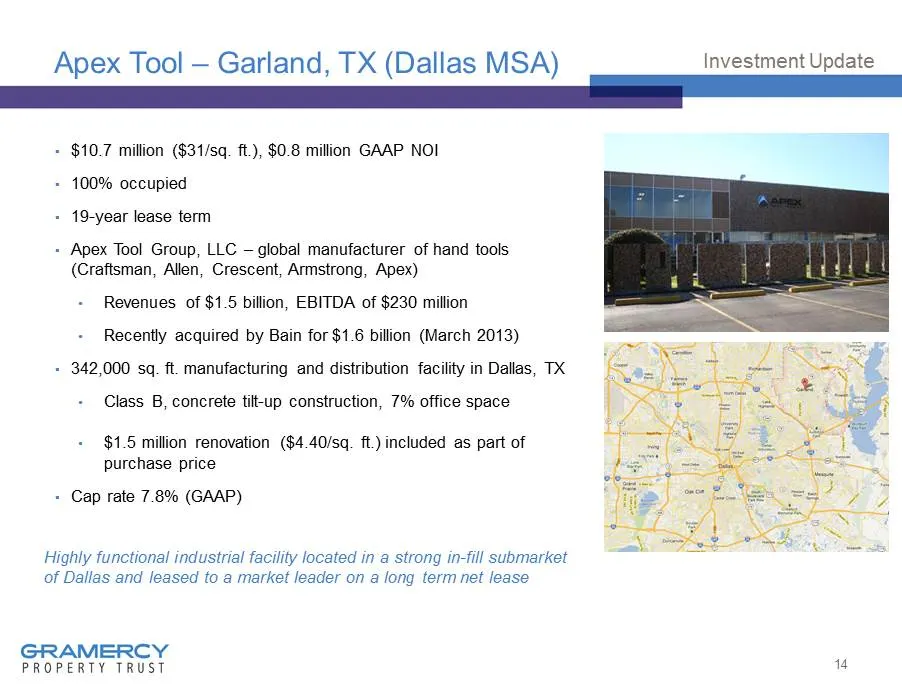
Slide 14: Apex Tool – Garland, TX (Dallas MSA)
Apex Tool – Garland, TX (Dallas MSA) ▪ $10.7 million ($31/sq. ft.), $0.8 million GAAP NOI ▪ 100% occupied ▪ 19 - year lease term ▪ Apex Tool Group, LLC – global manufacturer of hand tools (Craftsman, Allen, Crescent, Armstrong, Apex) • Revenues of $1.5 billion, EBITDA of $230 million • Recently acqu
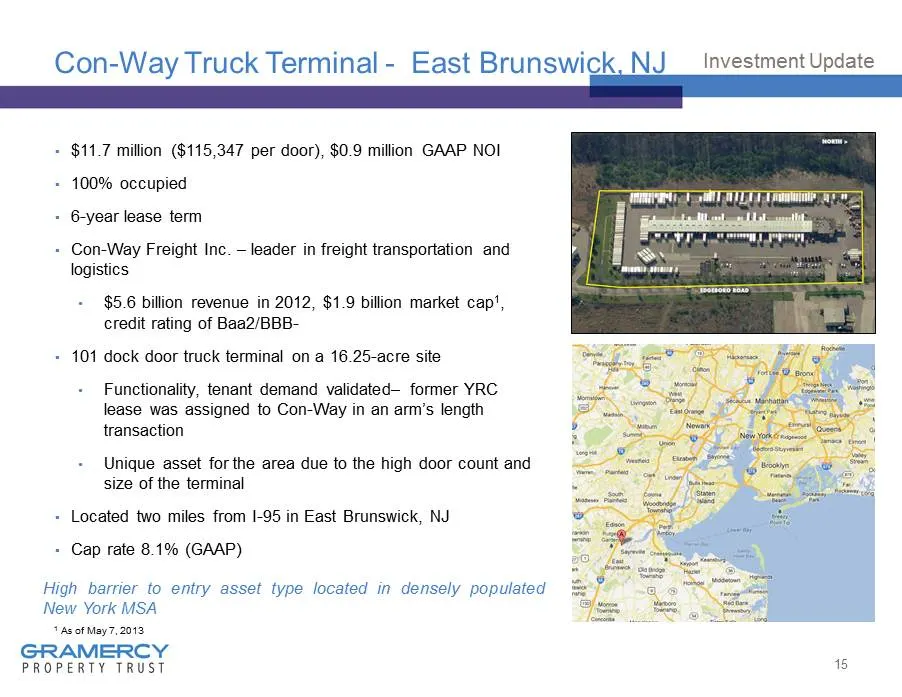
Slide 15: Con-Way Truck Terminal - East Brunswick, NJ
Con - Way Truck Terminal - East Brunswick, NJ ▪ $11.7 million ($115,347 per door), $0.9 million GAAP NOI ▪ 100% occupied ▪ 6 - year lease term ▪ Con - Way Freight Inc. – leader in freight transportation and logistics • $5.6 billion revenue in 2012, $1.9 billion market cap 1 , credit rating of Baa2/B
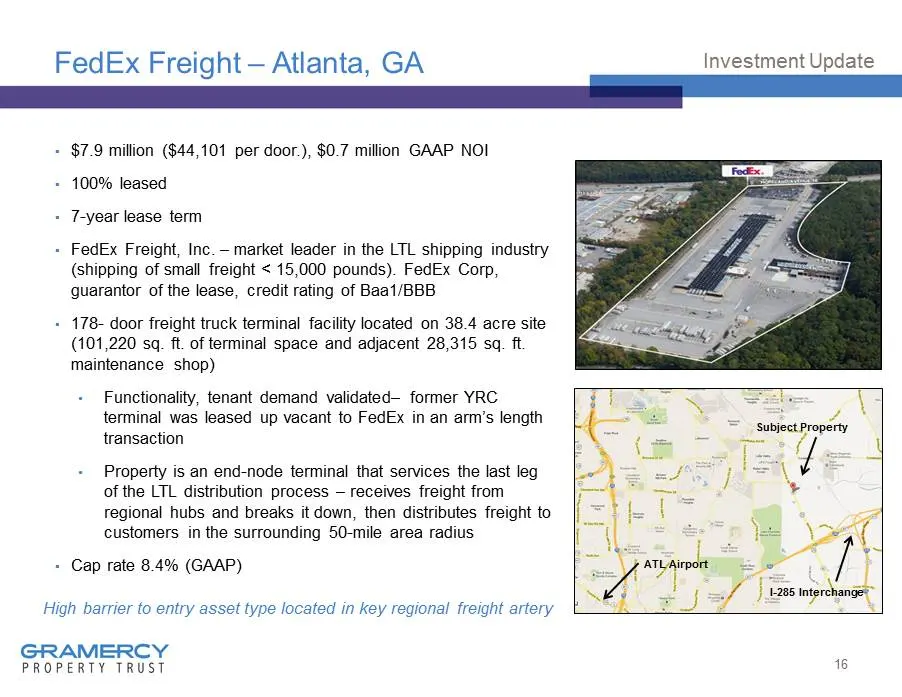
Slide 16: FedEx Freight – Atlanta, GA
FedEx Freight – Atlanta, GA ▪ $7.9 million ($44,101 per door.), $0.7 million GAAP NOI ▪ 100% leased ▪ 7 - year lease term ▪ FedEx Freight, Inc. – market leader in the LTL shipping industry (shipping of small freight < 15,000 pounds). FedEx Corp, guarantor of the lease, credit rating of Baa1/BBB ▪ 17
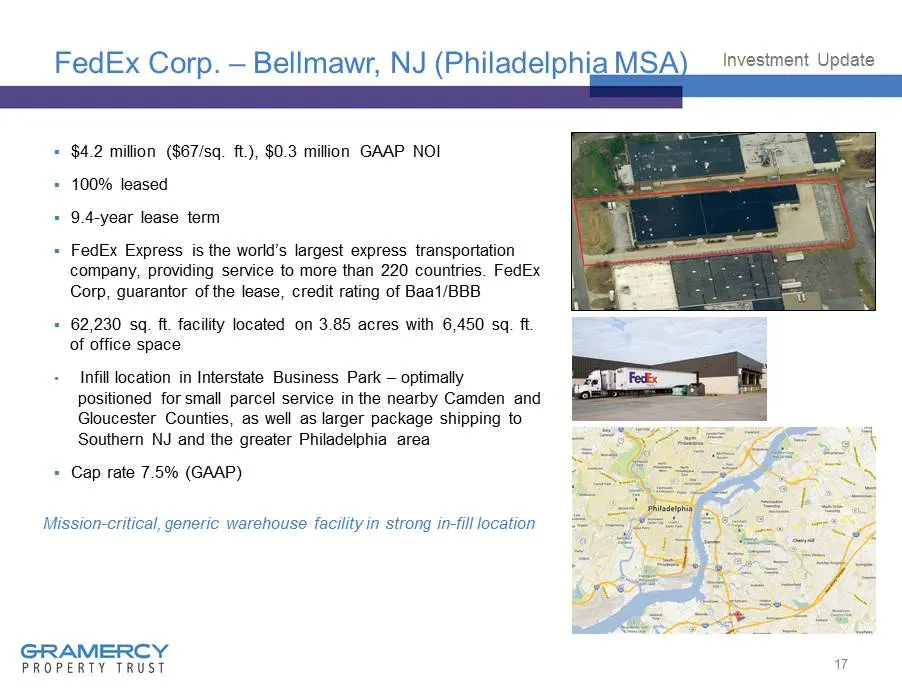
Slide 17: FedEx Corp. – Bellmawr, NJ (Philadelphia MSA)
FedEx Corp. – Bellmawr, NJ (Philadelphia MSA) 17 Investment Update ▪ $4.2 million ($67/sq. ft.), $0.3 million GAAP NOI ▪ 100 % leased ▪ 9.4 - year lease term ▪ FedEx Express is the world’s largest express transportation company, providing service to more than 220 countries. FedEx Corp, guarantor of
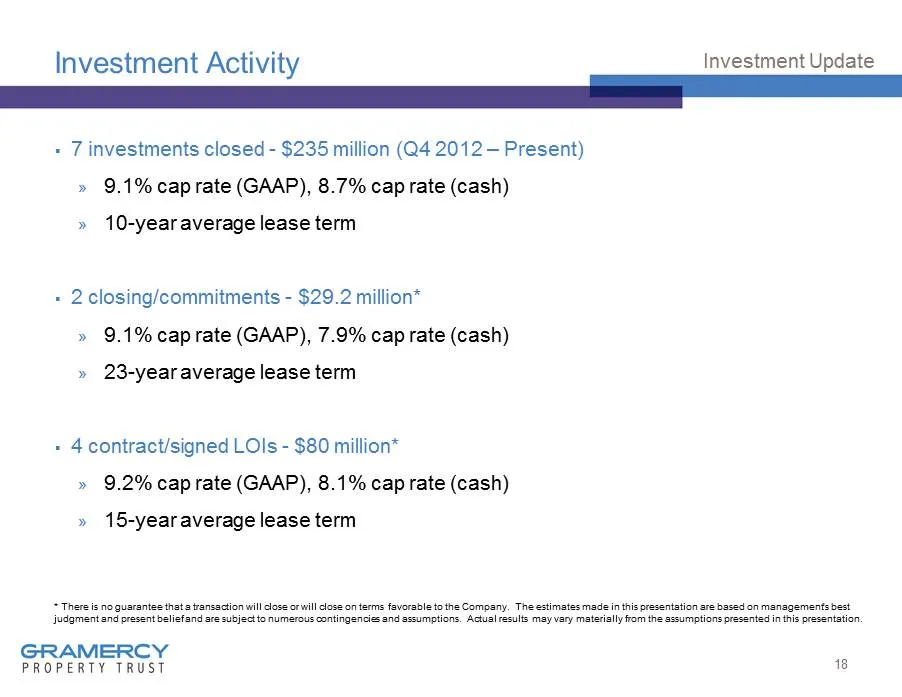
Slide 18: Investment Activity
Investment Activity 18 Investment Update ▪ 7 investments closed - $235 million (Q4 2012 – Present) » 9.1% cap rate (GAAP), 8.7% cap rate (cash) » 10 - year average lease term ▪ 2 closing/commitments - $29.2 million* » 9.1% cap rate (GAAP), 7.9% cap rate (cash) » 23 - year average lease term ▪ 4 cont
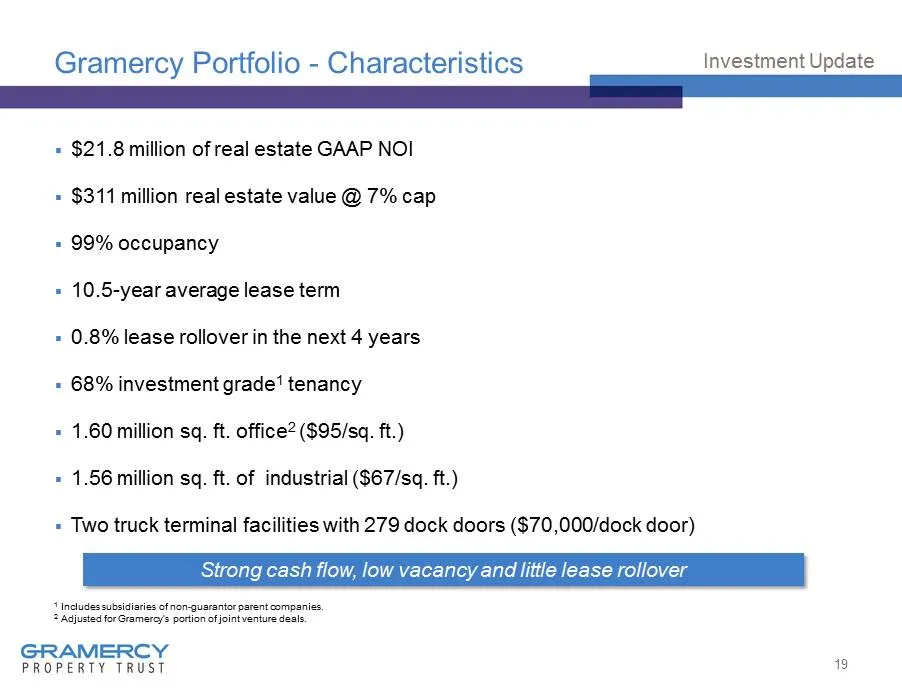
Slide 19: Gramercy Portfolio - Characteristics
Gramercy Portfolio - Characteristics ▪ $21.8 million of real estate GAAP NOI ▪ $311 million real estate value @ 7% cap ▪ 99% occupancy ▪ 10.5 - year average lease term ▪ 0.8% lease rollover in the next 4 years ▪ 68% investment grade 1 tenancy ▪ 1.60 million sq. ft. office 2 ($95/sq. ft.) ▪ 1.56 mill
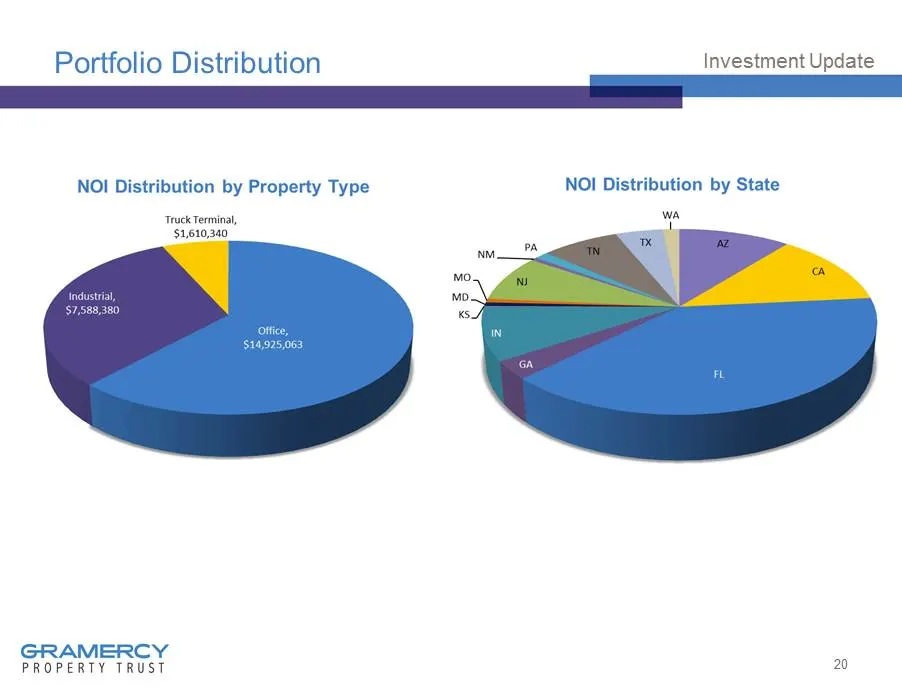
Slide 20: Portfolio Distribution
Portfolio Distribution 20 Investment Update
Slide 21: Maximize Asset Management Profit Center
21 Maximize Asset Management Profit Center
Slide 22: Asset Management
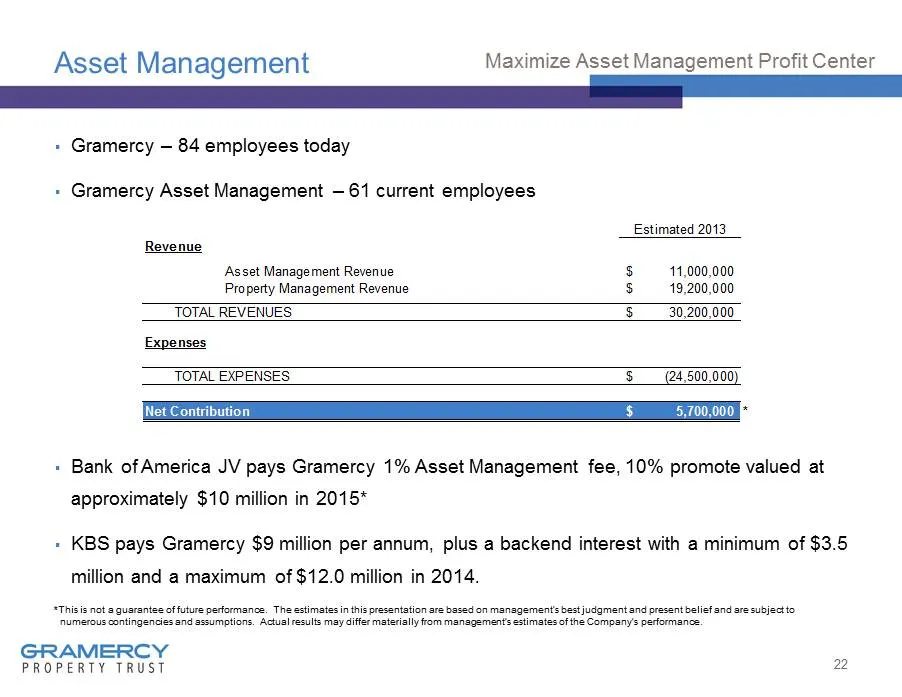
Asset Management ▪ Gramercy – 84 employees today ▪ Gramercy Asset Management – 61 current employees ▪ Bank of America JV pays Gramercy 1% Asset Management fee, 10% promote valued at approximately $10 million in 2015* ▪ KBS pays Gramercy $9 million per annum, plus a backend interest with a minimum of
Slide 23: Asset Management
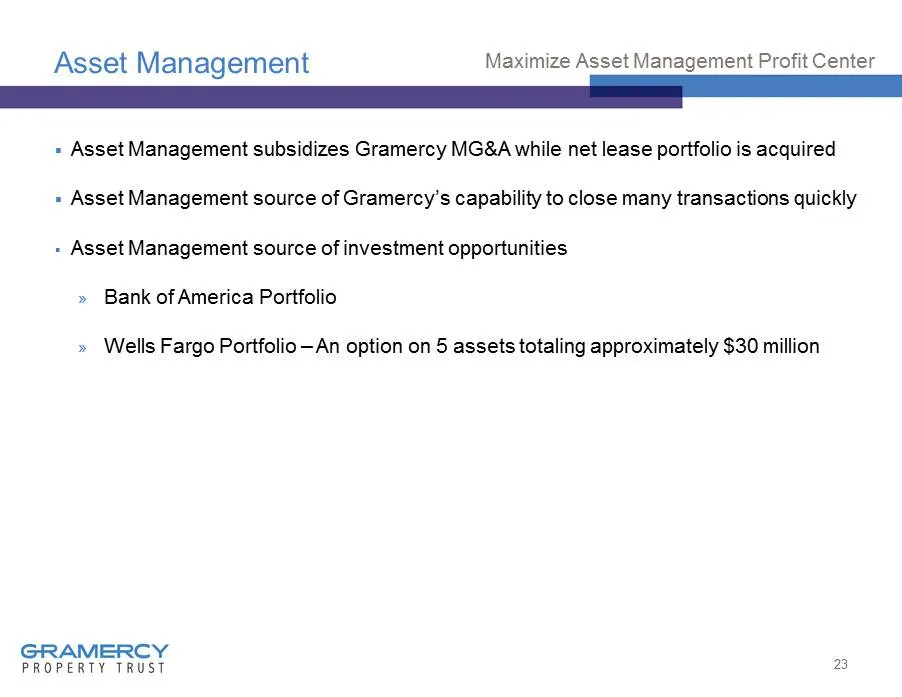
Asset Management ▪ Asset Management subsidizes Gramercy MG&A while net lease portfolio is acquired ▪ Asset Management source of Gramercy’s capability to close many transactions quickly ▪ Asset Management source of investment opportunities » Bank of America Portfolio » Wells Fargo Portfolio – An opti
Slide 24: Significantly Reduce Management, General & Administrative (MG&A)
24 Significantly Reduce Management, General & Administrative (MG&A)
Slide 25: 2013 Bridge: Significantly Reduce MG&A
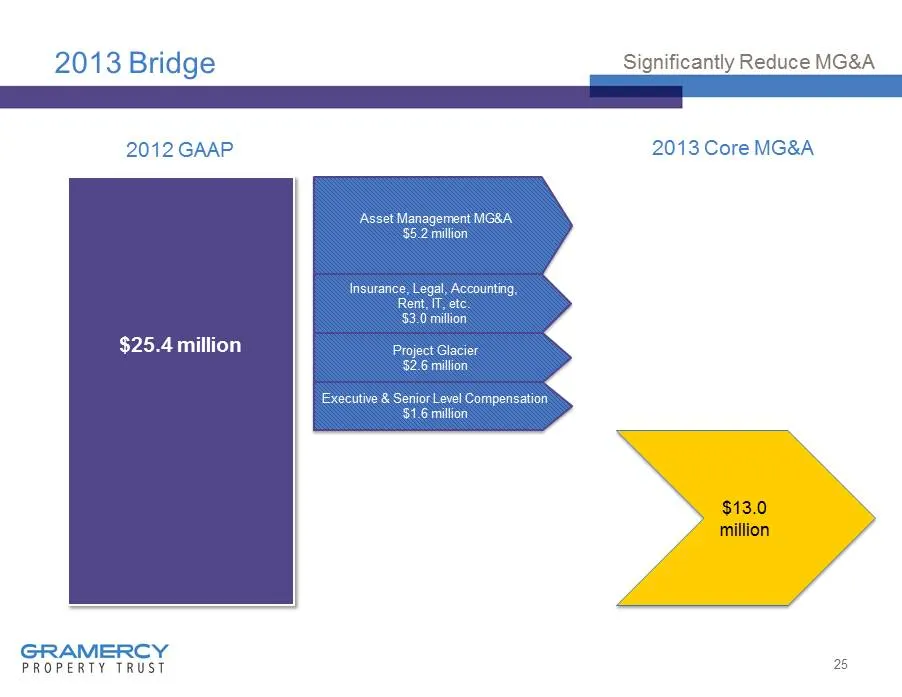
2013 Bridge 25 Significantly Reduce MG&A $25.4 million 2012 GAAP 2013 Core MG&A $13.0 million Asset Management MG&A $5.2 million Insurance, Legal, Accounting, Rent, IT, etc. $3.0 million Project Glacier $2.6 million Executive & Senior Level Compensation $1.6 million
Slide 26: 2014
2014 ▪ Existing Core MG&A will provide a platform for growth of business in 2014 and beyond ▪ In the absence of any growth opportunities, Gramercy Core MG&A could be reduced to approximately $10 - $11 million for 2014 primarily through: » $2.5 million personnel reduction » $0.5 million professional
Slide 27: Net Lease Industry Update
Net Lease Industry Update oe GRAMERCY a PROPERTY TRUST
Slide 28: Net Lease Marketplace Summary
Net Lease Marketplace Summary ▪ Well managed, well capitalized public net lease companies trade at attractive valuations: » 1.2 - 1.3x NAV » 20x AFFO » 2.8x Book ▪ $8.0 b illion of net lease portfolio companies have been sold/merged in the last three years at an average straight - lined cap rate for
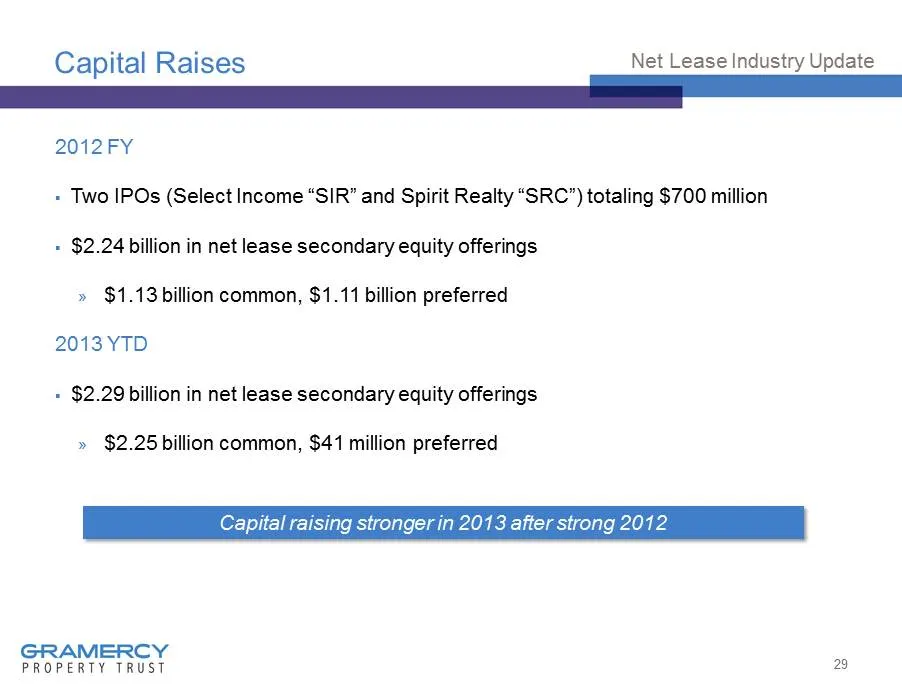
Slide 29: Capital Raises
Capital Raises 2012 FY ▪ Two IPOs (Select Income “SIR” and Spirit Realty “SRC”) totaling $700 million ▪ $2.24 billion in net lease secondary equity offerings » $1.13 billion common, $1.11 billion preferred 2013 YTD ▪ $2.29 billion in net lease secondary equity offerings » $2.25 billion common, $41 m
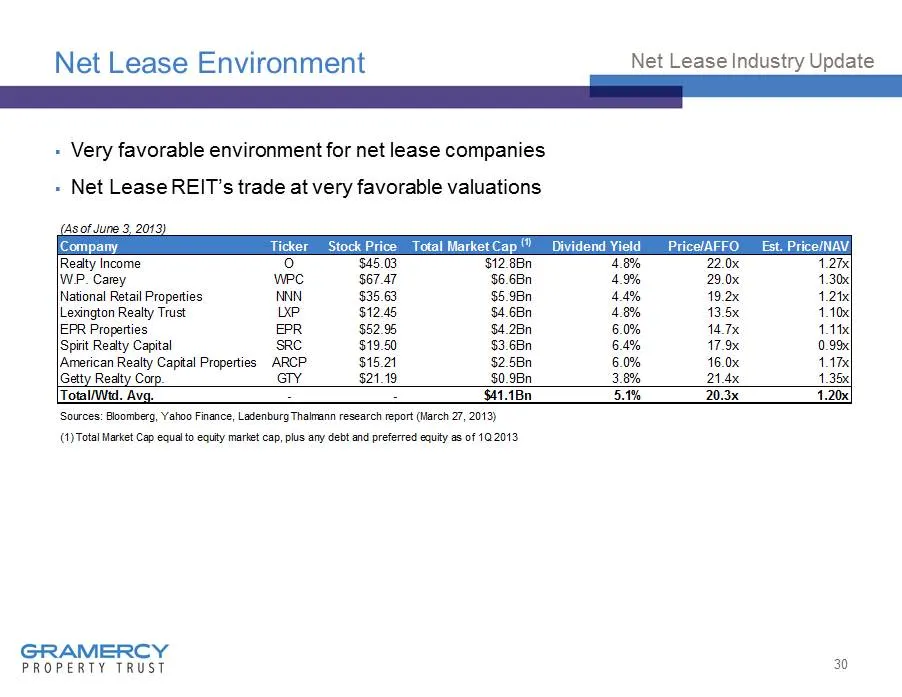
Slide 30: Net Lease Environment
Net Lease Environment ▪ Very favorable environment for net lease companies ▪ Net Lease REIT’s trade at very favorable valuations 30 Net Lease Industry Update (As of June 3, 2013) Company Ticker Stock Price Total Market Cap (1) Dividend Yield Price/AFFO Est. Price/NAV Realty Income O $45.03 $12.8Bn 4
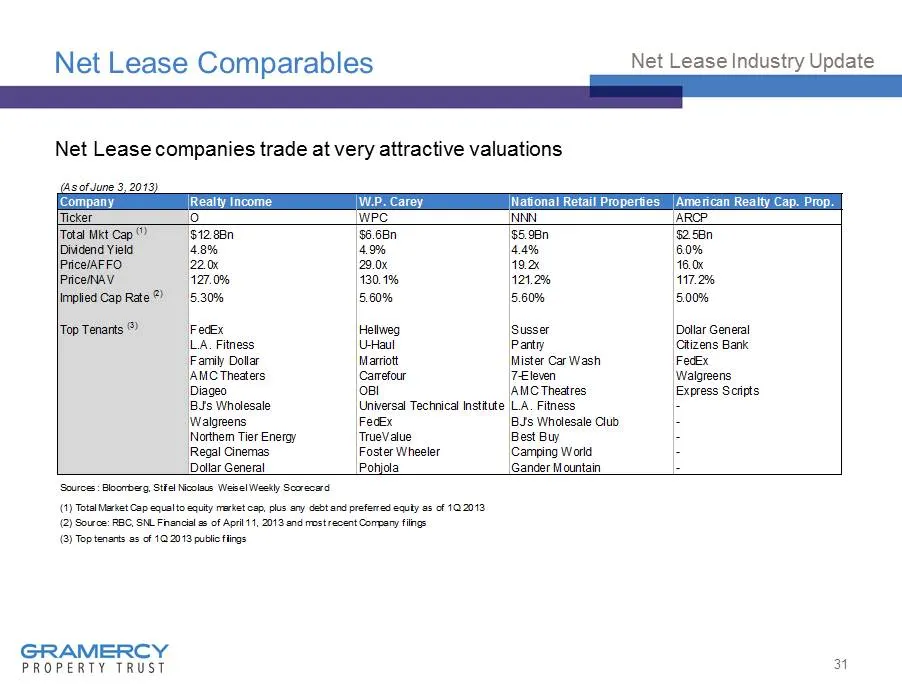
Slide 31: Net Lease Comparables
Net Lease Comparables Net Lease companies trade at very attractive valuations 31 Net Lease Industry Update (As of June 3, 2013) Company Realty Income W.P. Carey National Retail Properties American Realty Cap. Prop. Ticker O WPC NNN ARCP Total Mkt Cap (1) $12.8Bn $6.6Bn $5.9Bn $2.5Bn Dividend Yield 4
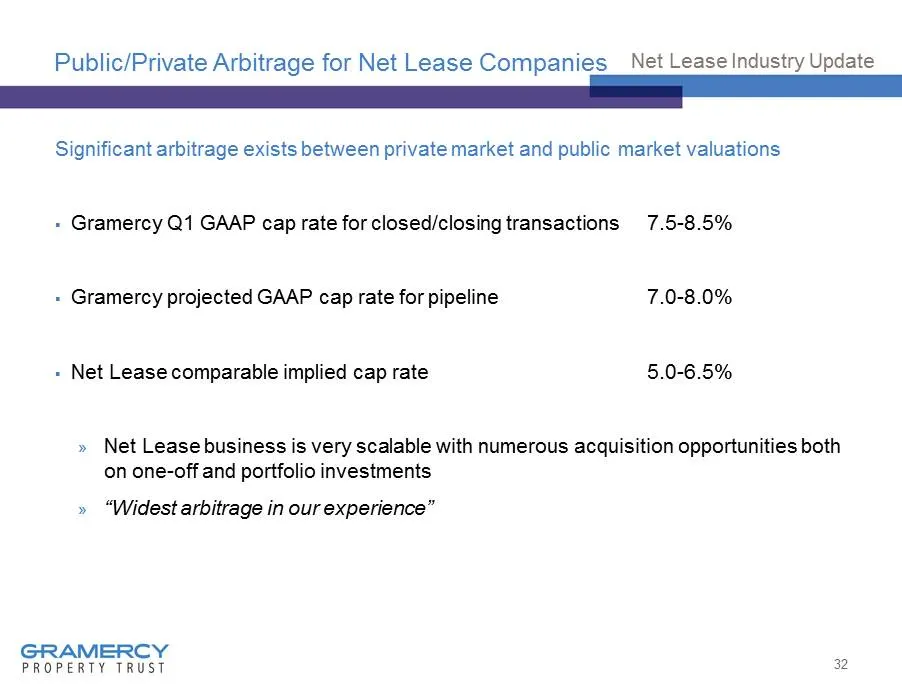
Slide 32: Public/Private Arbitrage for Net Lease Companies
Public/Private Arbitrage for Net Lease Companies Significant arbitrage exists between private market and public market valuations ▪ Gramercy Q1 GAAP cap rate for closed/closing transactions 7.5 - 8.5% ▪ Gramercy projected GAAP cap rate for pipeline 7.0 - 8.0% ▪ Net Lease comparable implied cap rate
Slide 33: Capital Markets Review
Capital Markets Review GRAMERCY PROPERTY TRUST |
Slide 34: Top REIT Stocks
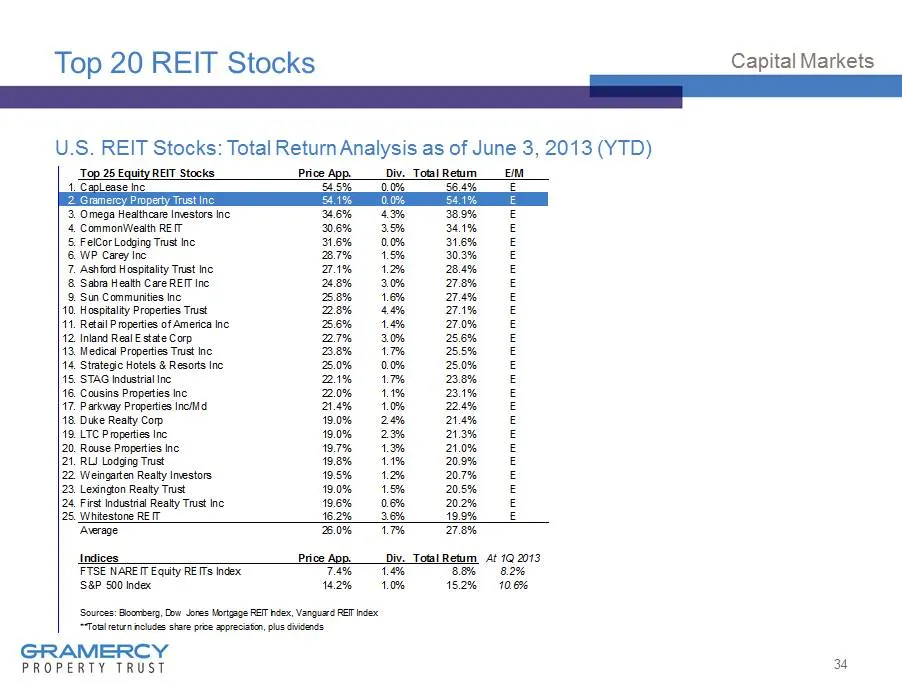
Top 20 REIT Stocks U.S . REIT Stocks: Total Return Analysis as of June 3, 2013 (YTD) 34 Capital Markets Top 25 Equity REIT Stocks Price App. Div. Total Return E/M 1.CapLease Inc 54.5% 0.0% 56.4% E 2.Gramercy Property Trust Inc 54.1% 0.0% 54.1% E 3.Omega Healthcare Investors Inc 34.6% 4.3% 38.9% E 4.
Slide 35: Gramercy Access to Capital
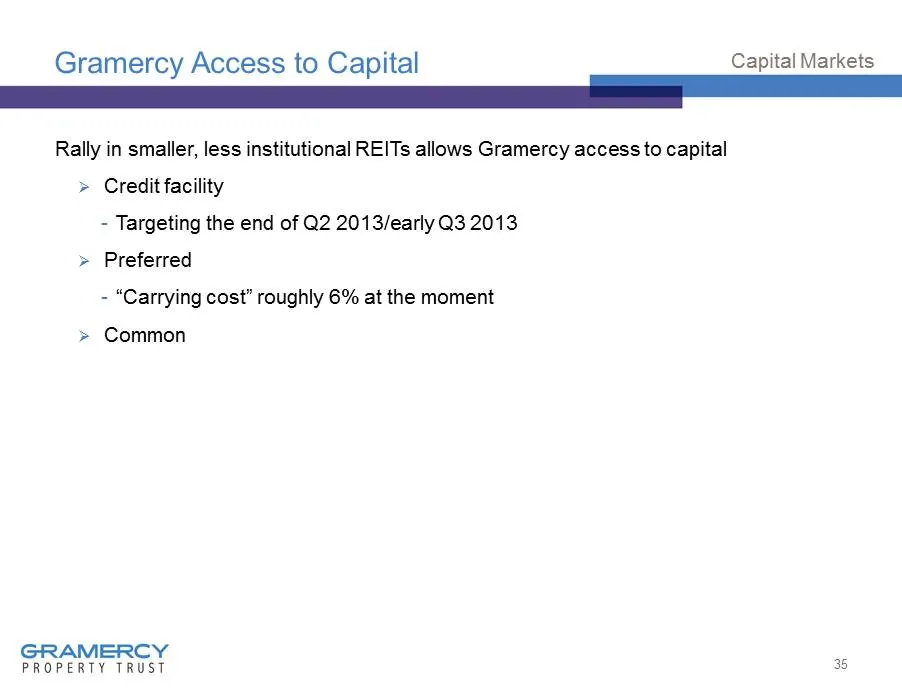
Gramercy Access to Capital Rally in smaller, less institutional REITs allows Gramercy access to capital » Credit facility - Targeting the end of Q2 2013/early Q3 2013 » Preferred - “Carrying cost” roughly 6% at the moment » Common 35 Capital Markets
Slide 36: Goal: Create Durable, Growing Dividends
36 Goal: Create Durable, Growing Dividends
Slide 37: Gramercy - Business Dashboard
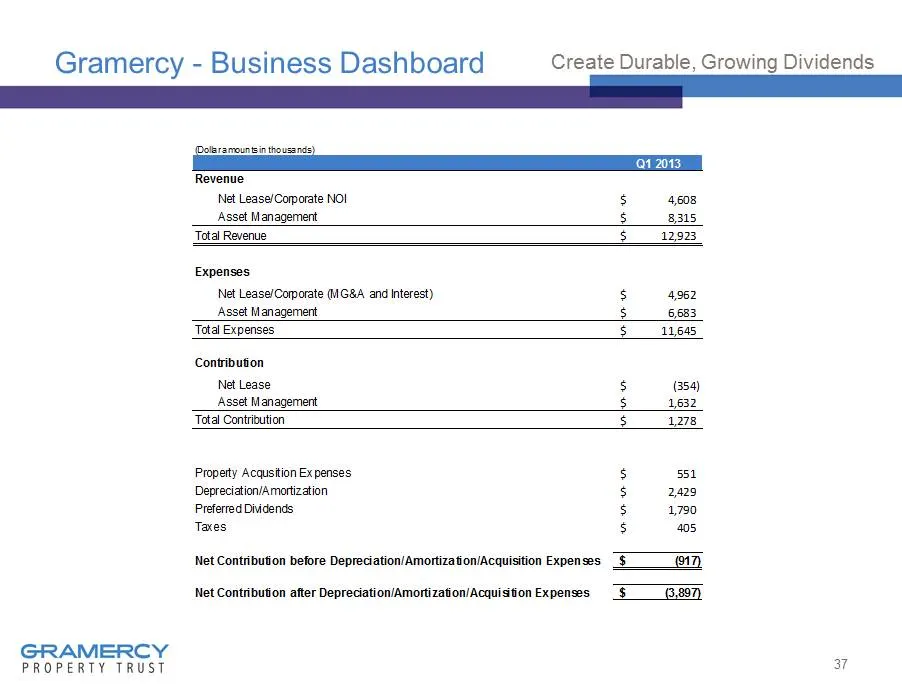
Gramercy - Business Dashboard 37 Create Durable, Growing Dividends (Dollar amounts in thousands) Q1 2013 Revenue Net Lease/Corporate NOI 4,608$ Asset Management 8,315$ Total Revenue 12,923$ Expenses Net Lease/Corporate (MG&A and Interest) 4,962$ Asset Management 6,683$ Total Expenses 11,645$ Contrib
Slide 38: Net Lease Cash Flows
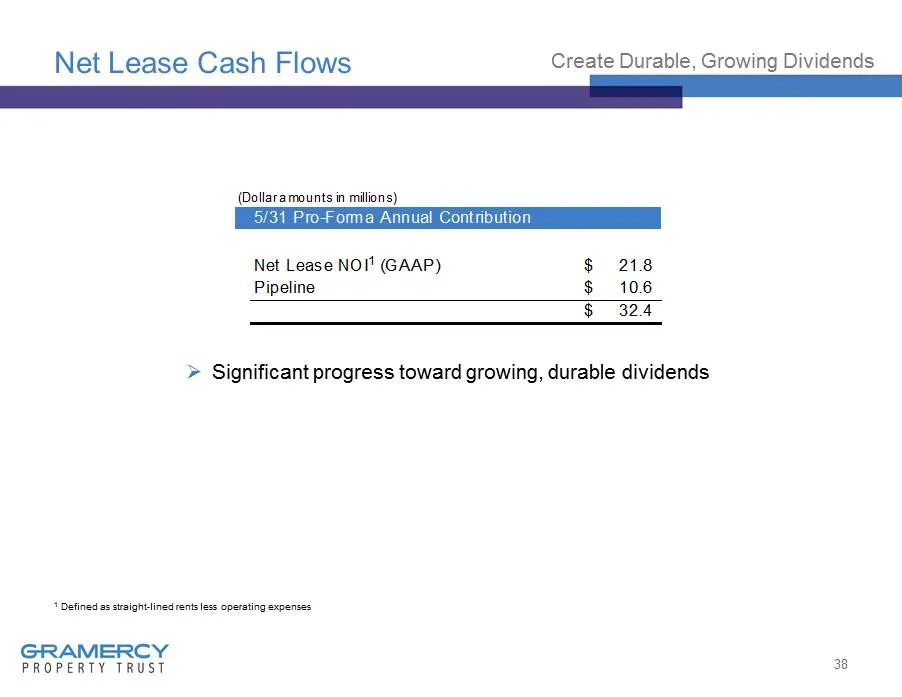
Net Lease Cash Flows » Significant progress toward growing, durable dividends 38 Create Durable, Growing Dividends 1 Defined as straight - lined rents less operating expenses (Dollar amounts in millions) 5/31 Pro-Forma Annual Contribution Net Lease NOI 1 (GAAP) 21.8$ Pipeline 10.6$ 32.4$
Slide 39: Gramercy Portfolio - Characteristics
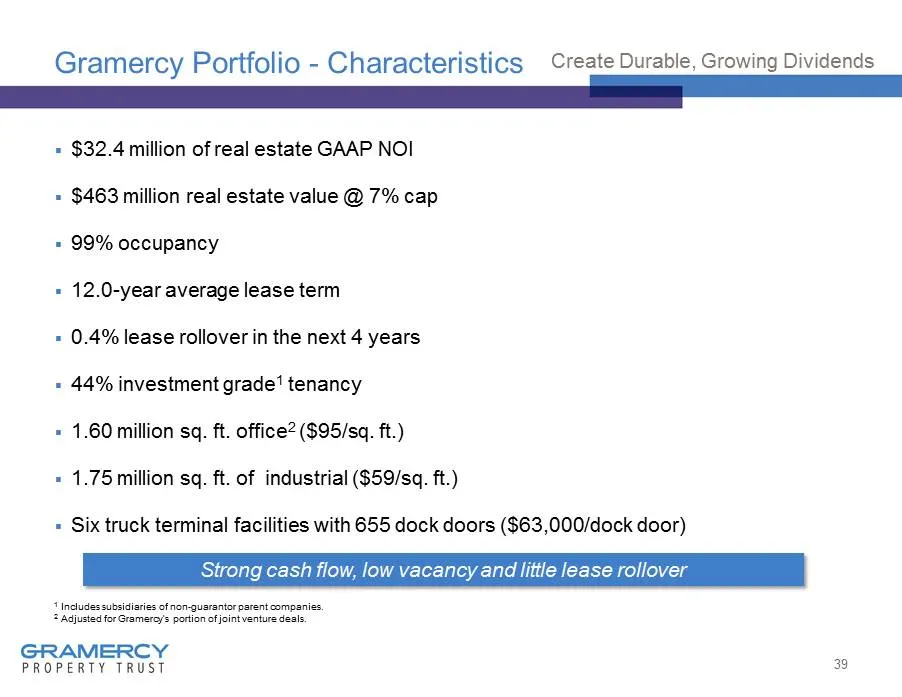
Gramercy Portfolio - Characteristics ▪ $32.4 million of real estate GAAP NOI ▪ $463 million real estate value @ 7% cap ▪ 99% occupancy ▪ 12.0 - year average lease term ▪ 0.4% lease rollover in the next 4 years ▪ 44% investment grade 1 tenancy ▪ 1.60 million sq. ft. office 2 ($95/sq. ft.) ▪ 1.75 mill
Slide 40: Gramercy Acquisition Capacity
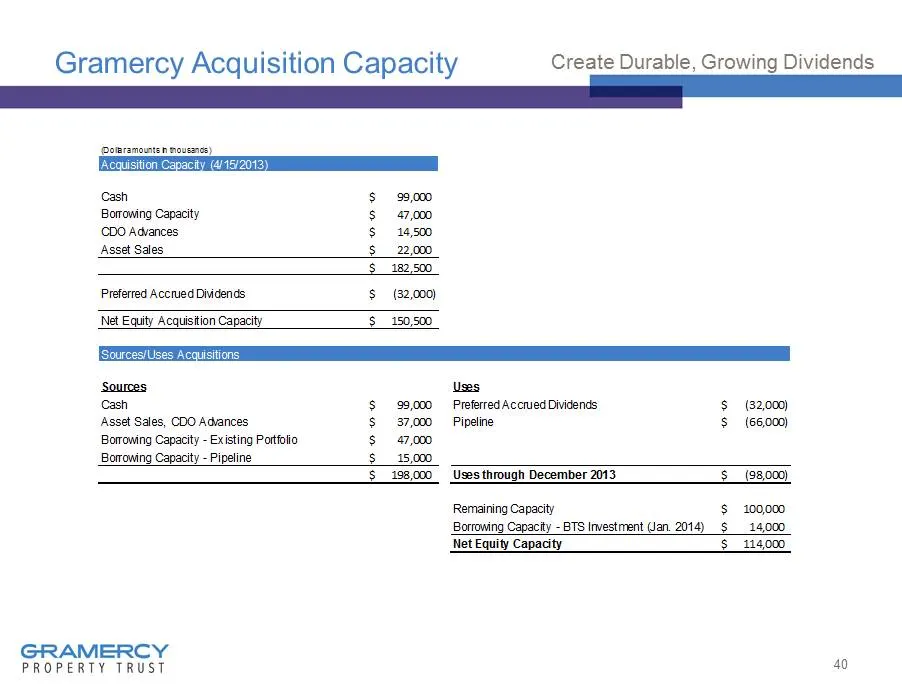
Gramercy Acquisition Capacity 40 Create Durable, Growing Dividends (Dollar amounts in thousands) Acquisition Capacity (4/15/2013) Cash 99,000$ Borrowing Capacity 47,000$ CDO Advances 14,500$ Asset Sales 22,000$ 182,500$ Preferred Accrued Dividends (32,000)$ Net Equity Acquisition Capacity 150,500$ S
Source: SEC EDGAR · 8-K filed Jun 5, 2013
More decks from Gramercy Property Trust
 Merger or Acquisition (September 2015)44 slides · Sep 9, 2015
 Investor Presentation (October 2013)39 slides · Oct 7, 2013
 Q2 2013 Earnings Presentation18 slides · Aug 7, 2013
 Investor Presentation (August 2013)36 slides · Aug 6, 2013
 Investor Presentation (July 2013)37 slides · Jul 16, 2013
 Shareholder Meeting (June 2013)35 slides · Jun 25, 2013