Gramercy Property Trust — Investor Presentation (July 2013)
37 slides from Gramercy Property Trust's investor presentation, Jul 16, 2013
Slide 1: Investor Update July 2013
Investor Update July 2013
Slide 2: Forward-Looking Information/NOI and Cap Rate Disclaimers
Forward - Looking Information/NOI and Cap Rate Disclaimers Cautionary Note Regarding Forward - Looking Information This investment presentation contains "forward - looking statements" based upon the Company's current best judgment and expectations . You can identify forward - looking statements by t
Slide 3: Business Plan 2013-2015
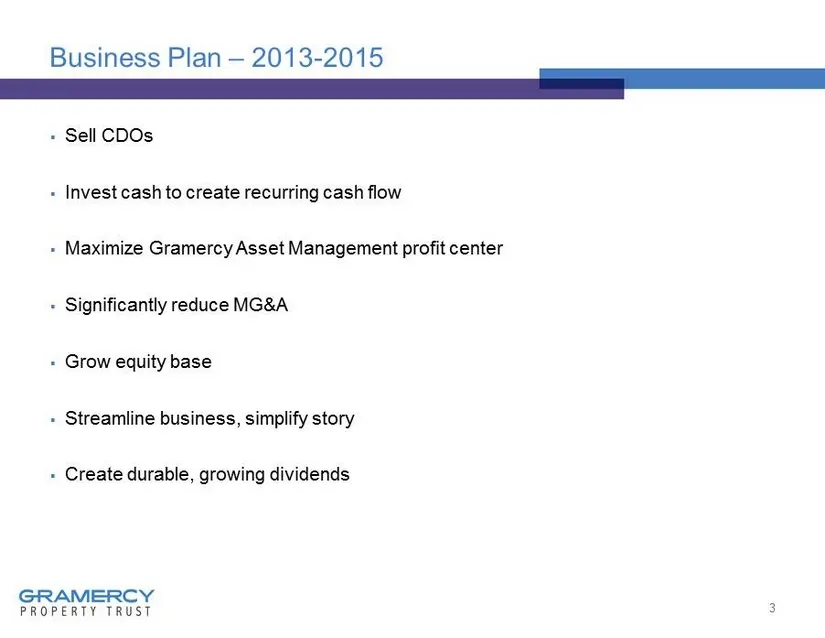
Business Plan – 2013 - 2015 ▪ Sell CDOs ▪ Invest cash to create recurring cash flow ▪ Maximize Gramercy Asset Management profit center ▪ Significantly reduce MG&A ▪ Grow equity base ▪ Streamline business, simplify story ▪ Create durable, growing dividends 3
Slide 4: Gramercy Property Trust
Gramercy Property Trust ▪ March 2013 – CDOs sold ▪ April 15, 2013 • Changed name to reflect business as pure play equity REIT • Changed NYSE ticker to “GPT” from “GKK” 4
Slide 5: Investment Update
Investment Update see __ ee GRAMERCY PROPERTY TRUST §
Slide 6: Target Markets
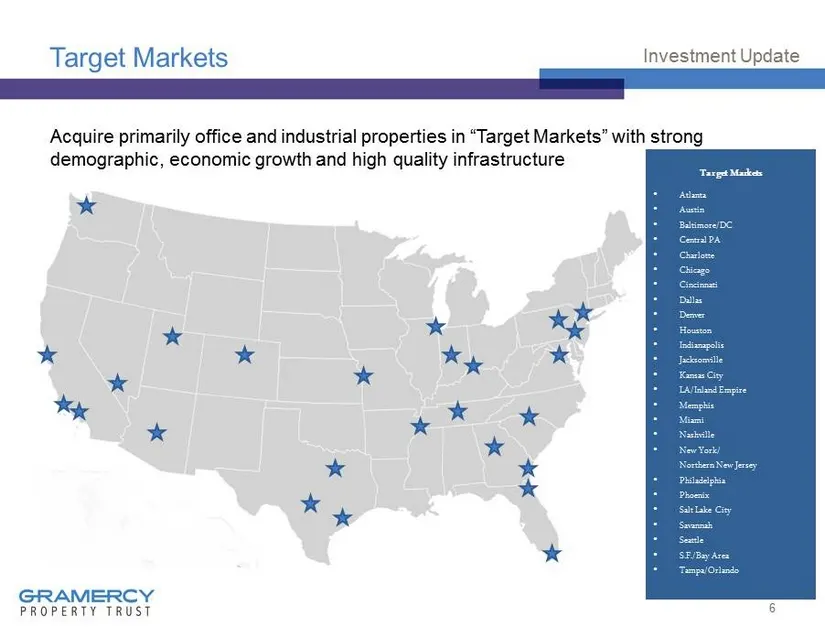
Target Markets Acquire primarily office and industrial properties in “Target Markets” with strong demographic, economic growth and high quality infrastructure 6 Investment Update Target Markets • Atlanta • Austin • Baltimore/DC • Central PA • Charlotte • Chicago • Cincinnati • Dallas • Denver • Hous
Slide 7: Gramercy Transaction Capability
Gramercy Transaction Capability Capability » Invested in 132 properties 1 since new management team began in July 2012 » Sold 93 properties totaling $408 million in 2012 2 Experience » 20+ years average real estate experience among top executives » Led by Gordon DuGan – 25 years of experience Former
Slide 8: Gramercy Disciplined Underwriting
Gramercy Disciplined Underwriting » Reviewed > $5 billion » Activity > $2 billion, >100 transactions » Closed * - 16 transactions, 132 properties » > 50% of investment volume was sourced “off - market” 8 Investment Update * Closed Q4 2012 through present.
Slide 9: Bank of America Portfolio – Core
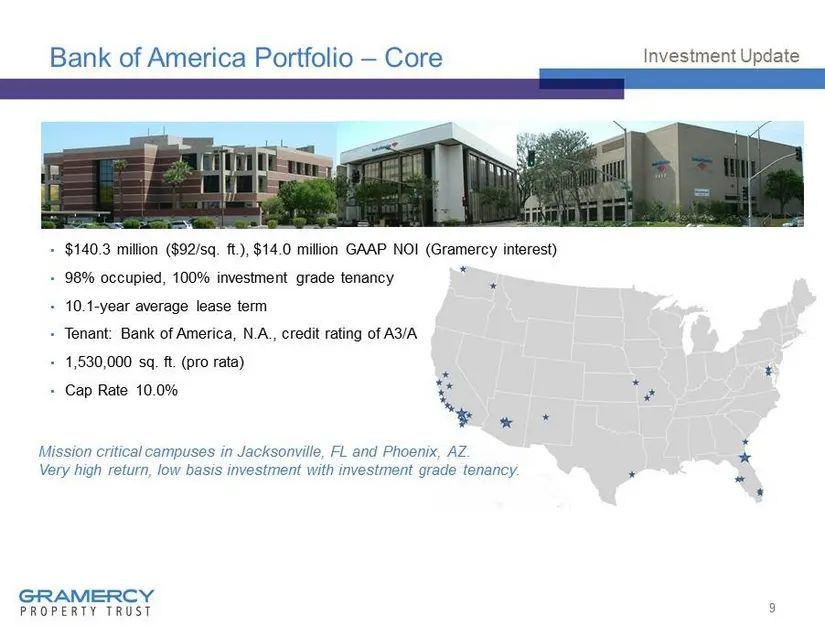
Bank of America Portfolio – Core ▪ $140.3 million ($92/sq. ft.), $14.0 million GAAP NOI (Gramercy interest) ▪ 98% occupied, 100% investment grade tenancy ▪ 10.1 - year average lease term ▪ Tenant: Bank of America, N.A., credit rating of A 3/A ▪ 1,530,000 sq. ft. (pro rata) ▪ Cap Rate 10.0% 9 Investm
Slide 10: Indianapolis Industrial Portfolio
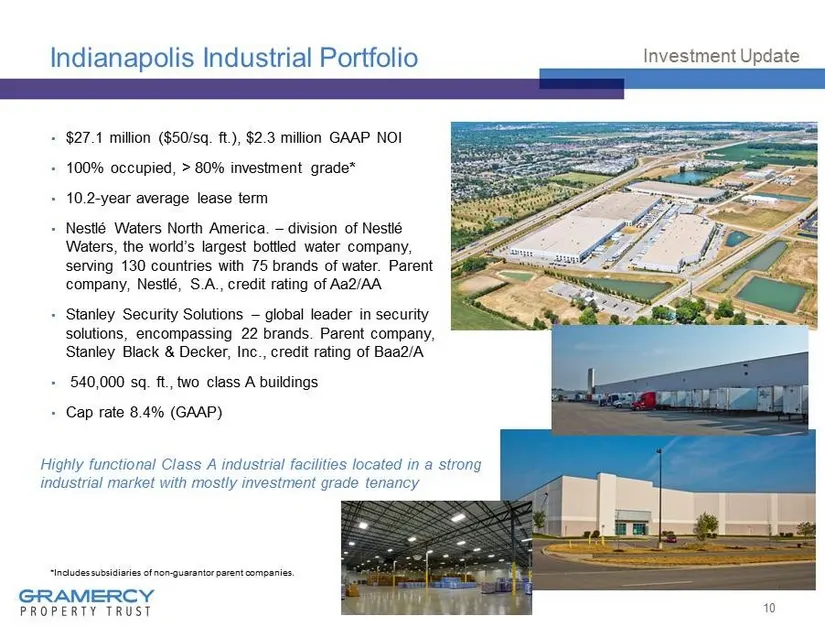
Indianapolis Industrial Portfolio ▪ $27.1 million ($50/sq. ft.), $2.3 million GAAP NOI ▪ 100 % occupied, > 80% investment grade * ▪ 10.2 - year average lease term ▪ Nestlé Waters North America. – division of Nestlé Waters, the world’s largest bottled water company, serving 130 countries with 75 bran
Slide 11: Five Below – Olive Branch, MS
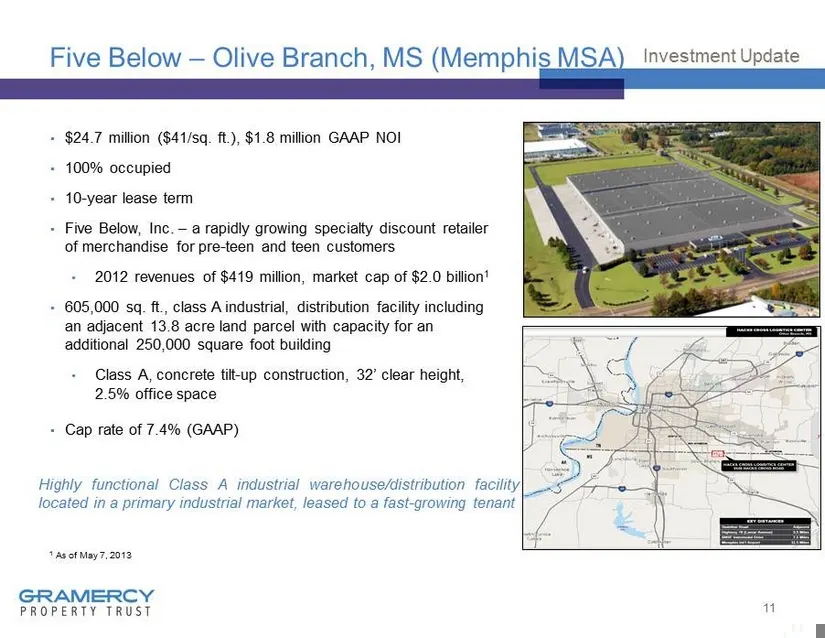
Five Below – Olive Branch, MS (Memphis MSA) ▪ $24.7 million ($ 41/sq . ft .), $1.8 million GAAP NOI ▪ 100 % occupied ▪ 10 - year lease term ▪ Five Below, Inc. – a rapidly growing specialty discount retailer of merchandise for pre - teen and teen customers • 2012 revenues of $419 million, market cap
Slide 12: Apex Tool – Garland, TX
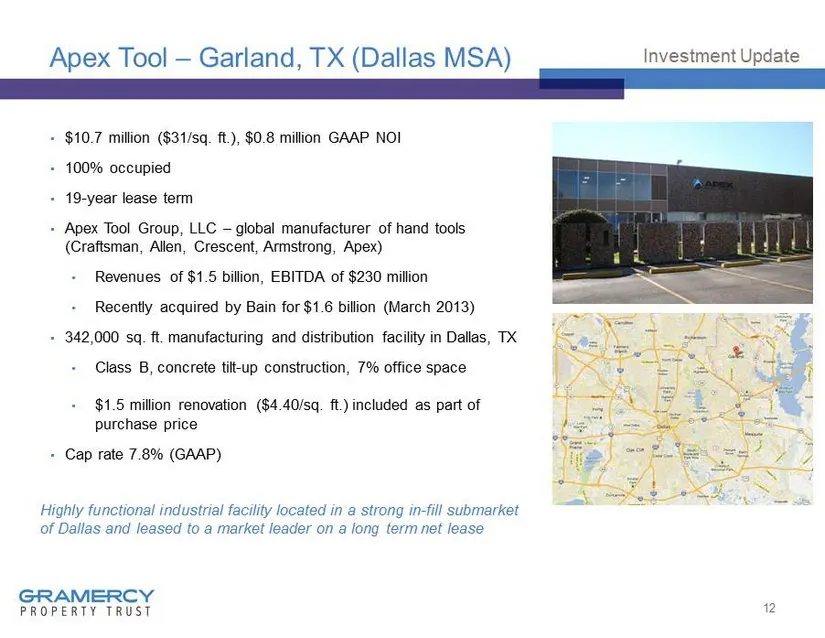
Apex Tool – Garland, TX (Dallas MSA) ▪ $10.7 million ($31/sq. ft.), $0.8 million GAAP NOI ▪ 100% occupied ▪ 19 - year lease term ▪ Apex Tool Group, LLC – global manufacturer of hand tools (Craftsman, Allen, Crescent, Armstrong, Apex) • Revenues of $1.5 billion, EBITDA of $230 million • Recently acqu
Slide 13: Con-Way Truck Terminal – East Brunswick, NJ
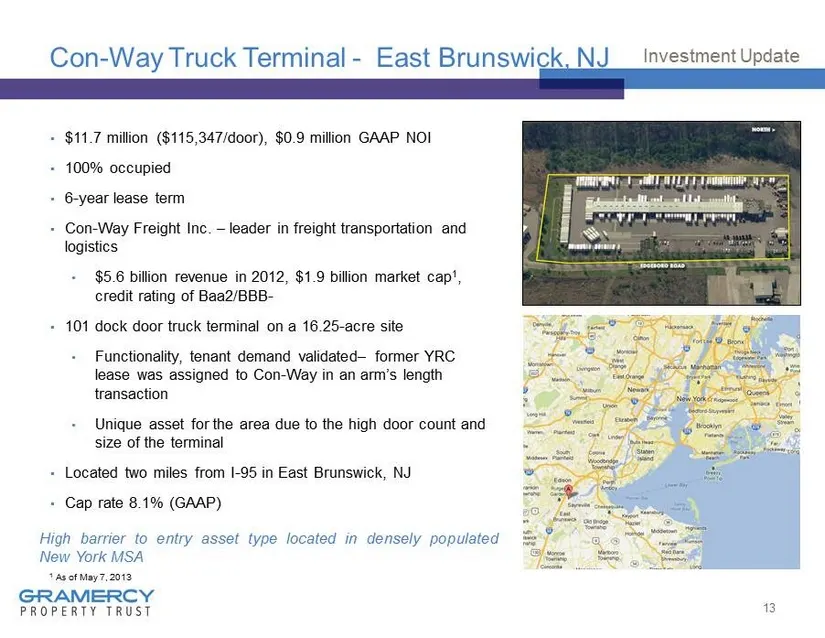
Con - Way Truck Terminal - East Brunswick, NJ ▪ $11.7 million ($115,347/door), $0.9 million GAAP NOI ▪ 100% occupied ▪ 6 - year lease term ▪ Con - Way Freight Inc. – leader in freight transportation and logistics • $5.6 billion revenue in 2012, $1.9 billion market cap 1 , credit rating of Baa2/BBB -
Slide 14: FedEx Freight – Atlanta, GA
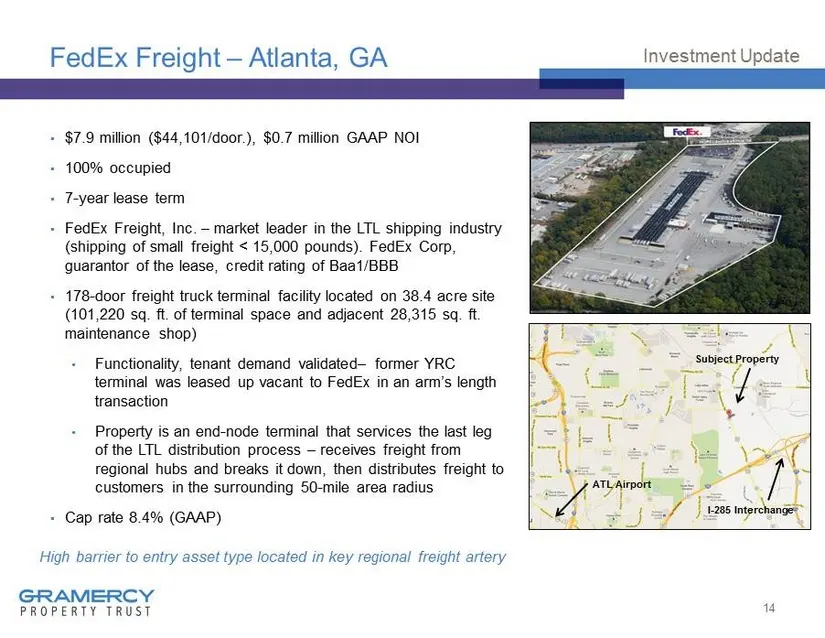
FedEx Freight – Atlanta, GA ▪ $7.9 million ($44,101/door.), $0.7 million GAAP NOI ▪ 100% occupied ▪ 7 - year lease term ▪ FedEx Freight, Inc. – market leader in the LTL shipping industry (shipping of small freight < 15,000 pounds). FedEx Corp, guarantor of the lease, credit rating of Baa1/BBB ▪ 178
Slide 15: FedEx Corp. – Bellmawr, NJ
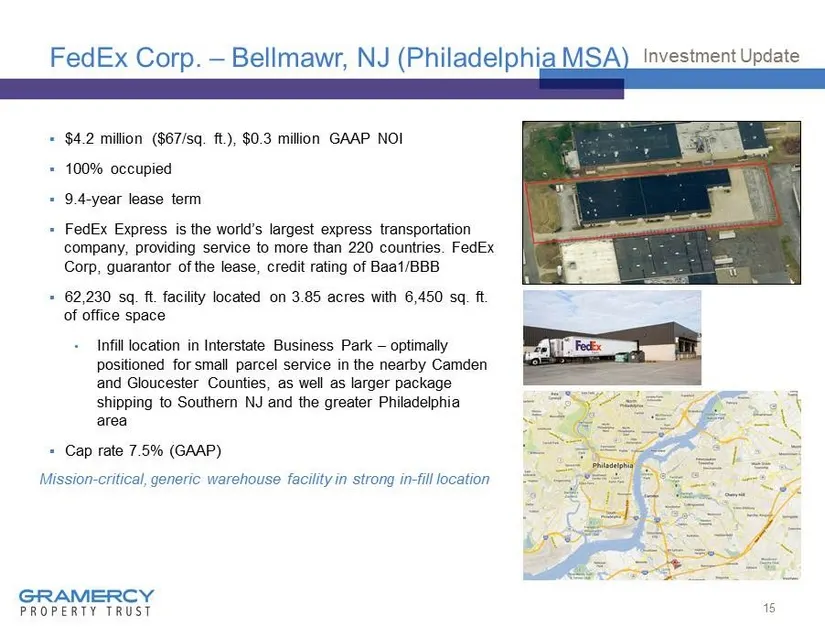
FedEx Corp. – Bellmawr, NJ (Philadelphia MSA) 15 Investment Update ▪ $4.2 million ($67/sq. ft.), $0.3 million GAAP NOI ▪ 100 % occupied ▪ 9.4 - year lease term ▪ FedEx Express is the world’s largest express transportation company, providing service to more than 220 countries. FedEx Corp, guarantor o
Slide 16: Preferred Freezer – Hialeah, FL
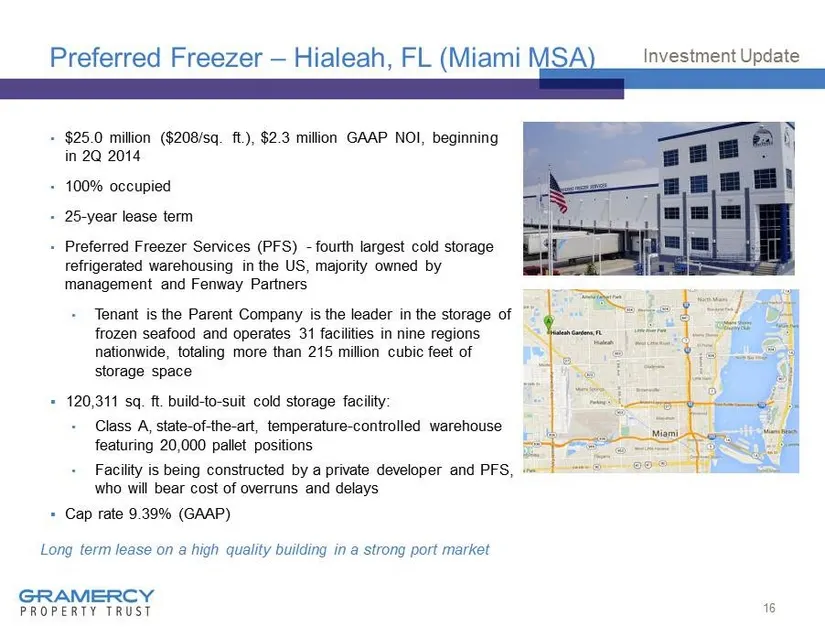
Preferred Freezer – Hialeah, FL (Miami MSA) ▪ $ 25.0 million ($ 208/sq. ft.), $2.3 million GAAP NOI, beginning in 2Q 2014 ▪ 100% occupied ▪ 25 - year lease term ▪ Preferred Freezer Services (PFS) - fourth largest cold storage refrigerated warehousing in the US, majority owned by management and Fenwa
Slide 17: YRC Truck Terminal – Orlando, FL
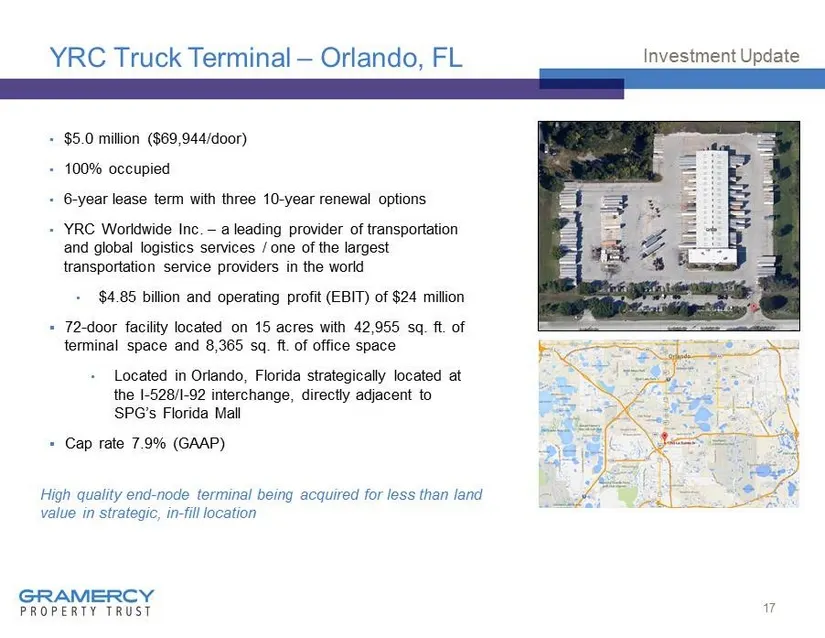
YRC Truck Terminal – Orlando, FL 17 Investment Update ▪ $5.0 million ($ 69,944/door ) ▪ 100% occupied ▪ 6 - year lease term with three 10 - year renewal options ▪ YRC Worldwide Inc. – a leading provider of transportation and global logistics services / one of the largest transportation service provi
Slide 18: YRC Truck Terminal – Houston, TX
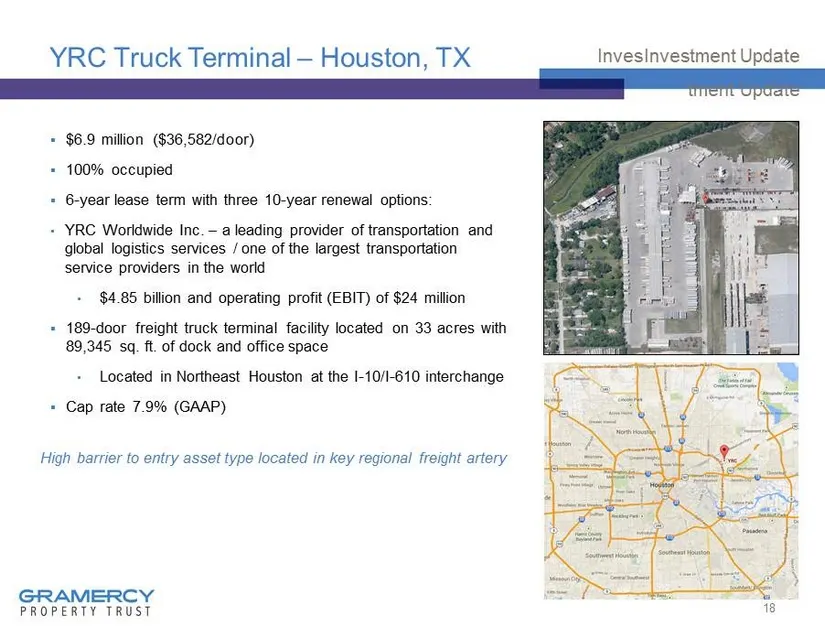
YRC Truck Terminal – Houston, TX 18 Inves Investment Update tment Update ▪ $6.9 million ($36,582/door) ▪ 100 % occupied ▪ 6 - year lease term with three 10 - year renewal options: ▪ YRC Worldwide Inc. – a leading provider of transportation and global logistics services / one of the largest transport
Slide 19: Albert's Organics – Logan Township, NJ
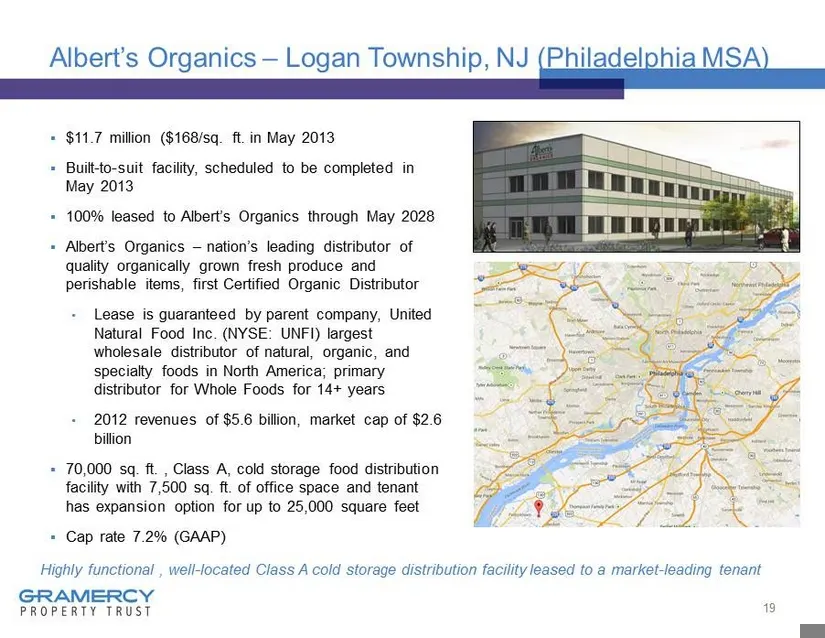
Albert’s Organics – Logan Township, NJ (Philadelphia MSA) ▪ $11.7 million ($168/sq. ft. in May 2013 ▪ Built - to - suit facility, scheduled to be completed in May 2013 ▪ 100 % leased to Albert’s Organics through May 2028 ▪ Albert’s Organics – nation’s leading distributor of quality organically grown
Slide 20: KAR Adesa – Automotive Auction Facility
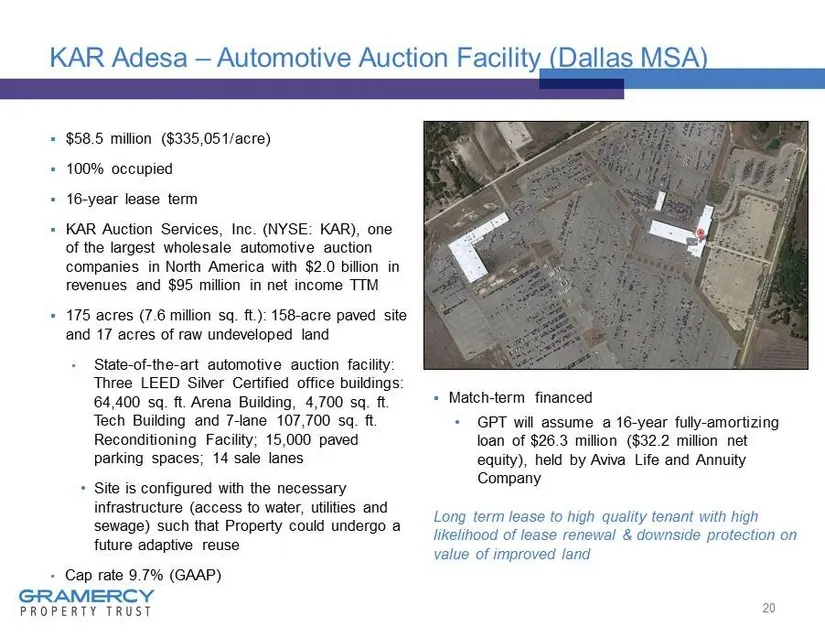
KAR Adesa – Automotive Auction Facility (Dallas MSA) ▪ $ 58.5 million ($ 335,051/acre) ▪ 100% occupied ▪ 16 - year lease term ▪ KAR Auction Services, Inc. (NYSE: KAR), one of the largest wholesale automotive auction companies in North America with $2.0 billion in revenues and $95 million in net inco
Slide 21: Portfolio – Characteristics
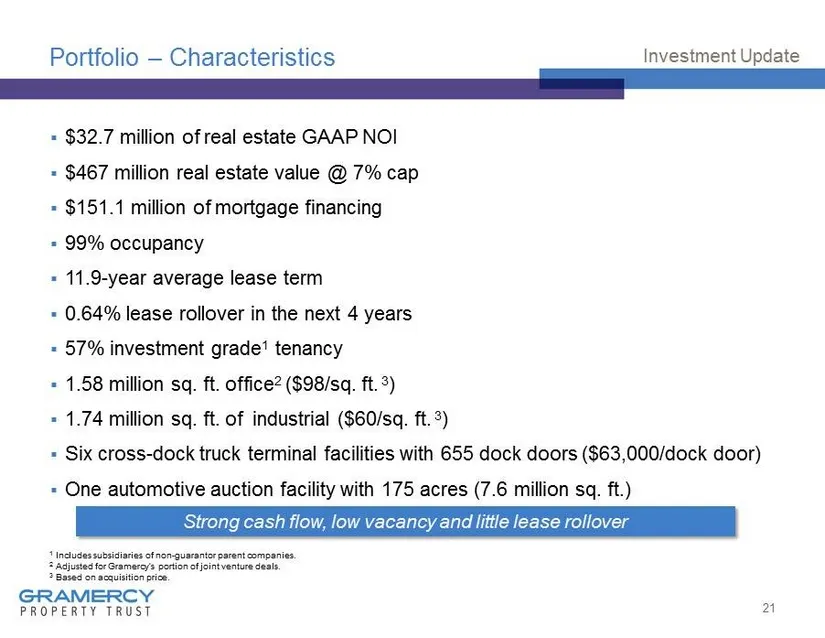
Portfolio – Characteristics ▪ $32.7 million of real estate GAAP NOI ▪ $467 million real estate value @ 7% cap ▪ $151.1 million of mortgage financing ▪ 99% occupancy ▪ 11.9 - year average lease term ▪ 0.64% lease rollover in the next 4 years ▪ 57% investment grade 1 tenancy ▪ 1.58 million sq. ft. off
Slide 22: Investment Activity
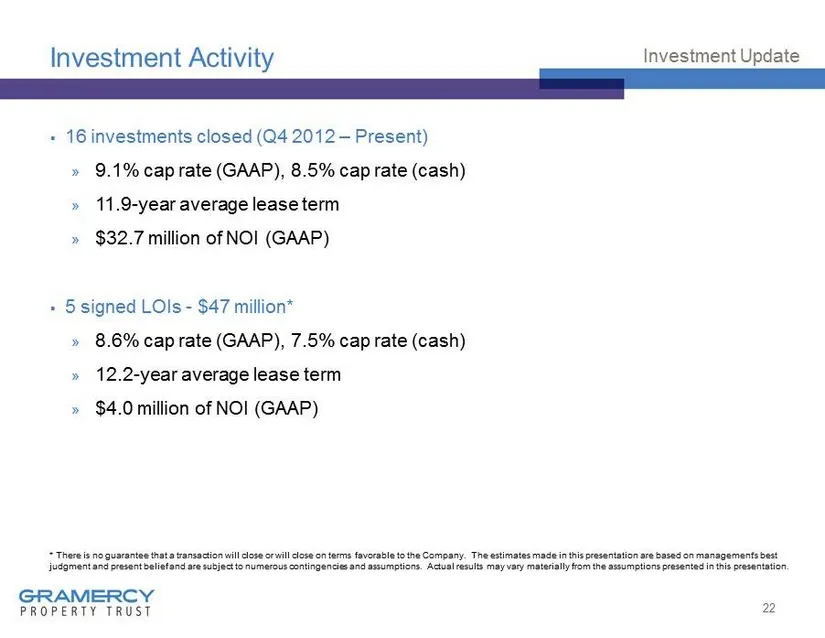
Investment Activity 22 Investment Update ▪ 16 investments closed (Q4 2012 – Present) » 9.1% cap rate (GAAP), 8.5% cap rate (cash) » 11.9 - year average lease term » $32.7 million of NOI (GAAP) ▪ 5 signed LOIs - $47 million* » 8.6% cap rate (GAAP), 7.5% cap rate (cash) » 12.2 - year average lease ter
Slide 23: Maximize Asset Management Profit Center
23 Maximize Asset Management Profit Center
Slide 24: Asset Management
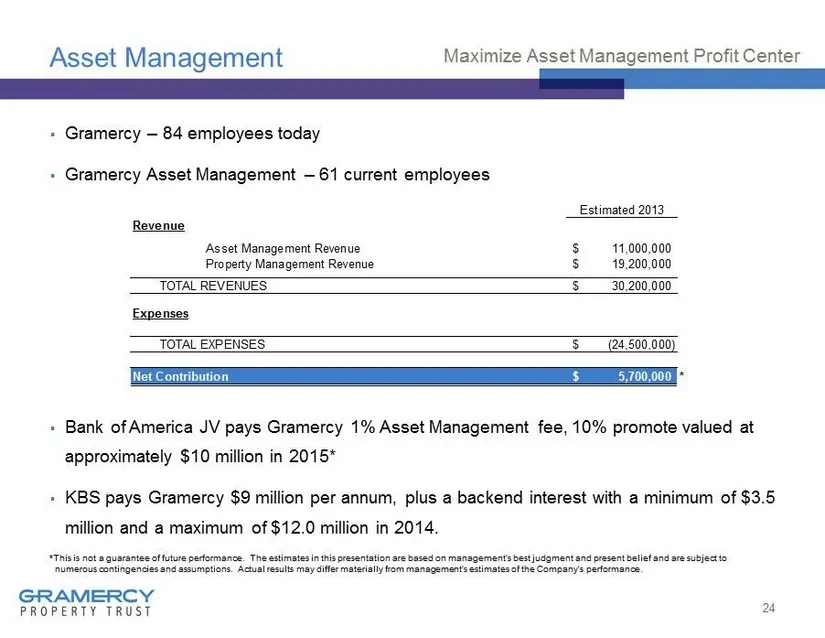
Asset Management ▪ Gramercy – 84 employees today ▪ Gramercy Asset Management – 61 current employees ▪ Bank of America JV pays Gramercy 1% Asset Management fee, 10% promote valued at approximately $10 million in 2015* ▪ KBS pays Gramercy $9 million per annum, plus a backend interest with a minimum of
Slide 25: Asset Management
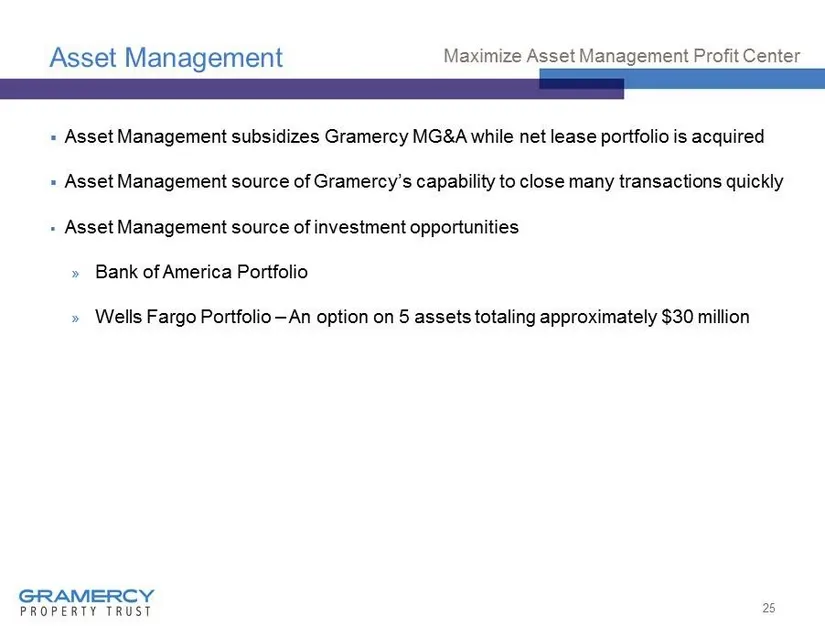
Asset Management ▪ Asset Management subsidizes Gramercy MG&A while net lease portfolio is acquired ▪ Asset Management source of Gramercy’s capability to close many transactions quickly ▪ Asset Management source of investment opportunities » Bank of America Portfolio » Wells Fargo Portfolio – An opti
Slide 26: Significantly Reduce Management, General & Administrative (MG&A)
26 Significantly Reduce Management, General & Administrative (MG&A)
Slide 27: 2013 Bridge: Significantly Reduce MG&A
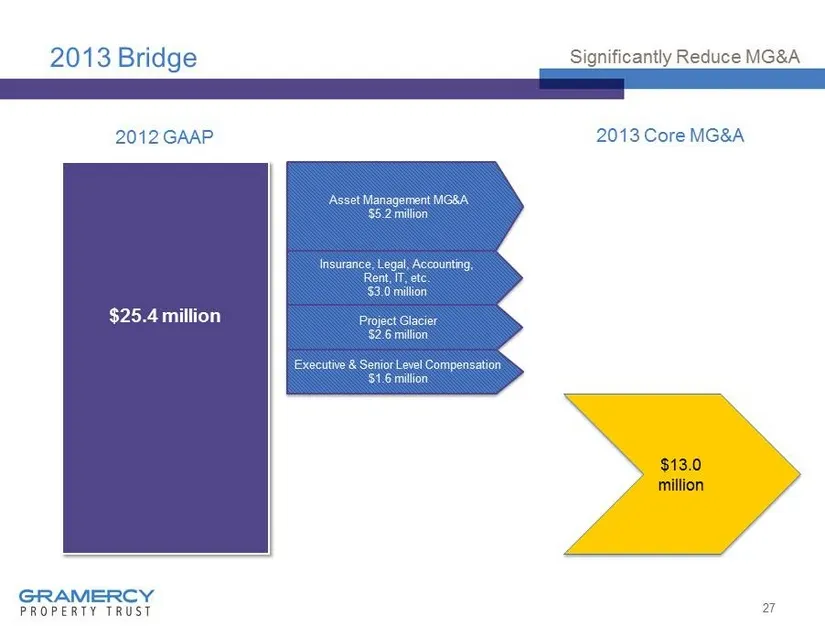
2013 Bridge 27 Significantly Reduce MG&A $25.4 million 2012 GAAP 2013 Core MG&A $13.0 million Asset Management MG&A $5.2 million Insurance, Legal, Accounting, Rent, IT, etc. $3.0 million Project Glacier $2.6 million Executive & Senior Level Compensation $1.6 million
Slide 28: 2014 MG&A
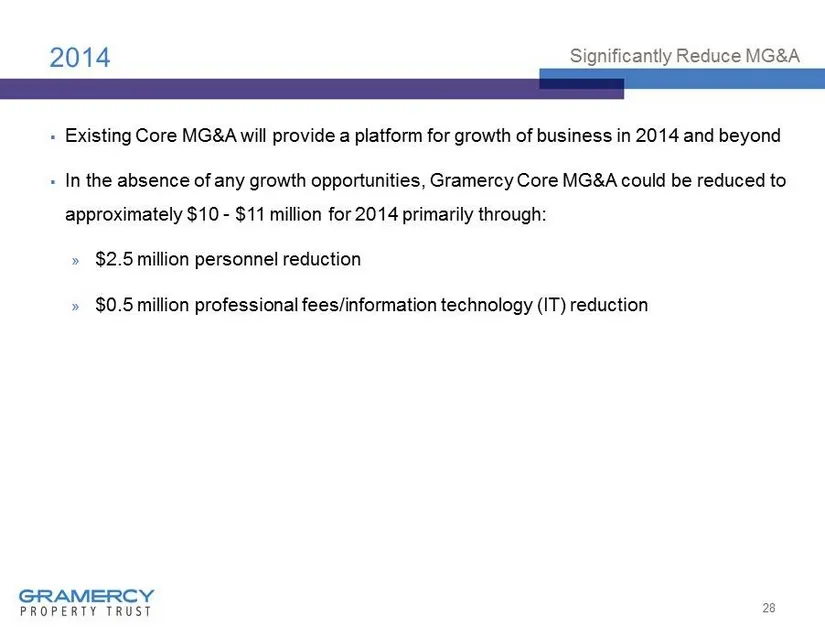
2014 ▪ Existing Core MG&A will provide a platform for growth of business in 2014 and beyond ▪ In the absence of any growth opportunities, Gramercy Core MG&A could be reduced to approximately $10 - $11 million for 2014 primarily through: » $2.5 million personnel reduction » $0.5 million professional
Slide 29: Net Lease Industry Update
Net Lease Industry Update see __ ee GRAMERCY PROPERTY TRUST ai
Slide 30: Net Lease Environment
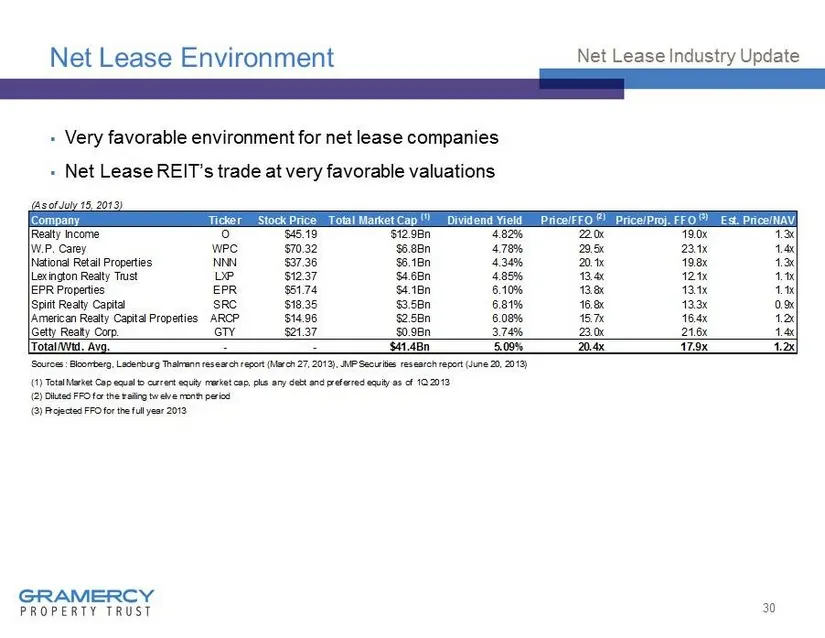
Net Lease Environment ▪ Very favorable environment for net lease companies ▪ Net Lease REIT’s trade at very favorable valuations 30 Net Lease Industry Update (As of July 15, 2013) Company Ticker Stock Price Total Market Cap (1) Dividend Yield Price/FFO (2) Price/Proj. FFO (3) Est. Price/NAV Realty I
Slide 31: Capital Markets Review
Capital Markets Review see __ ee GRAMERCY PROPERTY TRUST a
Slide 32: Top Equity REIT Stocks
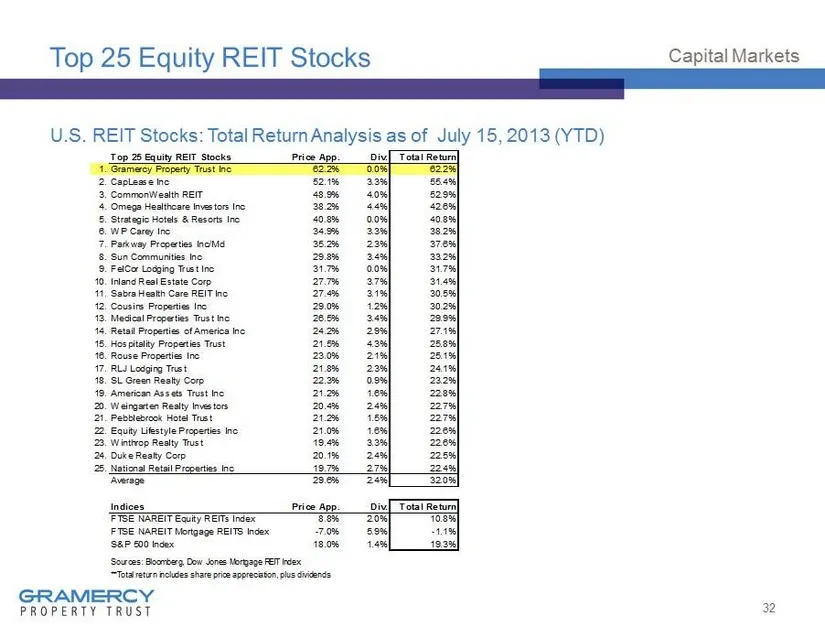
Top 25 Equity REIT Stocks U.S . REIT Stocks: Total Return Analysis as of July 15, 2013 (YTD) 32 Capital Markets Top 25 Equity REIT Stocks Price App. Div. Total Return 1.Gramercy Property Trust Inc 62.2% 0.0% 62.2% 2.CapLease Inc 52.1% 3.3% 55.4% 3.CommonWealth REIT 48.9% 4.0% 52.9% 4.Omega Healthcar
Slide 33: Gramercy Access to Capital
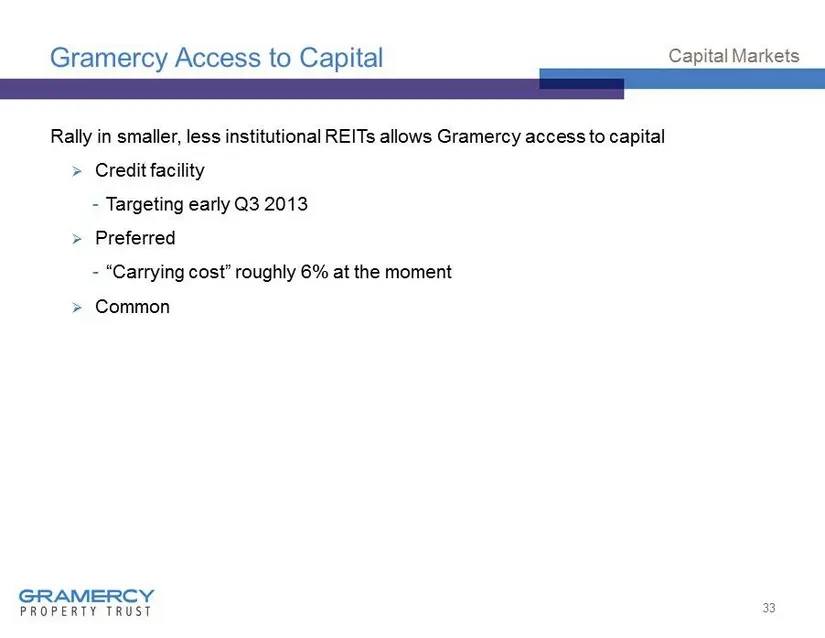
Gramercy Access to Capital Rally in smaller, less institutional REITs allows Gramercy access to capital » Credit facility - Targeting early Q3 2013 » Preferred - “Carrying cost” roughly 6% at the moment » Common 33 Capital Markets
Slide 34: Goal: Create Durable, Growing Dividends
34 Goal: Create Durable, Growing Dividends
Slide 35: Gramercy Business Dashboard
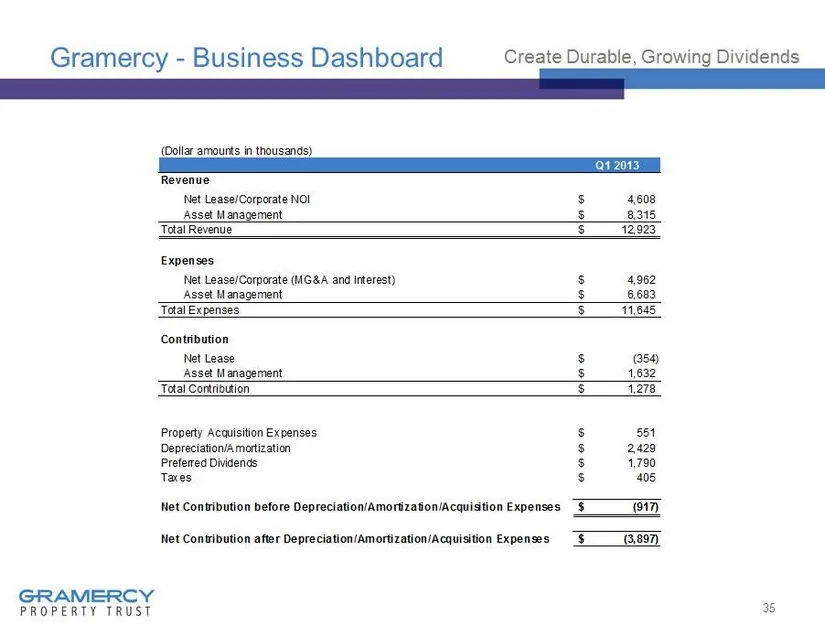
Gramercy - Business Dashboard 35 Create Durable, Growing Dividends (Dollar amounts in thousands) Q1 2013 Revenue Net Lease/Corporate NOI 4,608$ Asset Management 8,315$ Total Revenue 12,923$ Expenses Net Lease/Corporate (MG&A and Interest) 4,962$ Asset Management 6,683$ Total Expenses 11,645$ Contrib
Slide 36: Net Lease Cash Flows
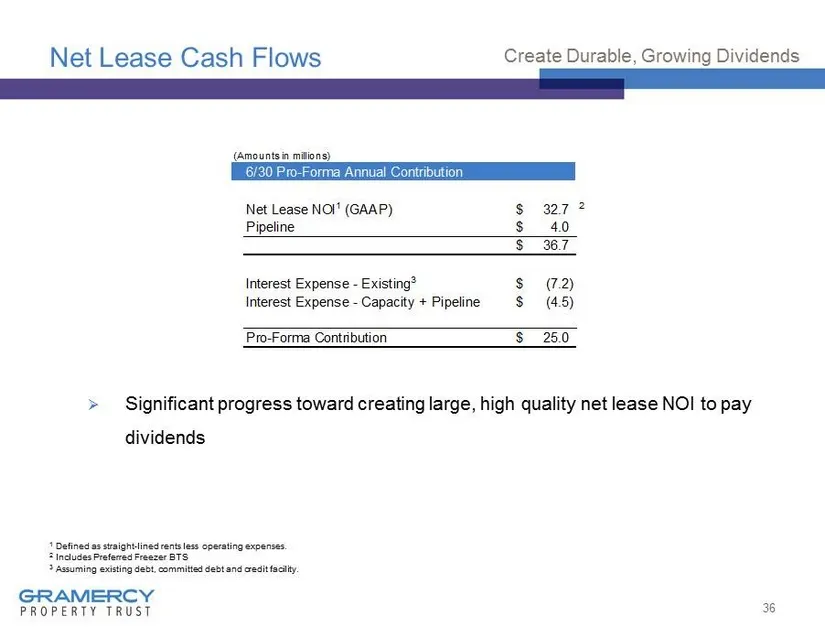
Net Lease Cash Flows » Significant progress toward creating large, high quality net lease NOI to pay dividends 36 Create Durable, Growing Dividends 1 Defined as straight - lined rents less operating expenses. 2 Includes Preferred Freezer BTS 3 Assuming existing debt, committed debt and credit facili
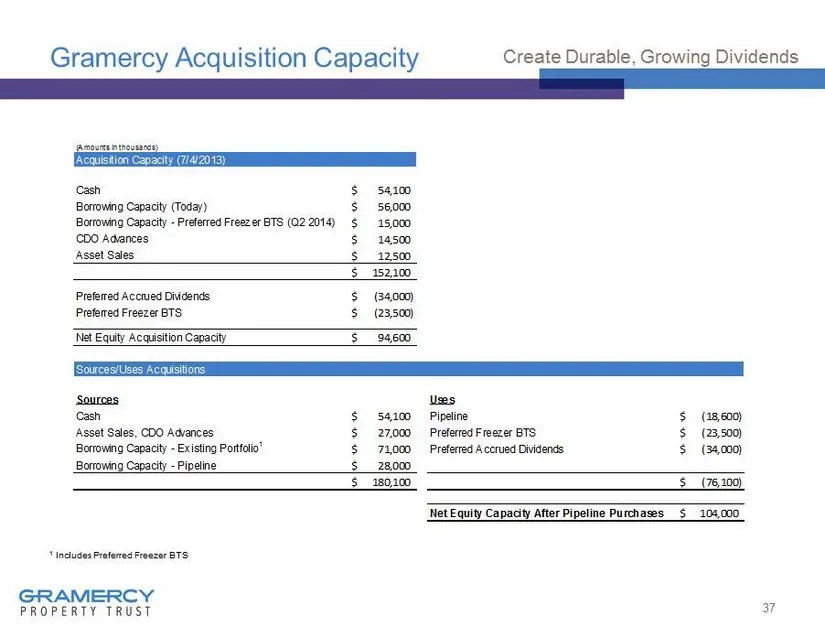
Slide 37: Gramercy Acquisition Capacity
Gramercy Acquisition Capacity 37 Create Durable, Growing Dividends 1 Includes Preferred Freezer BTS (Amounts in thousands) Acquisition Capacity (7/4/2013) Cash 54,100$ Borrowing Capacity (Today) 56,000$ Borrowing Capacity - Preferred Freezer BTS (Q2 2014) 15,000$ CDO Advances 14,500$ Asset Sales 12,
Source: SEC EDGAR · 8-K filed Jul 16, 2013
More decks from Gramercy Property Trust
 Merger or Acquisition (September 2015)44 slides · Sep 9, 2015
 Investor Presentation (October 2013)39 slides · Oct 7, 2013
 Q2 2013 Earnings Presentation18 slides · Aug 7, 2013
 Investor Presentation (August 2013)36 slides · Aug 6, 2013
 Shareholder Meeting (June 2013)35 slides · Jun 25, 2013
 REITWeek 2013: NAREIT's Investor Forum40 slides · Jun 5, 2013