Andeavor — Tesoro Corp /New/ — JPMorgan High Yield Conference 2014
32 slides from Andeavor's conference presentation, Feb 24, 2014
Slide 1: Transformation through Distinctive Performance
Transformation through Distinctive Performance JPMorgan High Yield Conference February 2014 Scott Spendlove Senior Vice President and CFO, Tesoro Corporation Exhibit 99.1
Slide 2: Forward Looking Statements
2 Forward Looking Statements • This Presentation includes forward-looking statements within the meaning of the Private Securities Litigation Reform Act of 1995. These statements relate to, among other things: – The execution and effects of our strategic priorities, including achieving improvements i
Slide 3: Tesoro Key Metrics
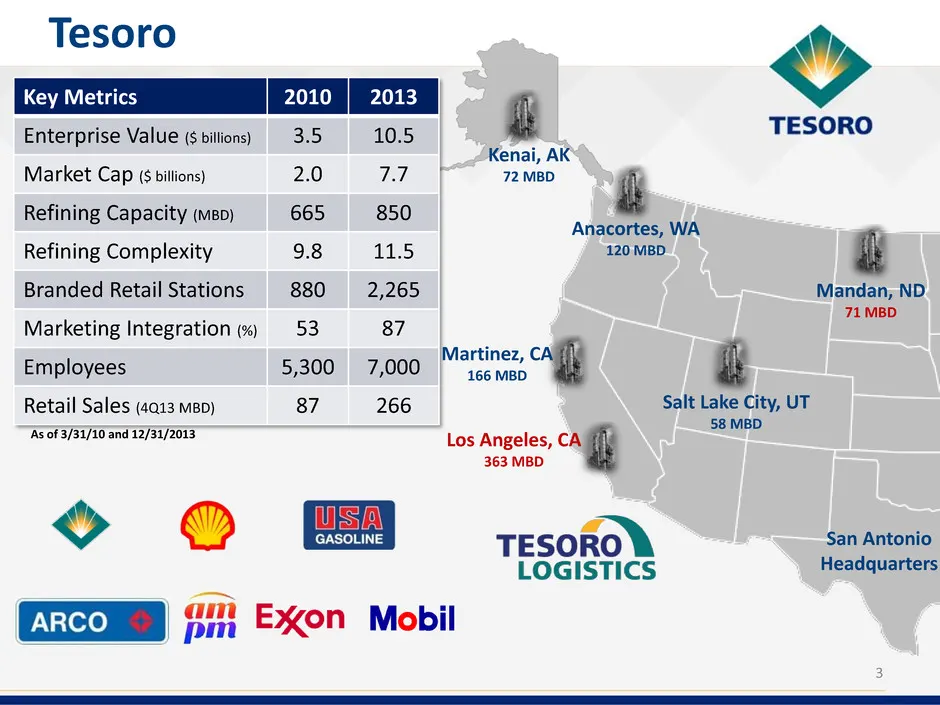
3 Tesoro Los Angeles, CA 363 MBD Key Metrics 2010 2013 Enterprise Value ($ billions) 3.5 10.5 Market Cap ($ billions) 2.0 7.7 Refining Capacity (MBD) 665 850 Refining Complexity 9.8 11.5 Branded Retail Stations 880 2,265 Marketing Integration (%) 53 87 Employees 5,300 7,000 Retail Sales (4Q13 MBD) 8
Slide 4: Tesoro Logistics LP Key Metrics
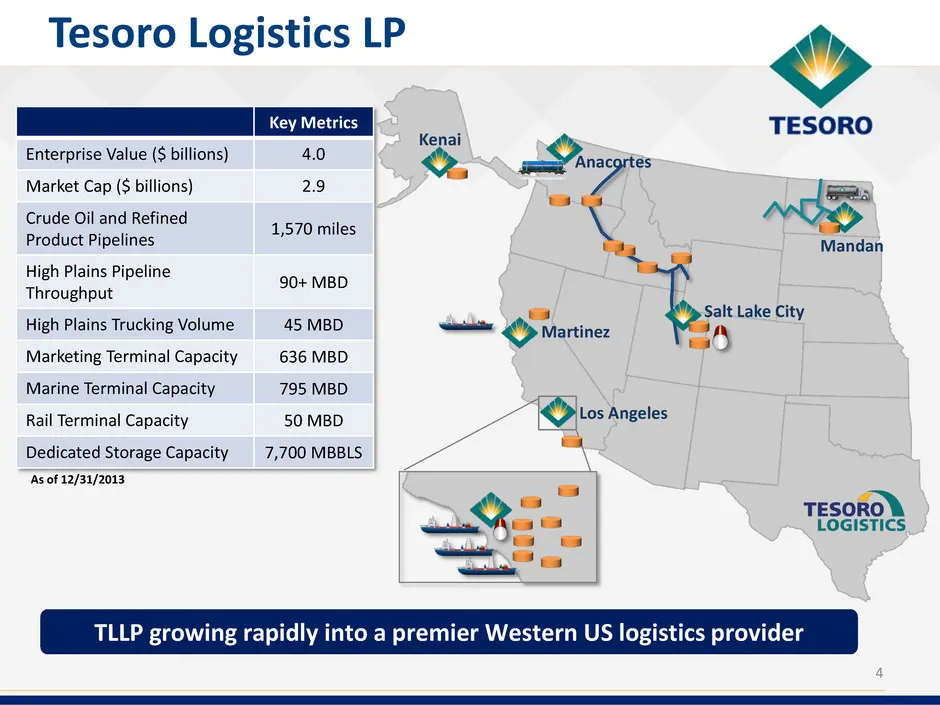
4 Tesoro Logistics LP Key Metrics Enterprise Value ($ billions) 4.0 Market Cap ($ billions) 2.9 Crude Oil and Refined Product Pipelines 1,570 miles High Plains Pipeline Throughput 90+ MBD High Plains Trucking Volume 45 MBD Marketing Terminal Capacity 636 MBD Marine Terminal Capacity 795 MBD Rail Ter
Slide 5: Strategic Priorities
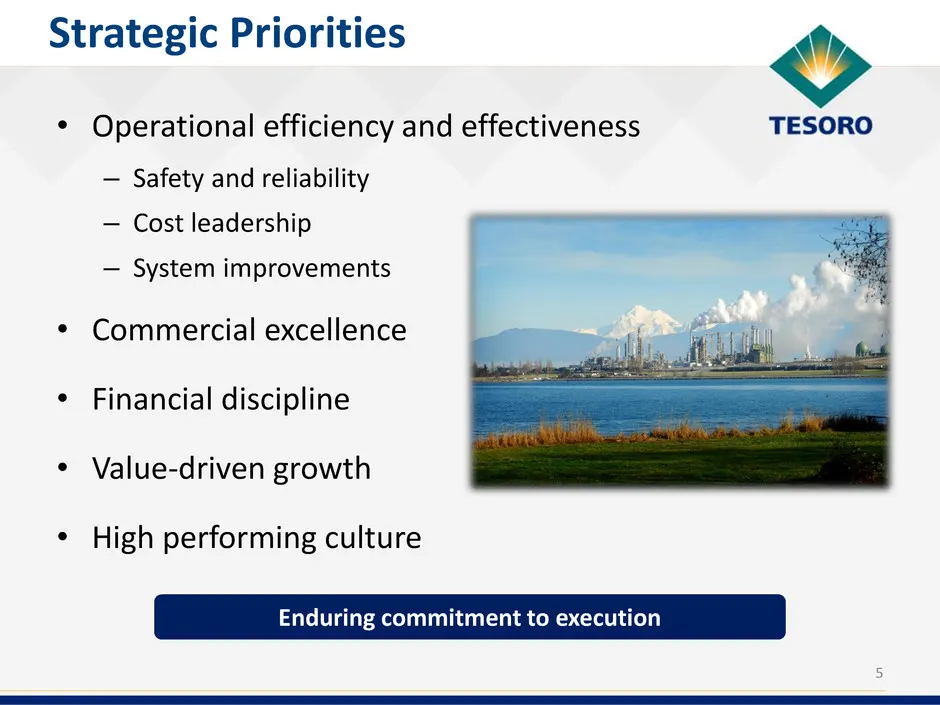
• Operational efficiency and effectiveness – Safety and reliability – Cost leadership – System improvements • Commercial excellence • Financial discipline • Value-driven growth • High performing culture 5 Strategic Priorities Enduring commitment to execution
Slide 6: Execution of Strategic Priorities
Distinctive Performance: 2014 and 2015 • Deliver California synergies • Enhance gross margin • Improve the base • Grow logistics • Maintain financial discipline 6 Execution of Strategic Priorities Targeting $370 to $430 million of EBITDA improvements in 2014
Slide 7: Distinctive Performance Objectives
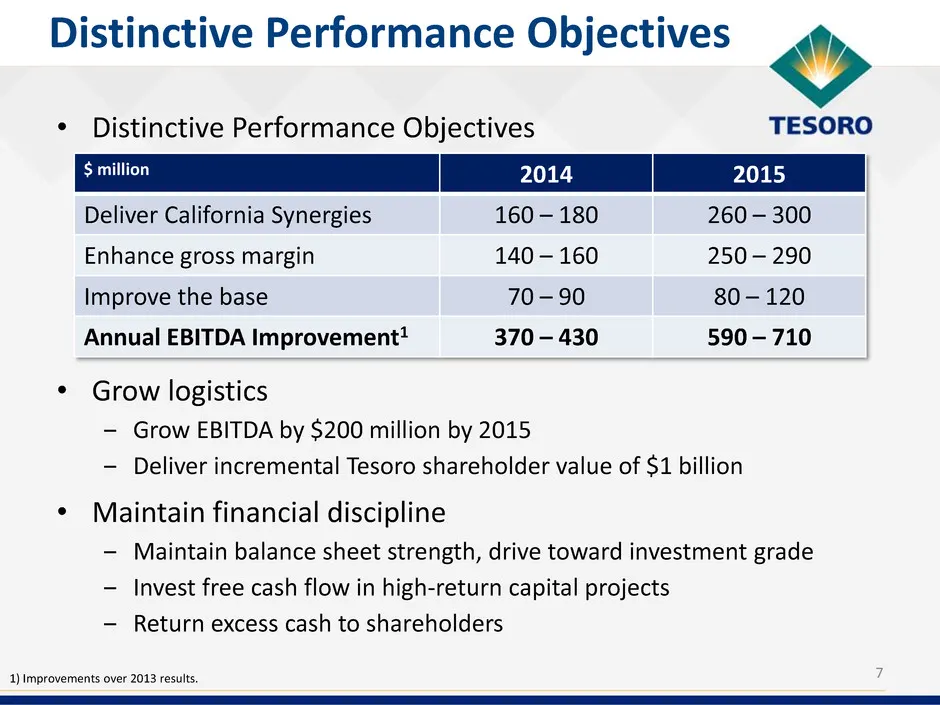
• Distinctive Performance Objectives • Grow logistics ‒ Grow EBITDA by $200 million by 2015 ‒ Deliver incremental Tesoro shareholder value of $1 billion • Maintain financial discipline ‒ Maintain balance sheet strength, drive toward investment grade ‒ Invest free cash flow in high-return capital pro
Slide 8: Keys to Distinction on the West Coast
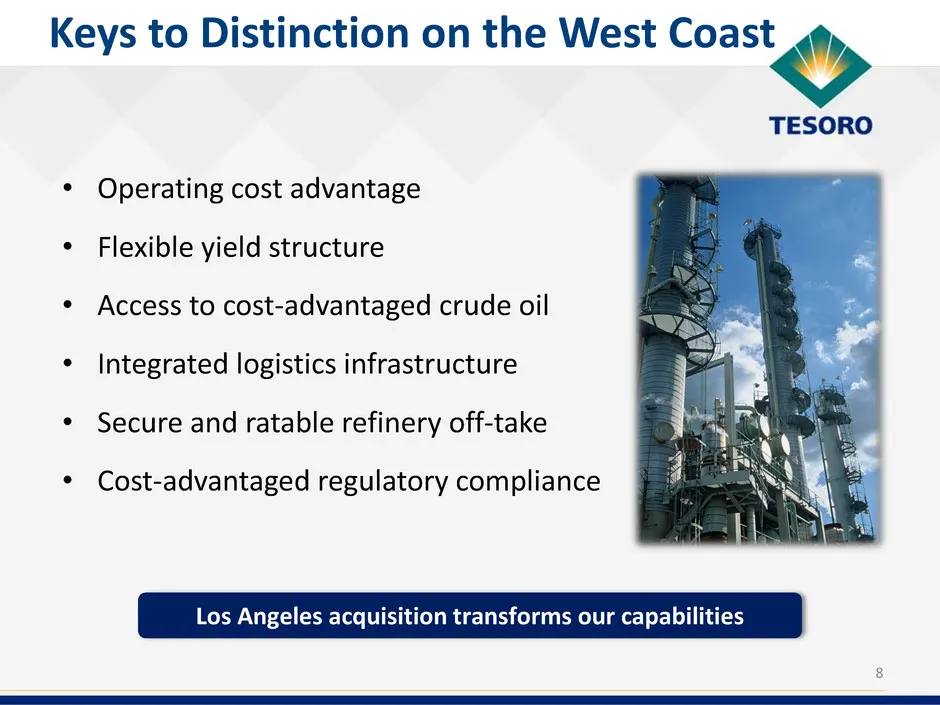
• Operating cost advantage • Flexible yield structure • Access to cost-advantaged crude oil • Integrated logistics infrastructure • Secure and ratable refinery off-take • Cost-advantaged regulatory compliance 8 Keys to Distinction on the West Coast Los Angeles acquisition transforms our capabilities
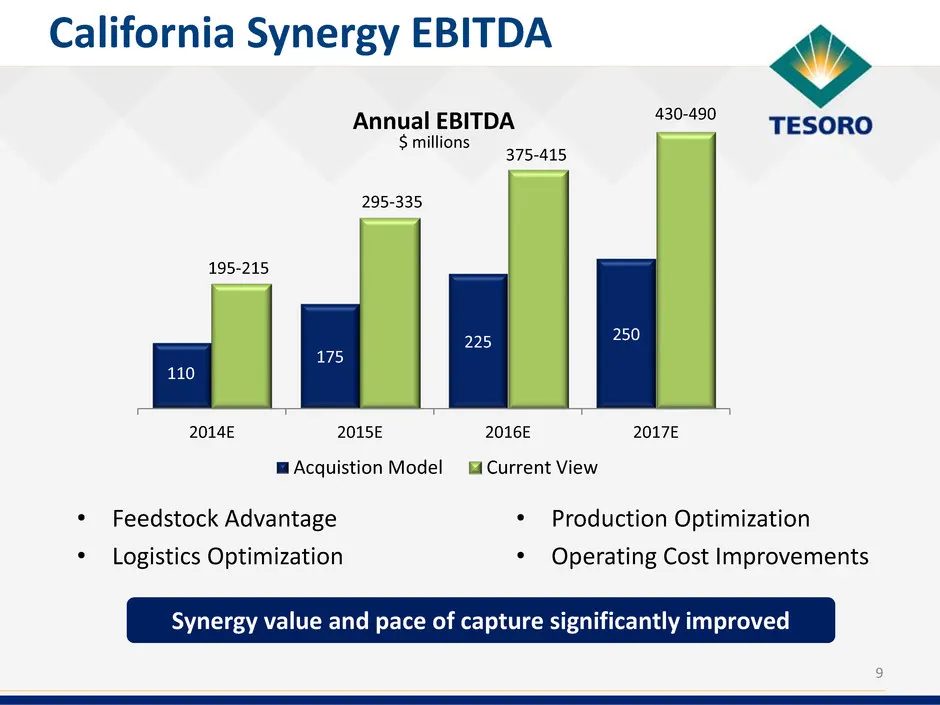
Slide 9: California Synergy EBITDA
California Synergy EBITDA Synergy value and pace of capture significantly improved 110 175 225 250 2014E 2015E 2016E 2017E Annual EBITDA Acquistion Model Current View $ millions 430-490 375-415 295-335 195-215 • Production Optimization • Operating Cost Improvements • Feedstock Advantage • Logistics
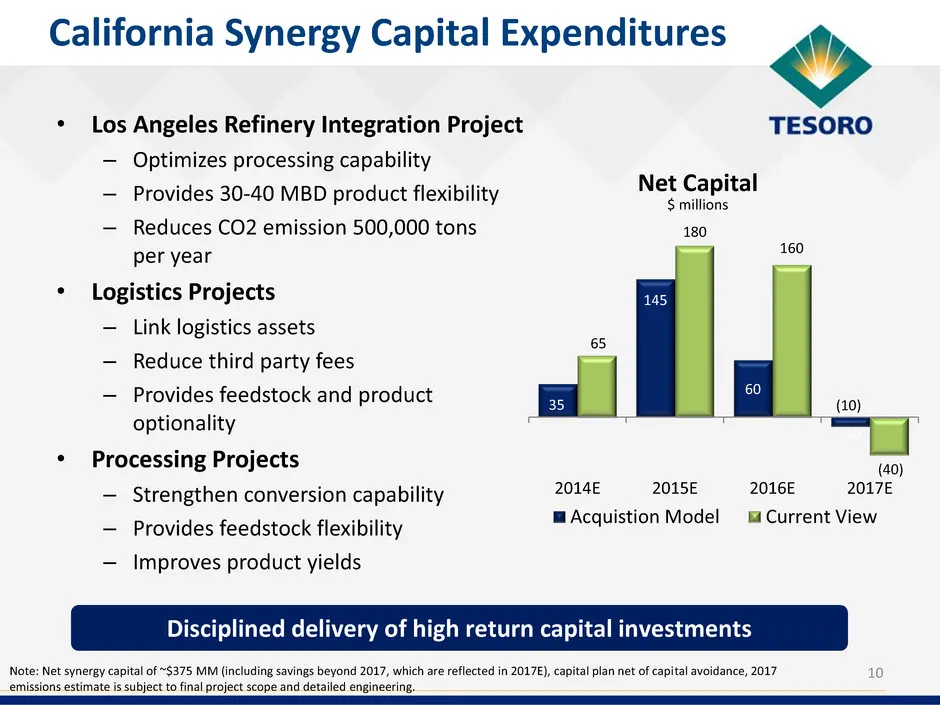
Slide 10: California Synergy Capital Expenditures
Note: Net synergy capital of ~$375 MM (including savings beyond 2017, which are reflected in 2017E), capital plan net of capital avoidance, 2017 emissions estimate is subject to final project scope and detailed engineering. California Synergy Capital Expenditures 35 145 60 -10 2014E 2015E 2016E 2017
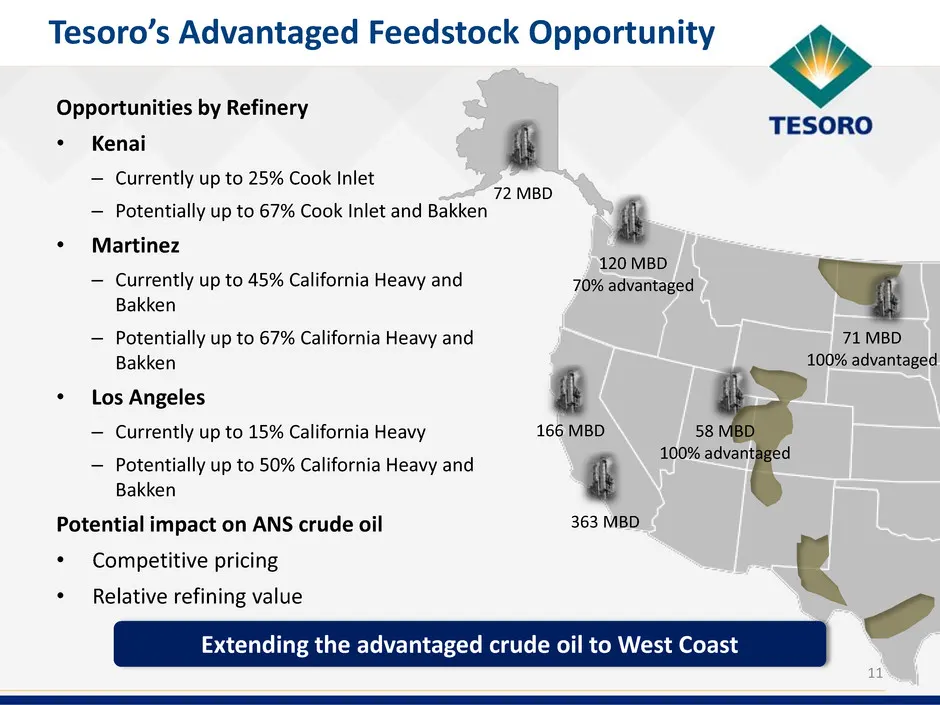
Slide 11: Tesoro's Advantaged Feedstock Opportunity
Opportunities by Refinery • Kenai – Currently up to 25% Cook Inlet – Potentially up to 67% Cook Inlet and Bakken • Martinez – Currently up to 45% California Heavy and Bakken – Potentially up to 67% California Heavy and Bakken • Los Angeles – Currently up to 15% California Heavy – Potentially up to 5
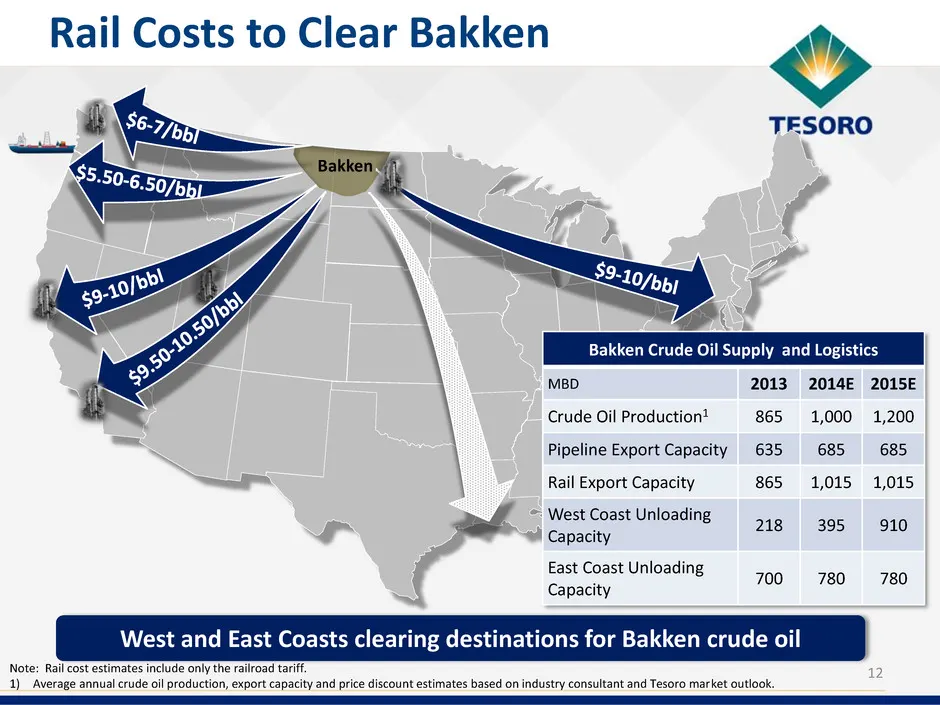
Slide 12: Bakken Crude Oil Supply and Logistics
West and East Coasts clearing destinations for Bakken crude oil 12 Rail Costs to Clear Bakken Note: Rail cost estimates include only the railroad tariff. 1) Average annual crude oil production, export capacity and price discount estimates based on industry consultant and Tesoro market outlook. Bakke
Slide 13: Anacortes Yield Comparison
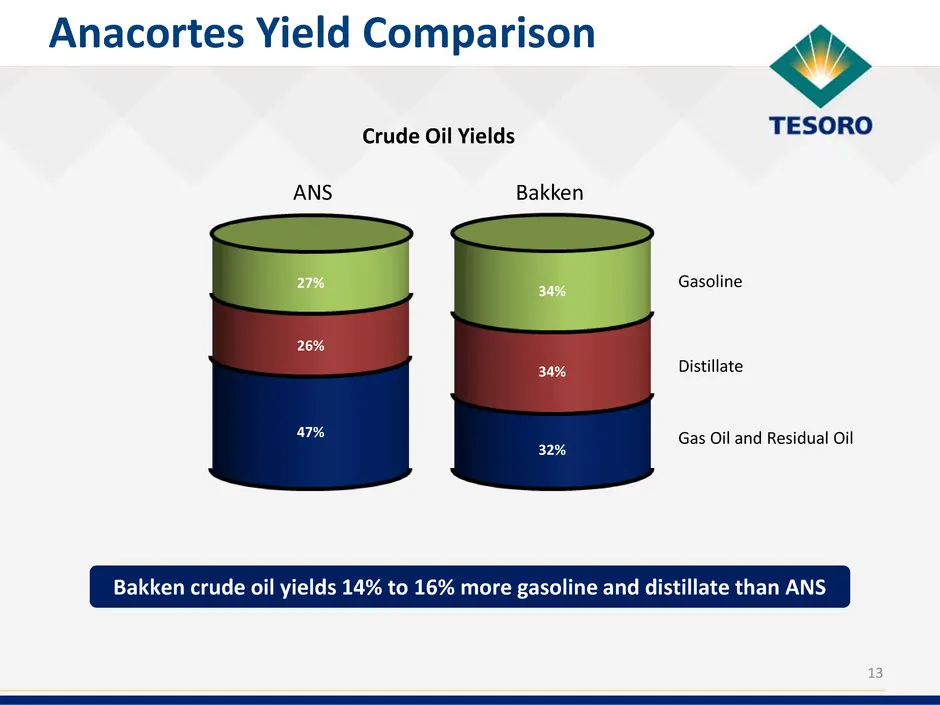
13 Anacortes Yield Comparison 47% 32% 26% 34% 27% 34% Crude Oil Yields ANS Bakken Gasoline Distillate Gas Oil and Residual Oil Bakken crude oil yields 14% to 16% more gasoline and distillate than ANS
Slide 14: Port of Vancouver Rail-to-Marine Terminal
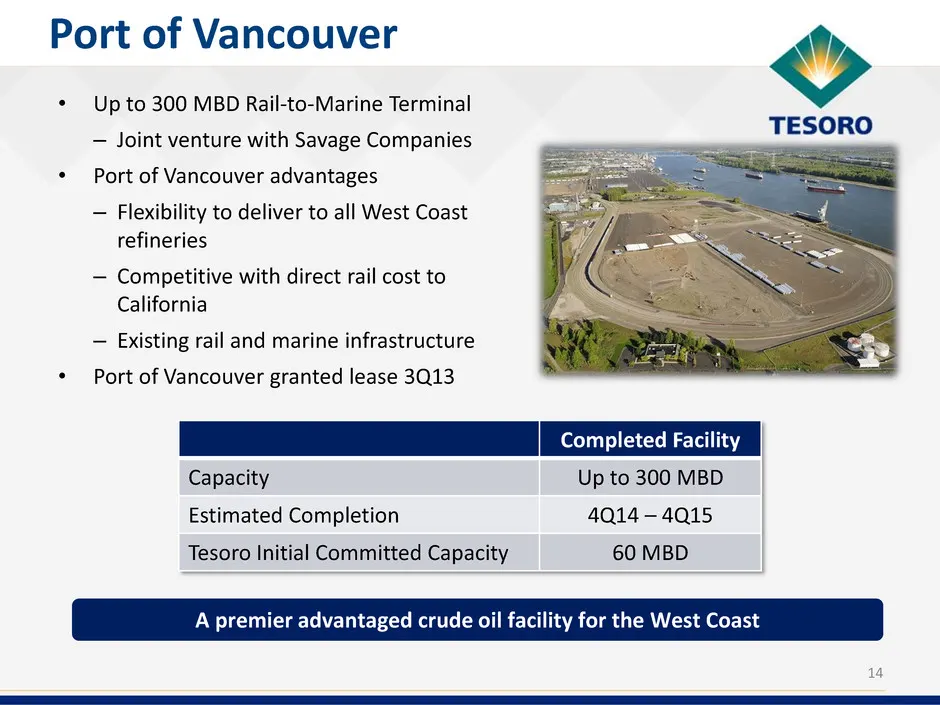
• Up to 300 MBD Rail-to-Marine Terminal – Joint venture with Savage Companies • Port of Vancouver advantages – Flexibility to deliver to all West Coast refineries – Competitive with direct rail cost to California – Existing rail and marine infrastructure • Port of Vancouver granted lease 3Q13 14 Por
Slide 15: Marketing Brands
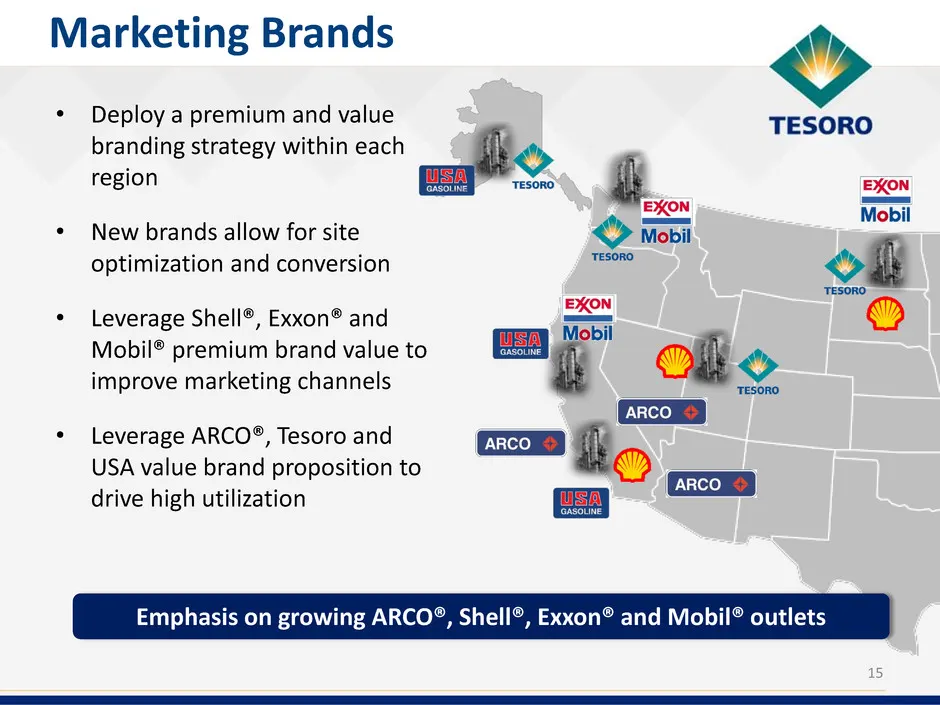
• Deploy a premium and value branding strategy within each region • New brands allow for site optimization and conversion • Leverage Shell®, Exxon® and Mobil® premium brand value to improve marketing channels • Leverage ARCO®, Tesoro and USA value brand proposition to drive high utilization 15 Marke
Slide 16: Solomon Based Cost Reductions
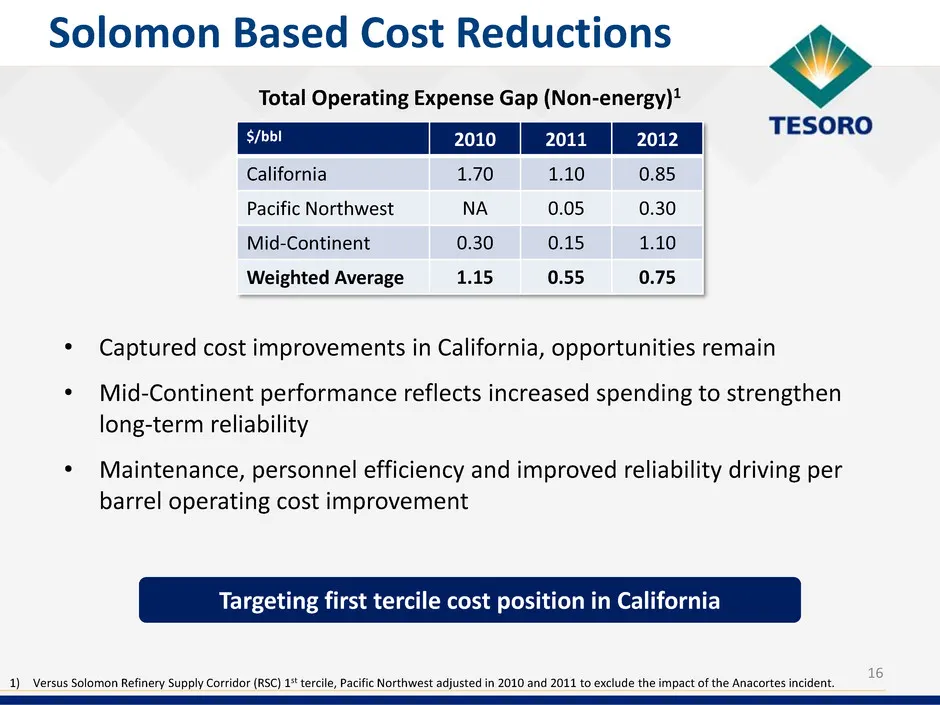
• Captured cost improvements in California, opportunities remain • Mid-Continent performance reflects increased spending to strengthen long-term reliability • Maintenance, personnel efficiency and improved reliability driving per barrel operating cost improvement Solomon Based Cost Reductions 1) Ver
Slide 17: TLLP Strategic Drivers
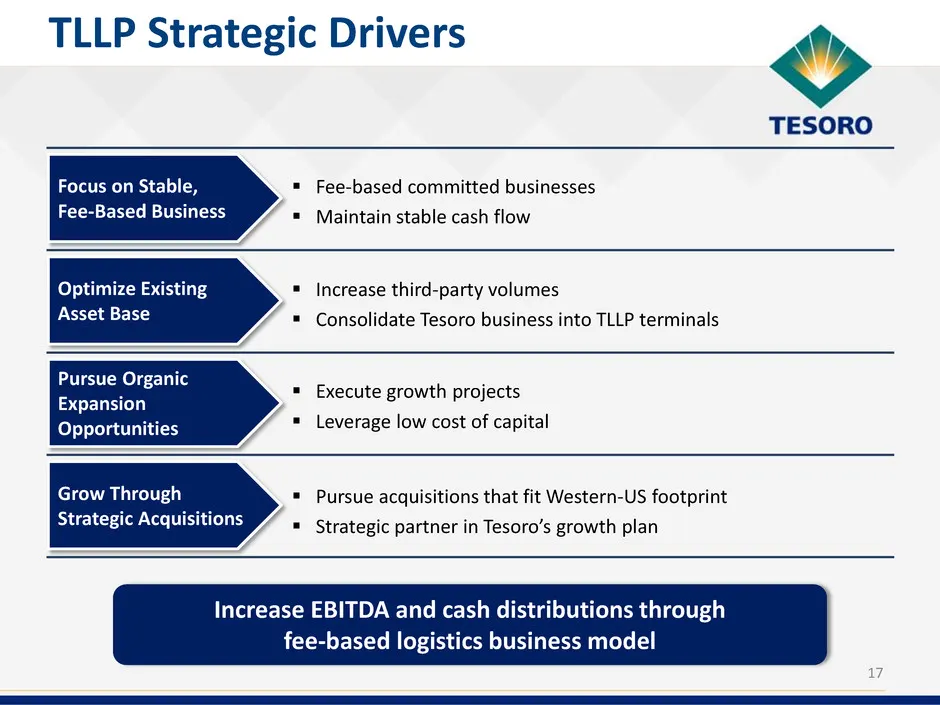
17 TLLP Strategic Drivers Increase EBITDA and cash distributions through fee-based logistics business model Focus on Stable, Fee-Based Business Fee-based committed businesses Maintain stable cash flow Optimize Existing Asset Base Increase third-party volumes Consolidate Tesoro business into
Slide 18: TLLP Value Proposition to Tesoro
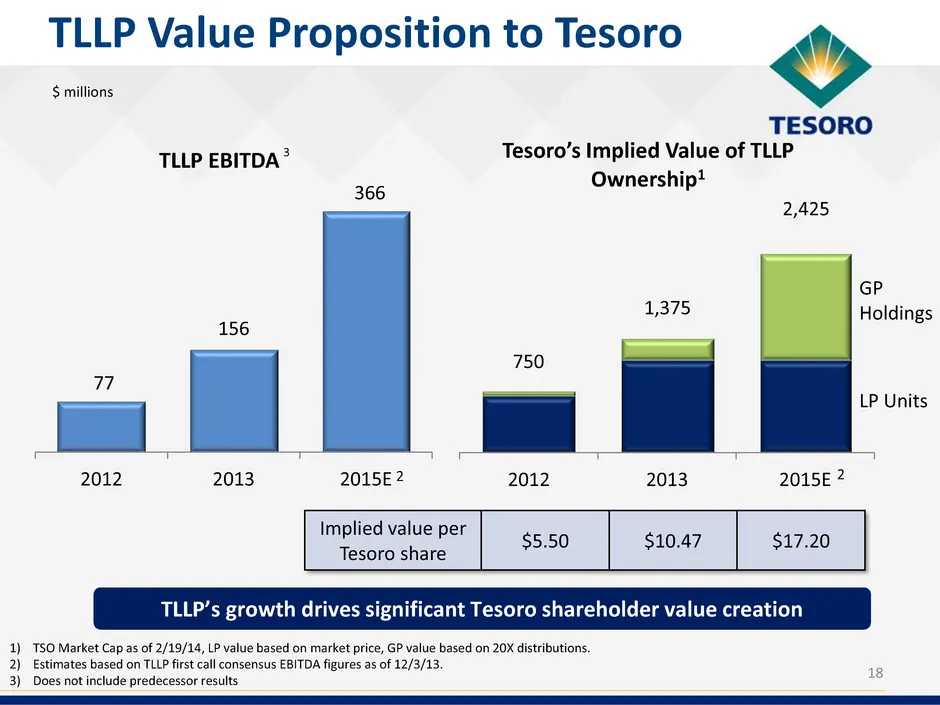
18 TLLP Value Proposition to Tesoro TLLP’s growth drives significant Tesoro shareholder value creation 77 156 366 2012 2013 2015E TLLP EBITDA 2 2012 2013 2015E Tesoro’s Implied Value of TLLP Ownership1 1) TSO Market Cap as of 2/19/14, LP value based on market price, GP value based on 20X distributio
Slide 19: Financial Priorities
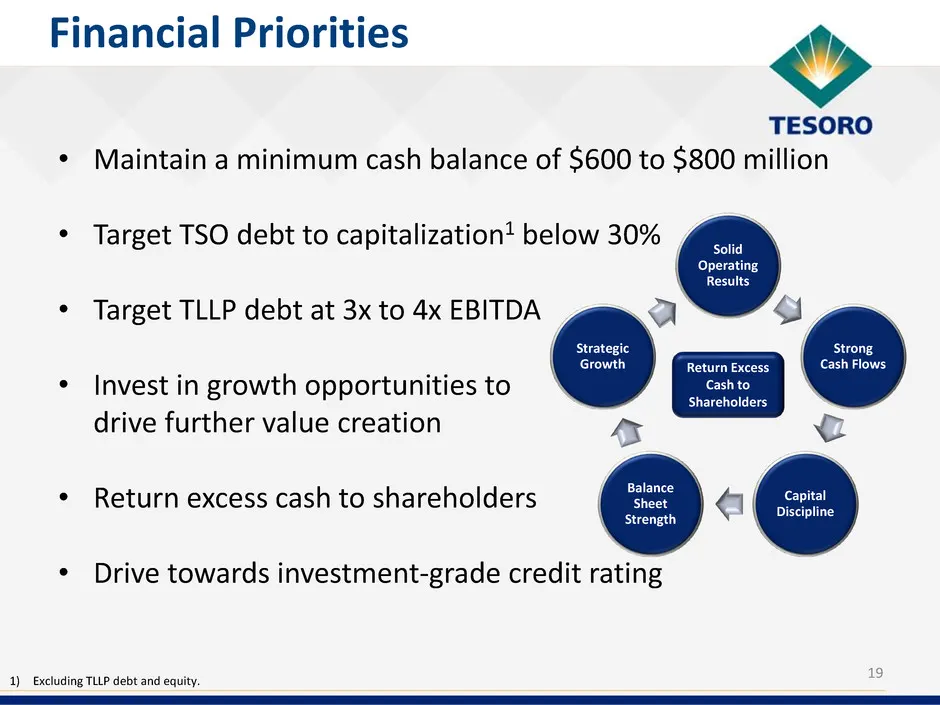
• Maintain a minimum cash balance of $600 to $800 million • Target TSO debt to capitalization1 below 30% • Target TLLP debt at 3x to 4x EBITDA • Invest in growth opportunities to drive further value creation • Return excess cash to shareholders • Drive towards investment-grade credit rating 19 Finan
Slide 20: Appropriate Leverage for Growth
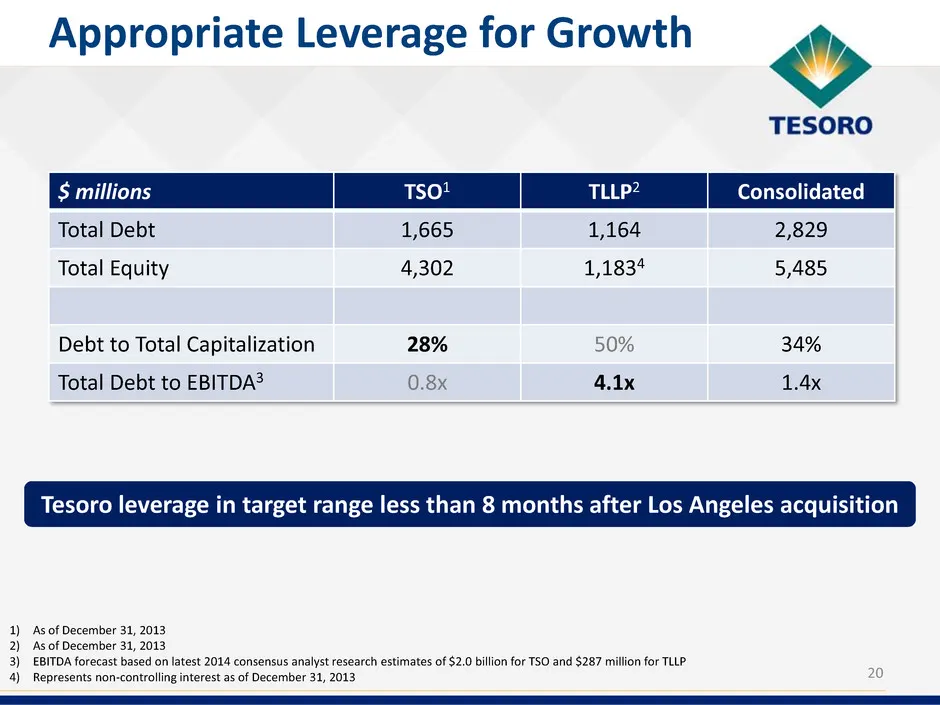
$ millions TSO1 TLLP2 Consolidated Total Debt 1,665 1,164 2,829 Total Equity 4,302 1,1834 5,485 Debt to Total Capitalization 28% 50% 34% Total Debt to EBITDA3 0.8x 4.1x 1.4x 20 Appropriate Leverage for Growth 1) As of December 31, 2013 2) As of December 31, 2013 3) EBITDA forecast based on latest 20
Slide 21: Delivering Free Cash Flow
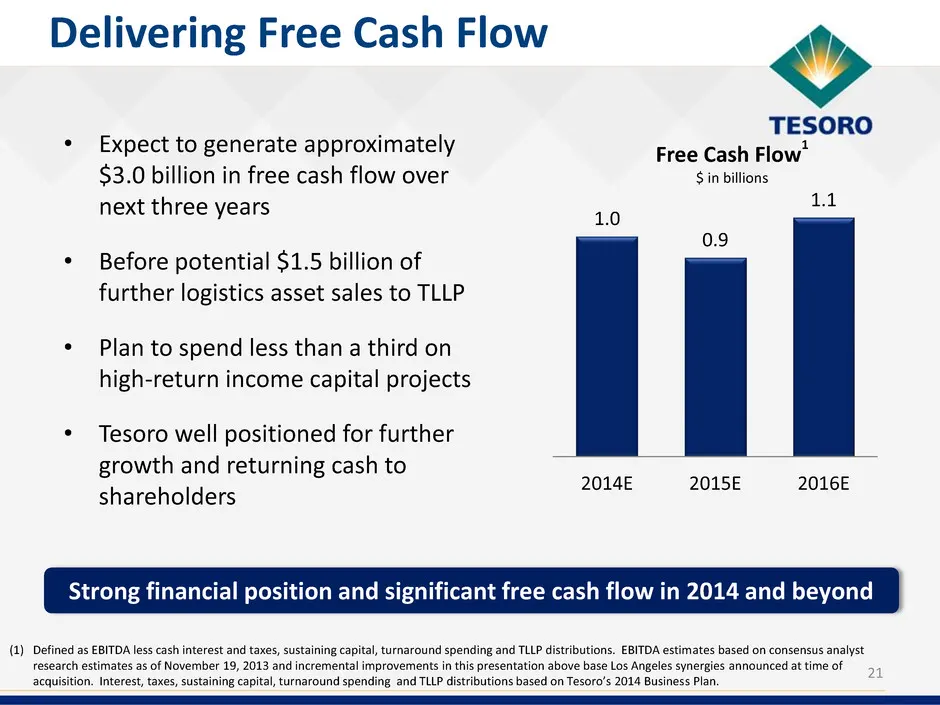
• Expect to generate approximately $3.0 billion in free cash flow over next three years • Before potential $1.5 billion of further logistics asset sales to TLLP • Plan to spend less than a third on high-return income capital projects • Tesoro well positioned for further growth and returning cash to
Slide 22: Delivering Shareholder Value
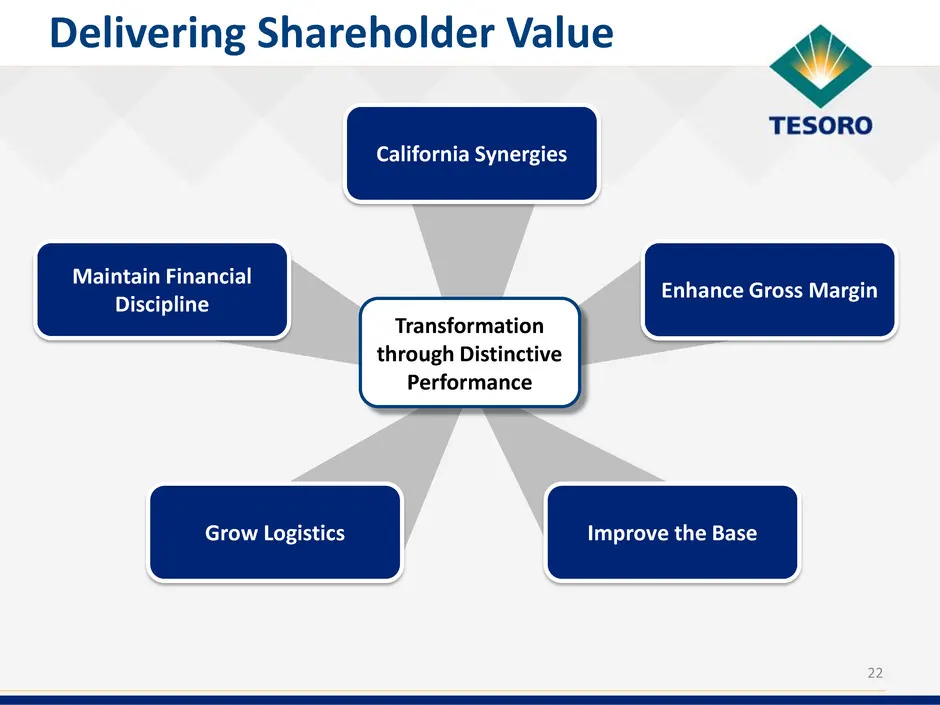
22 Delivering Shareholder Value Enhance Gross Margin California Synergies Maintain Financial Discipline Improve the Base Grow Logistics Transformation through Distinctive Performance
Slide 23: Appendix
TESORO Appendix
Slide 24: Debt Structure and Maturity
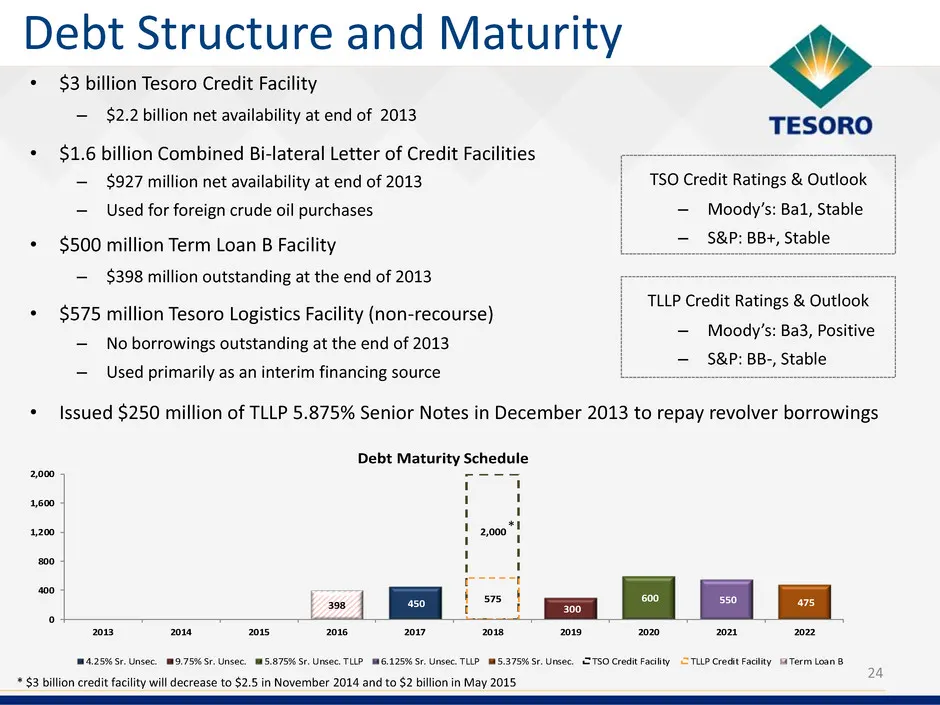
Debt Structure and Maturity • $3 billion Tesoro Credit Facility – $2.2 billion net availability at end of 2013 • $1.6 billion Combined Bi-lateral Letter of Credit Facilities – $927 million net availability at end of 2013 – Used for foreign crude oil purchases • $500 million Term Loan B Facility – $3
Slide 25: Summary Capital Spending
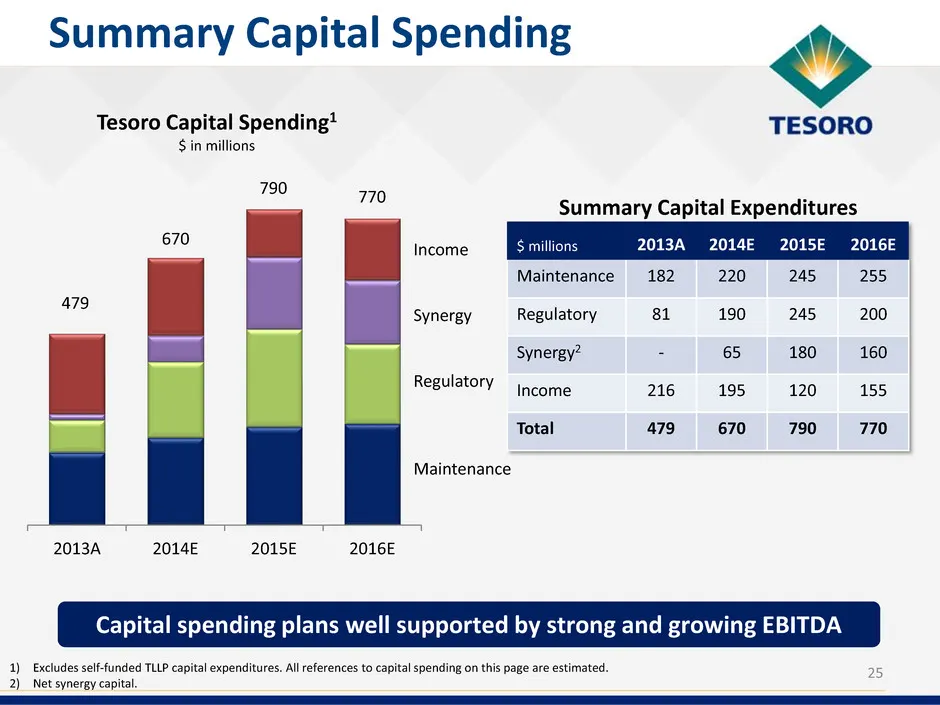
25 Summary Capital Spending 2013A 2014E 2015E 2016E Tesoro Capital Spending1 $ in millions 1) Excludes self-funded TLLP capital expenditures. All references to capital spending on this page are estimated. 2) Net synergy capital. $ millions 2013A 2014E 2015E 2016E Maintenance 182 220 245 255 Regulato
Slide 26: Turnaround Spending
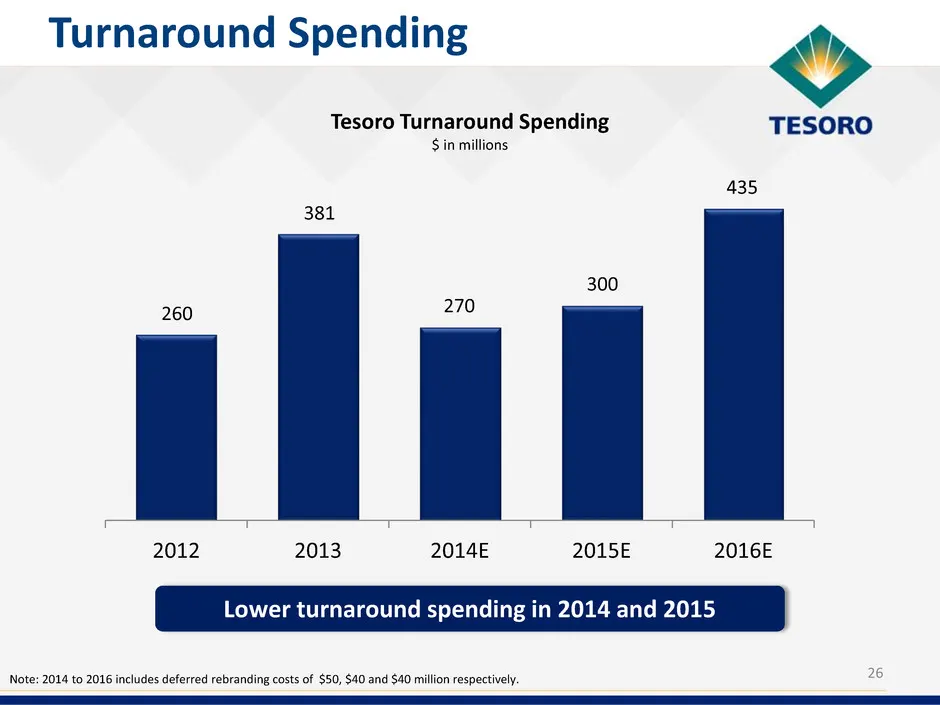
26 Turnaround Spending 2012 2013 2014E 2015E 2016E Lower turnaround spending in 2014 and 2015 260 381 270 300 435 Tesoro Turnaround Spending $ in millions Note: 2014 to 2016 includes deferred rebranding costs of $50, $40 and $40 million respectively.
Slide 27: TLLP Capital Spending
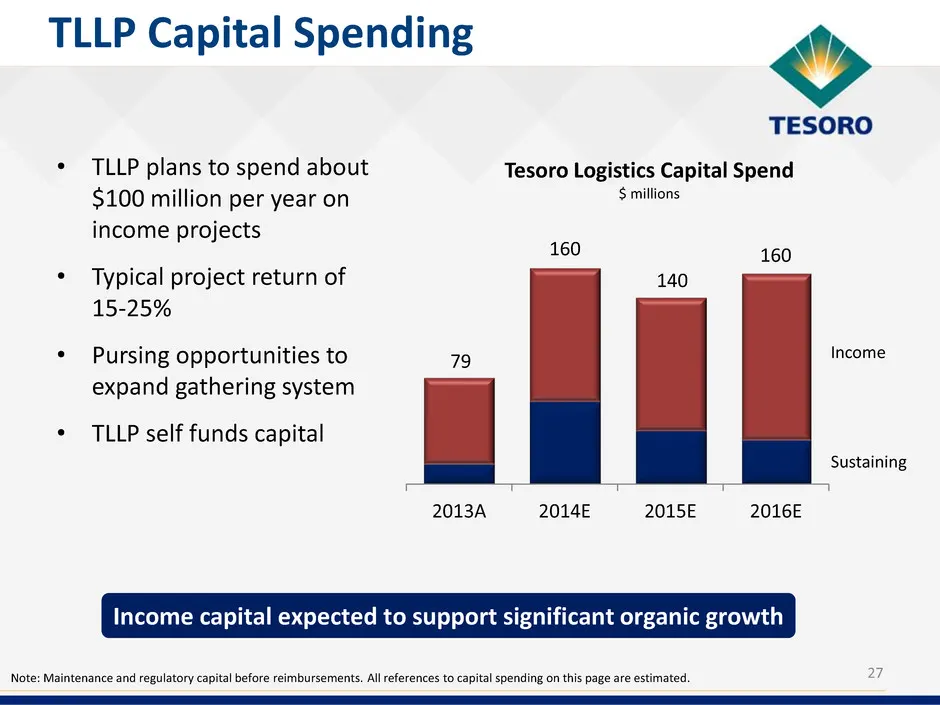
• TLLP plans to spend about $100 million per year on income projects • Typical project return of 15-25% • Pursing opportunities to expand gathering system • TLLP self funds capital 27 TLLP Capital Spending 2013A 2014E 2015E 2016E Tesoro Logistics Capital Spend $ millions 160 140 160 79 Note: Mainten
Slide 28: Los Angeles Refinery Integration Project
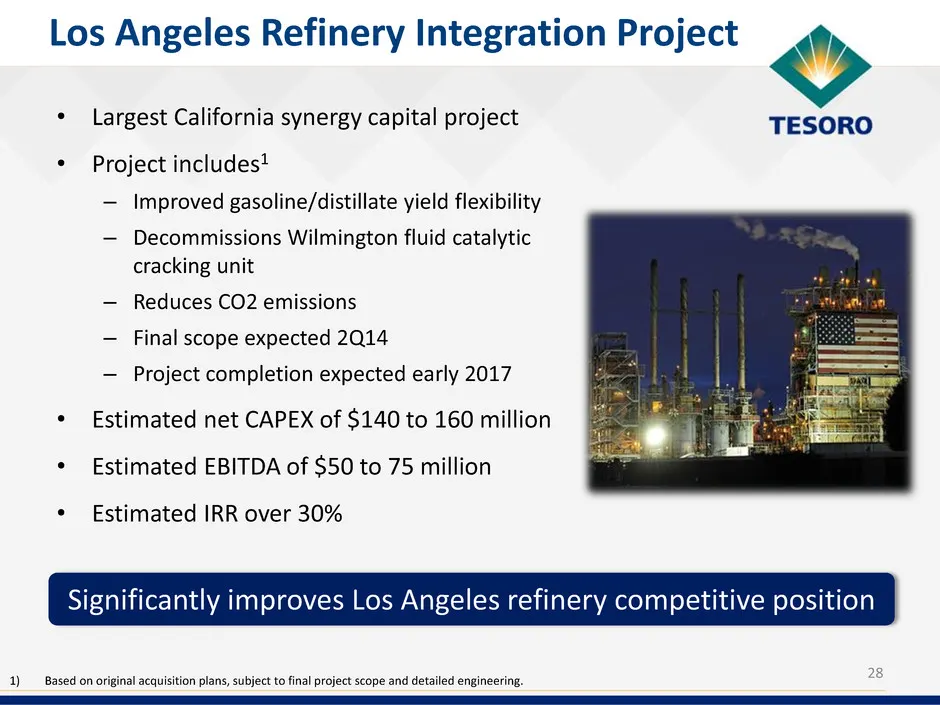
• Largest California synergy capital project • Project includes1 – Improved gasoline/distillate yield flexibility – Decommissions Wilmington fluid catalytic cracking unit – Reduces CO2 emissions – Final scope expected 2Q14 – Project completion expected early 2017 • Estimated net CAPEX of $140 to 160
Slide 29: Salt Lake City Conversion Project
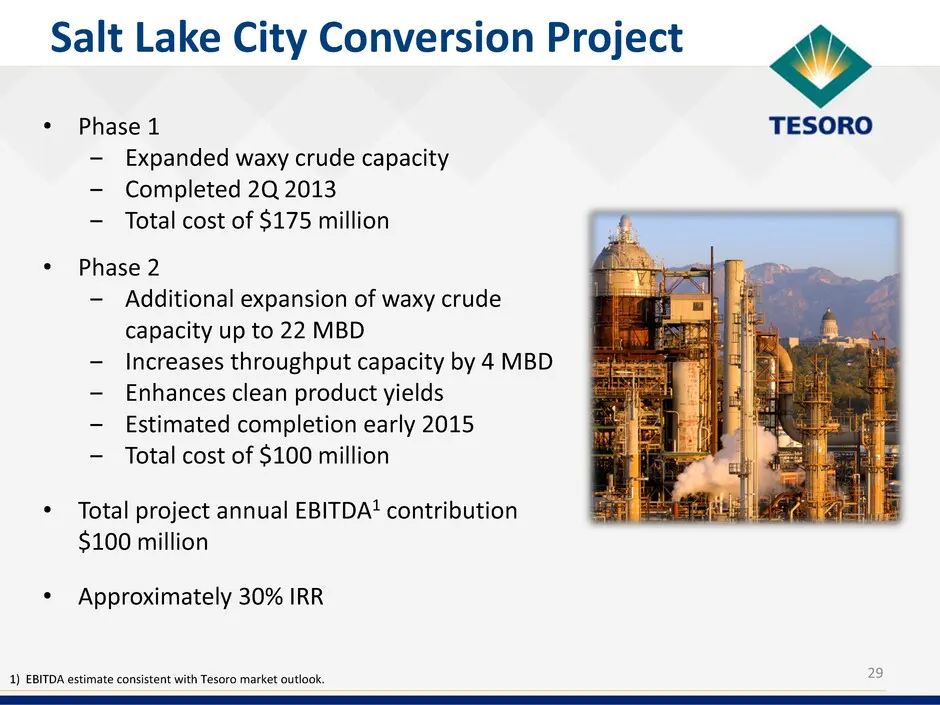
29 Salt Lake City Conversion Project • Phase 1 ‒ Expanded waxy crude capacity ‒ Completed 2Q 2013 ‒ Total cost of $175 million • Phase 2 ‒ Additional expansion of waxy crude capacity up to 22 MBD ‒ Increases throughput capacity by 4 MBD ‒ Enhances clean product yields ‒ Estimated completion early 20
Slide 30: Non-GAAP Financial Measures
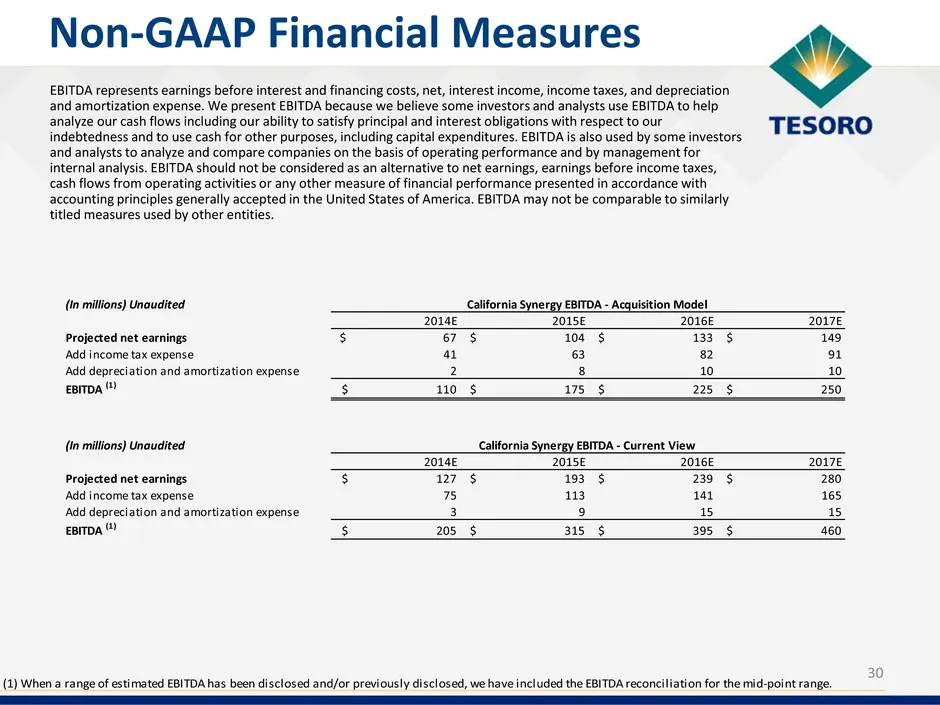
30 Non-GAAP Financial Measures EBITDA represents earnings before interest and financing costs, net, interest income, income taxes, and depreciation and amortization expense. We present EBITDA because we believe some investors and analysts use EBITDA to help analyze our cash flows including our abili
Slide 31: Non-GAAP Financial Measures (2)
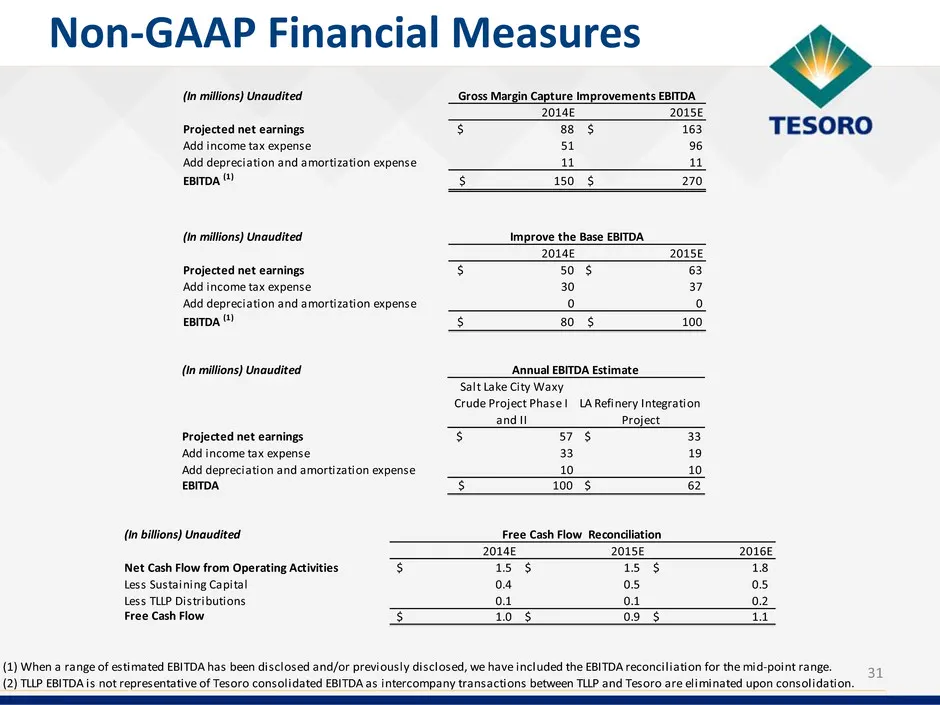
31 Non-GAAP Financial Measures (2) TLLP EBITDA is not representative of Tesoro consolidated EBITDA as intercompany transactions between TLLP and Tesoro are eliminated upon consolidation. 1 When a range of estimat d EBITDA has been disclosed and/or previously disclosed, we have included the EBITDA r
Slide 32: Non-GAAP Financial Measures (2)
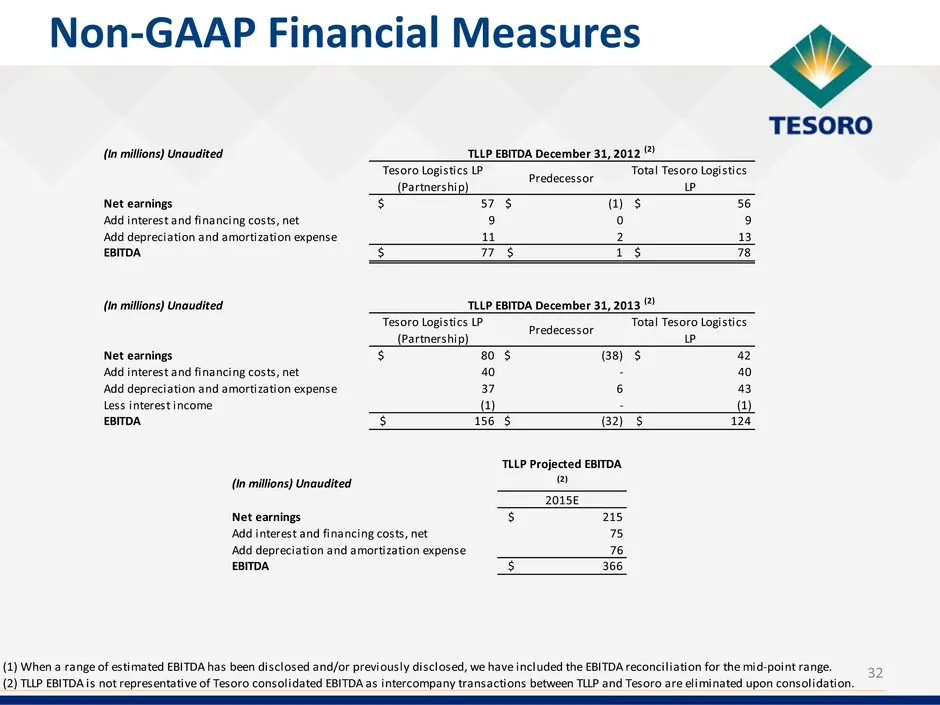
32 Non-GAAP Financial Measures (2) TLLP EBITDA is not representative of Tesoro consolidated EBITDA as intercompany transactions between TLLP and Tesoro are eliminated upon consolidation. 1 When a range of estimat d EBITDA has been disclosed and/or previously disclosed, we have included the EBITDA r
Source: SEC EDGAR · 8-K filed Feb 24, 2014
More decks from Andeavor
 Barclays CEO Energy-Power Conference 201896 slides · Sep 5, 2018
 Merger or Acquisition (June 2018)34 slides · Jun 6, 2018
 Merger or Acquisition (May 2018)10 slides · May 10, 2018
 Merger or Acquisition (April 2018)25 slides · Apr 30, 2018
 2018 Wolfe Research 4th Annual Refiners Conference37 slides · Jan 3, 2018
 Tesoro Corp /New/ — Investor Day (December 2015)84 slides · Dec 9, 2015