Andeavor — Barclays CEO Energy-Power Conference 2018
96 slides from Andeavor's conference presentation, Sep 5, 2018
Slide 1: Barclays CEO Energy-Power Conference
Marathon ) Petroleum Corporation Barclays CEO Energy-Power Conference September 4-6, 2018
Slide 2: Forward-Looking Statements
Forward-Looking Statements tains ‘Marathon Petroleum Corporation ("MPC"). These forward-looking statements relate te among ater hing, the proposed taneacton between MPC end Andeavor CAND” and nce expectations, estimates and projections conceming the business and operation, satagic intatves and value
Slide 3: Additional Information
Additional Information Additional Information and Where to Find It in connection wih the proposed fransarion; MPC andi ANDV have fied relevest miaerals withthe SEC, Inkuding MPCs ropsteilonsislement on Form S-4 thal incudes a definitive joint proxy statemnentprospecius and was declared effective by
Slide 4: Pro Forma MPC — A Leading Energy Company
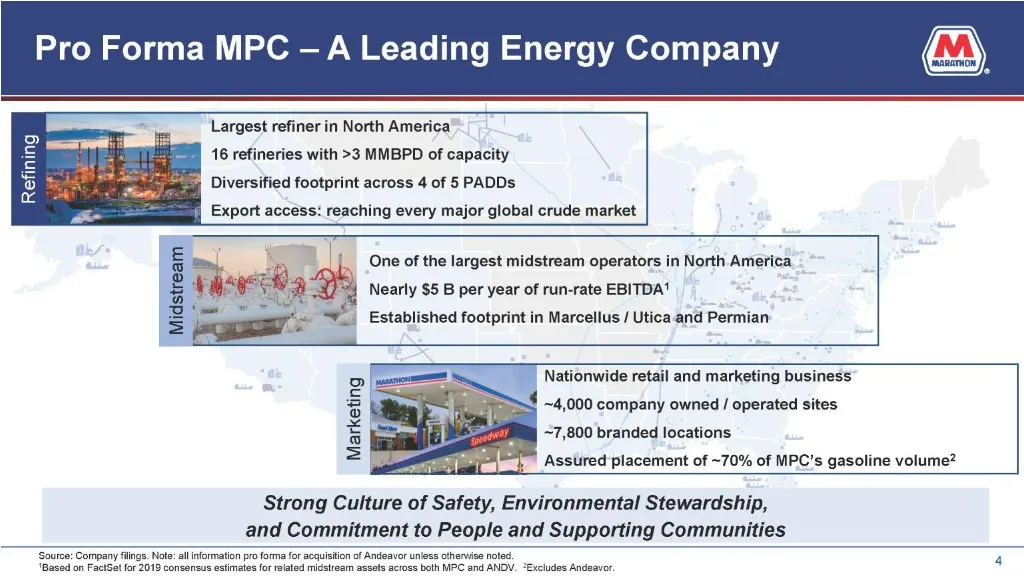
Pro Forma MPC — A Leading Energy Compa Largest refiner in North America 16 refineries with >3 MMBPD of capacity Diversified footprint across 4 of 5 PADDs Export access: reaching every major global crude market One of the largest midstream operators in North America Nearly $5 B per year of run-rate E
Slide 5: Well-Positioned for the Long Term
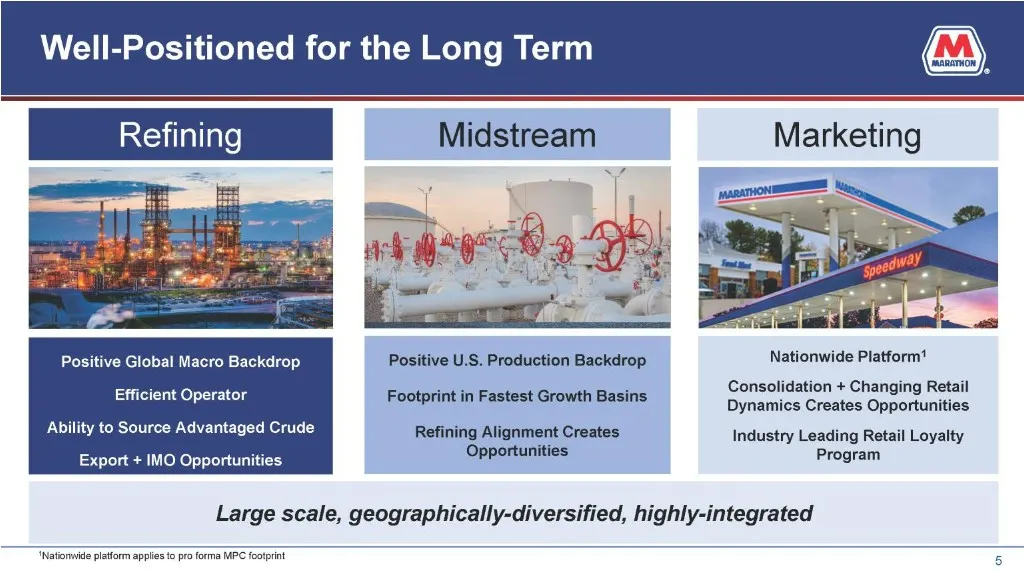
Well-Positioned for the Long Term Marketing 3 Ol | a Positive Global Macro Backdrop Positive U.S. Production Backdrop Nationwide Platform* Consolidation + Changing Retail Dynamics Creates Opportunities Ability to Source Advantaged Crude Refining Alignment Creates leelusby Loading fail Loyalty Opport
Slide 6: Integrated Model Enhances Earnings Stability and Sustainability
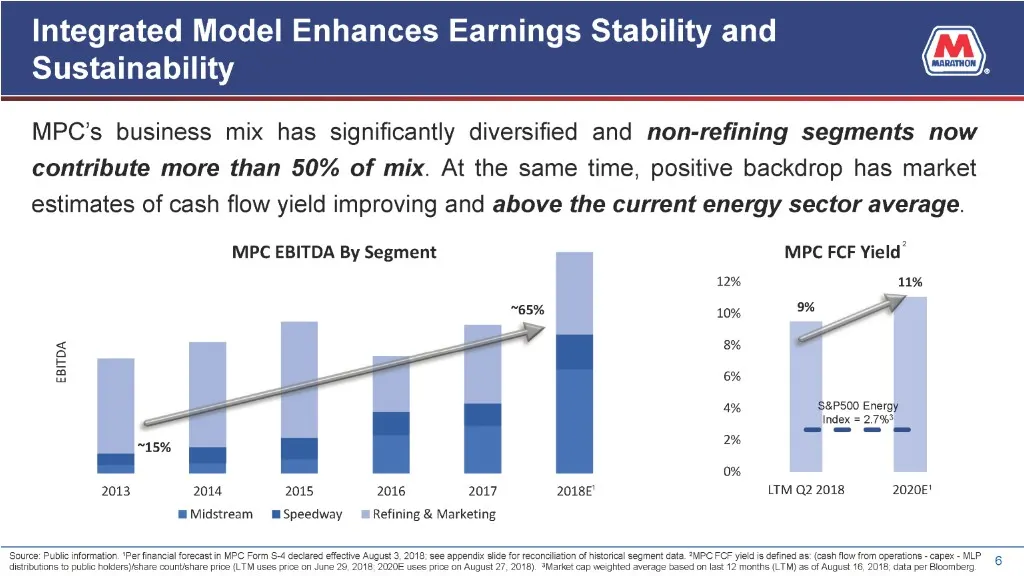
Integrated Model Enhances Earnings Stability and Sustainability MPC’s business mix has significantly diversified and non-refining segments now contribute more than 50% of mix. At the same time, positive backdrop has market estimates of cash flow yield improving and above the current energy sector av
Slide 7: Committed to Creating Shareholder Value
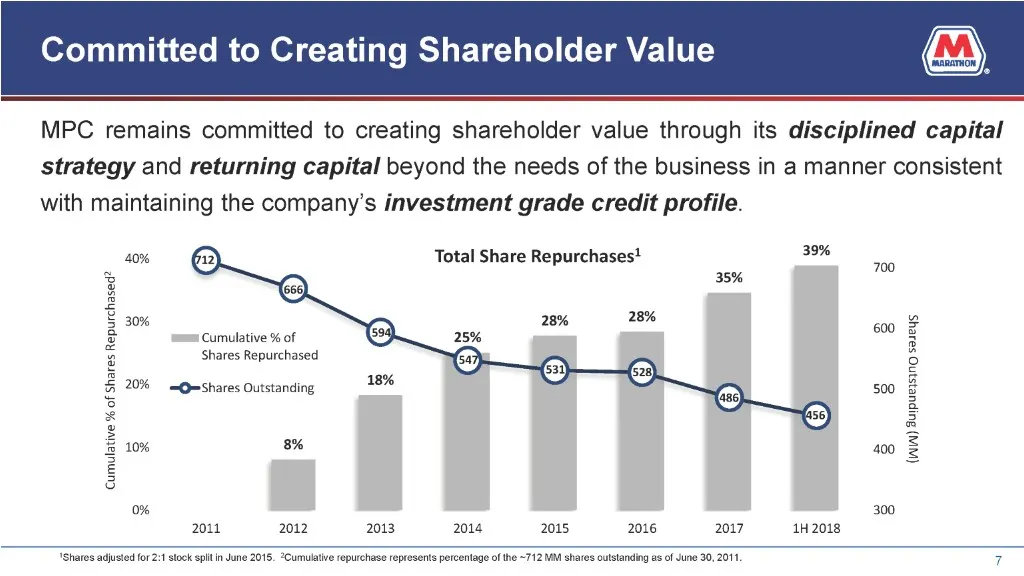
Committed to Creating Shareholder Value MPC remains committed to creating shareholder value through its disciplined capital strategy and returning capital beyond the needs of the business in a manner consistent with maintaining the company’s investment grade credit profile. 40% Total Share Repurchas
Slide 8: Responsible Corporate Leadership
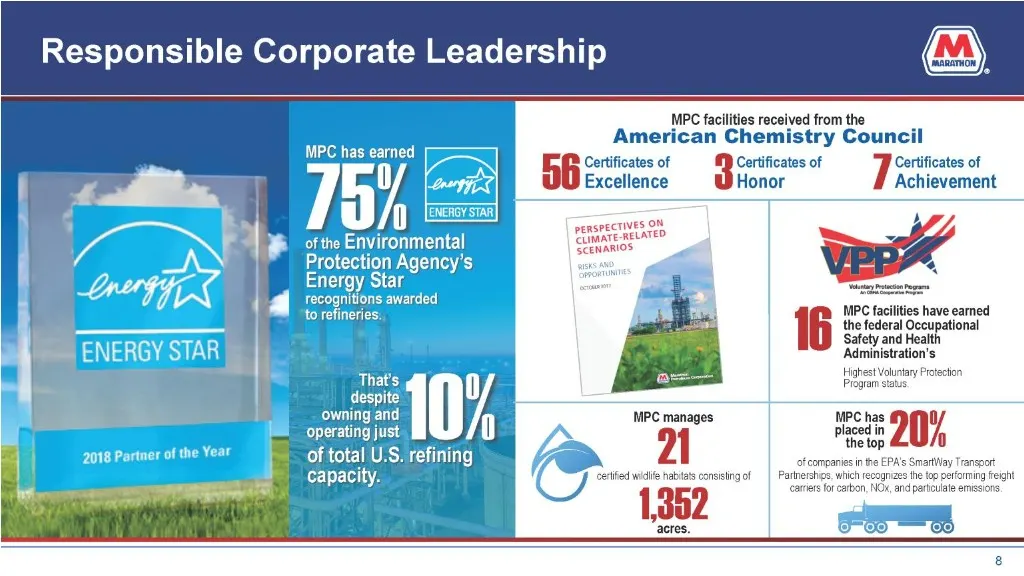
Responsible Corporate Leadership MPC facilities received from the American Chemistry Council Certificates of Certificates of Certificates of Excellence Honor Achievement / spECTIVES OF . ce mined “Brak =", , MPC facilities have earned the federal Occupational Safety and Healt Administration's Highes
Slide 9: Global Macro and Refining Outlook
Slide 10: Global & U.S. Economic Outlook Positive
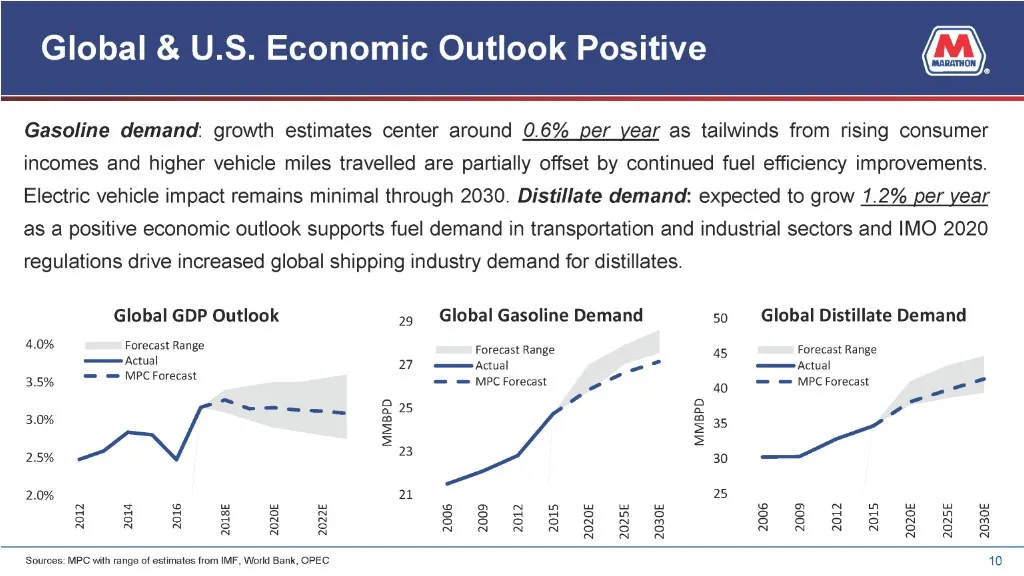
Global & U.S. Economic Outlook Positive in growth i center around 0.6% per year as tailwinds from rising consumer incomes and higher vehicle miles travelled are partially offset by continued fuel efficiency improvements. Electric vehicle impact remains minimal through 2030. Distillate to grow 1.2% p
Slide 11: Technology Advancements: Mixed Trends
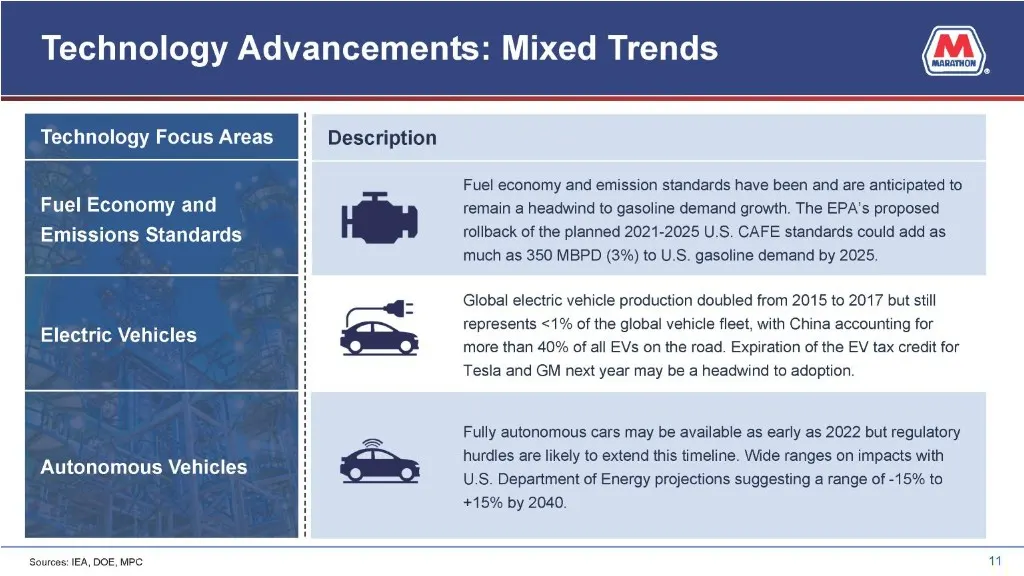
Technology Advancements: Mixed Trends Technology Focus Areas Fuel Economy and Emissions Standards Vehicles Autonomous Vehicles Description Fuel economy and emission standards have been and are anticipated to remain a headwind to gasoline demand growth. The EPA's proposed rollback of the planned 2021
Slide 12: Exports are a Sustainable Opportunity
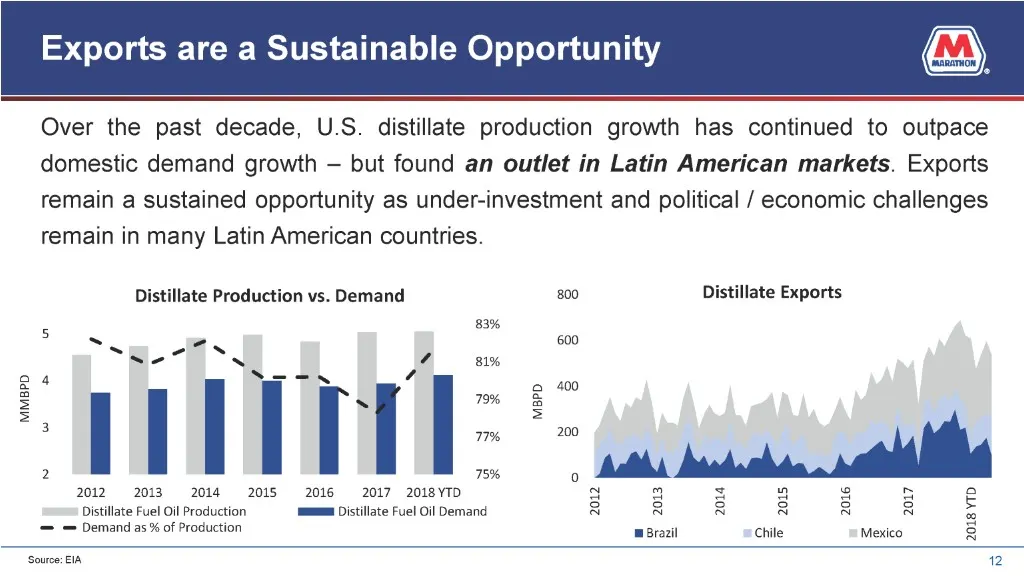
Exports are a Sustainable Opportunity Over the past decade, U.S. distillate production growth has continued to outpace domestic demand growth — but found an outlet in Latin American markets. Exports remain a sustained opportunity as under-investment and political / economic challenges remain in many
Slide 13: Global Refining Capacity Relatively Balanced
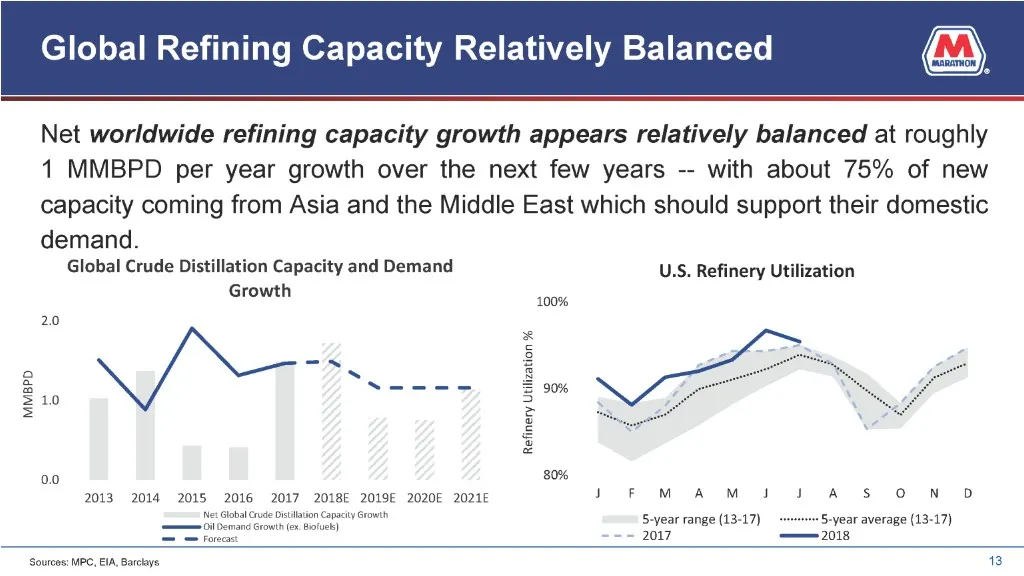
Global Refining Capacity Relatively Balanced Net worldwide refining capacity growth appears relatively balanced at roughly 1 MMBPD per year growth over the next few years -- with about 75% of new capacity coming from Asia and the Middle East which should support their domestic demand. Global Crude D
Slide 14: Global Inventories Moderate
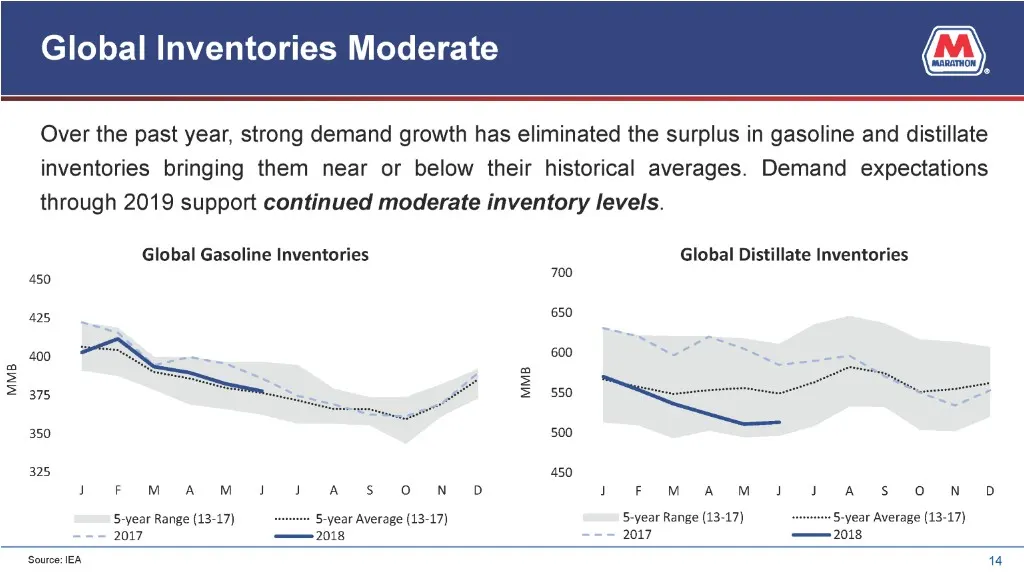
MMB Global Inventories Moderate Over the past year, strong demand growth has eliminated the surplus in gasoline and distillate inventories bringing them near or below their historical averages. Demand expectations through 2019 support continued moderate inventory levels. Global Gasoline Inventories
Slide 15: U.S. Inventories Support Refining Margins
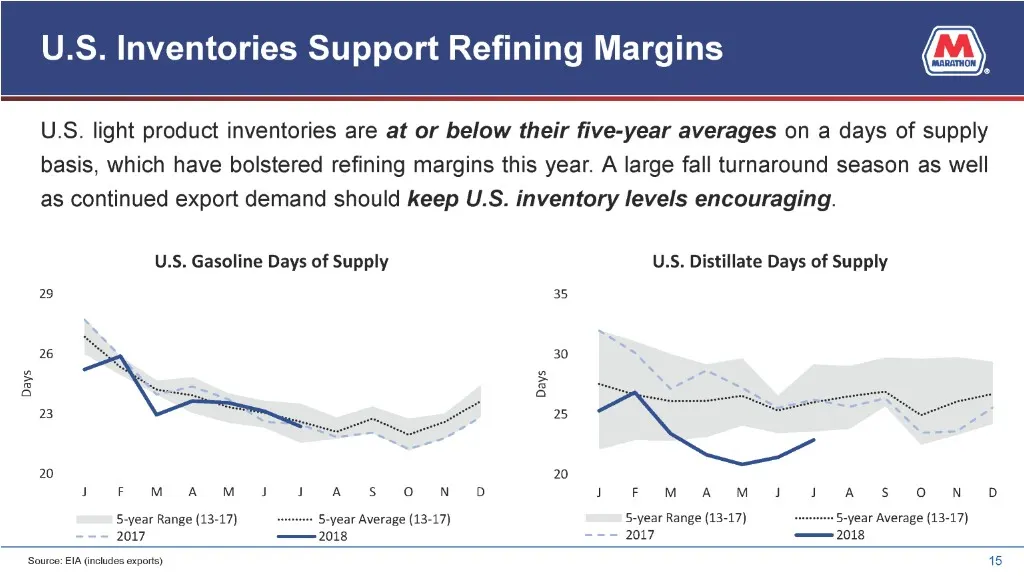
U.S. Inventories Support Refining Margins U.S. light product inventories are at or below their five-year averages on a days of supply basis, which have bolstered refining margins this year. A large fall turnaround season as well as continued export demand should keep U.S. inventory levels encouragin
Slide 16: U.S. Refineries Among Most Cost Efficient in World
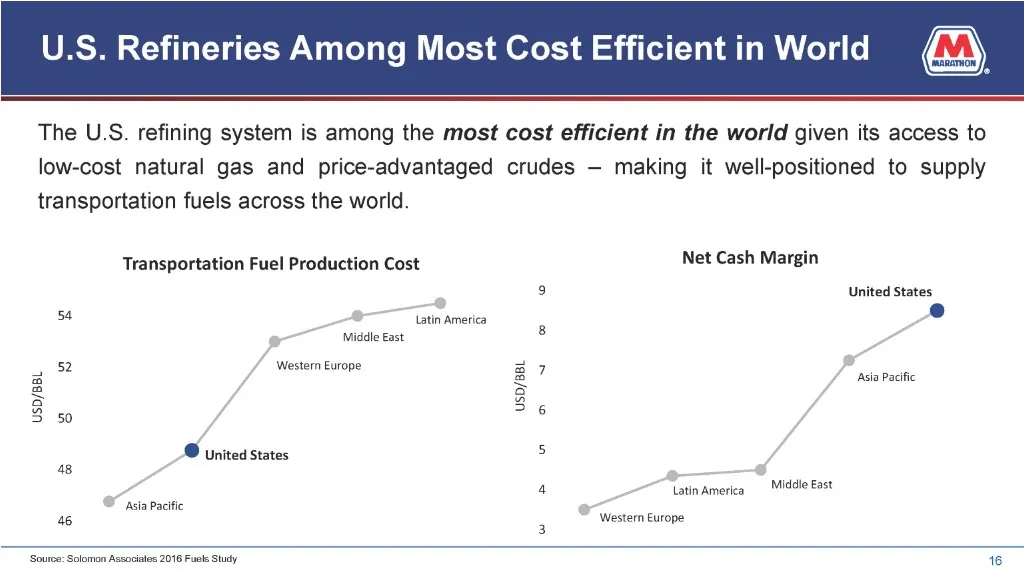
U.S. Refineries Among Most Cost Efficient in World The U.S. refining system is among the most cost efficient in the world given its access to low-cost natural gas and price-advantaged crudes — making it well-positioned to supply transportation fuels across the world. Transportation Fuel Production C
Slide 17: MPC has Some of the Best Assets in the U.S.
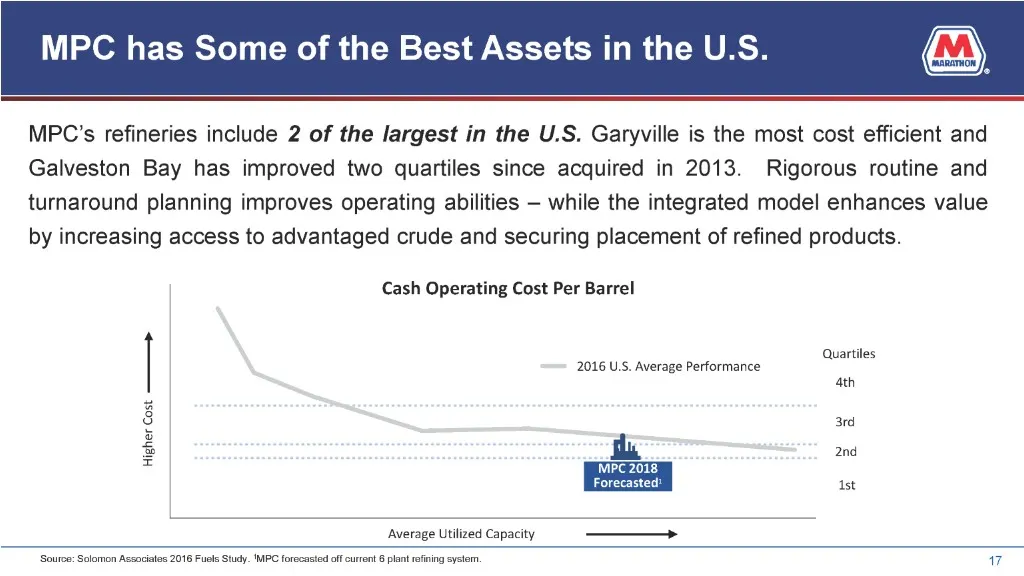
MPC has Some of the Best Assets in the U.S. MPC’s refineries include 2 of the largest in the U.S. Garyville is the most cost efficient and Galveston Bay has improved two quartiles since acquired in 2013. Rigorous routine and turnaround planning improves operating abilities — while the integrated mod
Slide 18: Global Crude Production Sufficient to Meet Demand
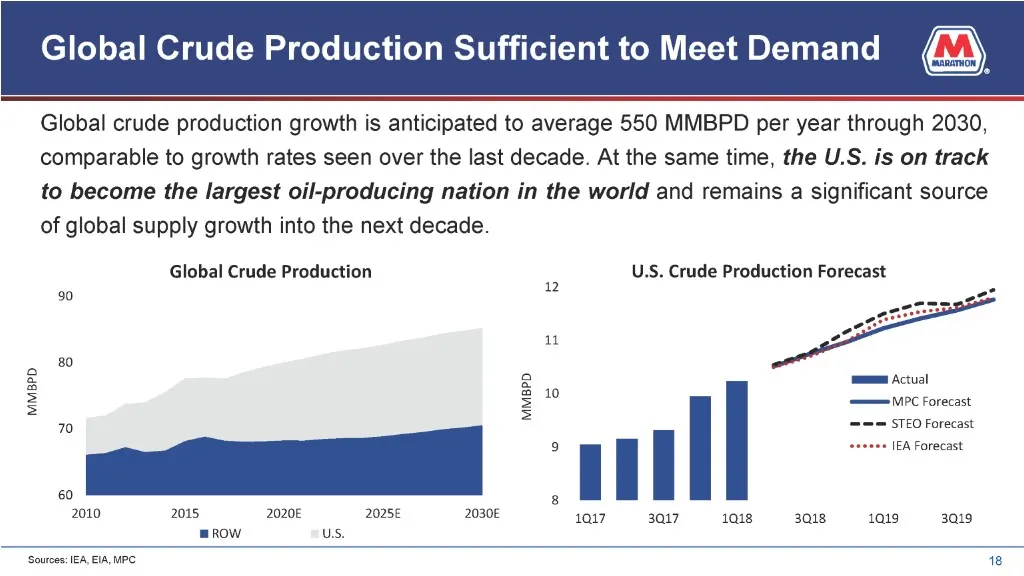
Global Crude Production Sufficient to Meet Demand @, Global crude production growth is anticipated to average 550 MMBPD per year through 2030, comparable to growth rates seen over the last decade. At the same time, the U.S. is on track to become the largest oil-producing nation in the world and rema
Slide 19: U.S. Rapid Growth Driven by Compelling Economics
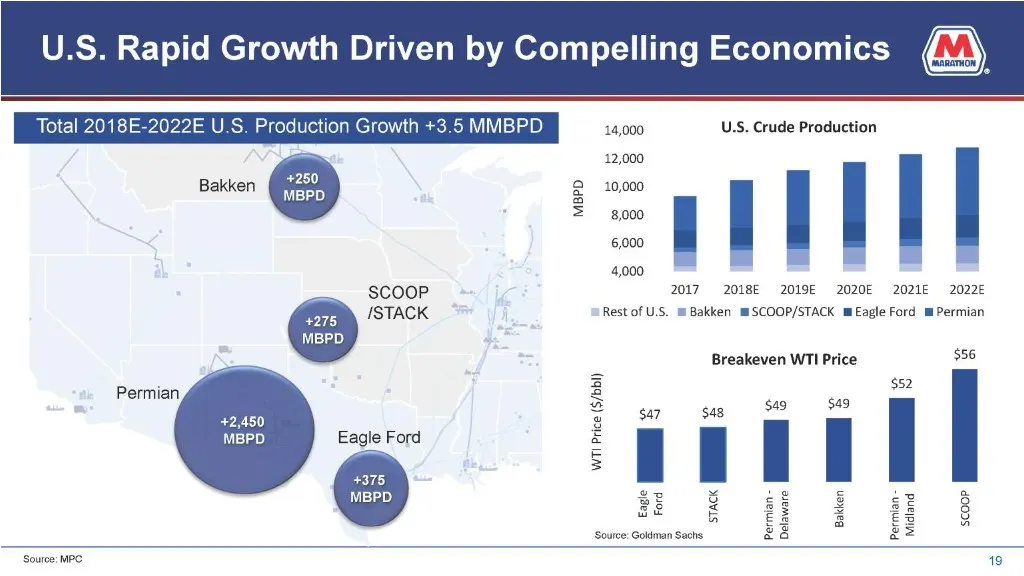
U.S. Rapid Growth Driven by Compelling Economics Bakken SCOOP stack MBPD. Eagle Ford 4375 MBPD. MBPD 14,000 U.S. Crude Production 12,000 000 8,000 6,000 4,000 2017 2018E 2019 2020E- -2021E 20226 Rest of U.S. m Bakken mSCOOP/STACK mEagle Ford m Permian Breakeven WTI Price eo 2 $52 = = scoop Permian M
Slide 20: The Global Crude Slate is Lightening
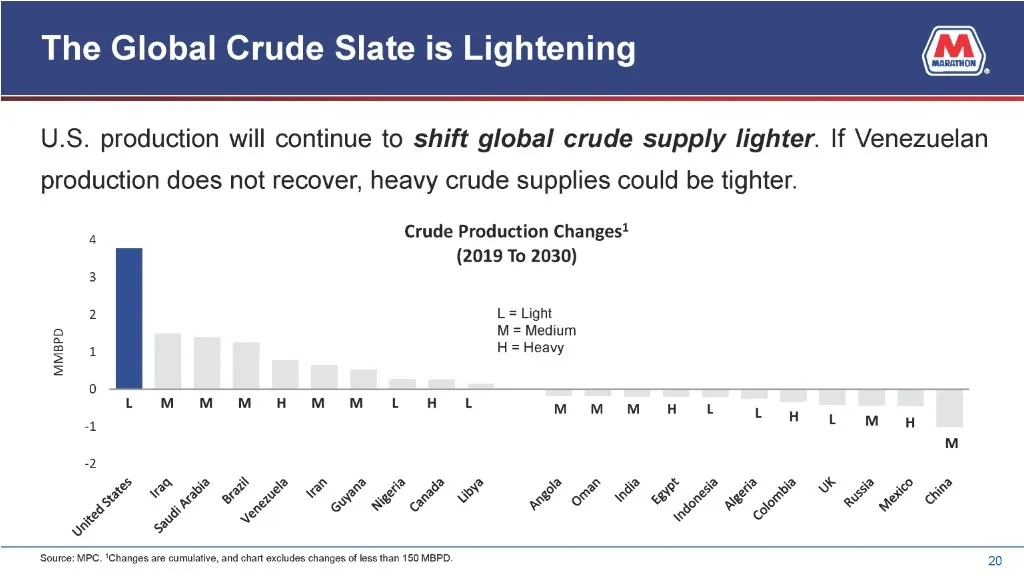
The Global Crude Slate is Lightening U.S. production will continue to shift global crude supply lighter. \f Venezuelan production does not recover, heavy crude supplies could be tighter. 4. Crude Production Changes* (2019 To 2030) 3 2 L= Light M= Medium 1 H= Heavy MMBPD oo FS PES SS S se & & ests ¢
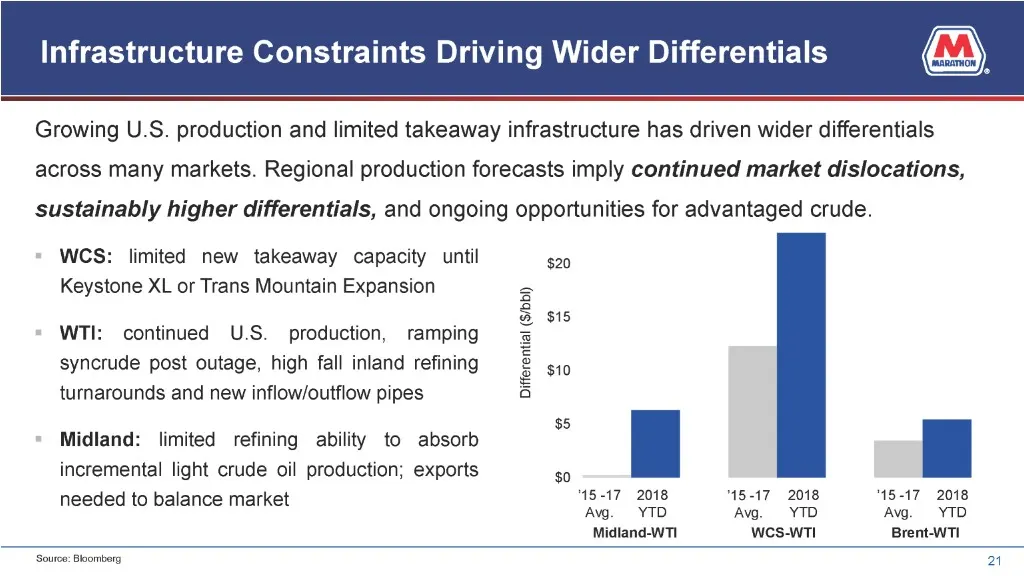
Slide 21: Infrastructure Constraints Driving Wider Differentials
Infrastructure Constraints Driving Wider Differentials Growing U.S. production and limited takeaway infrastructure has driven wider differentials across many markets. Regional production forecasts imply i J market dish ly higher differentials, and ongoing opportunities for advantaged crude. » WCS: l
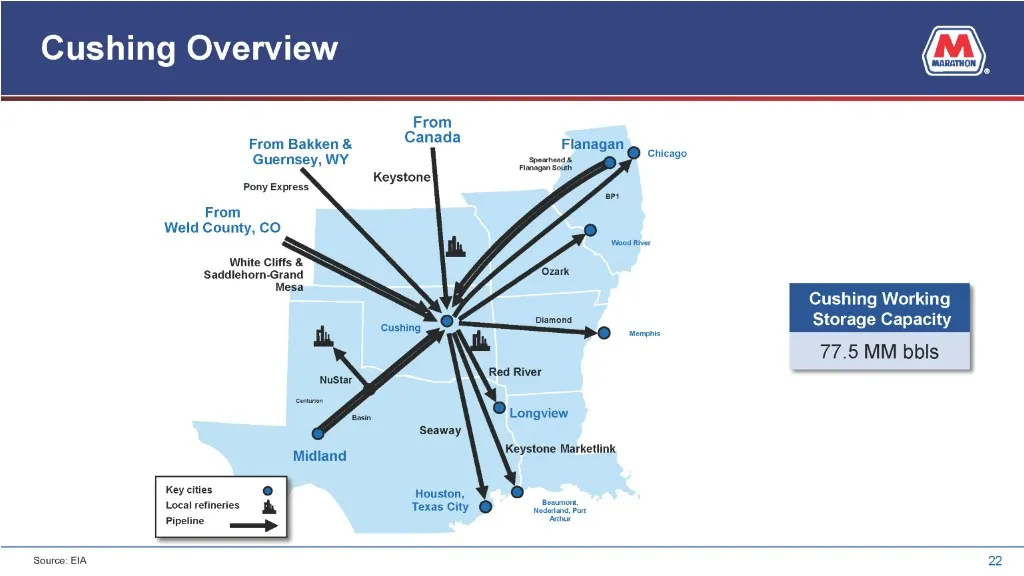
Slide 22: Cushing Overview
Cushing Overview From From Bakken & —— Guernsey, WY Cushing Working Storage Capacity 77.5 MM bbls Keystone Marketlink Houston, Texas city Source: EIA
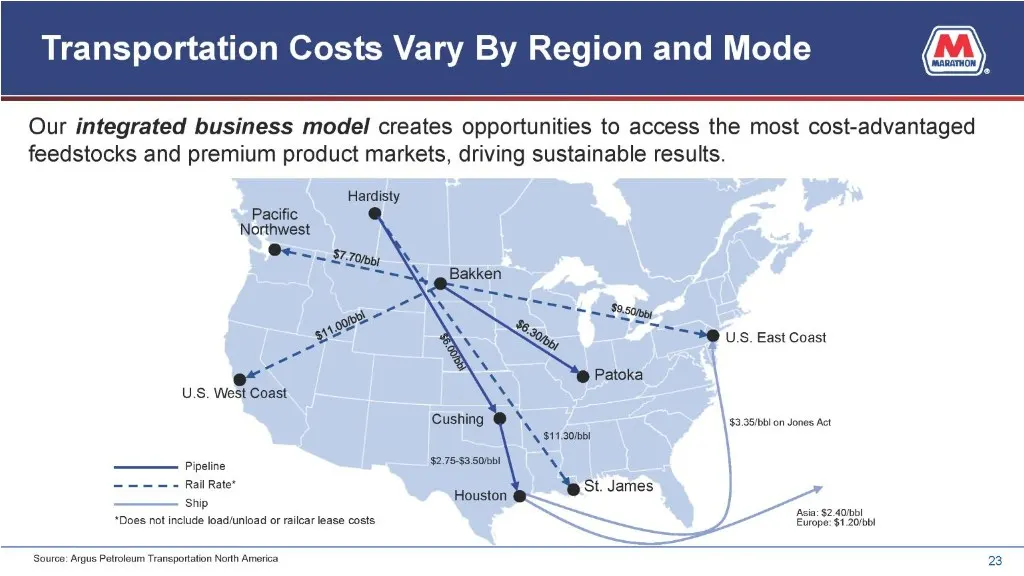
Slide 23: Transportation Costs Vary By Region and Mode
Transportation Costs Vary By Region and Mode Our integrated business model creates opportunities to access the most cost-advantaged feedstocks and premium product markets, driving sustainable results. Hardisty Pacific Northwest >@ U.S. East Coast U.S. West Coast \ s3.35:bbI on Jones Act \ '\ $11.30%
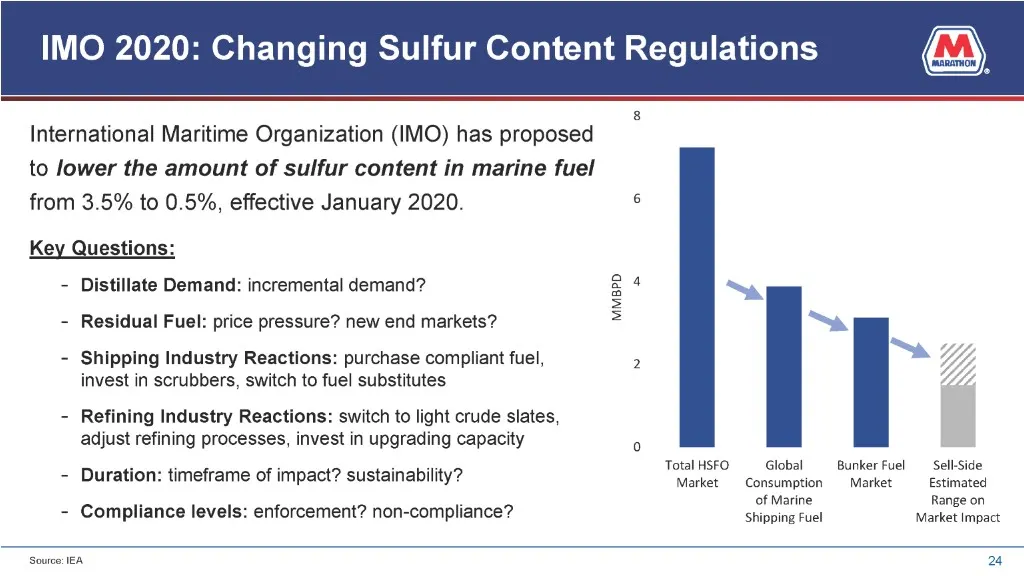
Slide 24: IMO 2020: Changing Sulfur Content Regulations
IMO 2020: Changing Sulfur Content Regulations International Maritime Organization (IMO) has proposed to lower the amount of sulfur content in marine fuel from 3.5% to 0.5%, effective January 2020. & Key Questions: - : 1? 24 late Demand: incremental demand’ 8 ™“~, - Residual Fuel: price pressure? new
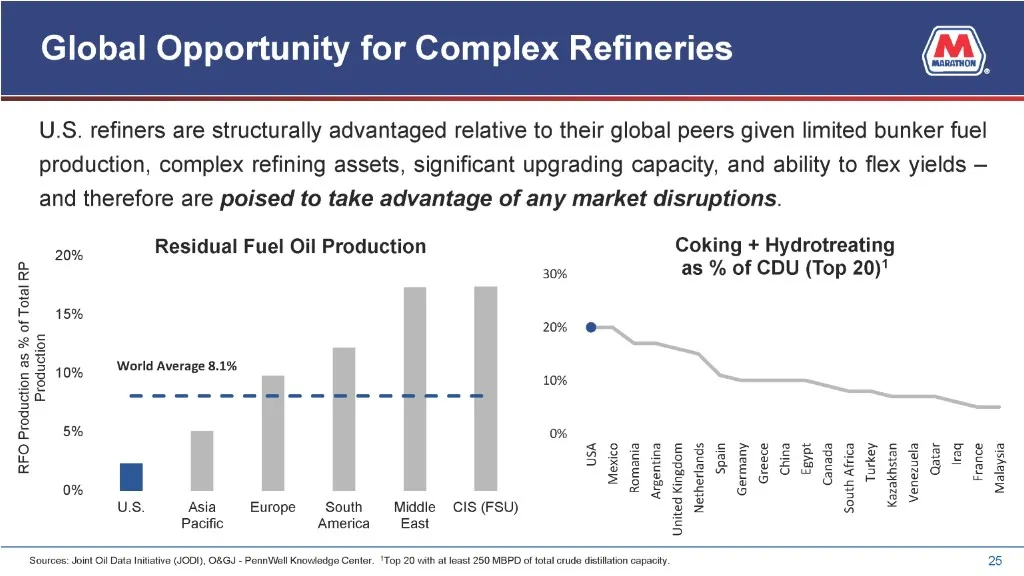
Slide 25: Global Opportunity for Complex Refineries
Global Opportunity for Complex Refineries U.S. refiners are structurally advantaged relative to their global peers given limited bunker fuel production, complex refining assets, significant upgrading capacity, and ability to flex yields — and therefore are poised to take advantage of any market disr
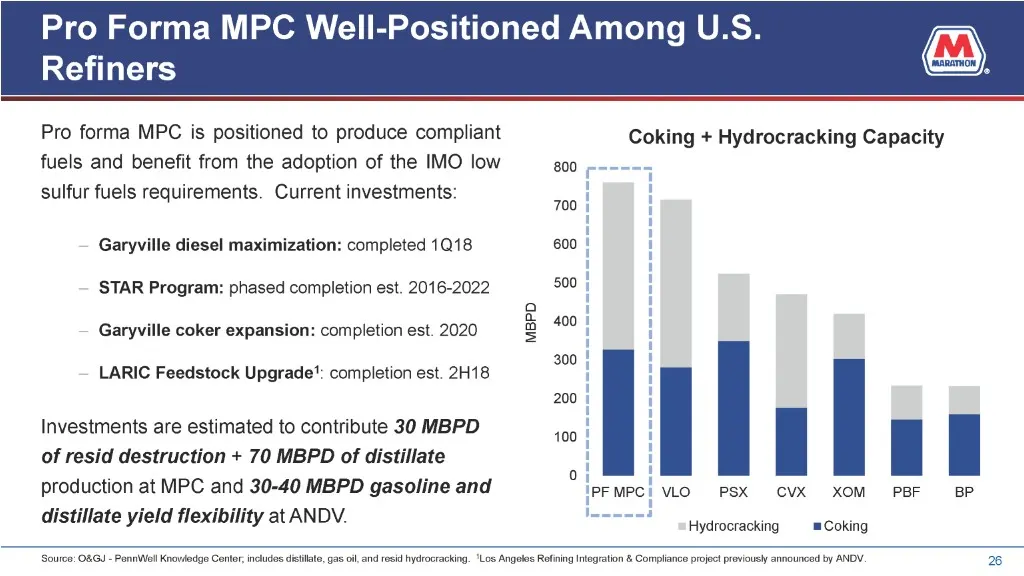
Slide 26: Pro Forma MPC Well-Positioned Among U.S. Refiners
Pro Forma MPC Well-Positioned Among U.S. Refiners Pro forma MPC is positioned to produce compliant cong + Hydrocracking Capacity fuels and benefit from the adoption of the IMO low 200 sulfur fuels requirements. Current investments: H ~ Garyville diesel maximization: completed 1018 600 ! ' 1 STAR Pro
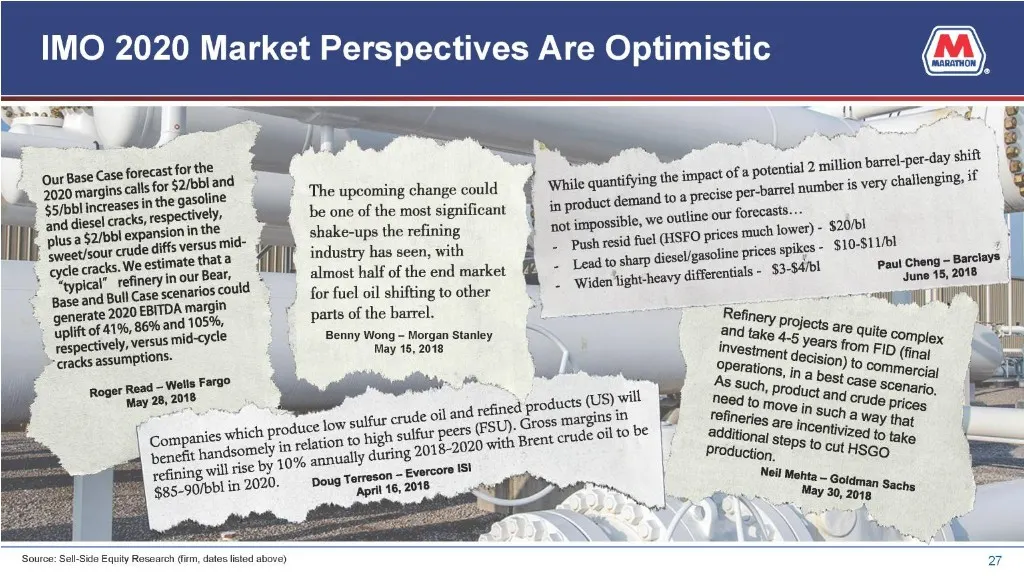
Slide 27: IMO 2020 Market Perspectives Are Optimistic
IMO 2020 Market Perspectives Are Optimistic — fa peti 2 million barrel-per-day shift § sse Case forecast fying the impact o} ilenging, if 2020 margins eal for $2/00 908 ‘The upcoming change could ‘While quantifying ita per-barrel ‘number is very challenging, : Ssybblinceases inthe gee be one of the
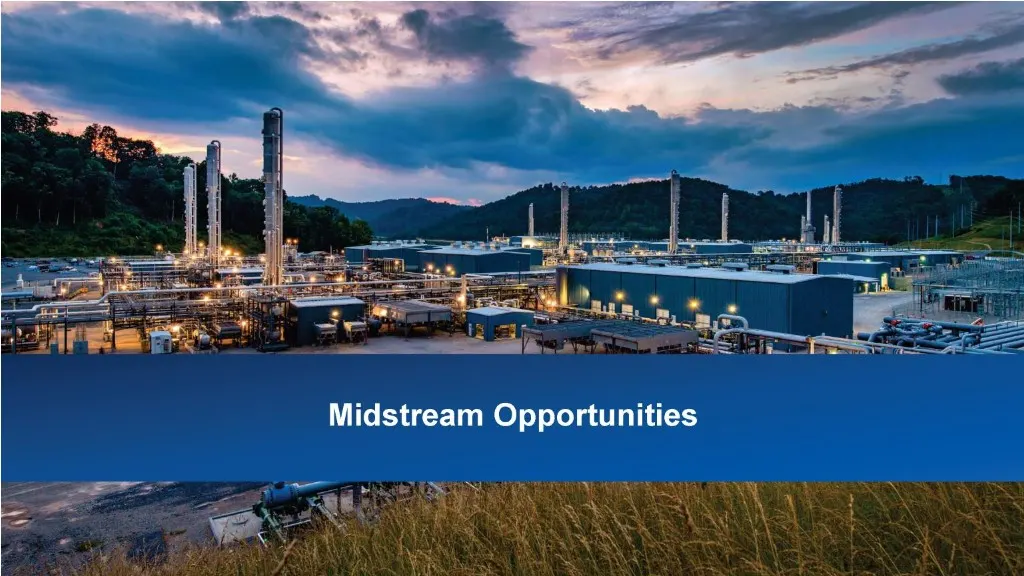
Slide 28: Midstream Opportunities
Slide 29: Macro Infrastructure Backdrop Positive
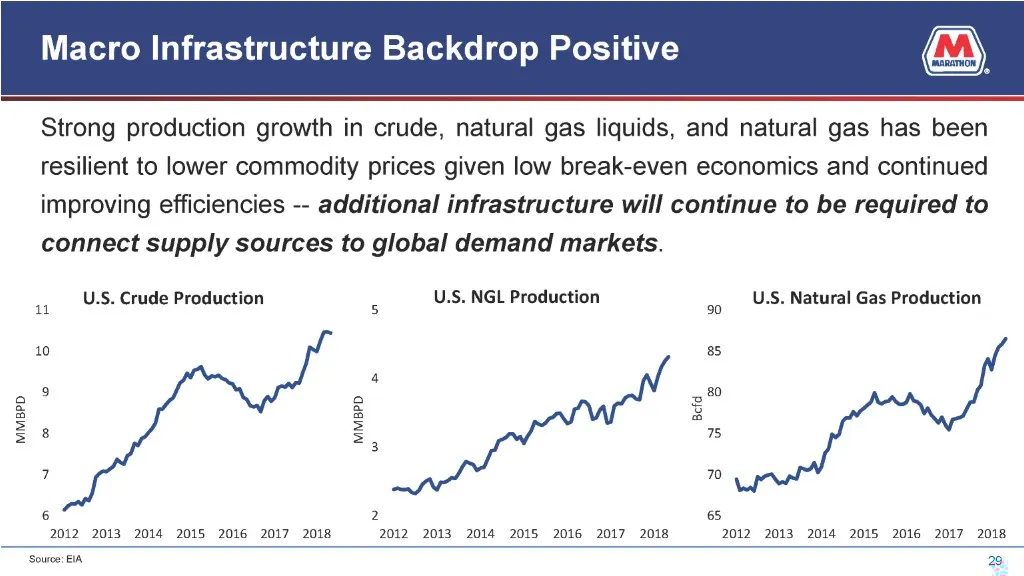
Macro Infrastructure Backdrop Positive Strong production growth in crude, natural gas liquids, and natural gas has been resilient to lower commodity prices given low break-even economics and continued improving efficiencies -- additional infrastructure will continue to be required to connect supply
Slide 30: Our Assets Positioned in Fastest Growth Basins
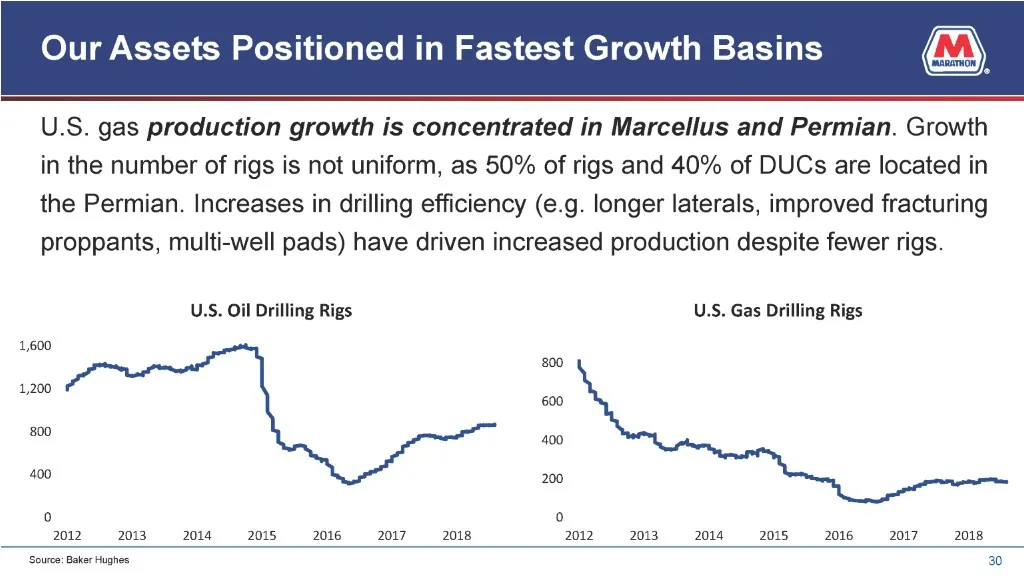
Our Assets Positioned in Fastest Growth Basins @, U.S. gas production growth is concentrated in Marcellus and Permian. Growth in the number of rigs is not uniform, as 50% of rigs and 40% of DUCs are located in the Permian. Increases in drilling efficiency (e.g. longer laterals, improved fracturing p
Slide 31: U.S. Natural Gas Production Growth
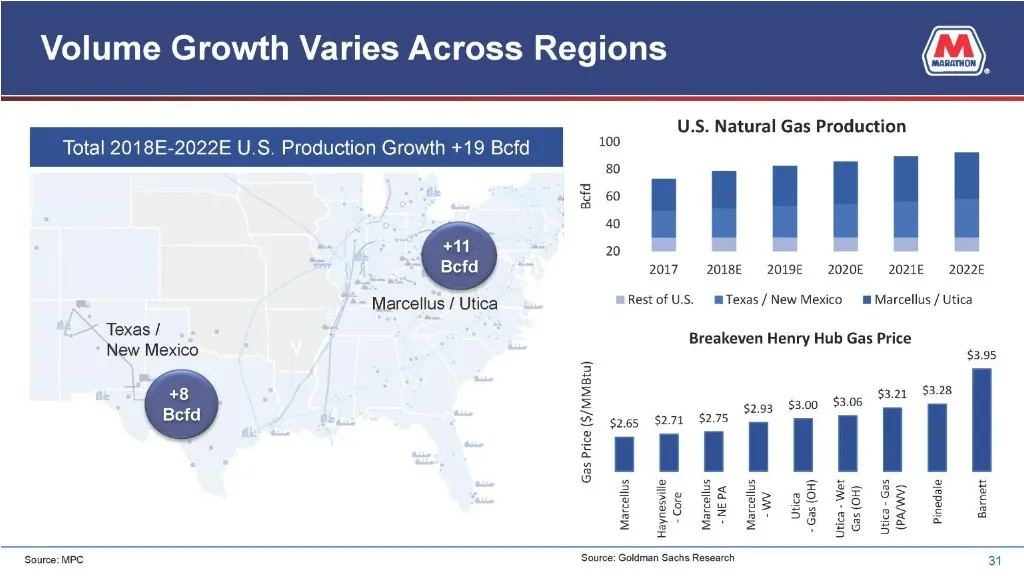
Texas / New Mexico +8 Befd in Growth +19 Bet Marcellus / Utica U.S. Natural Gas Production Befd 8 80 om A . A 20 2017 2018E «2019-2020 2021E ~—-2022E Rest of U.S. mTexas/New Mexico Marcellus / Utica Breakeven Henry Hub Gas Price $3.21 $3.00 $3.06 Gas Price ($/MMBtu) warcelis I Utica - Gas (PAW) $3.9
Slide 32: Infrastructure Needed to Connect Supply to Demand
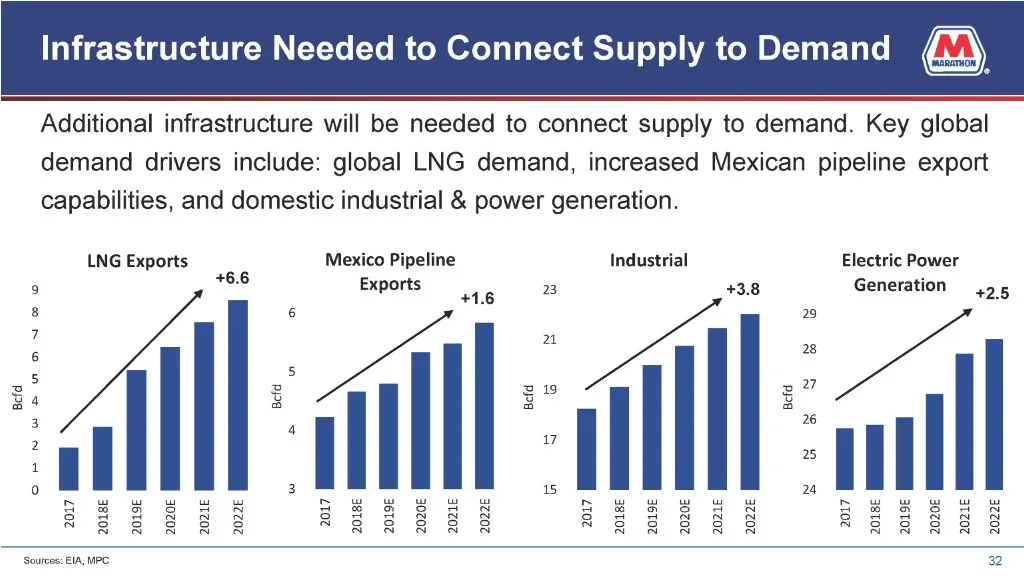
Infrastructure Needed to Connect Supply to Demand @, Additional infrastructure will be needed to connect supply to demand. Key global demand drivers include: global LNG demand, increased Mexican pipeline export capabilities, and domestic industrial & power generation. LNG Exports Mexico Pipeline Ind
Slide 33: NGLs Creating Processing & Fractionation Needs
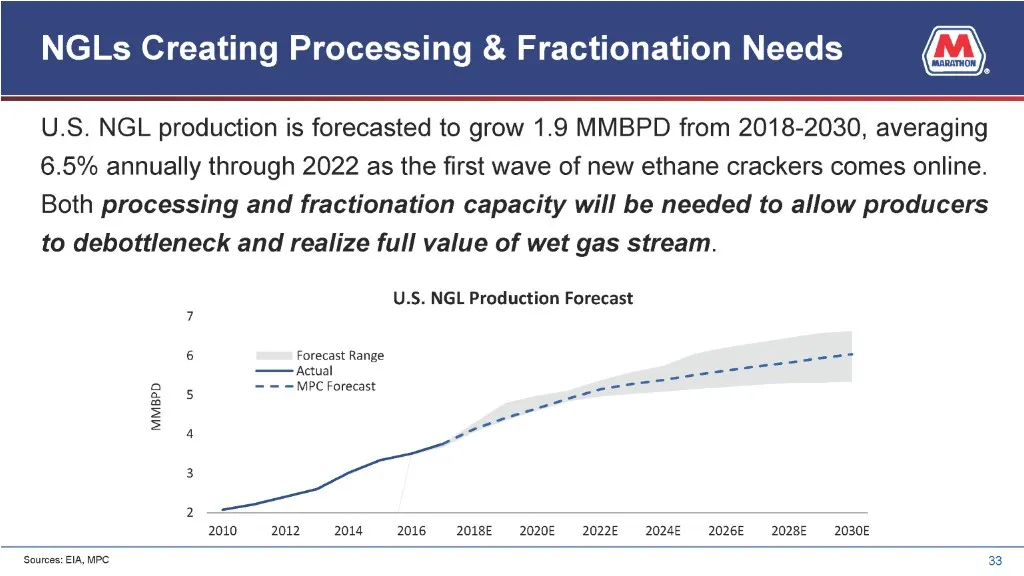
NGLs Creating Processing & Fractionation Needs @, U.S. NGL production is forecasted to grow 1.9 MMBPD from 2018-2030, averaging 6.5% annually through 2022 as the first wave of new ethane crackers comes online. Both processing and fractionation capacity will be Jed to allow prc to debottleneck and re

Slide 34: Marketing & Retail Trends
Slide 35: Marketing & Retail: Adapting to Changing Dynamics
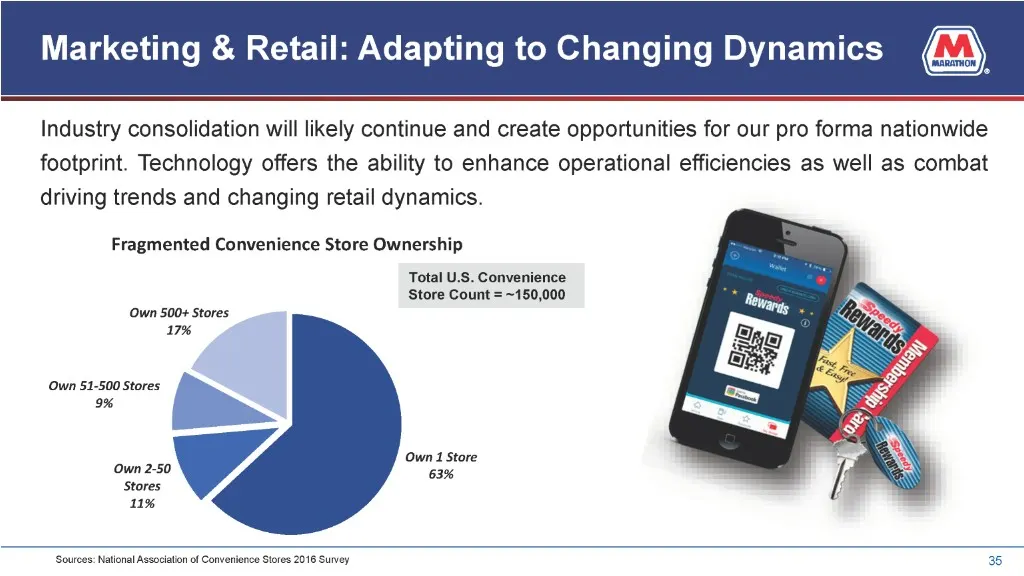
Marketing & Retail: Adapting to Changing D Industry consolidation will likely continue and create opportunities for our pro forma nationwide footprint. Technology offers the ability to enhance operational efficiencies as well as combat driving trends and changing retail dynamics. Ce i Store O1 Total
Slide 36: Speedway Light Product and Merchandise Sales
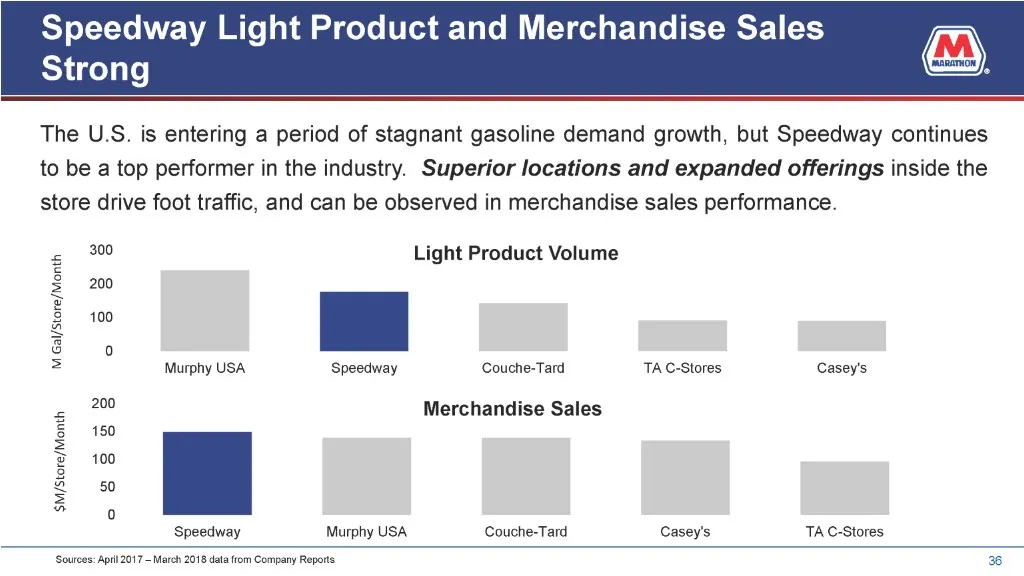
Speedway Light Product and Merchandise Sales Strong The U.S. is entering a period of stagnant gasoline demand growth, but Speedway continues to be a top performer in the industry. Superior locations and expanded offerings inside the store drive foot traffic, and can be observed in merchandise sales
Slide 37: Speedway — Top-tier Performer in C-Store Space
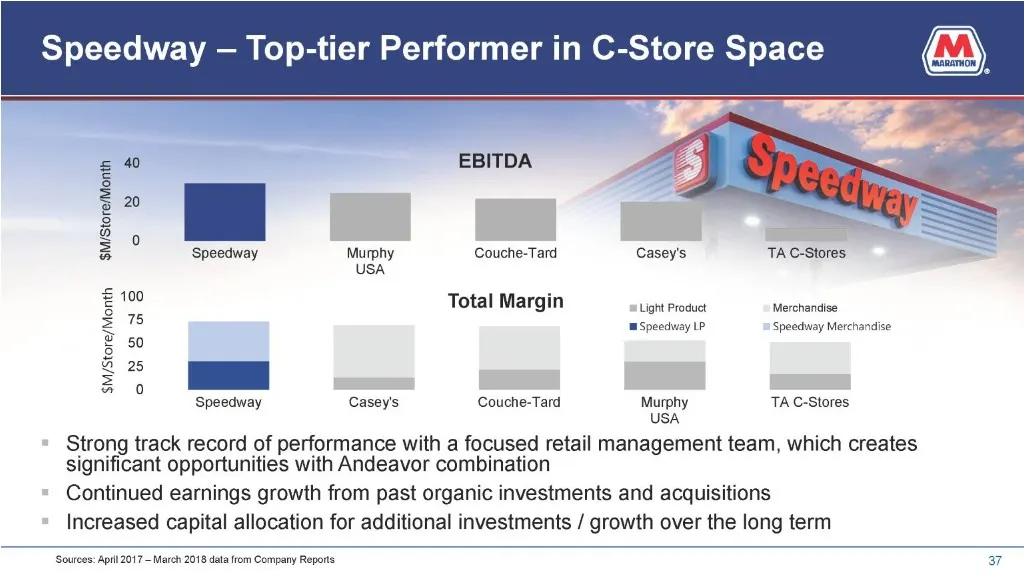
Speedway — Top-tier Performer in C-Store Space 40 EBITDA s = 20 5 Ss fa SS 28 2 ‘Speedway Murphy Couche-Tard Casey's TAC-Stores USA gto Total Margin Light Product Merchandise 2 75 sispeeaney speeuiay Mescrandiae ri § 50 & 25 = a 0 ‘Speedway Casey's Couche-Tard Murphy TAC-Stores USA Strong track reco
Slide 38: Andeavor Combination
SaaS Andeavor Combination
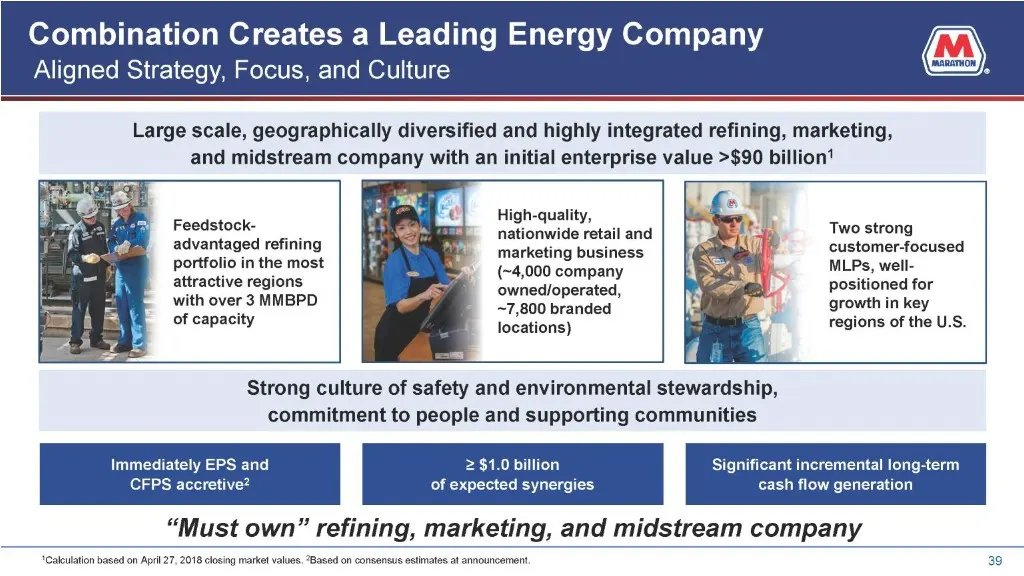
Slide 39: Combination Creates a Leading Energy Company
Combination Creates a Leading Energy Company Aligned Strategy, Focus, and Culture Large scale, geographically diversified and highly integrated refining, marketing, and midstream company with an initial enterprise value >$90 billion’ High-quality, - Fesusiocle. a4 nationwide retail and Two strong ad
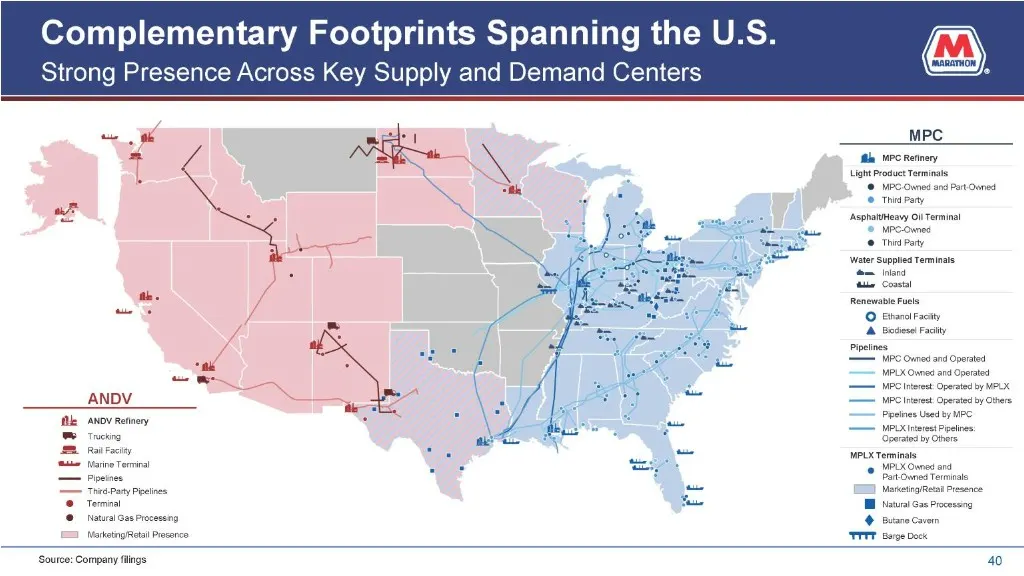
Slide 40: Complementary Footprints Spanning the U.S.
Complementary Footprints Spanning the U.S. Strong Presence Across Key Supply and Demand Centers [_WarkatngRet Source: Company flings 40
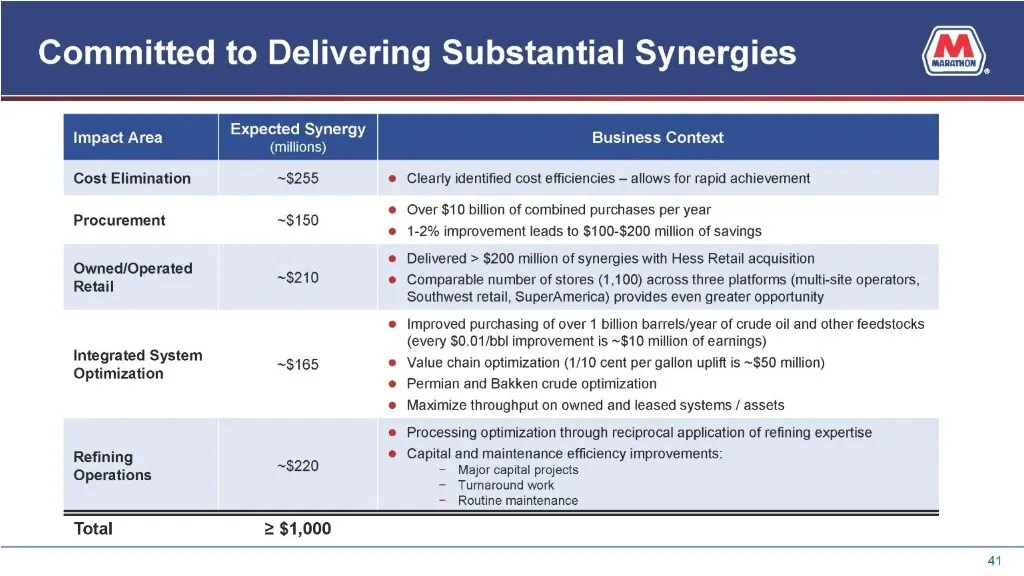
Slide 41: Committed to Delivering Substantial Synergies
Committed to Delivering Substantial Synergies Impact Area eee nes Business Context Cost Elimination ~$255 Clearly identified cost efficiencies — allows for rapid achievement Over $10 billion of combined purchases per year Procurement ~$150 iw © 1-2% improvement leads to $100-$200 million of savings
Slide 42: Opportunity for Significant Shareholder Value Creation
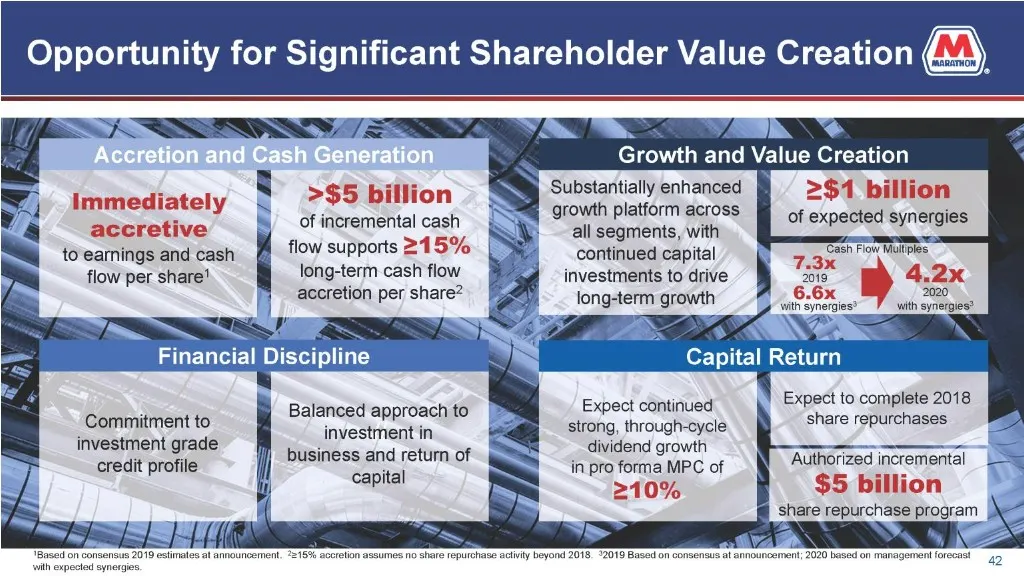
Opportunity for Significant Shareholder Value Creation = SSRISSAS Immediately g >$5 billion v 4a accretive | of incremental cash 9 i to earnings and cash flow supports 215% flow per share’ long-term cash flow accretion per share? Commitment to Sati Na ae i investment grade i i ‘| business and return

Slide 43: Conclusion
a "| Conclusion
Slide 44: Pro Forma MPC — A Leading Energy Company
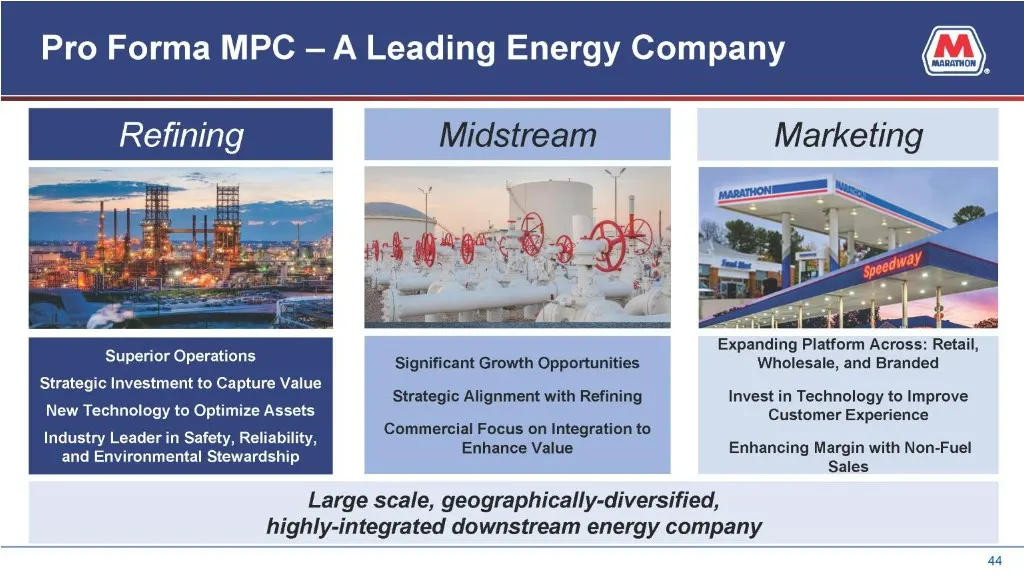
Pro Forma MPC — A Leading Energy Company Midstream Marketing See ORaa Expanding Platform Across: Retail, Growth O; iti , and Branded Strategic Investment to Capture Value owe - _. . Strategic Alignment with Refining Invest in Technology to Improve New Technology to Optimize Assets Customer Experienc

Slide 45: Marathon
MARATHON ®
Slide 46: Appendix
Appendix
Slide 47: MPC EBITDA Reconciliation
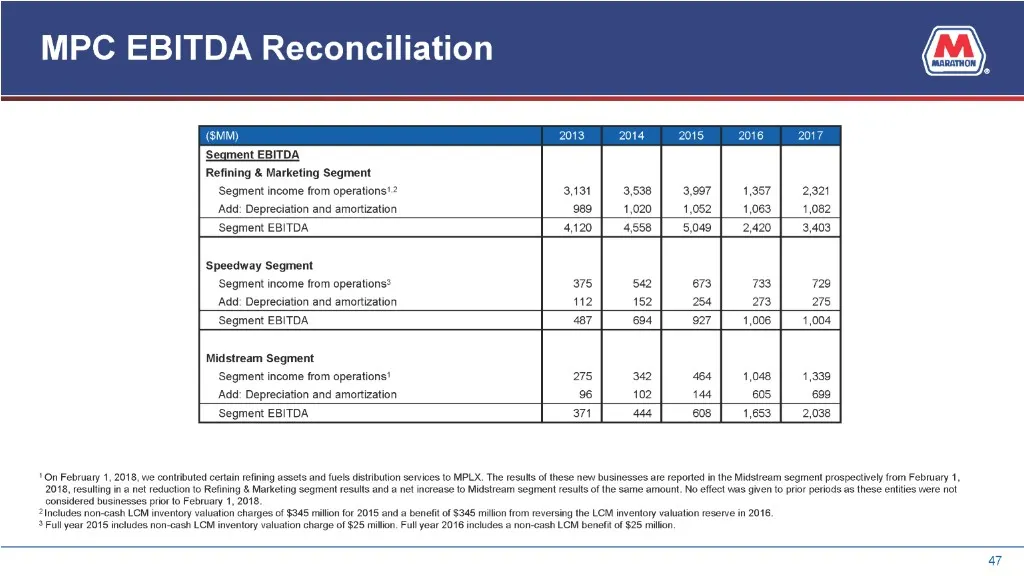
MPC EBITDA Reconciliation ‘Seament EBITDA Refining & Marketing Segment ‘Segment income from operations!? ast | 3508} 3907 | 1,357 | 2921 ‘Add: Depreciation and amortization sea | 1020 | 1,052 | 1,063 | 1,082 ‘Segment EBITDA ‘Speedway Segment ‘Segment income from operations? 375 542 era 733 729 ‘Add:
Slide 48: Speedway EBITDA and Total Margin Reconciliation
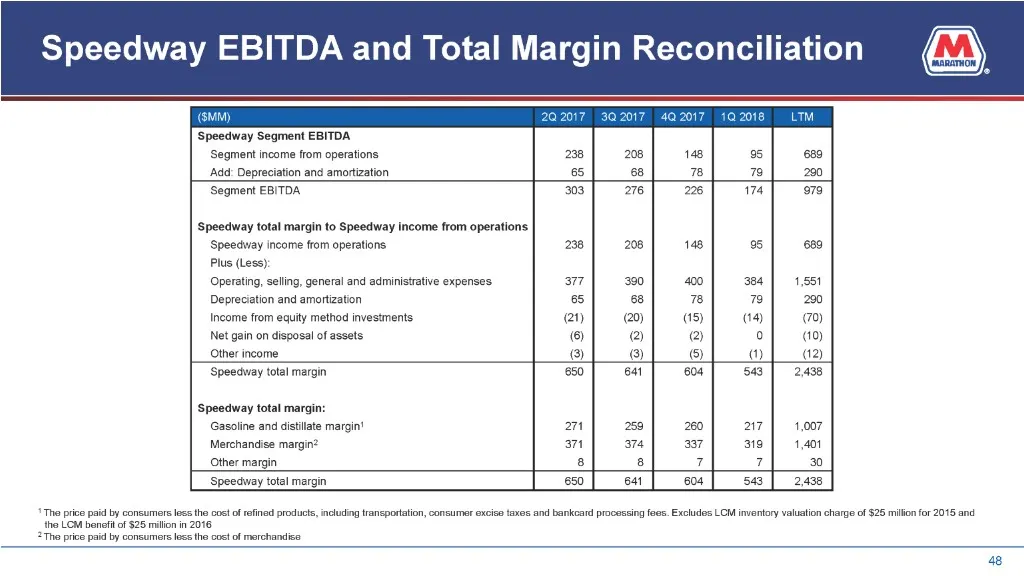
Speedway EBITDA and Total Margin Reconciliation ‘Speedway Segment EBITDA ‘Segment income from operations 238 208, 148 9s 659 ‘Add: Depreciation 65 68 7B 79 200 ‘Segment EBITDA 303 76 226 174 O79 Speedvay income from operations 238 208 148 8 669 Plus (Less): Operating, seling, general and administrat
Slide 49: Committed to Delivering Substantial Synergies
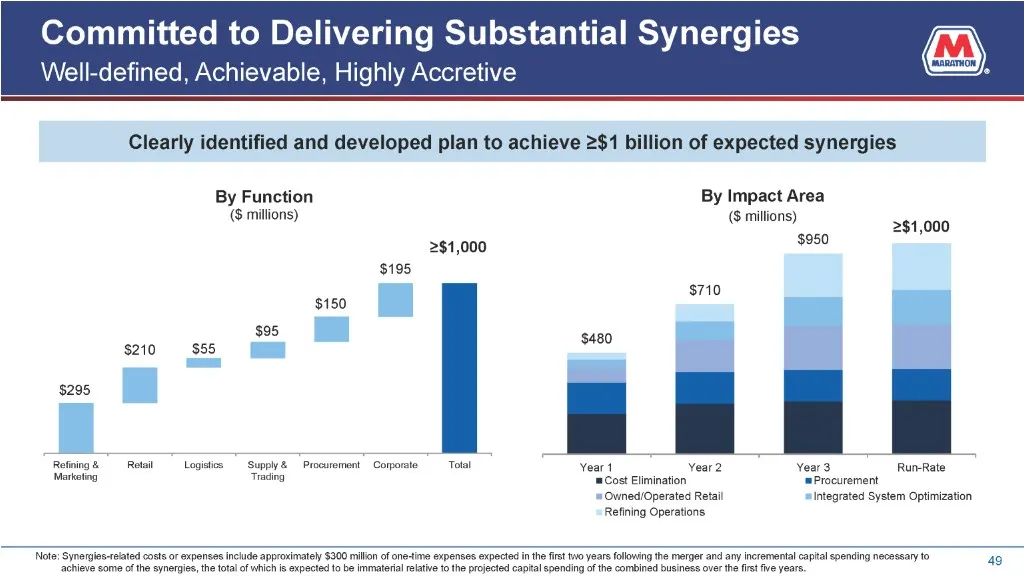
Committed to Delivering Substantial Synergies Well-defined, Achievable, Highly Accretive Clearly identified and developed plan to achieve 2$1 billion of expected synergies By Function By Impact Area (S millions) (S millions) >$1,000 2$1,000 soso $195 $710 $150 ss $480 s2i0 S55 = « — Refining & Retai
Slide 50: MPC and Andeavor Strategic Evolutions
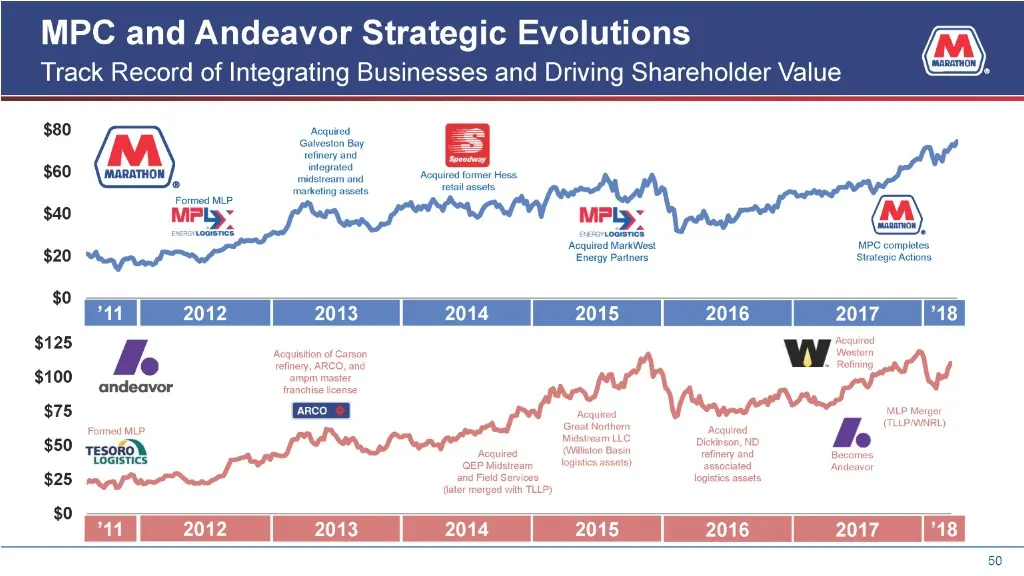
MPC and Andeavor Strategic Evolutions Track Record of Integrating Businesses and Driving Shareholder Value $80 Acquited Galveston Bay $60 ea Hess, le retail assets rn Formed - MPly- MPC compiotes Acquired MarkWest Strategie Actions nexgy Partners ° $125 iA ‘Acquistion of Carson Ww = refinery, ARCO,
Slide 51: MPC Track Record of Executing and Integrating Large Transactions
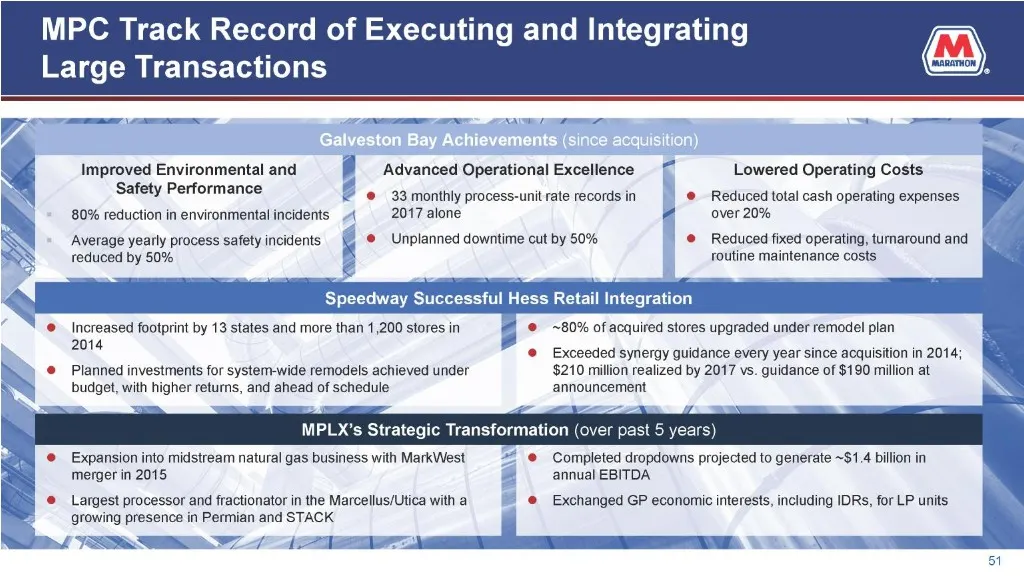
MPC Track Record of Executing and Integrating Large Transactions a Improved Environmental and ff) _—_ Advanced Operational Excellence = Lowered Operating Costs Safety Performance © © 33 monthly process-unit rate records in © Reduced total cash operating expenses 80% reduction in environmental incide
Slide 52: Diversified Large-Scale U.S. Refining Portfolio
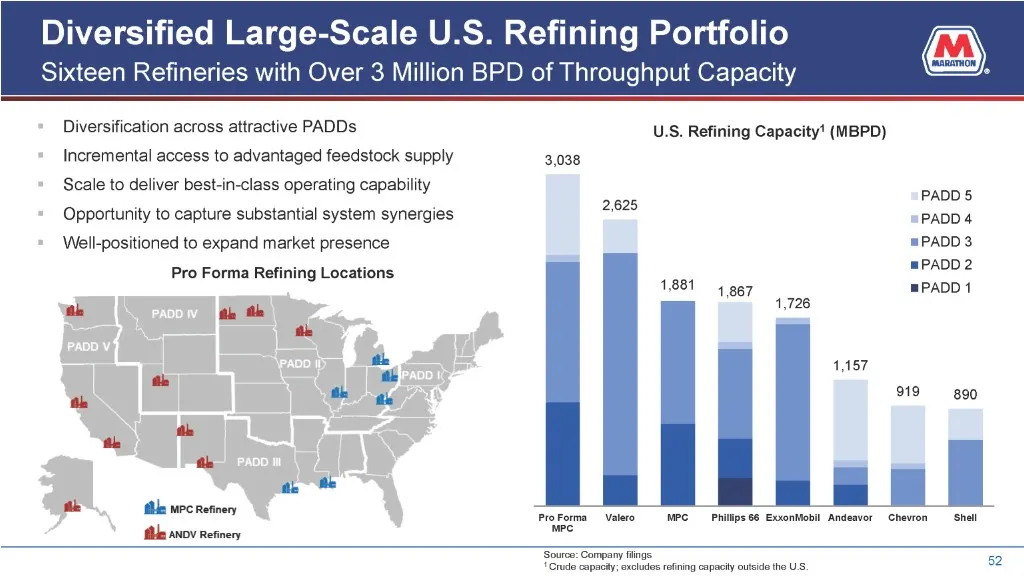
Diversified Large-Scale U.S. Refining Portfolio Sixteen Refineries with Over 3 Million BPD of Throughput Capacity Diversification across attractive PADDs Incremental access to advantaged feedstock supply Scale to deliver best-in-class operating capability Opportunity to capture substantial system sy
Slide 53: Geographic Diversification Increases Exposure to Attractive Margins
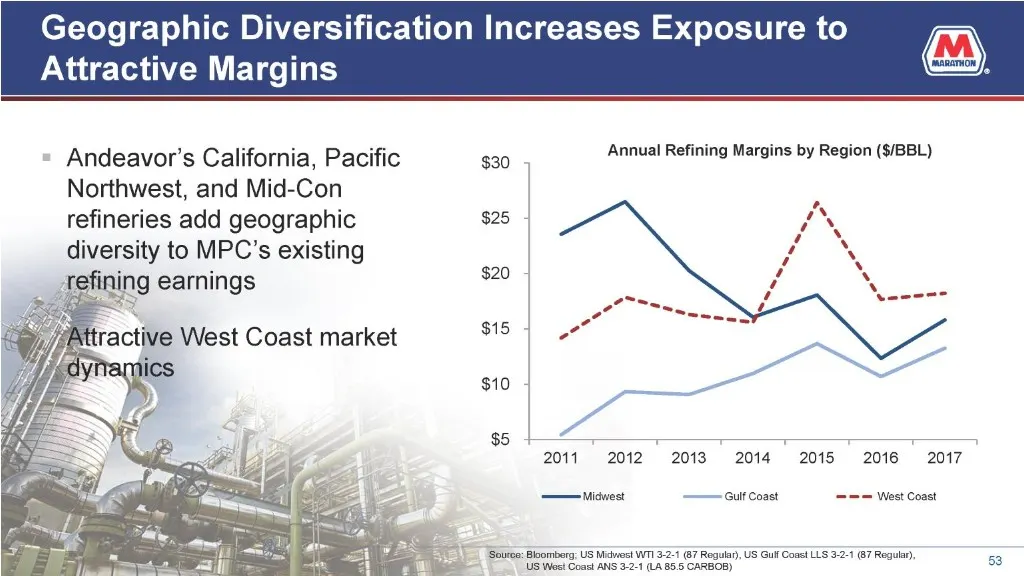
Geographic Diversification Increases Exposure to Attractive Margins Andeavor’s California, Pacific Northwest, and Mid-Con refineries add geographic diversity to MPC’s existing refining earnings Annual Refining Margins by Region ($/BBL) 2011 2012. «2013 2014 2015 2016 = 2017 Midwest Gulf Coast === We
Slide 54: Pro Forma Capital Structure
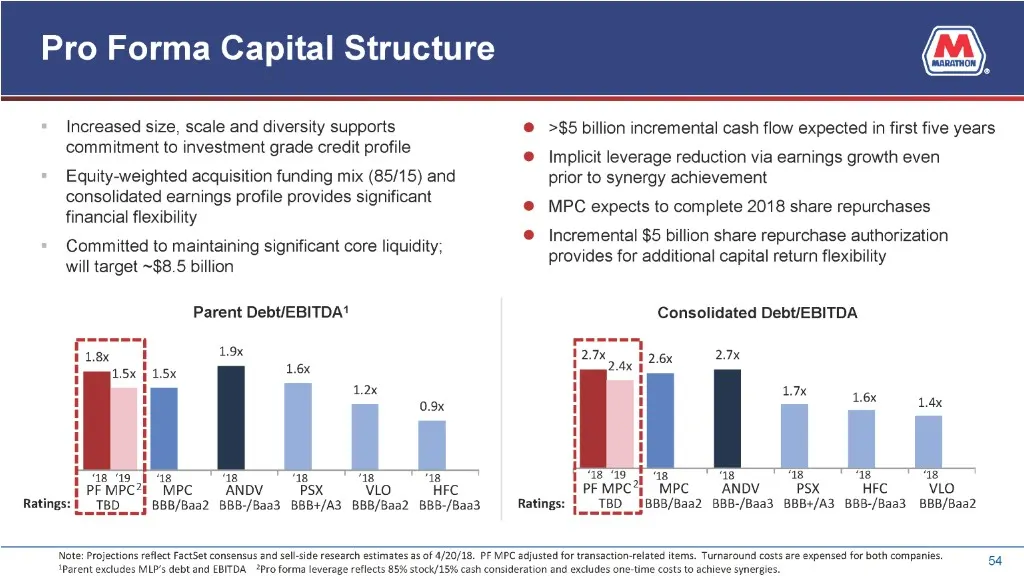
Pro Forma Capital Structure Increased size, scale and diversity supports commitment to investment grade credit profile >$5 billion incremental cash flow expected in first five years Implicit leverage reduction via earnings growth even Equity-weighted acquisition funding mix (85/15) and prior to syne
Slide 55: MPC and ANDV Mexico Opportunities
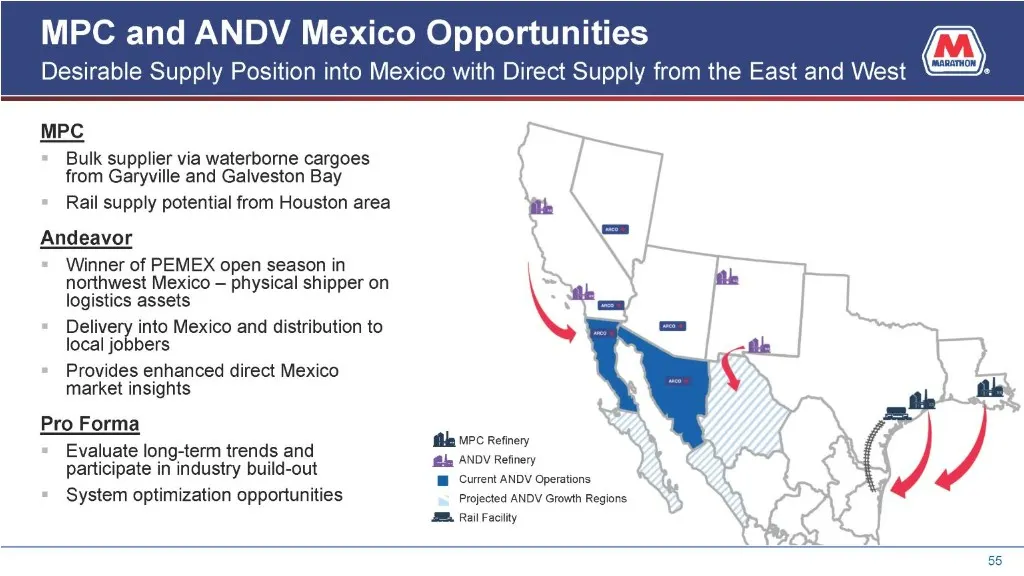
MPC and ANDV Mexico Opportunities Desirable Supply Position into Mexico with Direct Supply from the East and West MPC Bulk supplier via waterborne cargoes from Garyville and Galveston Bay Rail supply potential from Houston area Andeavor Winner of PEMEX open season in northwest Mexico — physical ship
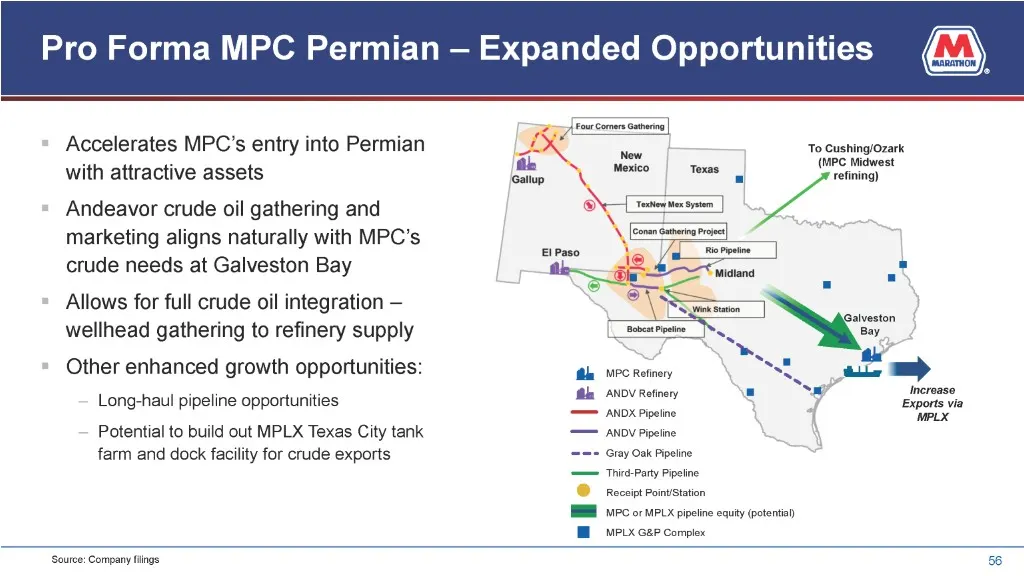
Slide 56: Pro Forma MPC Permian — Expanded Opportunities
Pro Forma MPC Permian — Expanded Opportunities Accelerates MPC’s entry into Permian with attractive assets To Cushing/Ozark (MPC Midwest refining) » Andeavor crude oil gathering and marketing aligns naturally with MPC’s crude needs at Galveston Bay Allows for full crude oil integration — wellhead ga
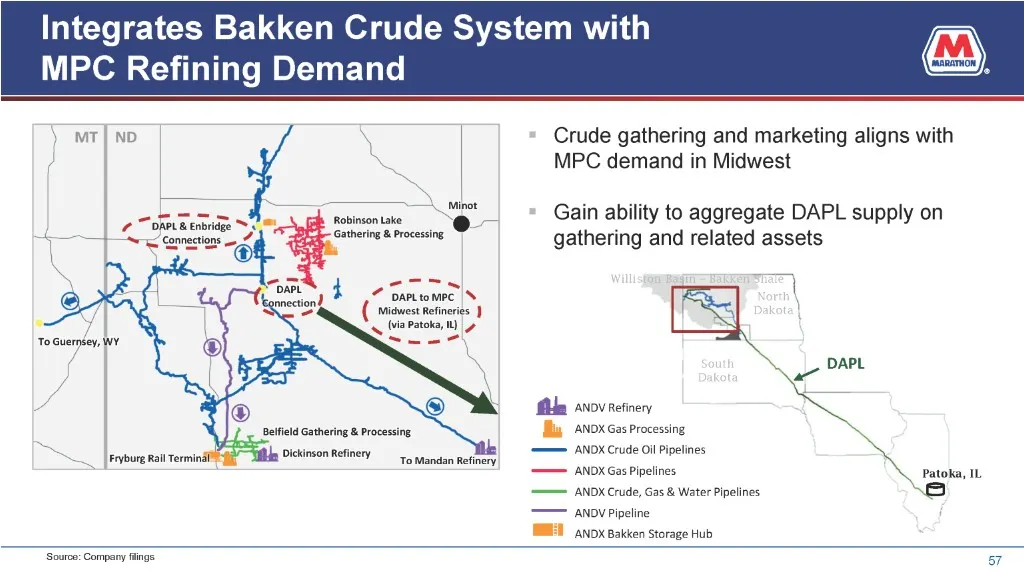
Slide 57: Integrates Bakken Crude System with MPC Refining Demand
Integrates Bakken Crude System with MPC Refining Demand » Crude gathering and marketing aligns with MPC demand in Midwest Ceres Ye * Gain ability to aggregate DAPL supply on Roe leer ly gathering and related assets aes l| et @ papttomec |S =a (mowes teteres } (via Pato, 1) NEE EELC APL Enbridge “~ <
Slide 58: Marathon Petroleum Corporation
\, Marathon : ), Petroleum Corporation , cn" a
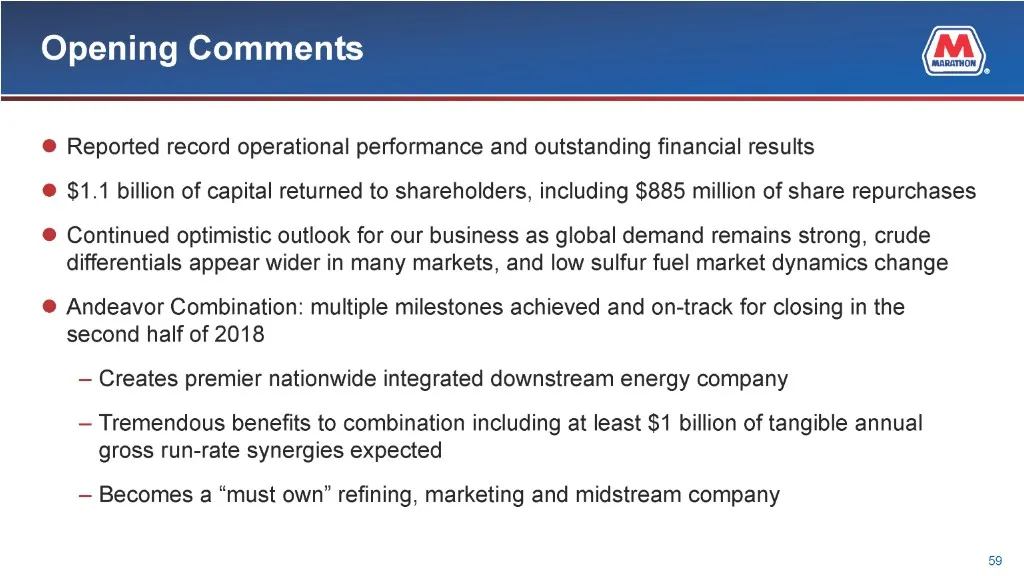
Slide 59: Opening Comments
Opening Comments @ Reported record operational performance and outstanding financial results @ $1.1 billion of capital returned to shareholders, including $885 million of share repurchases © Continued optimistic outlook for our business as global demand remains strong, crude differentials appear wid
Slide 60: Second-Quarter Highlights
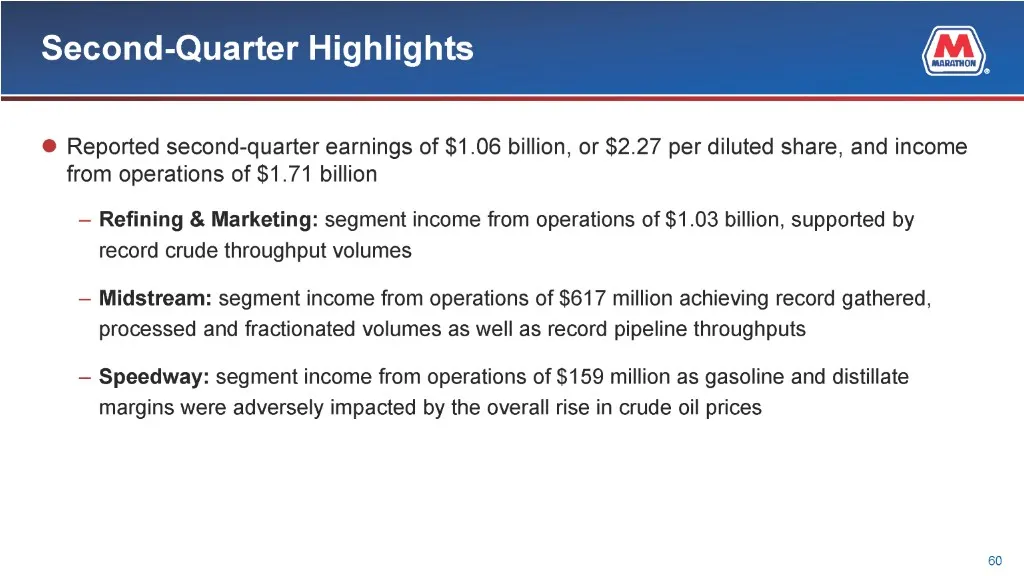
Second-Quarter Highlights @ Reported second-quarter earnings of $1.06 billion, or $2.27 per diluted share, and income from operations of $1.71 billion — Refining & Marketing: segment income from operations of $1.03 billion, supported by record crude throughput volumes — Midstream: segment income fro
Slide 61: Second-Quarter 2018 Earnings
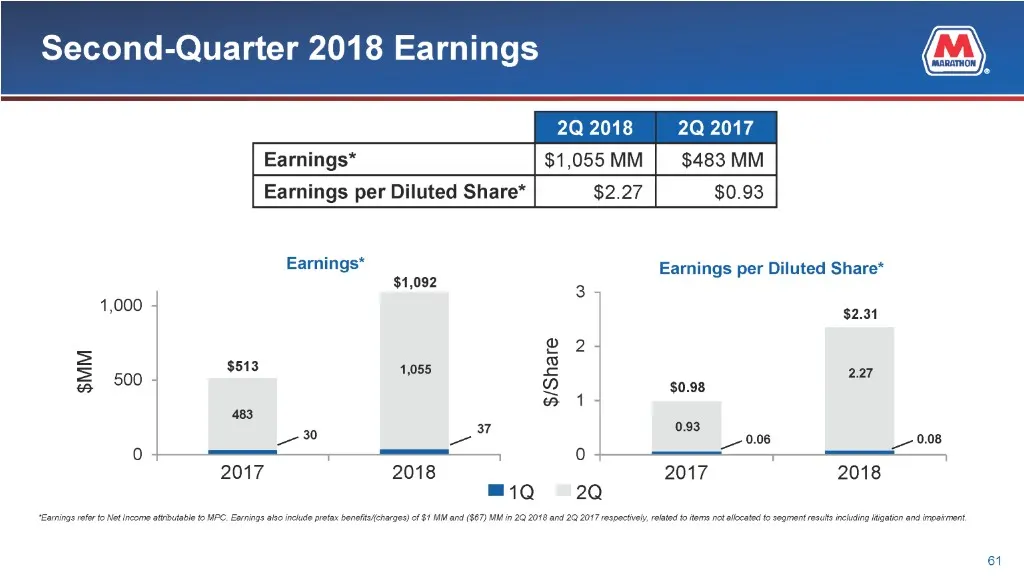
Second-Quarter 2018 Earnings 2Q 2018 2Q 2017 Earnings* $1,055 MM | $483 MM | Earnings per Diluted Share* | $2.27 | $0.93 | Earnings" Earnings per Diluted Share* $1,092 3 1,000 $2.31 22 2 i $513 1,055 3 500 G $0.98 ams eo 1 483 30 7 0.93 F & = Fy 0.06 0.08 2017 2018 2017 2018
Slide 62: Earnings: 2Q 2018 vs. 2Q 2017 Variance Analysis
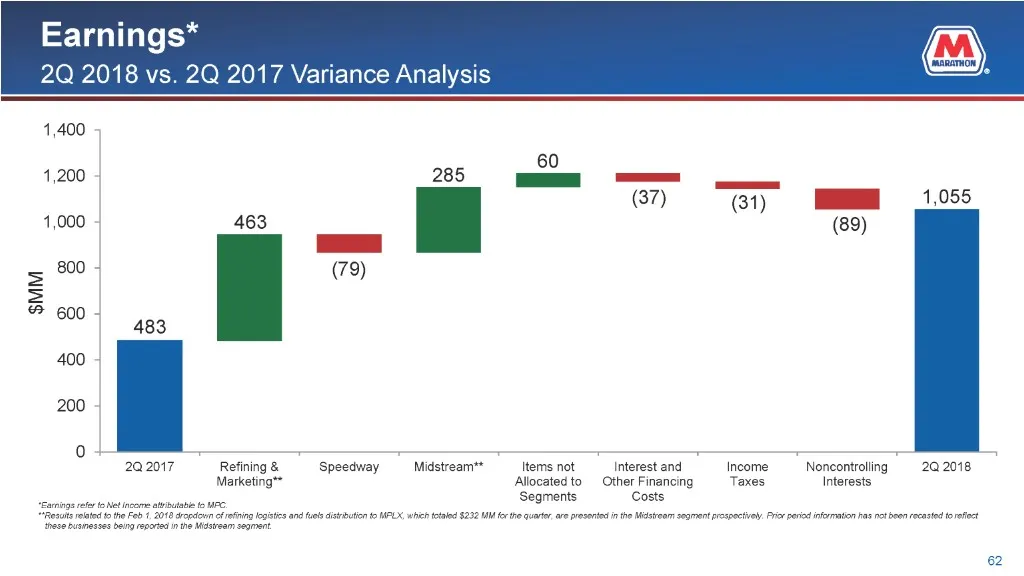
Earnings* 2Q 2018 vs. 2Q 2017 Variance Analysis (37) Go) i” 4,000 463 (89) =i = 800 (79) 3 600 483 400 200 202017 ‘Refining & “Speedway —-Midsteam™ items not__Interestand Income Noncontroling Marketing’ interests Allocated to Other Financing Taxes Costs 1,055 202018 ‘eve uamesse bing repaid inthe Mi
Slide 63: Refining & Marketing Segment Income
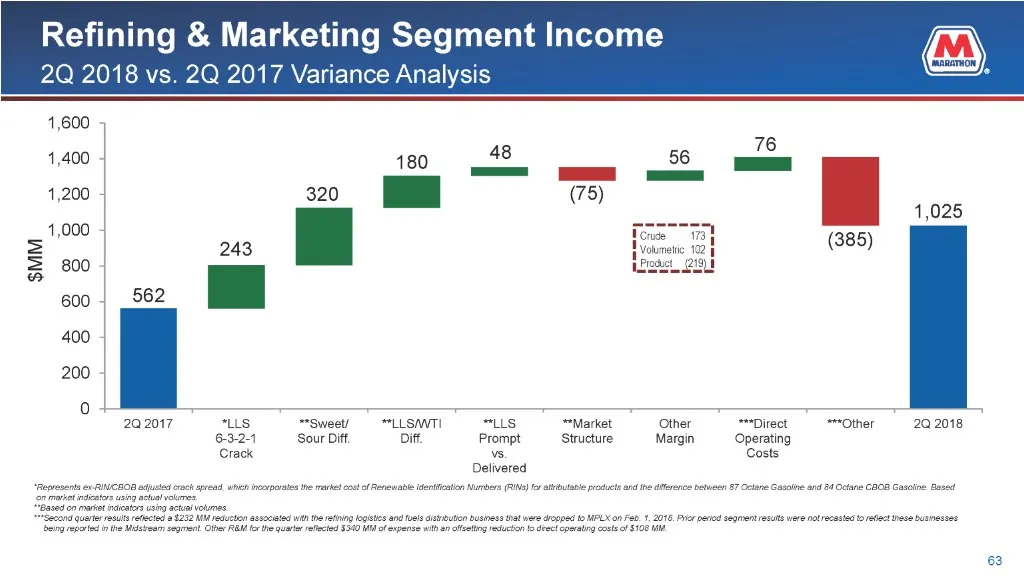
Refining & Marketing Segment Income 2Q 2018 vs. 2Q 2017 Variance Analysis 48 56 76 180 7 — = 78) 1,025 =Eay vide 13, rae 12 | (385) 202017 “us. “sweet! “LLSWTI “LS Market Other ‘Direct "Other «20.2018 632-4 ‘Sour Diff. Diff. Prompt Structure Margin Operating Crack vs. Delivered ning eg "S50 mt
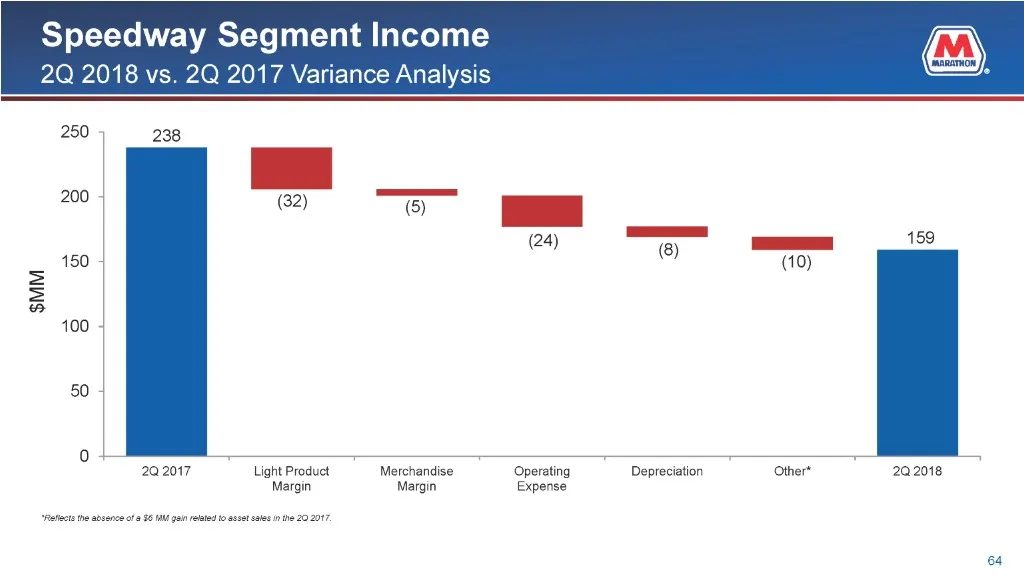
Slide 64: Speedway Segment Income
$MM Speedway Segment Income 2Q 2018 vs. 2Q 2017 Variance Analysis 250 200 150
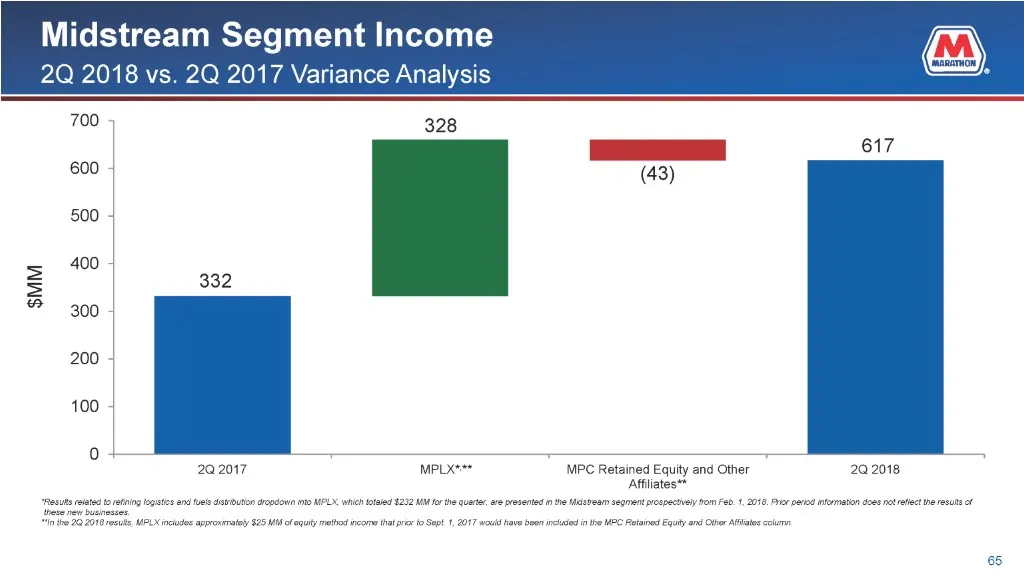
Slide 65: Midstream Segment Income
Midstream Segment Income 2Q 2018 vs. 2Q 2017 Variance Analysis 20.2017 MPLX*** MPC Retained Equity and Other 20 2018 Affliates
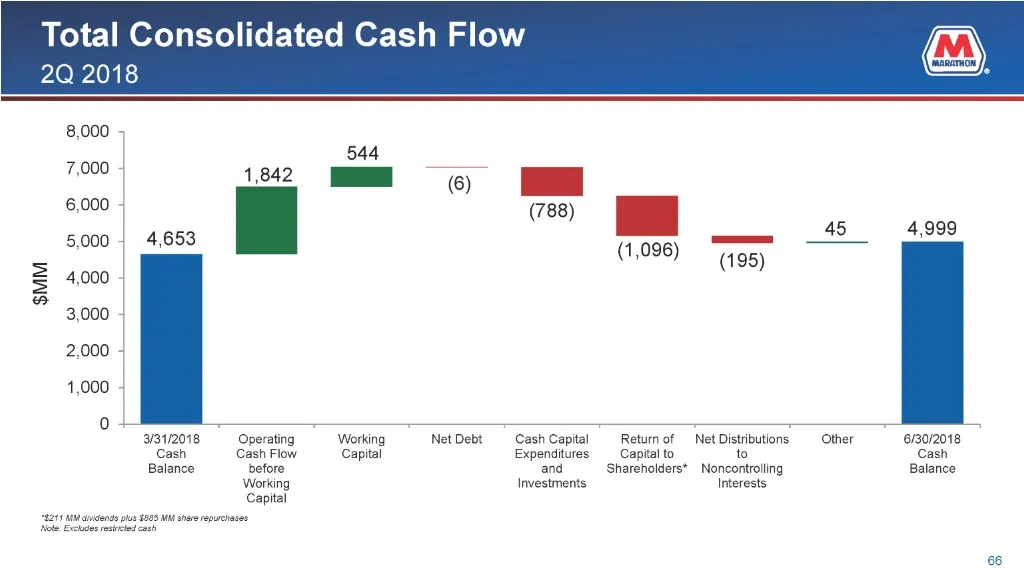
Slide 66: Total Consolidated Cash Flow
Total Consolidated Cash Flow 2Q 2018 8,000 7,000 _ , 0 6,000 (788) 5,000 | 4,653 wee 45 4,999 i (1,096) "ion 2 4,000 Mee) 2 4 A 3,000 2,000 4,000 31/2018 Operating Working Net Debt Cash Capital Return of Net Distributions. Other 6/30/2018 Cash GashFlow = Capital Expenditures _ Canty . Cash Balance b
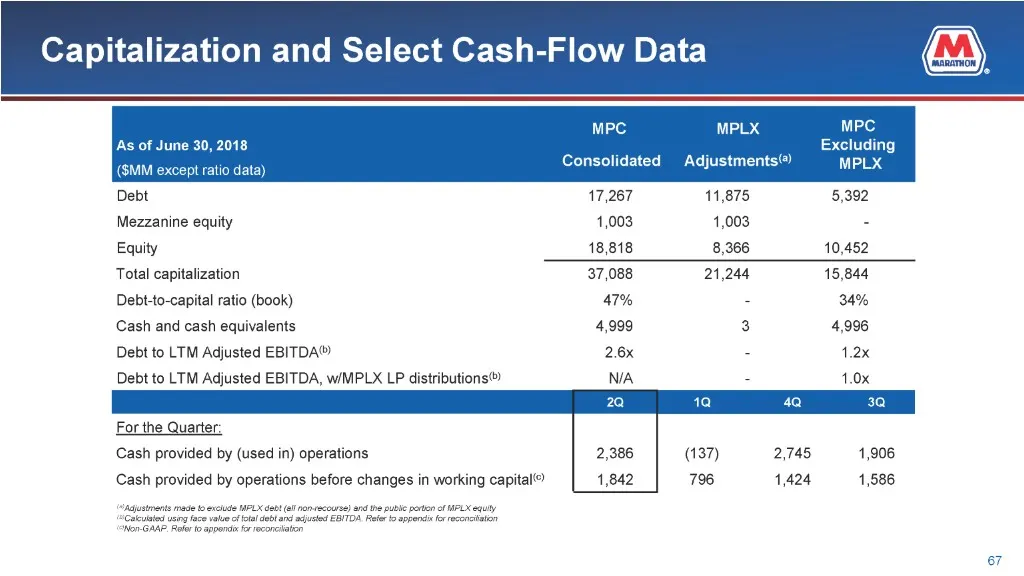
Slide 67: Capitalization and Select Cash-Flow Data
Capitalization and Select Cash-Flow Data MPC MPLX MPC As of June 30, 2018 Excluding LSE Consolidated Adjustments‘) PLX Debt 17,267 11,875 5,392 Mezzanine equity 1,003 1,003 - Equity 18,818 8,366 10,452 Total capitalization 37,088 21,244 15,844 Debt-to-capital ratio (book) 47% 2 34% Cash and cash equ
Slide 68: 3Q 2018 Outlook
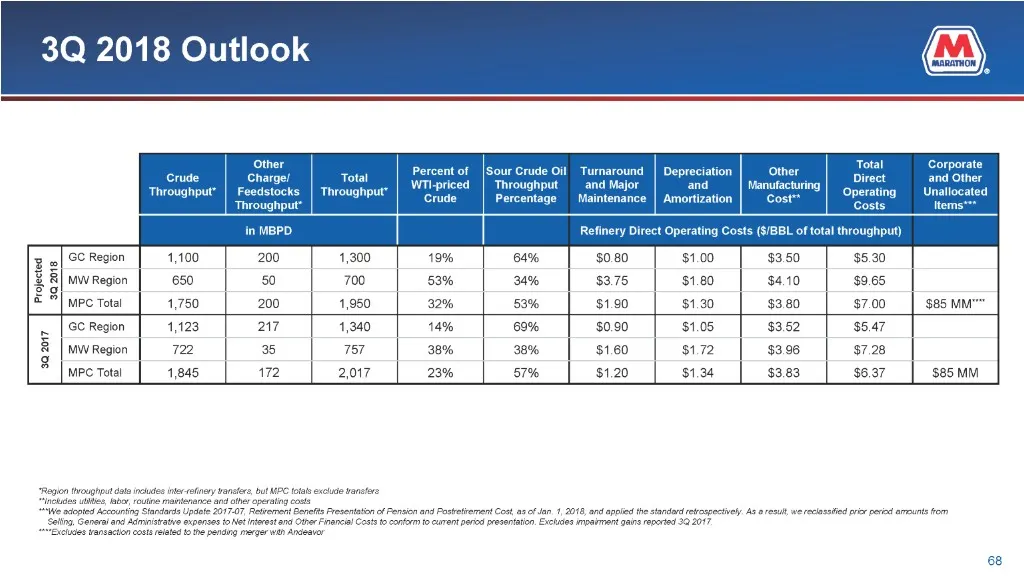
3Q 2018 Outlook her Percent of Cre) Wml-priced Throughput” Crude [Sour Crude Oil Throughput Percents Turnaround | Depreciation ‘age Maintenance | Amortization Total Corporate and Other Unallocated ltems* galeron | 1100 | 200 | ss | tom | ome | saan | sion | sas | $500 cs so 700 | sa | am | save | si
Slide 69: Marathon Petroleum Corporation
\, Marathon : ), Petroleum Corporation , cn" a
Slide 70: MPLX - Second-Quarter Highlights
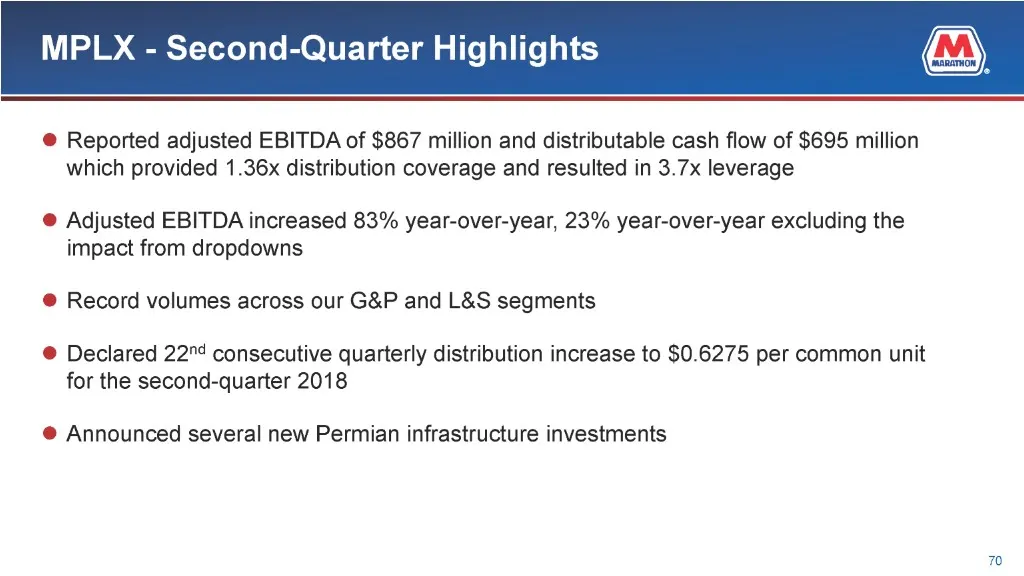
MPLX - Second-Quarter Highlights © Reported adjusted EBITDA of $867 million and distributable cash flow of $695 million which provided 1.36x distribution coverage and resulted in 3.7x leverage @ Adjusted EBITDA increased 83% year-over-year, 23% year-over-year excluding the impact from dropdowns @ Re
Slide 71: MPLX - Logistics & Storage Segment
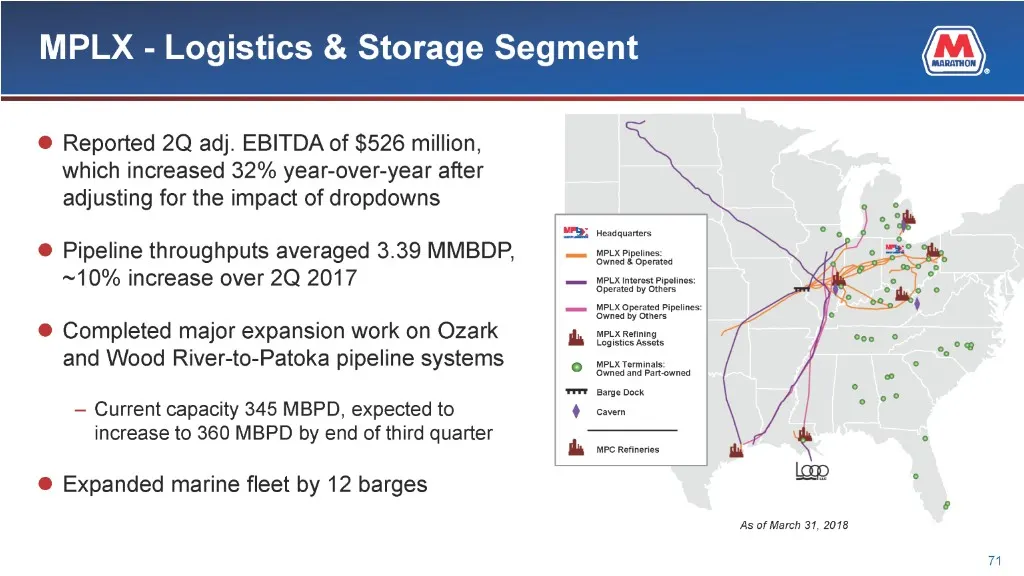
MPLX - Logistics & Storage Segment @ Reported 2Q adj. EBITDA of $526 million, which increased 32% year-over-year after adjusting for the impact of dropdowns @ Pipeline throughputs averaged 3.39 MMBDP, ~10% increase over 2Q 2017 @ Completed major expansion work on Ozark and Wood River-to-Patoka pipel
Slide 72: MPLX - Gathering & Processing Segment
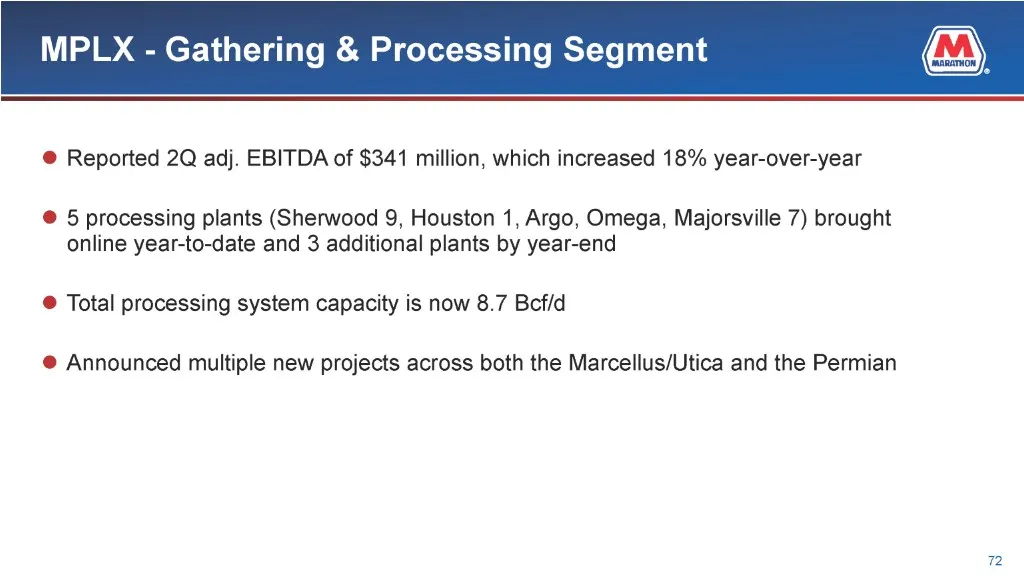
MPLX - Gathering & Processing Segment © Reported 2Q adj. EBITDA of $341 million, which increased 18% year-over-year @ 5 processing plants (Sherwood 9, Houston 1, Argo, Omega, Majorsville 7) brought online year-to-date and 3 additional plants by year-end ® Total processing system capacity is now 8.7
Slide 73: MPLX - Gathering & Processing Segment: Marcellus & Utica Operations
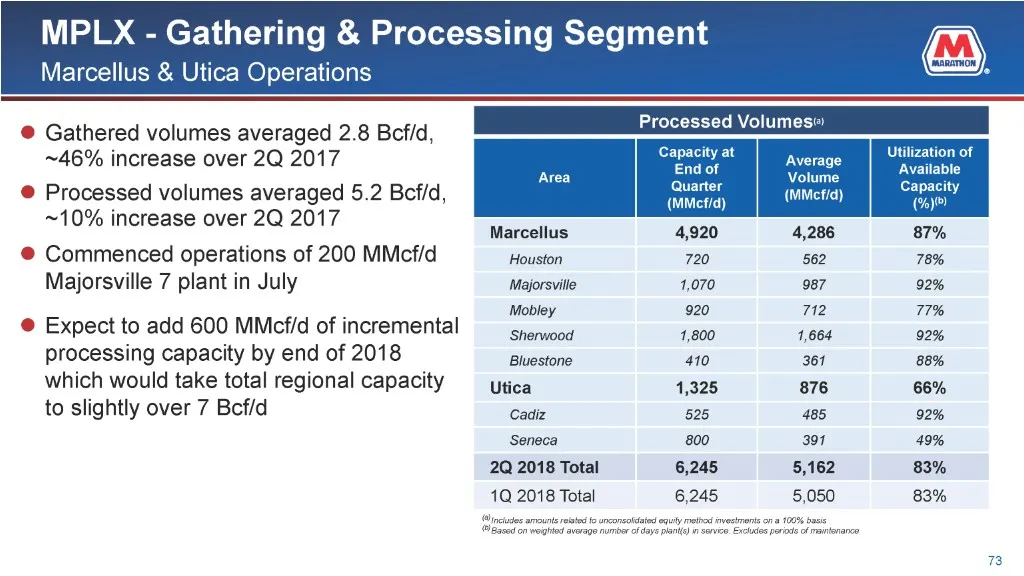
MPLX - Gathering & Processing Segment Marcellus & Utica Operations Gathered volumes averaged 2.8 Bcf/d, Erocessed volumes ~46% increase over 2Q 2017 Average Processed volumes averaged 5.2 Bcf/d, ) ener ~10% increase over 2Q 2017 Wiese 4,286 Commenced operations of 200 MMcf/d Houston 562 78% Majorsvi
Slide 74: MPLX - Gathering & Processing Segment: Marcellus & Utica Fractionation
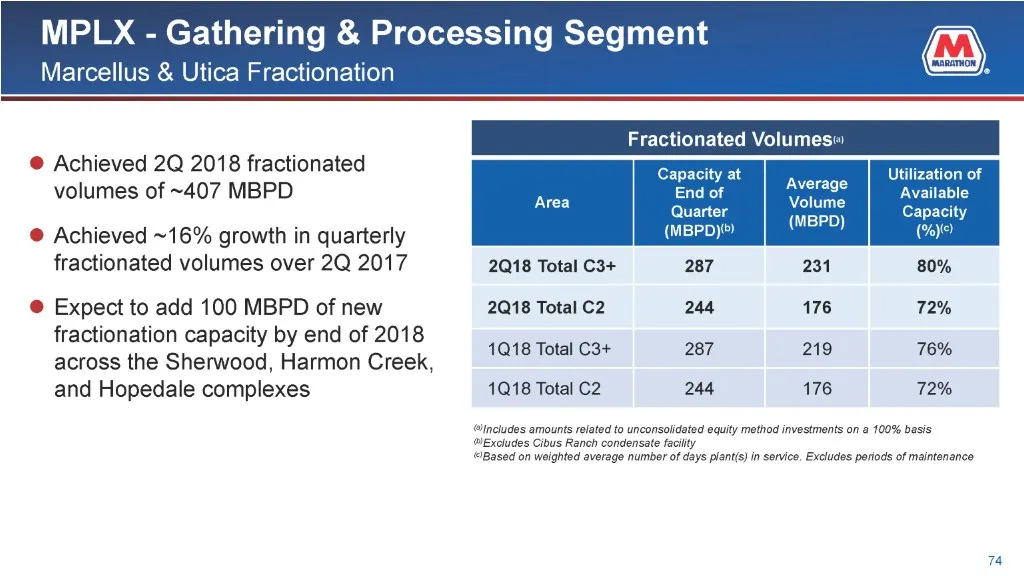
MPLX - Gathering & Processing Segment Marcellus & Utica Fractionation Achieved 2Q 2018 fractionated volumes of ~407 MBPD Achieved ~16% growth in quarterly fractionated volumes over 2Q 2017 Expect to add 100 MBPD of new fractionation capacity by end of 2018 across the Sherwood, Harmon Creek, and Hope
Slide 75: MPLX - Gathering & Processing Segment: Southwest Operations
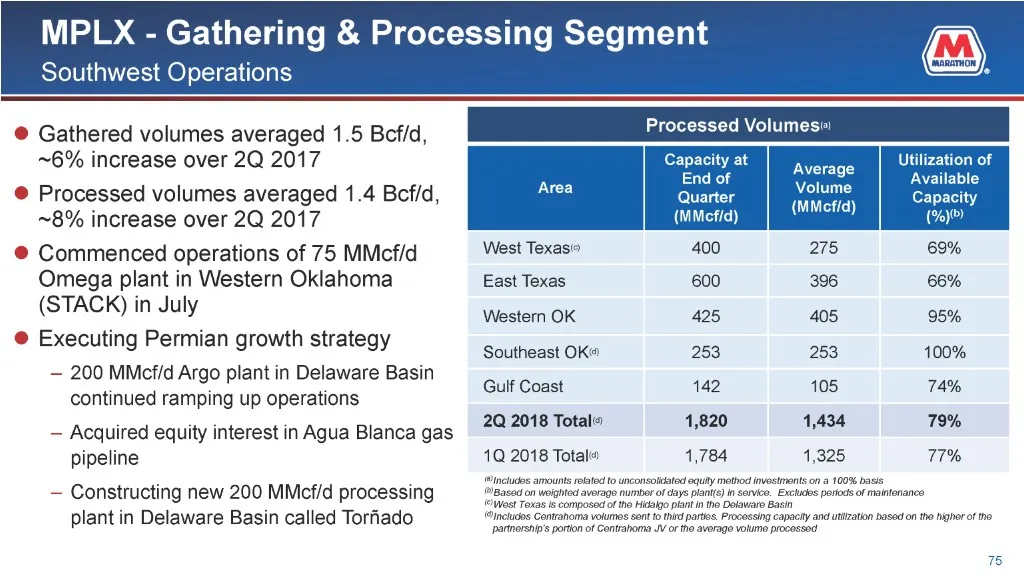
MPLX - Gathering & Processing Segment Southwest Operations Gathered volumes averaged 1.5 Bcf/d, ~6% increase over 2Q 2017 Capacity at Utilization of End of Aiaee Available Processed volumes averaged 1.4 Bcf/d, Quarter (MMett a) Capacity ~8% increase over 2Q 2017 (MMcfid) (%)®) Commenced operations o
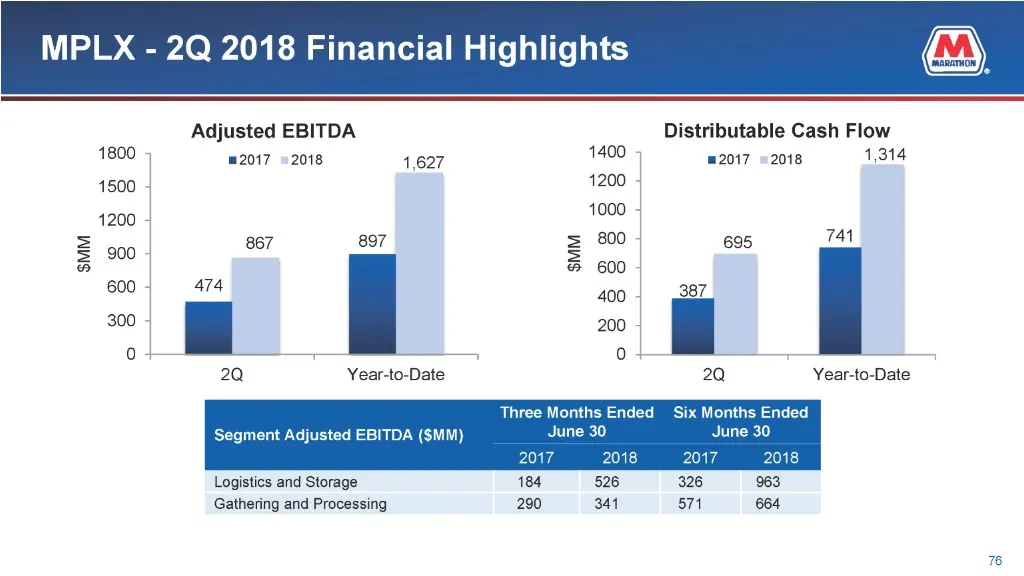
Slide 76: MPLX - 2Q 2018 Financial Highlights
MPLX - 2Q 2018 Financial Highlights Adjusted EBITDA Distributable Cash Flow 2017 ©2018 1,627 1400 2017 ©2018 1,314 1200 1000 867 897 = 800 695 7At @ 600 474 400 387 ial 200 0 20 Year-to-Date 2a Year-to-Date Three Months Ended Six Months Ended Segment Adjusted EBITDA ($MM) 2017 2018 2017 2018 Logisti
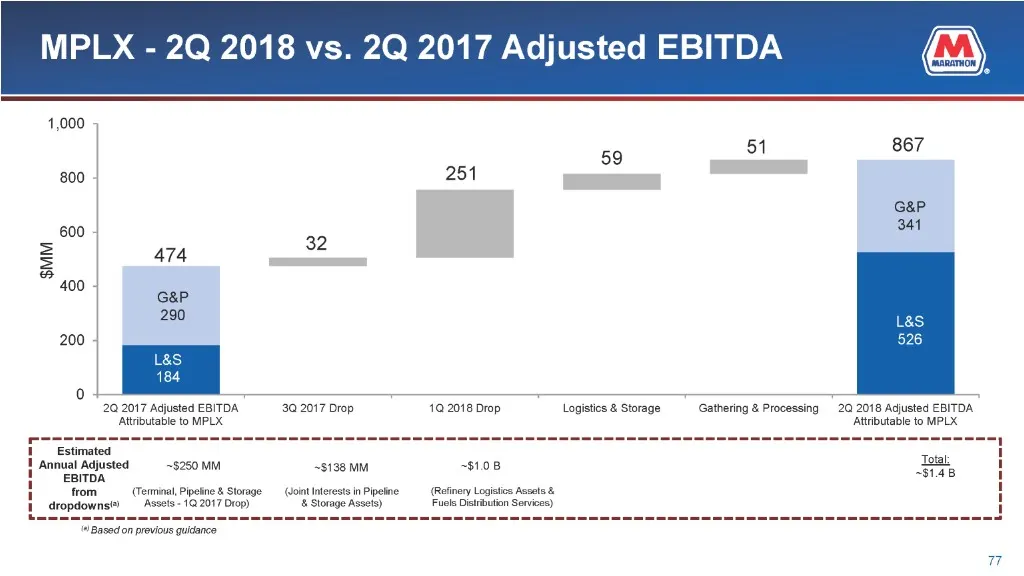
Slide 77: MPLX - 2Q 2018 vs. 2Q 2017 Adjusted EBITDA
MPLX - 2Q 2018 vs. 2Q 2017 Adjusted EBITDA GaP 341 = 32 2 474 — 400 G&P 290 200 7h 217 pu eGR” SUT Bp TGmuGGRE lauta hs Gurage Gunung Poang Sh a8 ated ETON Annual adjusted $250 MM 3196 “$108 ie a from (Terminal, Pipetine& Storage dropdownst) —Asseis- 10.2017 Drop) (oint interests in Pipeline & Stora
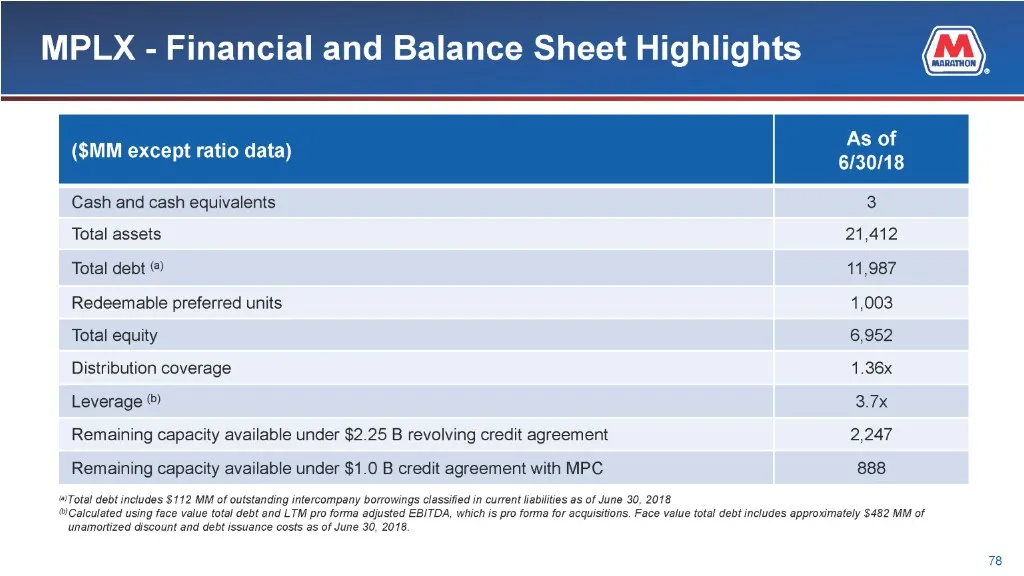
Slide 78: MPLX - Financial and Balance Sheet Highlights
MPLX - Financial and Balance Sheet Highlights As of ($MM except rai 6/30/18 Cash and cash equivalents 3 Total assets 21,412 Total debt © 11,987 Redeemable preferred units 1,003 Total equity 6,952 Distribution coverage 1.36x Leverage ©) 3.7x Remaining capacity available under $2.25 B revolving credit
Slide 79: Appendix
Appendix
Slide 80: Capital Expenditures & Investments
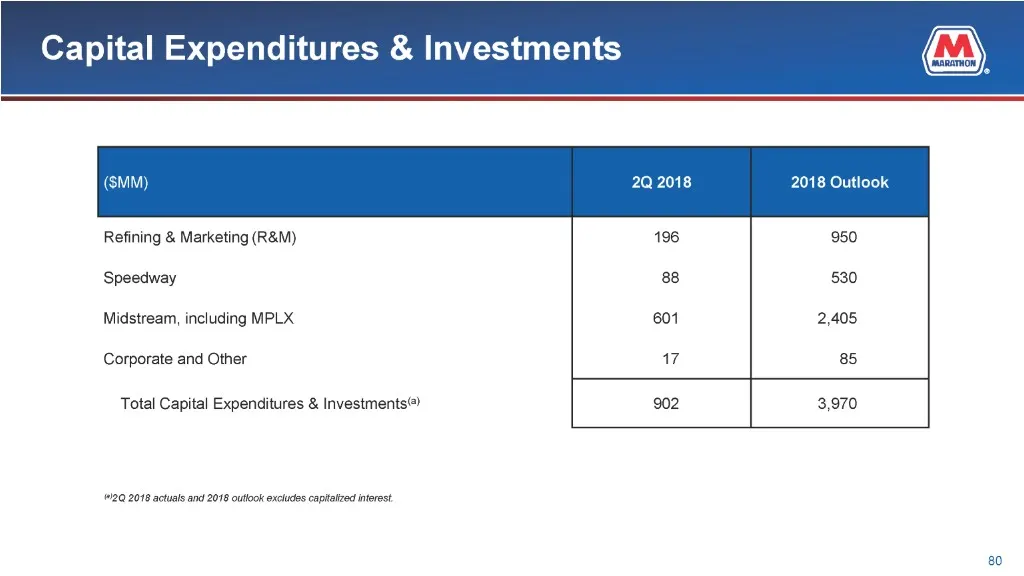
Capital Expenditures & Investments 2Q 2018 2018 Outlook Refining & Marketing (R&M) 196 950 Speedway 88 530 Midstream, including MPLX 601 2,405 Corporate and Other 7 85 Total Capital Expenditures & Investments 902 3,970 1120 2018 actuals and 2018 outlook excludes captaized interest
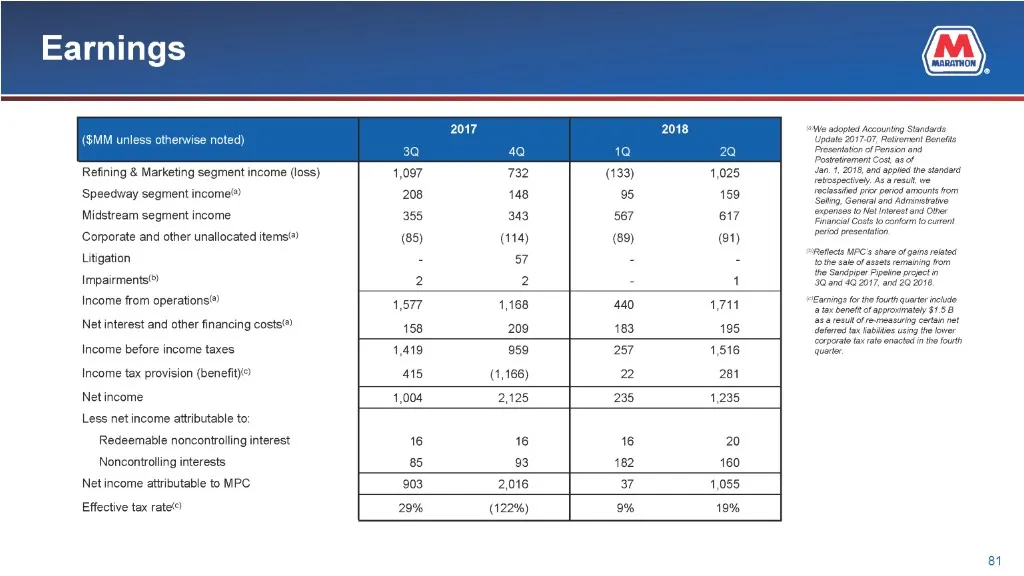
Slide 81: Earnings
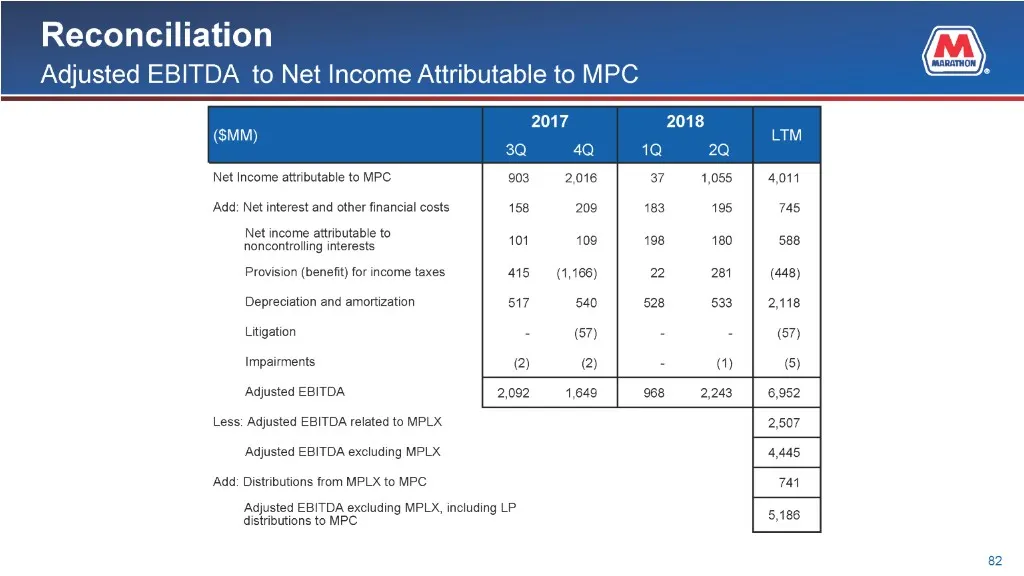
Slide 82: Reconciliation: Adjusted EBITDA to Net Income Attributable to MPC
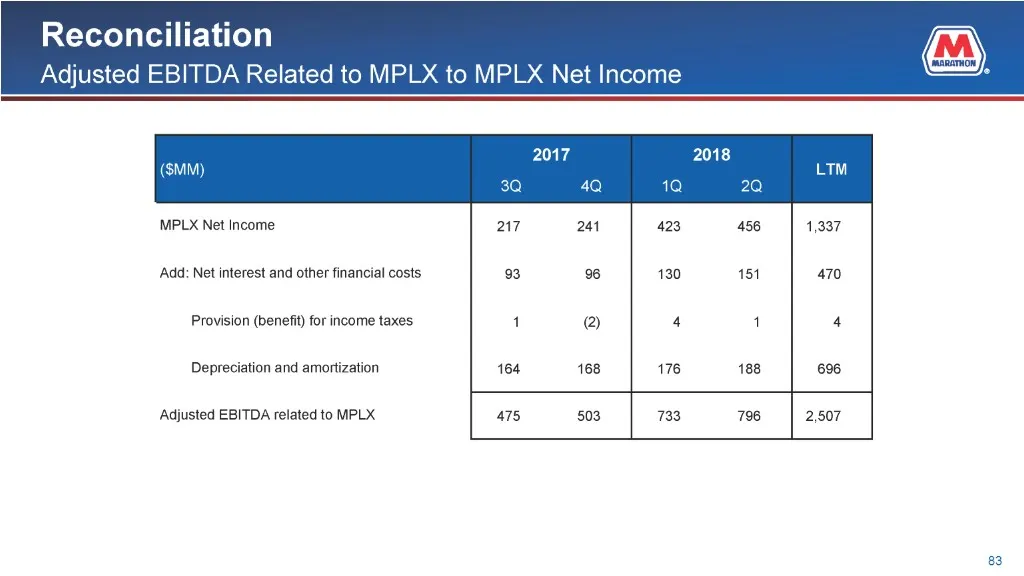
Slide 83: Reconciliation: Adjusted EBITDA Related to MPLX to MPLX Net Income
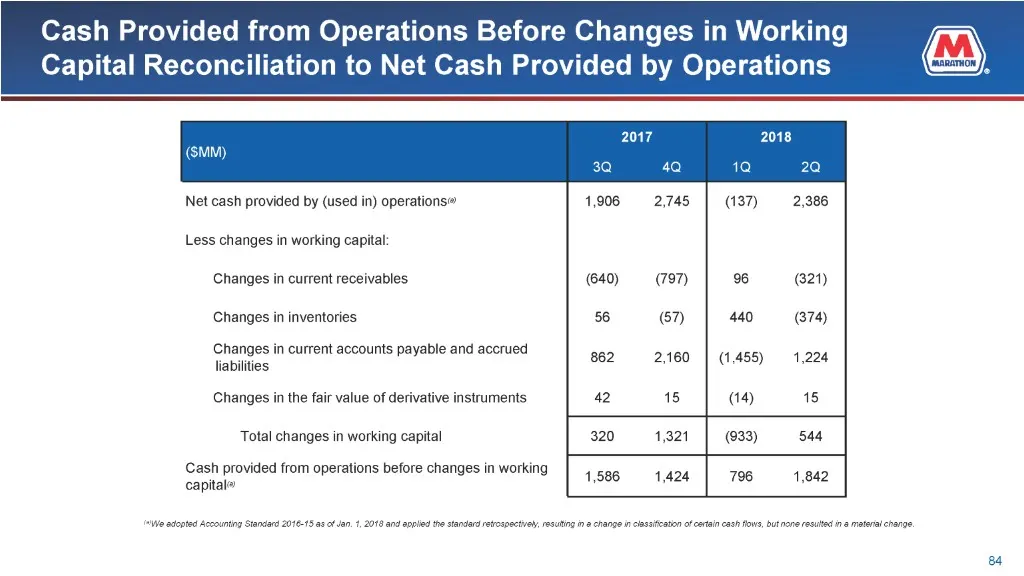
Slide 84: Cash Provided from Operations Before Changes in Working Capital Reconciliation
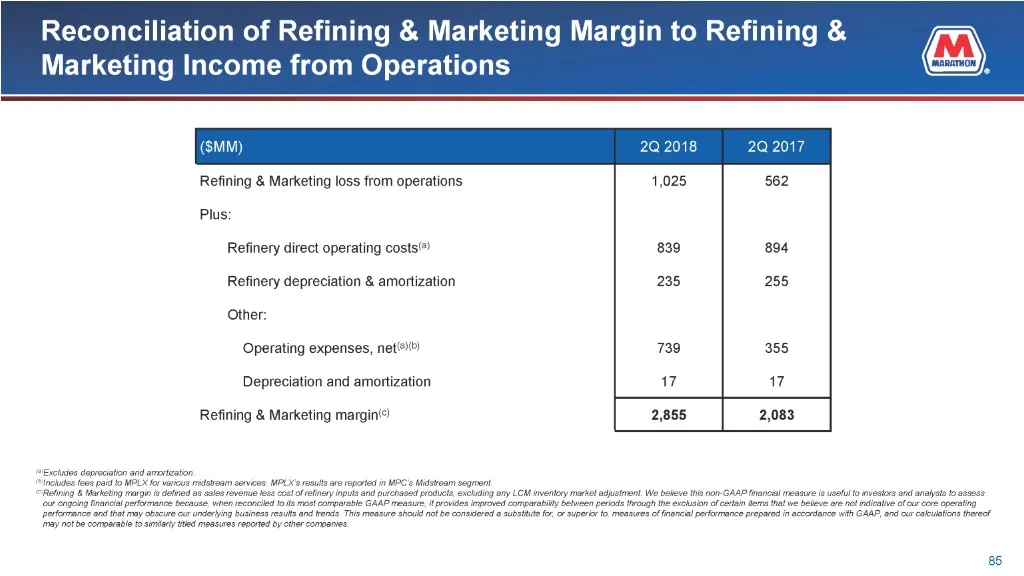
Slide 85: Reconciliation of Refining & Marketing Margin to Income from Operations
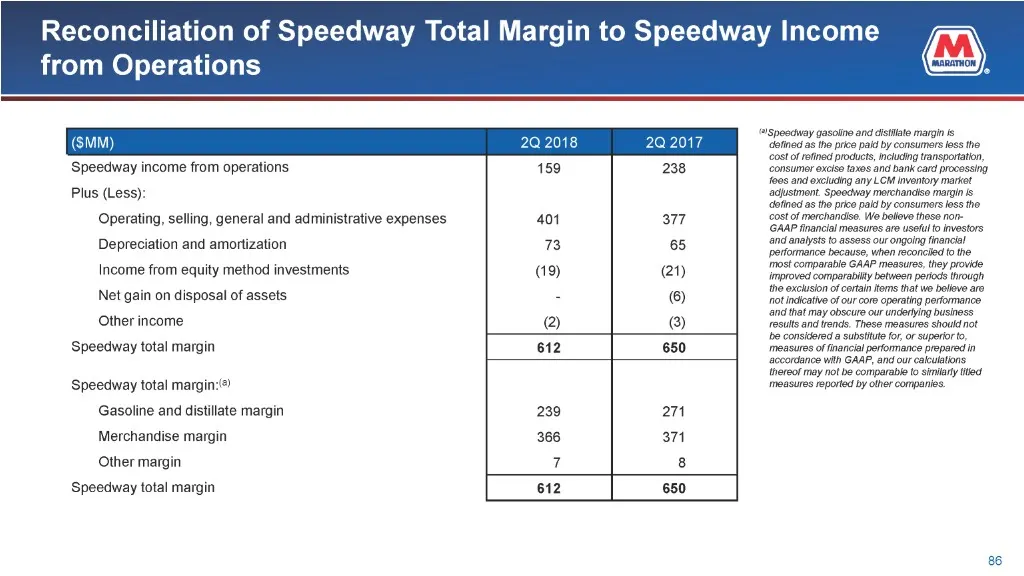
Slide 86: Reconciliation of Speedway Total Margin to Income from Operations
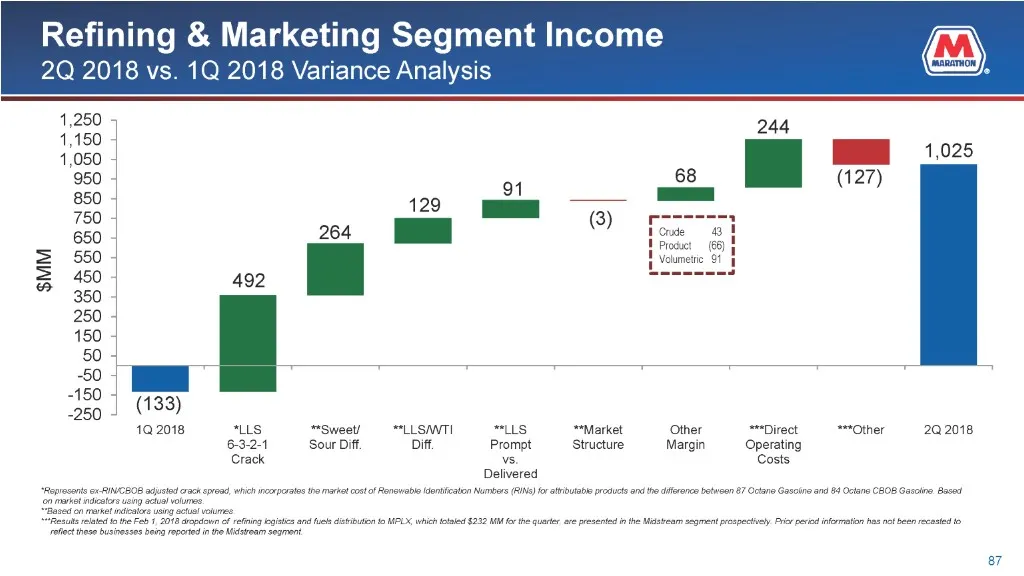
Slide 87: Refining & Marketing Segment Income: 2Q 2018 vs. 1Q 2018 Variance Analysis
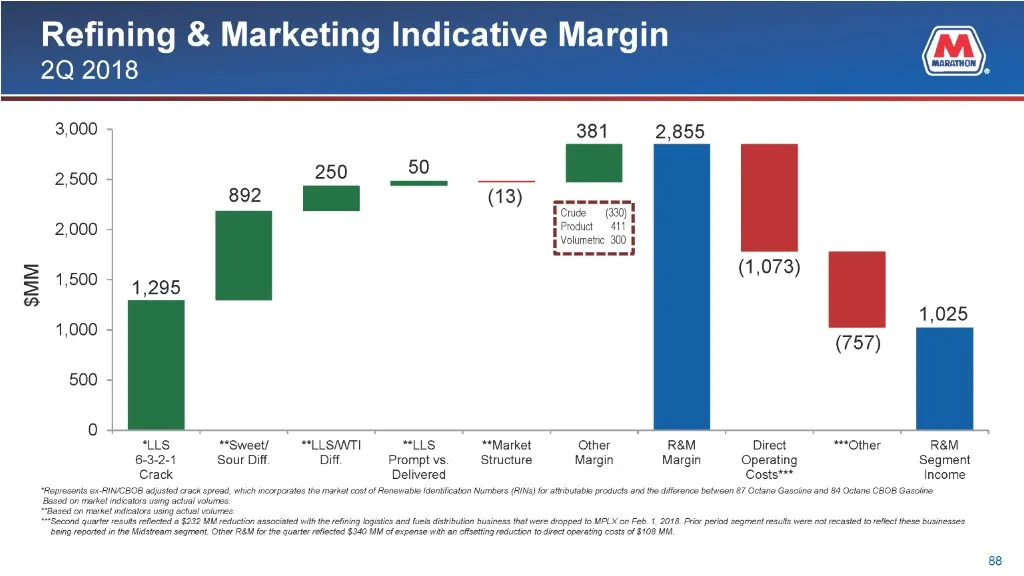
Slide 88: Refining & Marketing Indicative Margin 2Q 2018
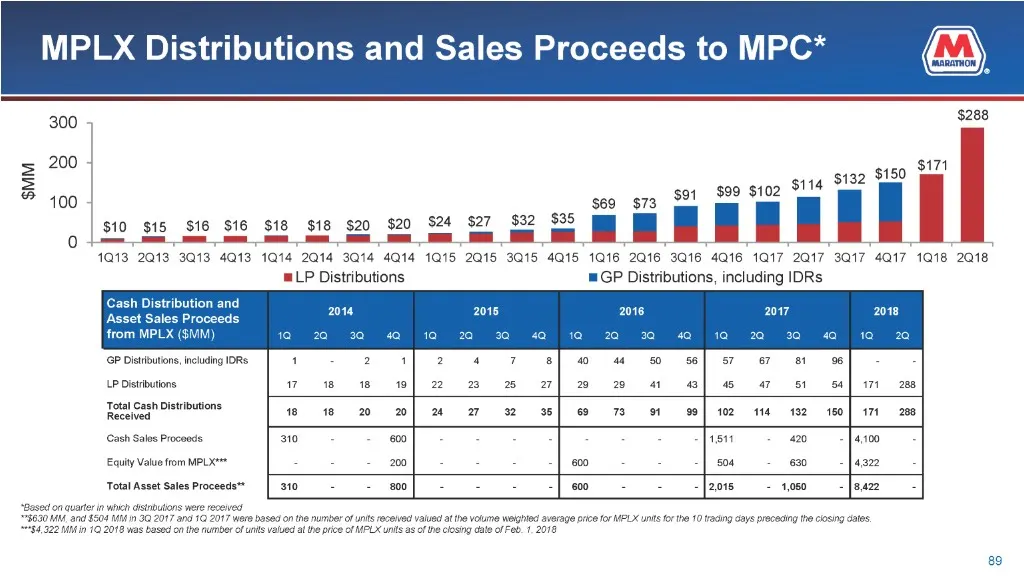
Slide 89: MPLX Distributions and Sales Proceeds to MPC
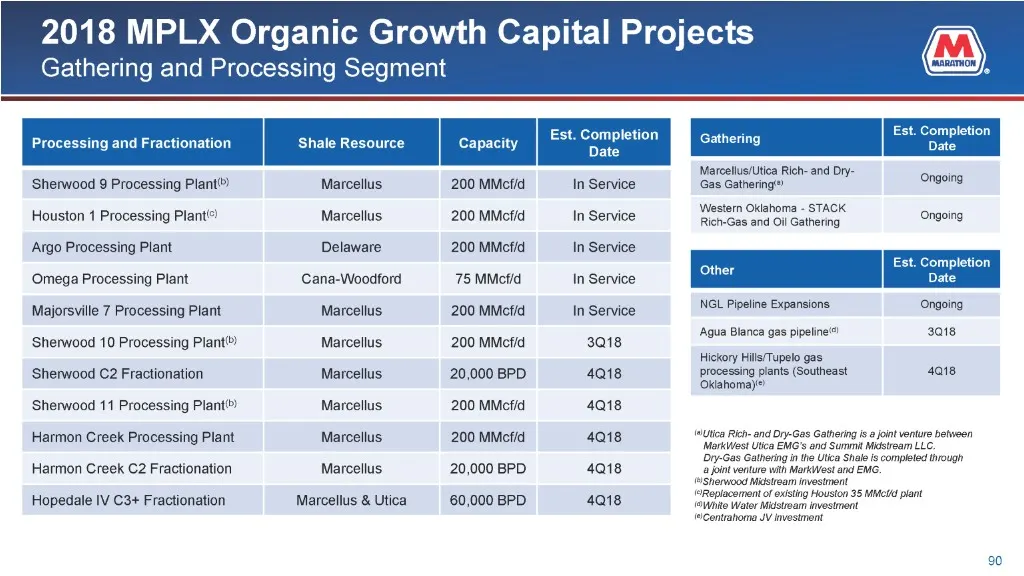
Slide 90: 2018 MPLX Organic Growth Capital Projects: Gathering and Processing
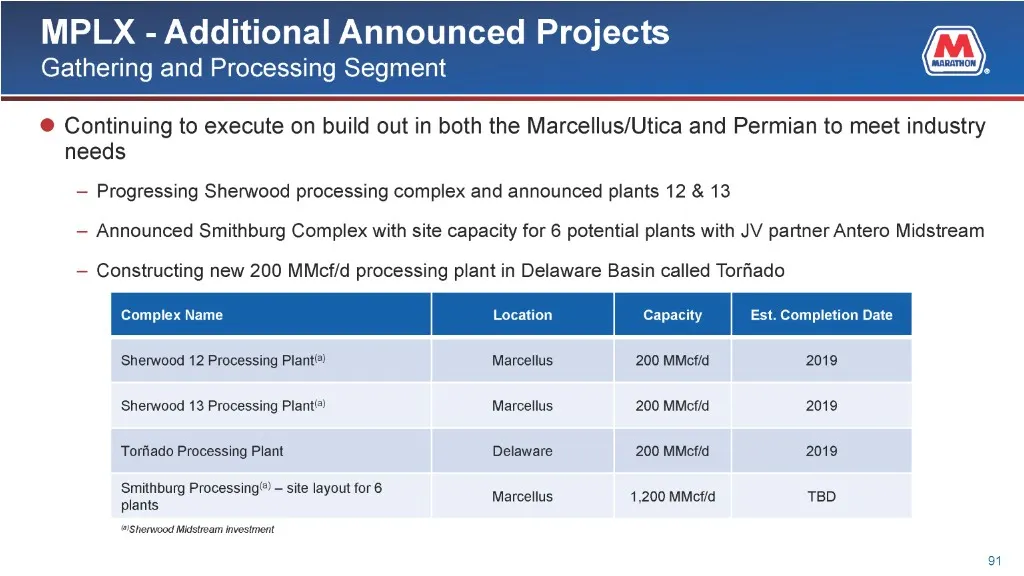
Slide 91: MPLX - Additional Announced Projects
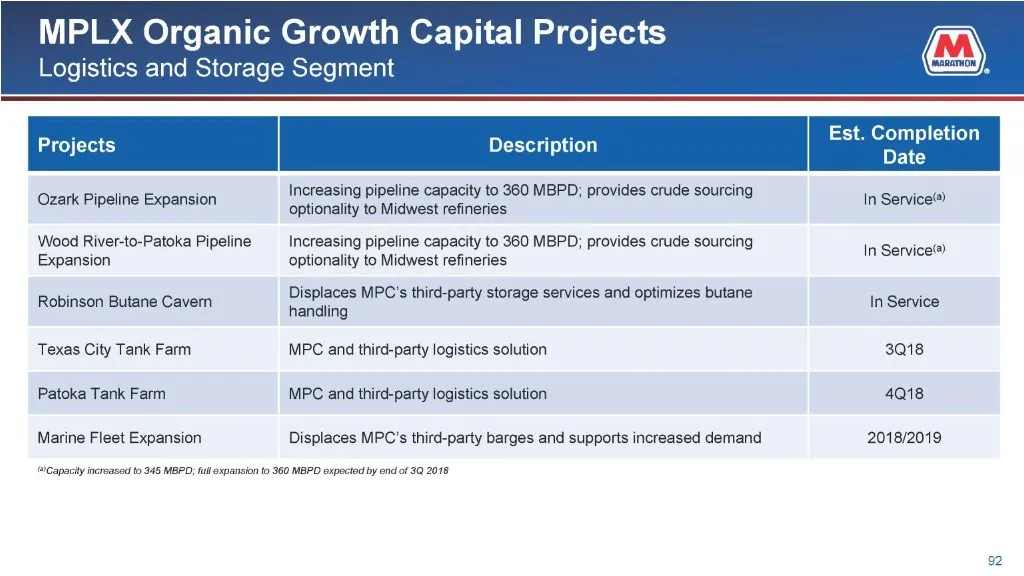
Slide 92: MPLX Organic Growth Capital Projects: Logistics and Storage
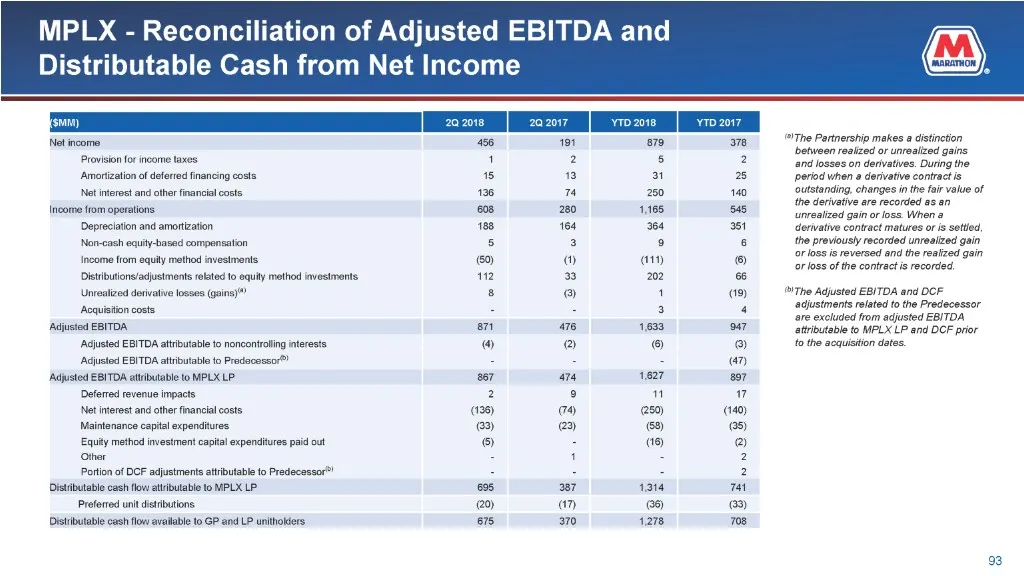
Slide 93: MPLX - Reconciliation of Adjusted EBITDA and Distributable Cash from Net Income
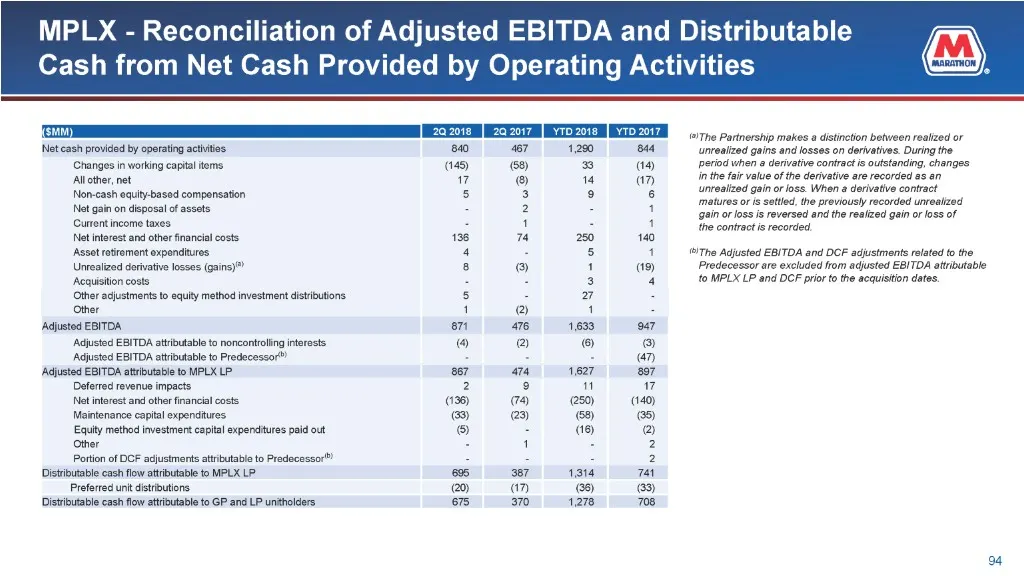
Slide 94: MPLX - Reconciliation of Adjusted EBITDA and Distributable Cash from Net Cash Provided by Operating Activities
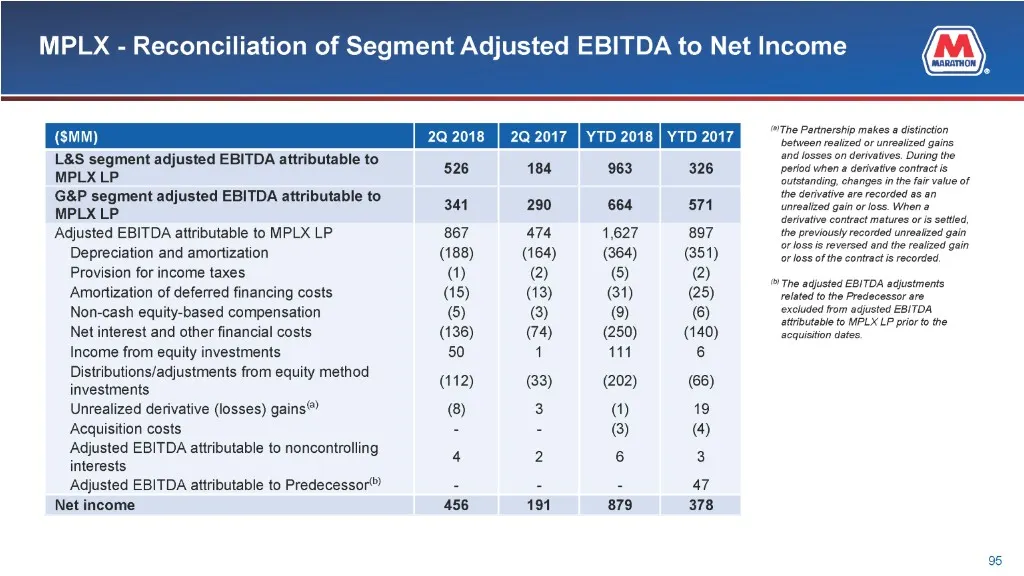
Slide 95: MPLX - Reconciliation of Segment Adjusted EBITDA to Net Income
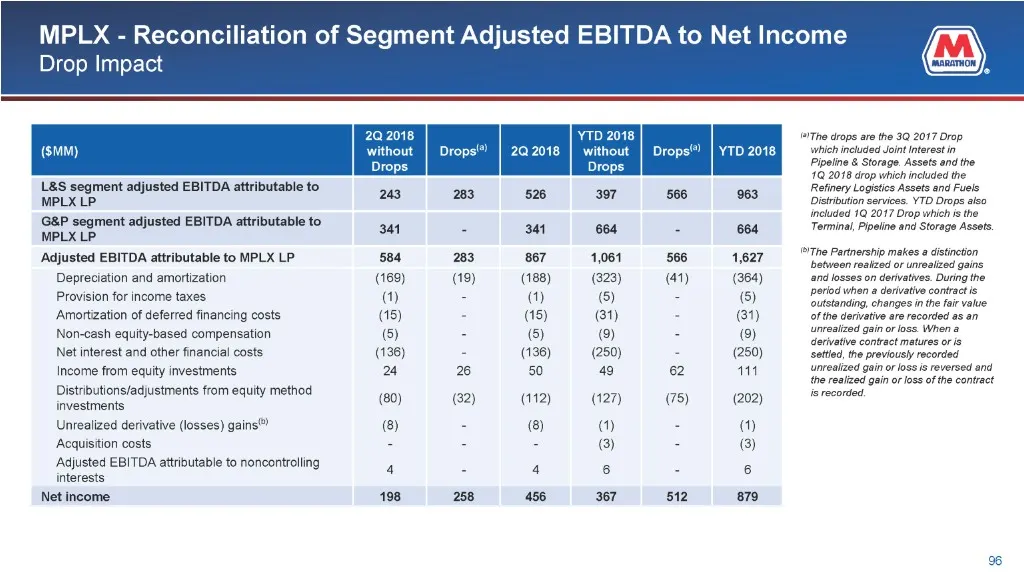
Slide 96: MPLX - Reconciliation of Segment Adjusted EBITDA to Net Income: Drop Impact
Source: SEC EDGAR · 425 filed Sep 5, 2018
More decks from Andeavor
 Merger or Acquisition (June 2018)34 slides · Jun 6, 2018
 Merger or Acquisition (May 2018)10 slides · May 10, 2018
 Merger or Acquisition (April 2018)25 slides · Apr 30, 2018
 2018 Wolfe Research 4th Annual Refiners Conference37 slides · Jan 3, 2018
 Tesoro Corp /New/ — Investor Day (December 2015)84 slides · Dec 9, 2015
 Tesoro Corp /New/ — Q2 2015 Earnings Presentation9 slides · Aug 5, 2015