Transatlantic — Merger or Acquisition (November 2011)
41 slides from Transatlantic's merger presentation, Nov 4, 2011
Slide 1: Investor Presentation November 4, 2011
Investor Presentation November 4, 2011
Slide 2: Cautionary Note Regarding Forward-Looking Statements
Cautionary Note Regarding Forward-Looking Statements This communication contains forward-looking statements that involve a number of risks and uncertainties. Statements that are not historical facts, including statements about our beliefs and expectations, are forward-looking statements. Such statem
Slide 3: Table of Contents
I. Executive Summary - The Validus Proposal is Not Compelling 3 II. Our Assessment of the Validus Offer 7 III. What We Have Achieved - Leading P&C Reinsurer Global Franchise 21 IV. Conclusion 35 Appendix 37 2 Table of Contents
Slide 4: I. Executive Summary - The Validus Proposal is Not Compelling
I. Executive Summary - The Validus Proposal is Not Compelling 3
Slide 5: Validus Offer is Neither Financially Nor Strategically Compelling
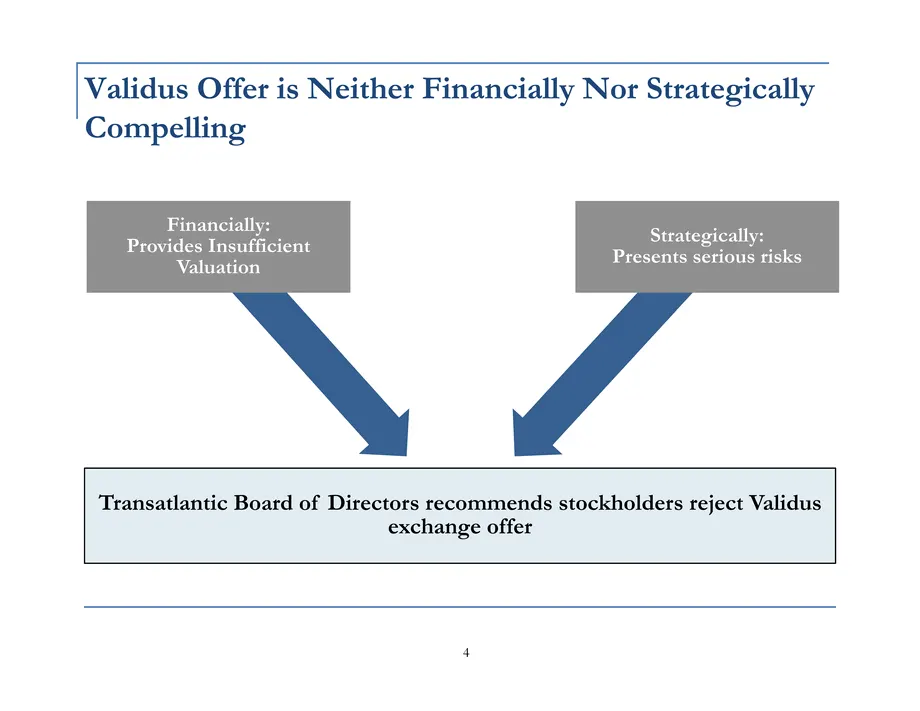
Validus Offer is Neither Financially Nor Strategically Compelling 4
Slide 6: Validus Offer Does Not Deliver Full and Fair Value to Transatlantic Stockholders
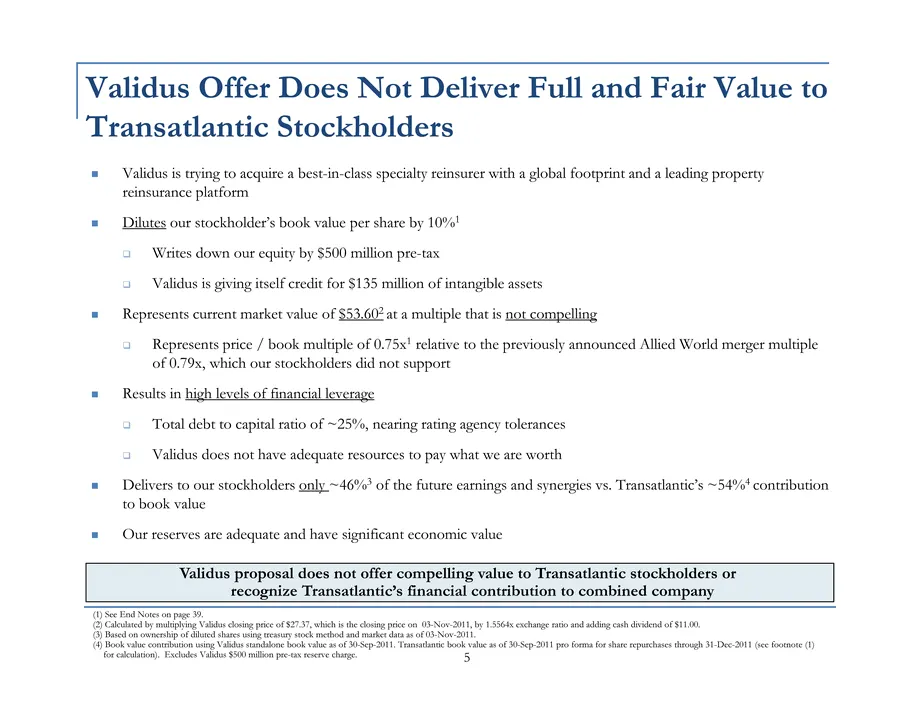
Validus Offer Does Not Deliver Full and Fair Value to Transatlantic Stockholders Validus is trying to acquire a best-in-class specialty reinsurer with a global footprint and a leading property reinsurance platform Dilutes our stockholder's book value per share by 10%1 Writes down our equity by $500
Slide 7: Validus Offer Presents Serious Strategic and Execution Risks
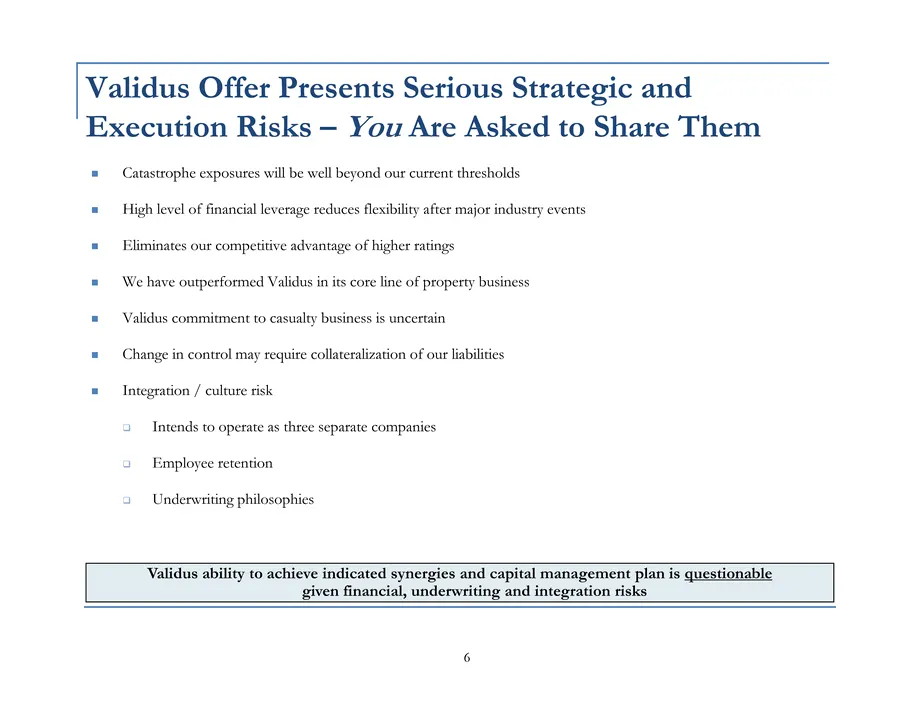
Validus Offer Presents Serious Strategic and Execution Risks - You Are Asked to Share Them Catastrophe exposures will be well beyond our current thresholds High level of financial leverage reduces flexibility after major industry events Eliminates our competitive advantage of higher ratings We have
Slide 8: II. Our Assessment of the Validus Offer
II. Our Assessment of the Validus Offer 7
Slide 9: Validus Revised Offer is Not Acceptable
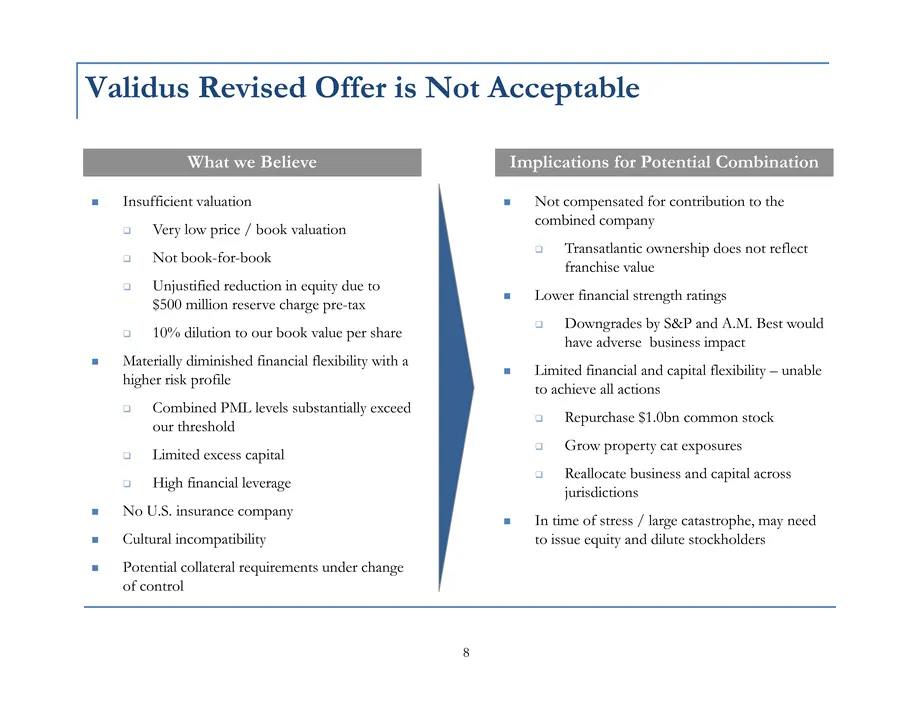
Validus Revised Offer is Not Acceptable 8 Implications for Potential Combination What we Believe Insufficient valuation Very low price / book valuation Not book-for-book Unjustified reduction in equity due to $500 million reserve charge pre-tax 10% dilution to our book value per share Materially dim
Slide 10: Components of Validus Insufficient Valuation
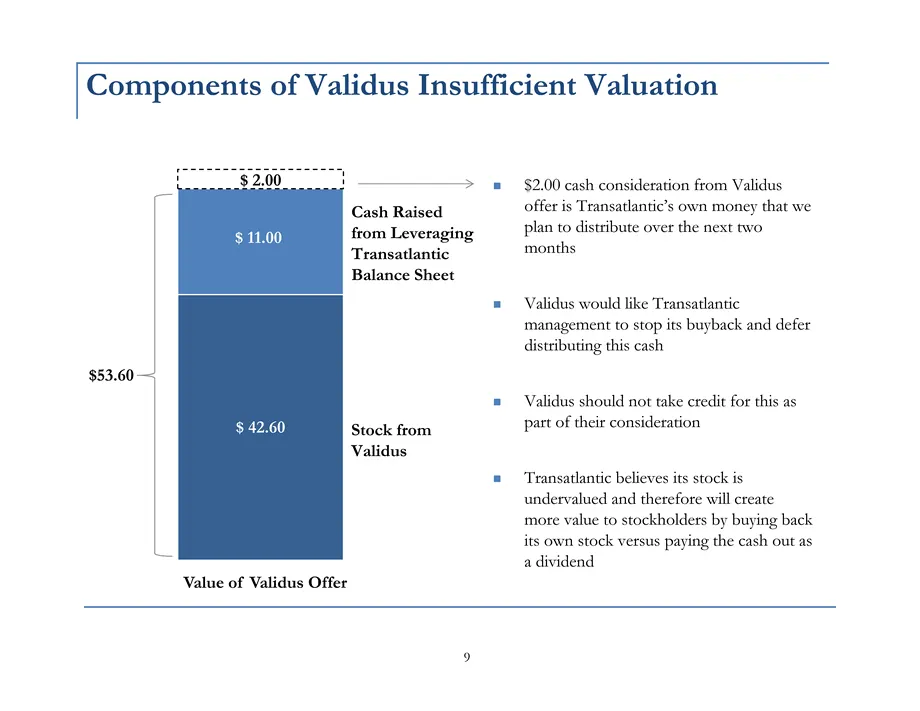
Components of Validus Insufficient Valuation 9 (CHART) $2.00 cash consideration from Validus offer is Transatlantic's own money that we plan to distribute over the next two months Validus would like Transatlantic management to stop its buyback and defer distributing this cash Validus should not take
Slide 11: Validus Offer is Not Book Value for Book Value
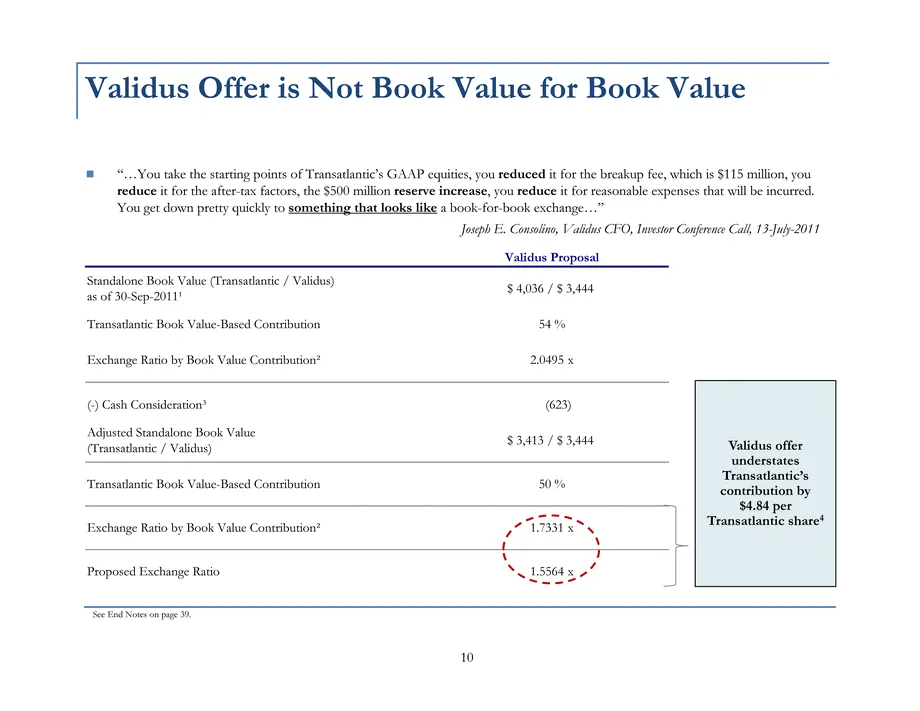
10 See End Notes on page 39. Validus offer understates Transatlantic's contribution by $4.84 per Transatlantic share4 "...You take the starting points of Transatlantic's GAAP equities, you reduced it for the breakup fee, which is $115 million, you reduce it for the after-tax factors, the $500 millio
Slide 12: External parties reviewed and confirmed the adequacy of our reserves
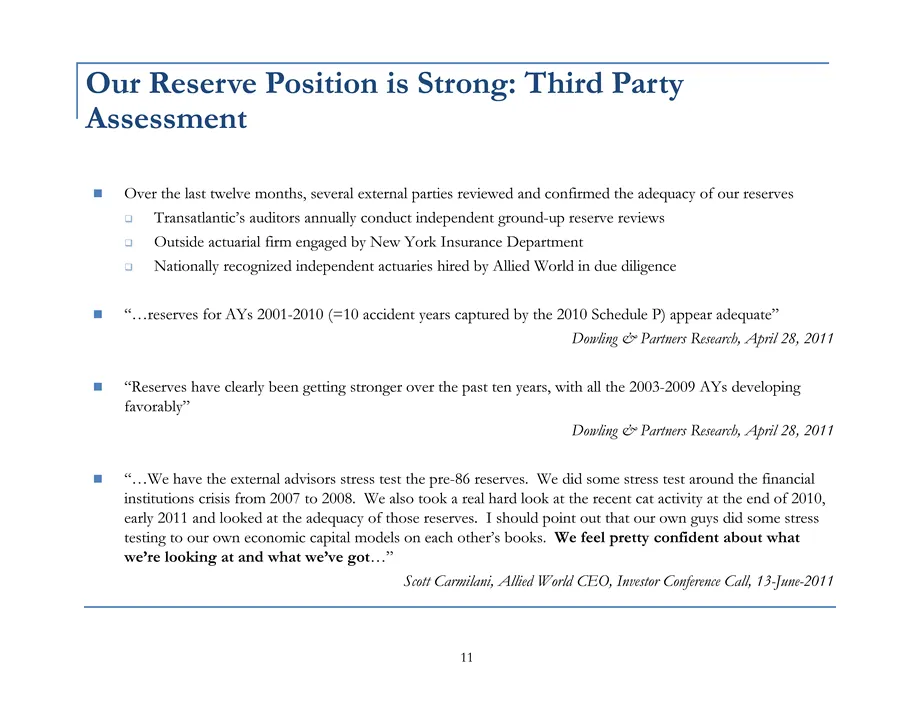
11 Over the last twelve months, several external parties reviewed and confirmed the adequacy of our reserves Transatlantic's auditors annually conduct independent ground-up reserve reviews Outside actuarial firm engaged by New York Insurance Department Nationally recognized independent actuaries hir
Slide 13: Our Reserve Position is Strong
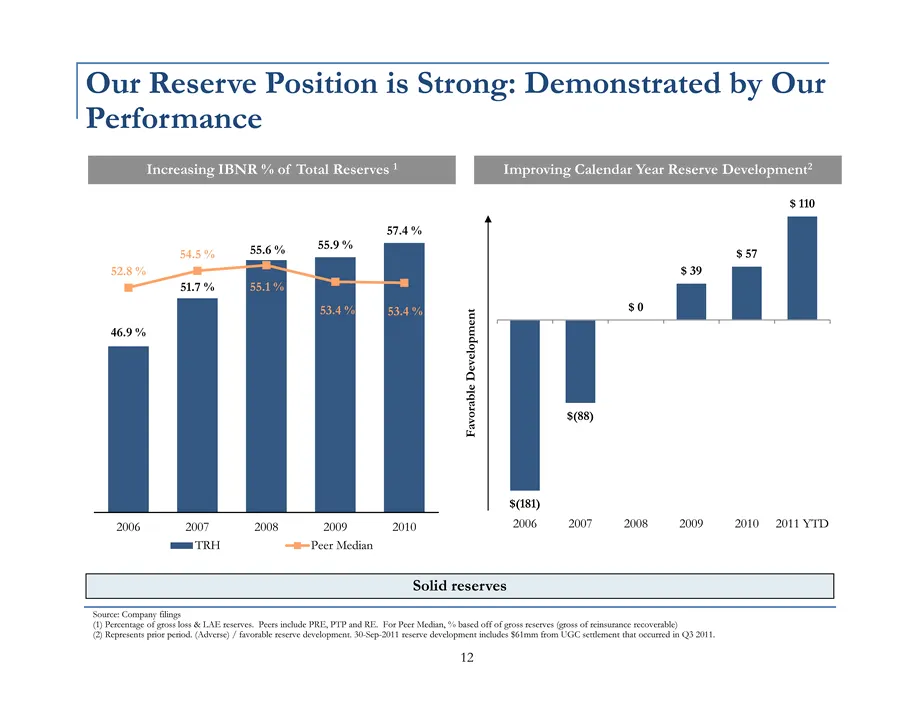
12 Increasing IBNR % of Total Reserves 1 Improving Calendar Year Reserve Development2 Favorable Development Source: Company filings (1) Percentage of gross loss & LAE reserves. Peers include PRE, PTP and RE. For Peer Median, % based off of gross reserves (gross of reinsurance recoverable) (2) Repres
Slide 14: Transatlantic Consistently Outperformed Validus in Property Reinsurance
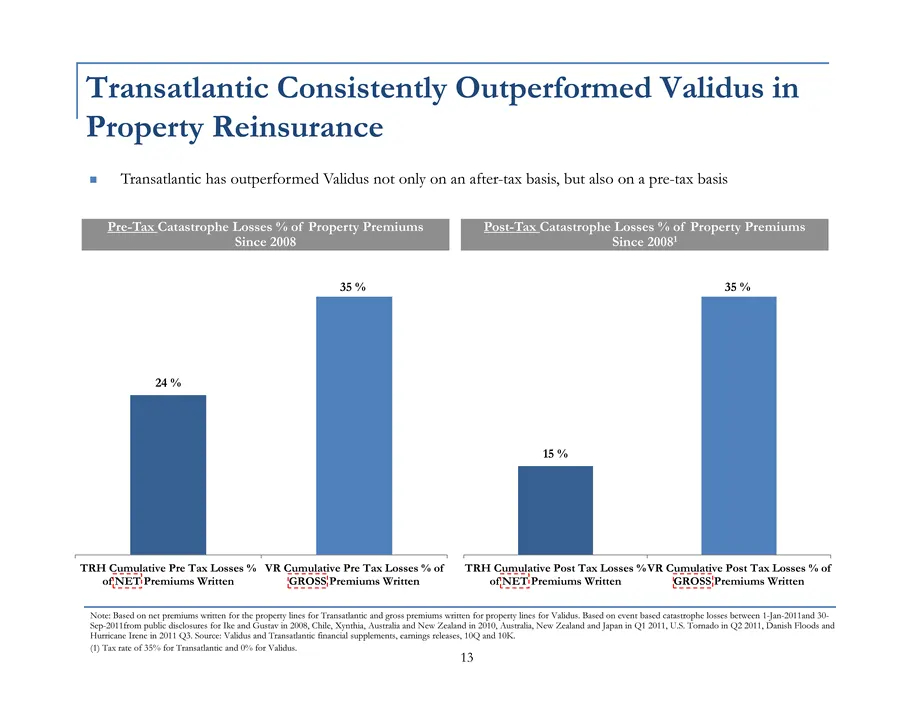
Transatlantic Consistently Outperformed Validus in Property Reinsurance 13 Note: Based on net premiums written for the property lines for Transatlantic and gross premiums written for property lines for Validus. Based on event based catastrophe losses between 1-Jan-2011and 30- Sep-2011from public dis
Slide 15: Combined PMLs Limit Capital and Business Flexibility
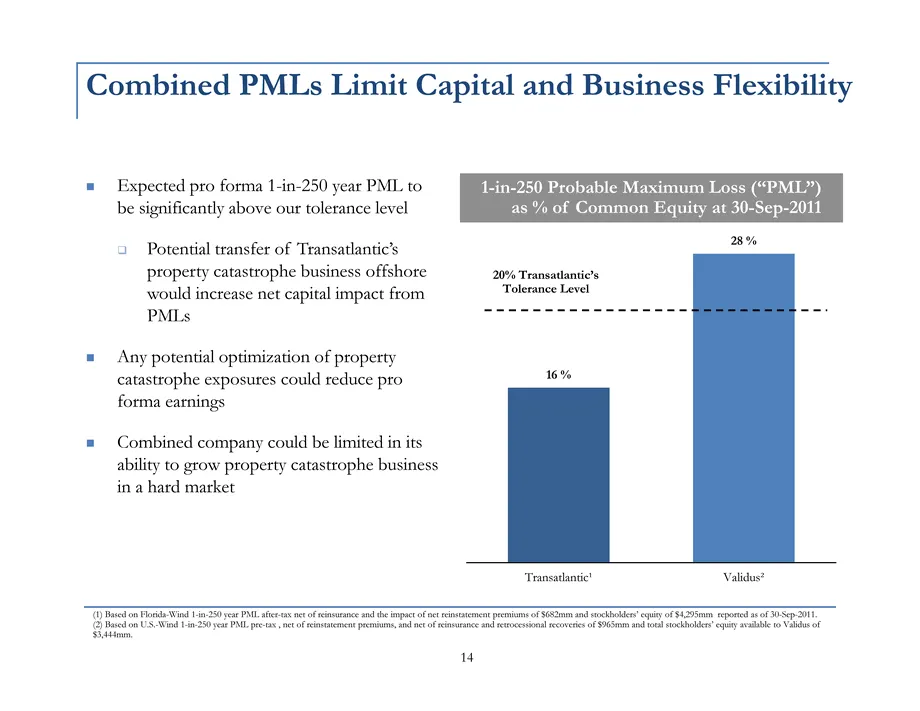
14 Combined PMLs Limit Capital and Business Flexibility Expected pro forma 1-in-250 year PML to be significantly above our tolerance level Potential transfer of Transatlantic's property catastrophe business offshore would increase net capital impact from PMLs Any potential optimization of property c
Slide 16: Validus Transaction Diminishes Financial Flexibility
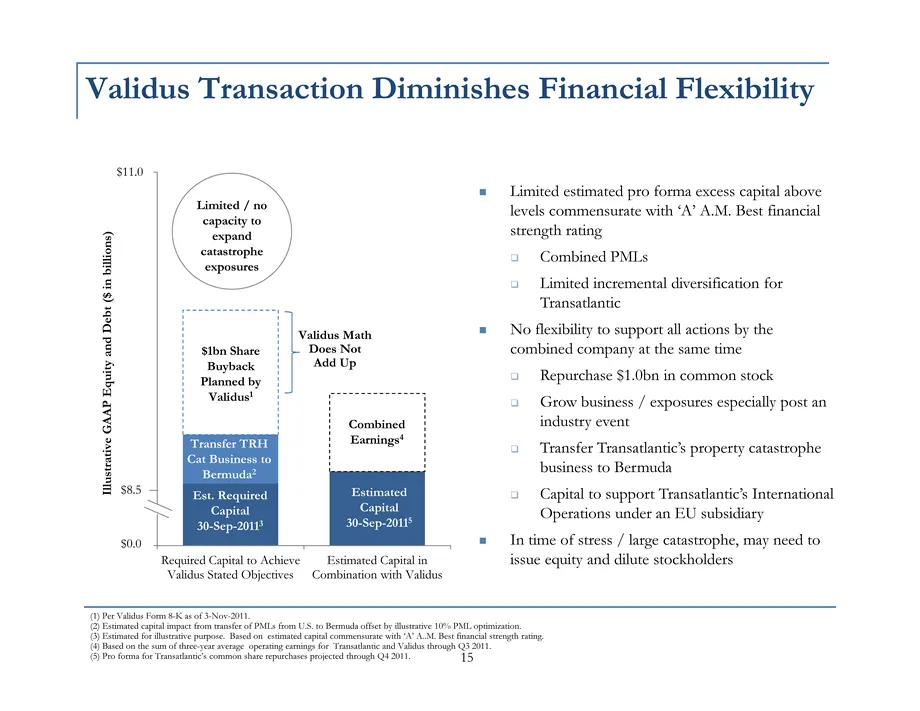
(CHART) Validus Transaction Diminishes Financial Flexibility 15 Limited estimated pro forma excess capital above levels commensurate with 'A' A.M. Best financial strength rating Combined PMLs Limited incremental diversification for Transatlantic No flexibility to support all actions by the combined
Slide 17: High Likelihood of Ratings Downgrade for Transatlantic
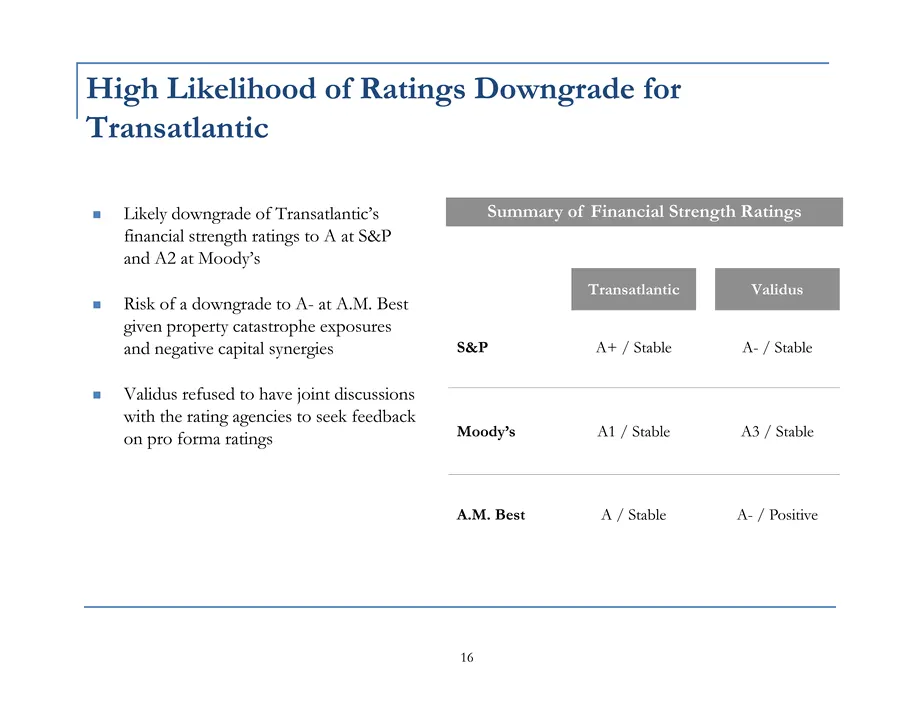
High Likelihood of Ratings Downgrade for Transatlantic 16 Summary of Financial Strength Ratings Likely downgrade of Transatlantic's financial strength ratings to A at S&P and A2 at Moody's Risk of a downgrade to A- at A.M. Best given property catastrophe exposures and negative capital synergies Vali
Slide 18: Our Ratings Advantage: Maximizing Scale, Brand and Market Position
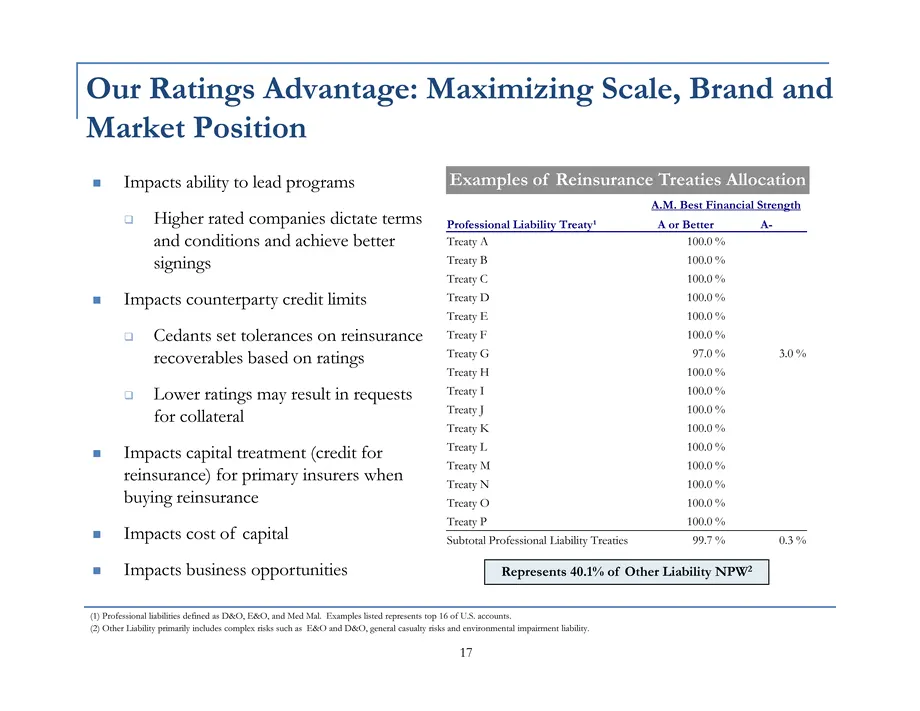
17 Our Ratings Advantage: Maximizing Scale, Brand and Market Position Impacts ability to lead programs Higher rated companies dictate terms and conditions and achieve better signings Impacts counterparty credit limits Cedants set tolerances on reinsurance recoverables based on ratings Lower ratings
Slide 19: The Validus Offer Results in 10% BVPS Dilution to Transatlantic
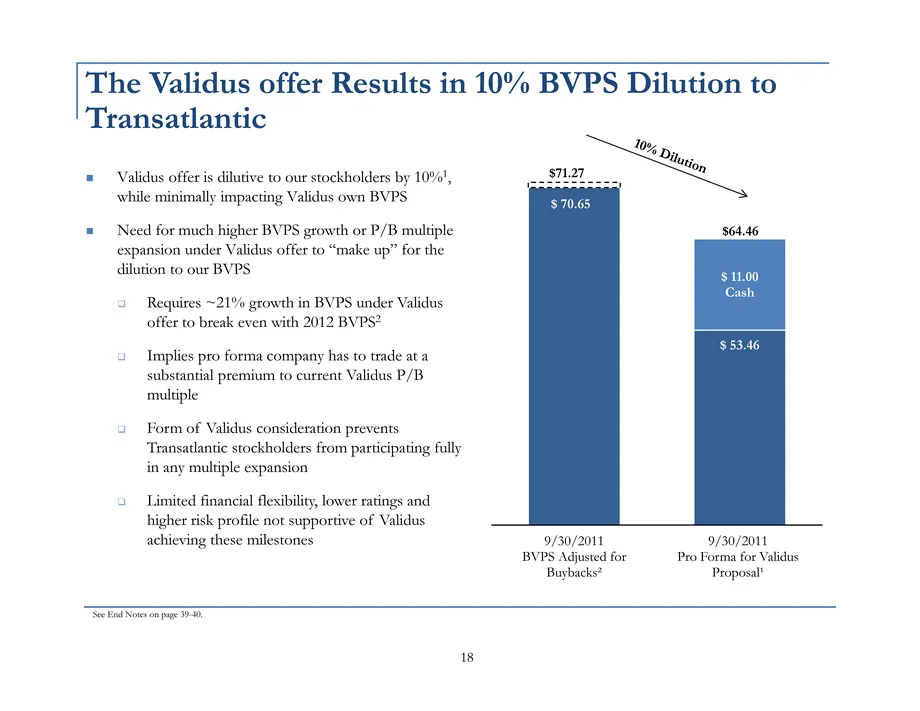
The Validus offer Results in 10% BVPS Dilution to Transatlantic 18 See End Notes on page 39-40. Validus offer is dilutive to our stockholders by 10%1, while minimally impacting Validus own BVPS Need for much higher BVPS growth or P/B multiple expansion under Validus offer to "make up" for the diluti
Slide 20: Our Current Path Delivers Superior BVPS Growth
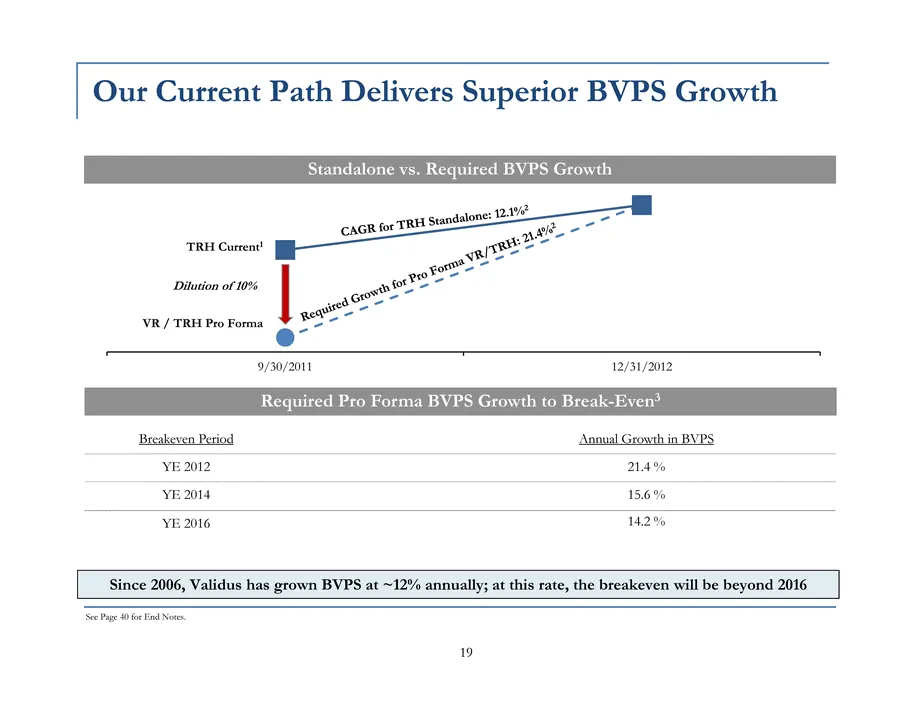
(CHART) 19 Our Current Path Delivers Superior BVPS Growth See Page 40 for End Notes. Standalone vs. Required BVPS Growth Required Pro Forma BVPS Growth to Break-Even3 Breakeven Period Annual Growth in BVPS YE 2012 21.4 % YE 2014 15.6 % YE 2016 14.2 % Since 2006, Validus has grown BVPS at ~12% annual
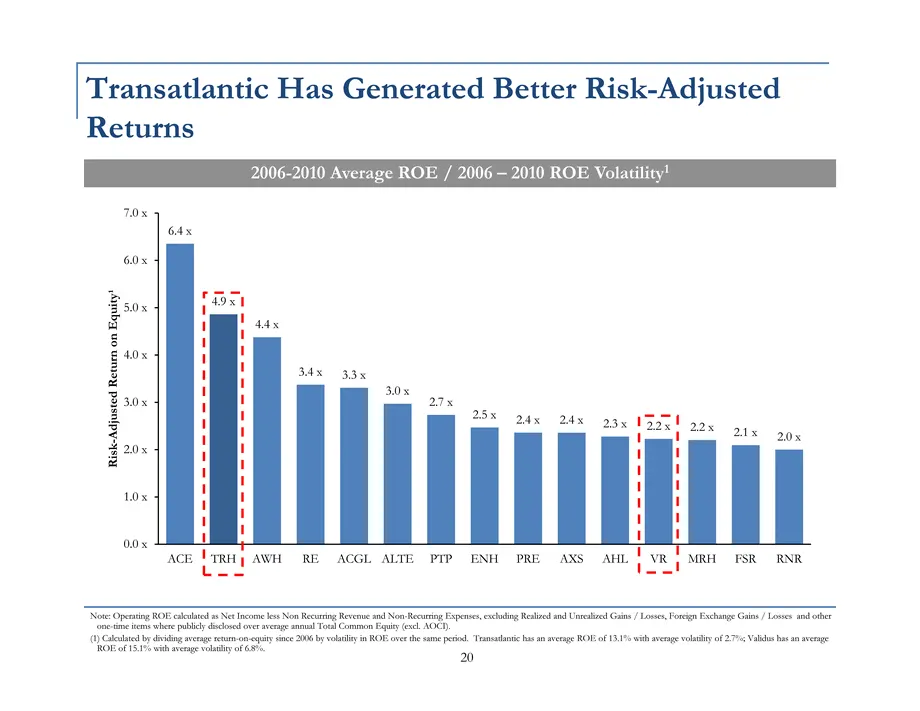
Slide 21: Transatlantic Has Generated Better Risk-Adjusted Returns
Transatlantic Has Generated Better Risk- Adjusted Returns 20 Note: Operating ROE calculated as Net Income less Non Recurring Revenue and Non-Recurring Expenses, excluding Realized and Unrealized Gains / Losses, Foreign Exchange Gains / Losses and other one-time items where publicly disclosed over av
Slide 22: III. What We Have Achieved - Leading P&C Reinsurer Global Franchise
III. What We Have Achieved - Leading P&C Reinsurer Global Franchise 21
Slide 23: What Makes Us Unique
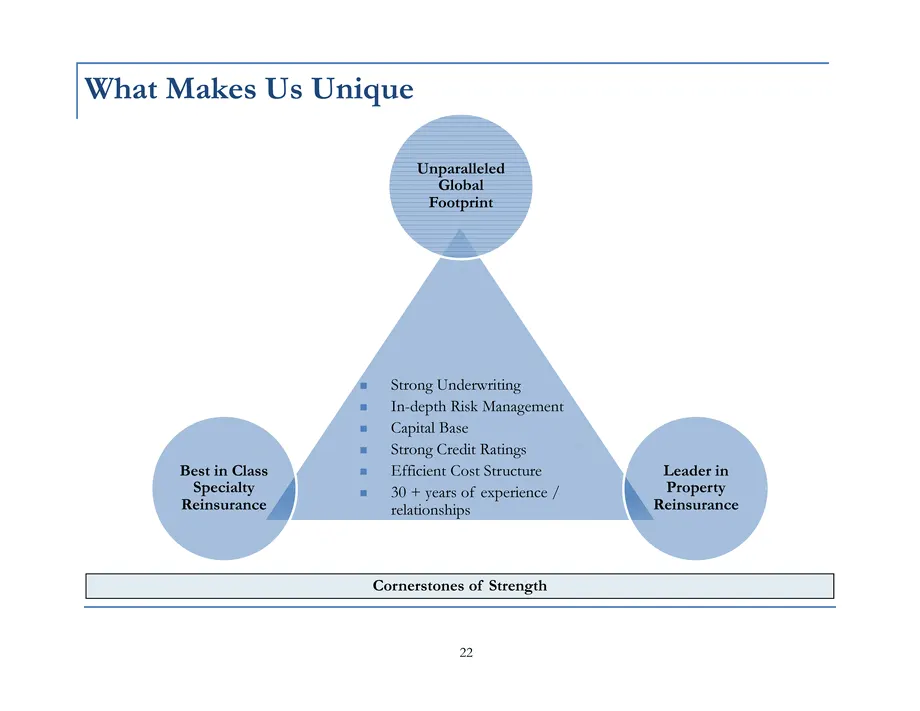
What Makes Us Unique 22 Strong Underwriting In-depth Risk Management Capital Base Strong Credit Ratings Efficient Cost Structure 30 + years of experience / relationships Cornerstones of Strength
Slide 24: Large Global P&C Reinsurer
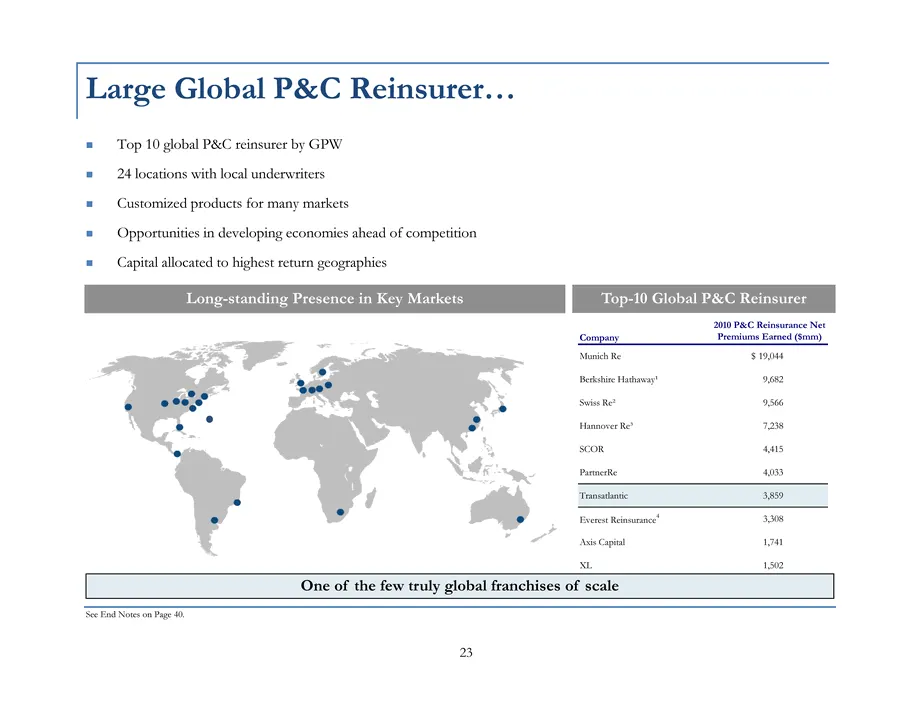
23 Large Global P&C Reinsurer... Top 10 global P&C reinsurer by GPW 24 locations with local underwriters Customized products for many markets Opportunities in developing economies ahead of competition Capital allocated to highest return geographies Long-standing Presence in Key Markets See End Notes
Slide 25: With Distinct Local Advantage
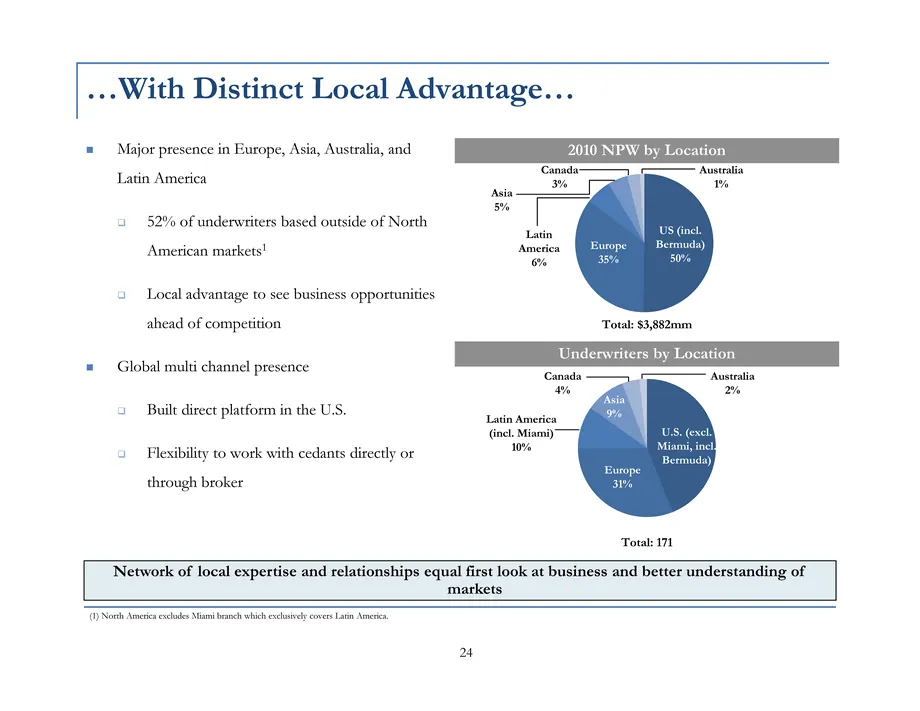
Underwriters by Location (CHART) Major presence in Europe, Asia, Australia, and Latin America 52% of underwriters based outside of North American markets1 Local advantage to see business opportunities ahead of competition Global multi channel presence Built direct platform in the U.S. Flexibility to
Slide 26: Long-Standing Relationships with Cedants
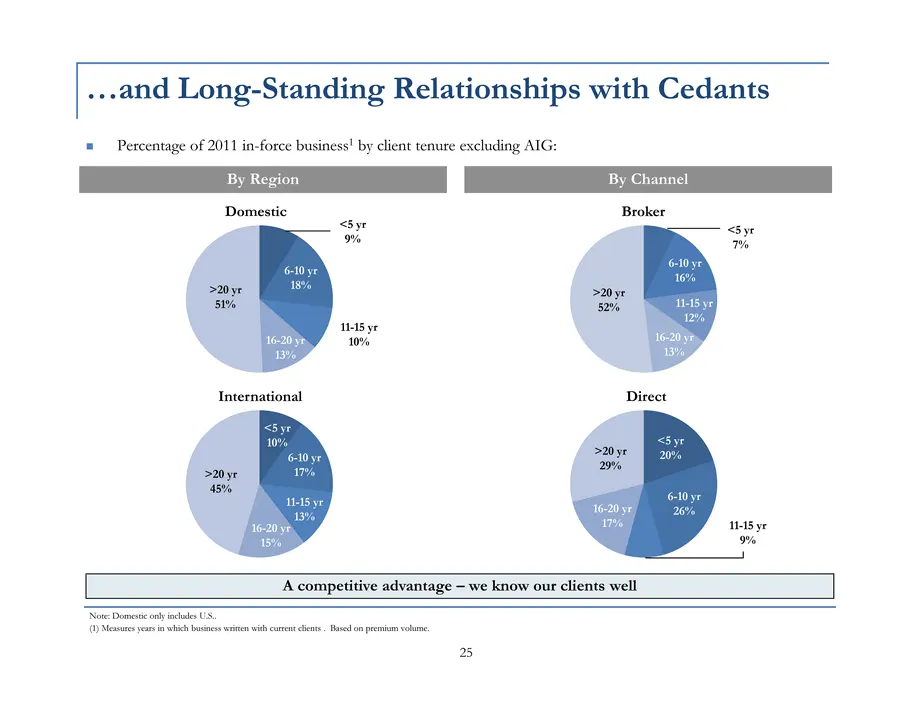
25 ....and Long-Standing Relationships with Cedants Note: Domestic only includes U.S.. (1) Measures years in which business written with current clients . Based on premium volume. Percentage of 2011 in-force business1 by client tenure excluding AIG: A competitive advantage - we know our clients well
Slide 27: Leader in Specialty Classes of Reinsurance
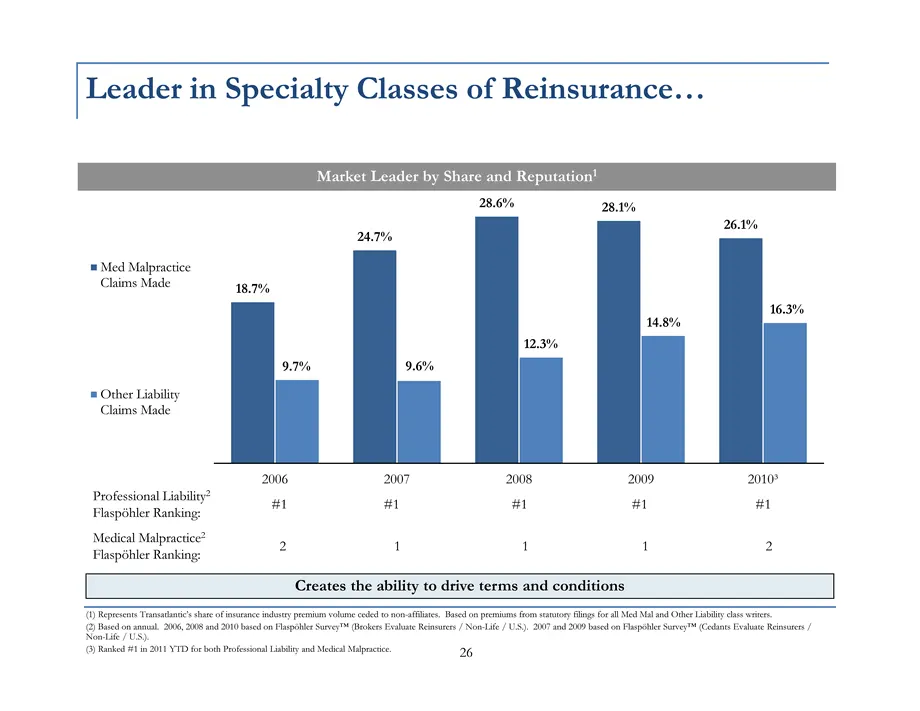
Leader in Specialty Classes of Reinsurance... 26 (1) Represents Transatlantic's share of insurance industry premium volume ceded to non-affiliates. Based on premiums from statutory filings for all Med Mal and Other Liability class writers. (2) Based on annual. 2006, 2008 and 2010 based on Flaspohler
Slide 28: With Superior Risk Selection
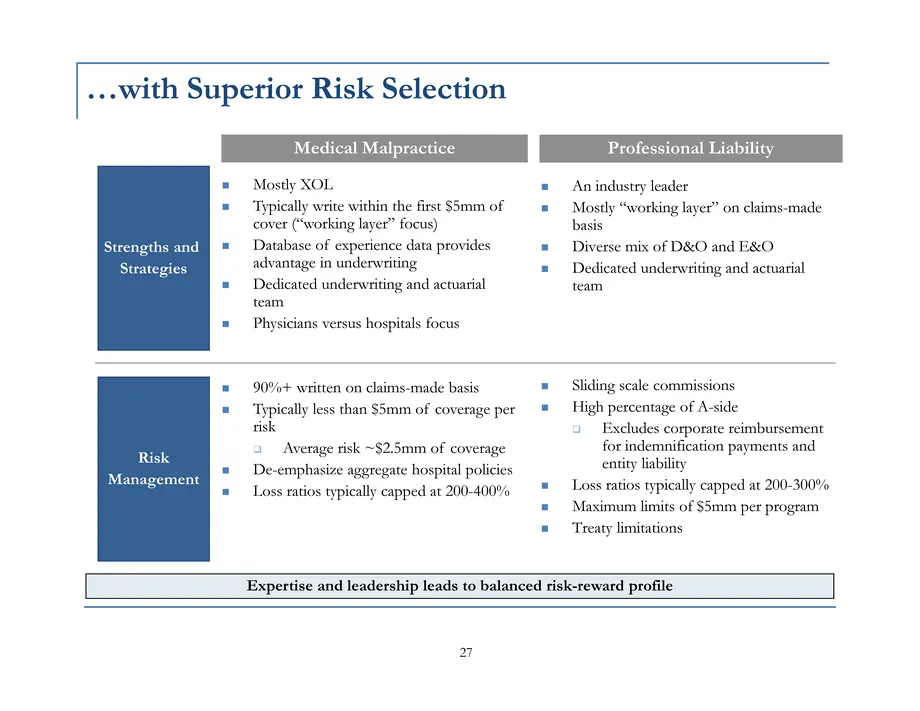
....with Superior Risk Selection 27 An industry leader Mostly "working layer" on claims-made basis Diverse mix of D&O and E&O Dedicated underwriting and actuarial team Sliding scale commissions High percentage of A-side Excludes corporate reimbursement for indemnification payments and entity liabili
Slide 29: Strong Catastrophe Risk Management
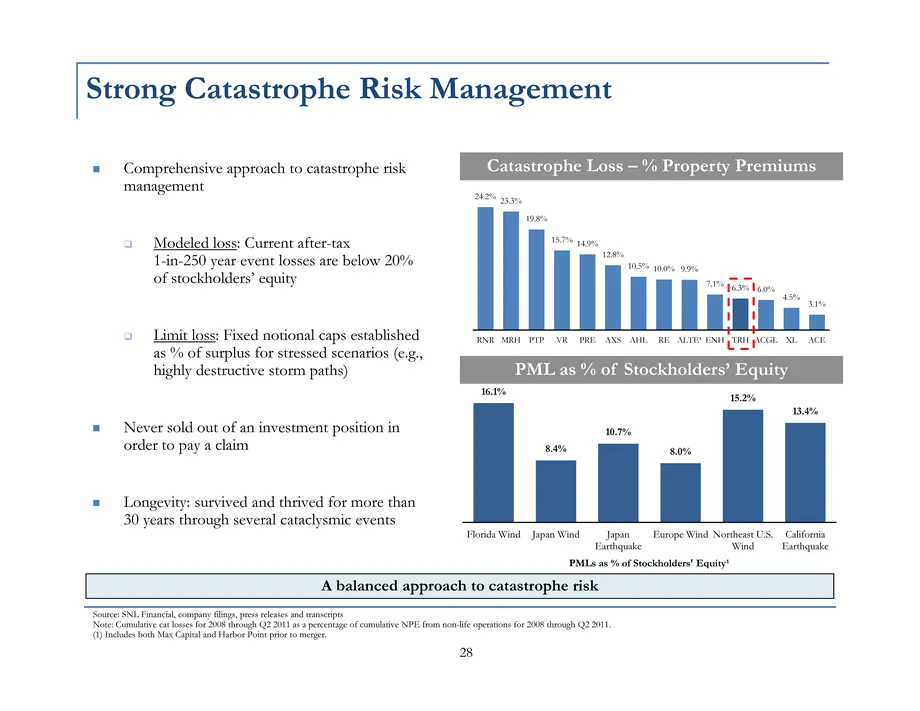
Strong Catastrophe Risk Management 28 Comprehensive approach to catastrophe risk management Modeled loss: Current after-tax 1-in-250 year event losses are below 20% of stockholders' equity Limit loss: Fixed notional caps established as % of surplus for stressed scenarios (e.g., highly destructive st
Slide 30: Strong Ultimate Accident Year Loss Ratio Performance
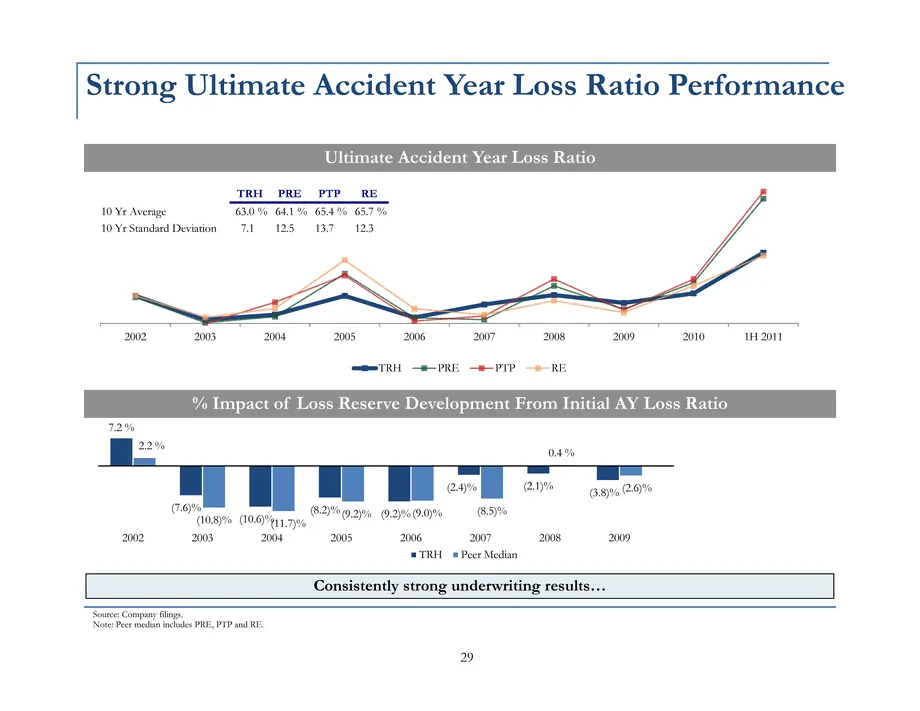
(CHART) Strong Ultimate Accident Year Loss Ratio Performance 29 Consistently strong underwriting results... Source: Company filings. Note: Peer median includes PRE, PTP and RE. Ultimate Accident Year Loss Ratio % Impact of Loss Reserve Development From Initial AY Loss Ratio (CHART)
Slide 31: Highly Efficient and Superior Low Cost Platform
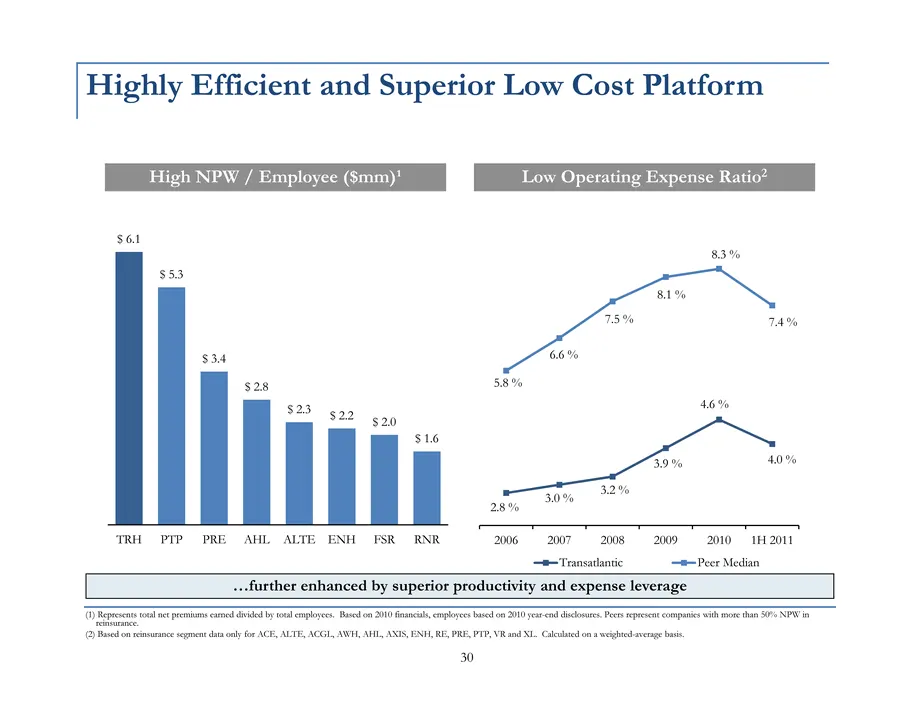
Highly Efficient and Superior Low Cost Platform Low Operating Expense Ratio2 High NPW / Employee ($mm)1 (1) Represents total net premiums earned divided by total employees. Based on 2010 financials, employees based on 2010 year-end disclosures. Peers represent companies with more than 50% NPW in rei
Slide 32: We Have A Strong Capital Position and Financial Strength Ratings
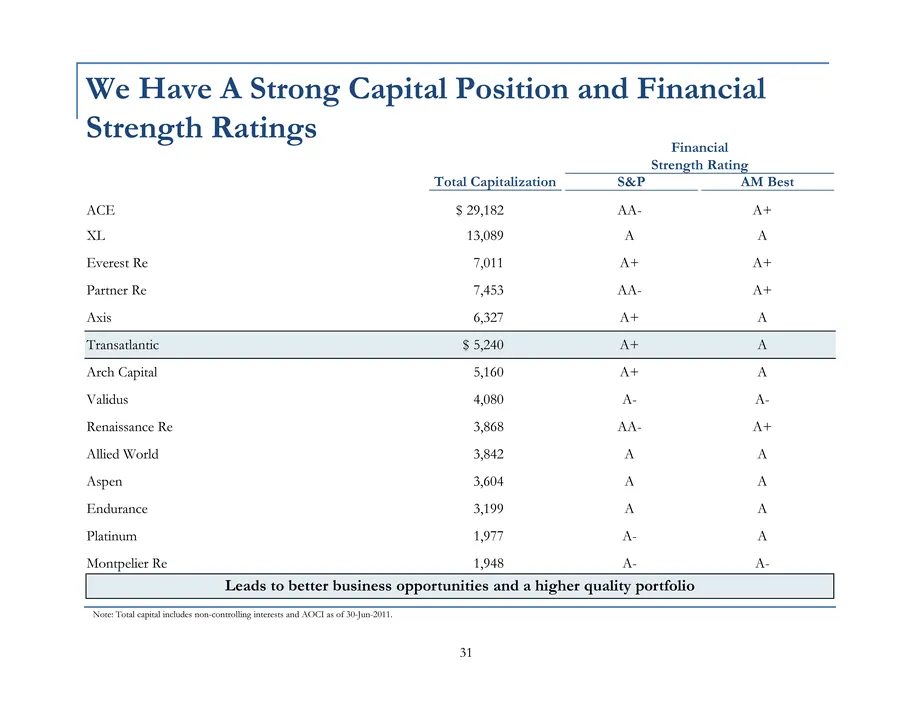
31 We Have A Strong Capital Position and Financial Strength Ratings Note: Total capital includes non-controlling interests and AOCI as of 30-Jun-2011. Leads to better business opportunities and a higher quality portfolio
Slide 33: We Are Optimizing Our Capital Position
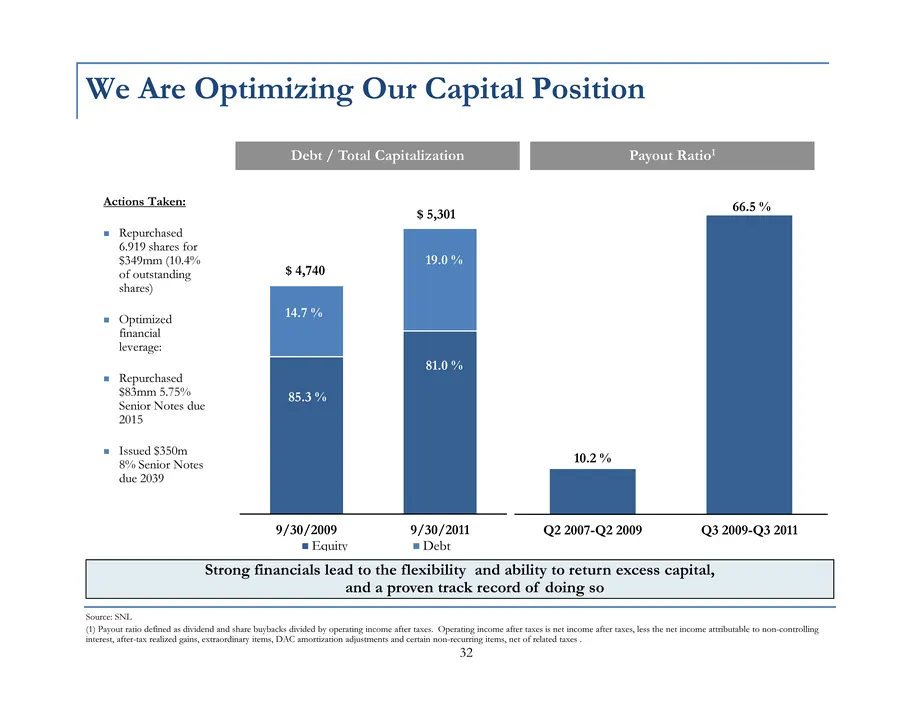
32 We Are Optimizing Our Capital Position Source: SNL (1) Payout ratio defined as dividend and share buybacks divided by operating income after taxes. Operating income after taxes is net income after taxes, less the net income attributable to non-controlling interest, after-tax realized gains, extra
Slide 34: Consistent and Long Term Book Value Creation
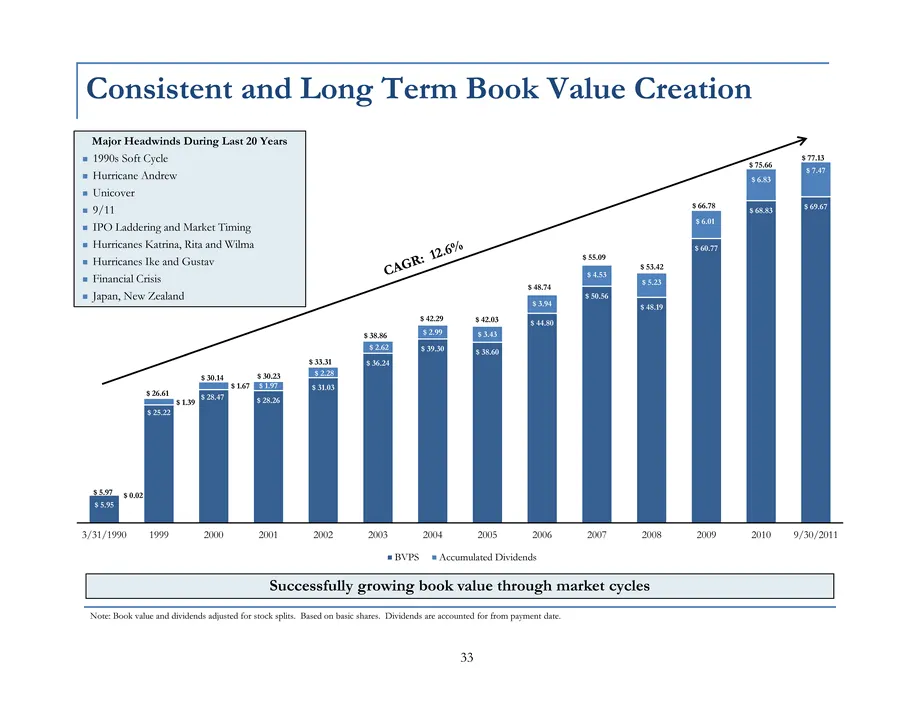
(CHART) Consistent and Long Term Book Value Creation CAGR: 12.6% 33 Note: Book value and dividends adjusted for stock splits. Based on basic shares. Dividends are accounted for from payment date. Major Headwinds During Last 20 Years 1990s Soft Cycle Hurricane Andrew Unicover 9/11 IPO Laddering and M
Slide 35: We Are Taking Specific Actions in Our Path Forward
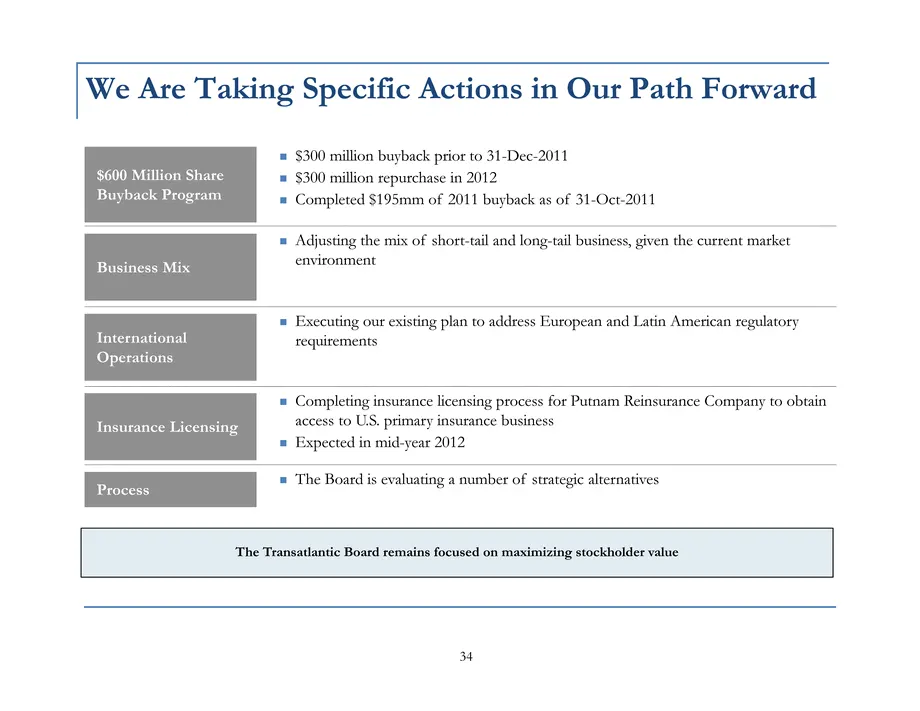
We Are Taking Specific Actions in Our Path Forward 34 $300 million buyback prior to 31-Dec-2011$300 million repurchase in 2012Completed $195mm of 2011 buyback as of 31-Oct-2011 Adjusting the mix of short-tail and long-tail business, given the current market environment Executing our existing plan to
Slide 36: IV. Conclusion
IV. Conclusion 35
Slide 37: Conclusion
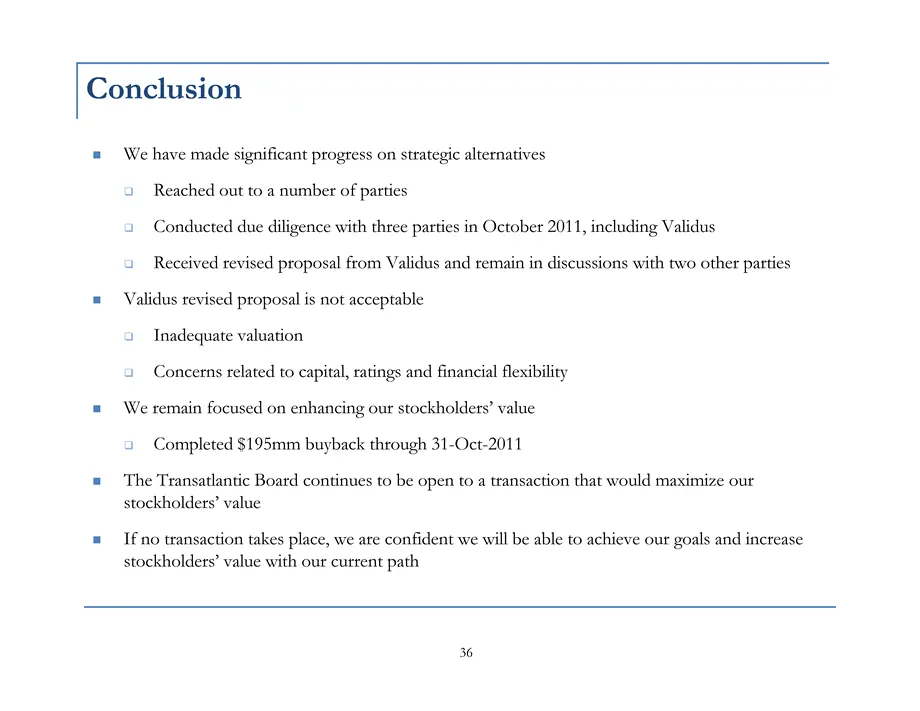
Conclusion 36 We have made significant progress on strategic alternatives Reached out to a number of parties Conducted due diligence with three parties in October 2011, including Validus Received revised proposal from Validus and remain in discussions with two other parties Validus revised proposal
Slide 38: Appendix
Appendix 37
Slide 39: Transatlantic Update
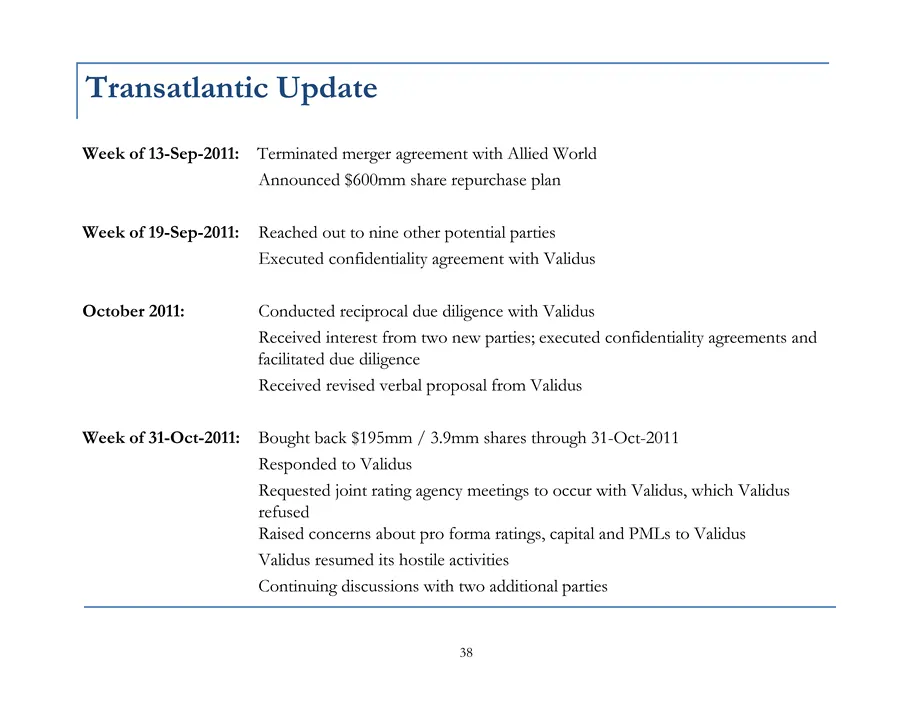
Transatlantic Update 38 Week of 13-Sep-2011: Terminated merger agreement with Allied World Announced $600mm share repurchase plan Week of 19-Sep-2011: Reached out to nine other potential parties Executed confidentiality agreement with Validus October 2011: Conducted reciprocal due diligence with Val
Slide 40: End Notes
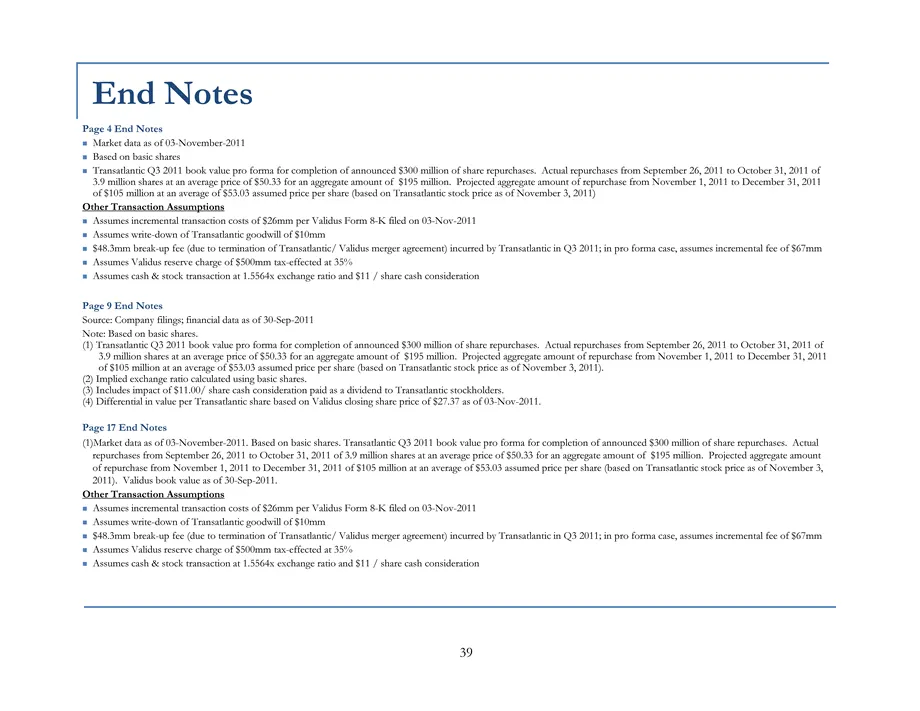
Page 4 End Notes Market data as of 03-November-2011 Based on basic shares Transatlantic Q3 2011 book value pro forma for completion of announced $300 million of share repurchases. Actual repurchases from September 26, 2011 to October 31, 2011 of 3.9 million shares at an average price of $50.33 for a
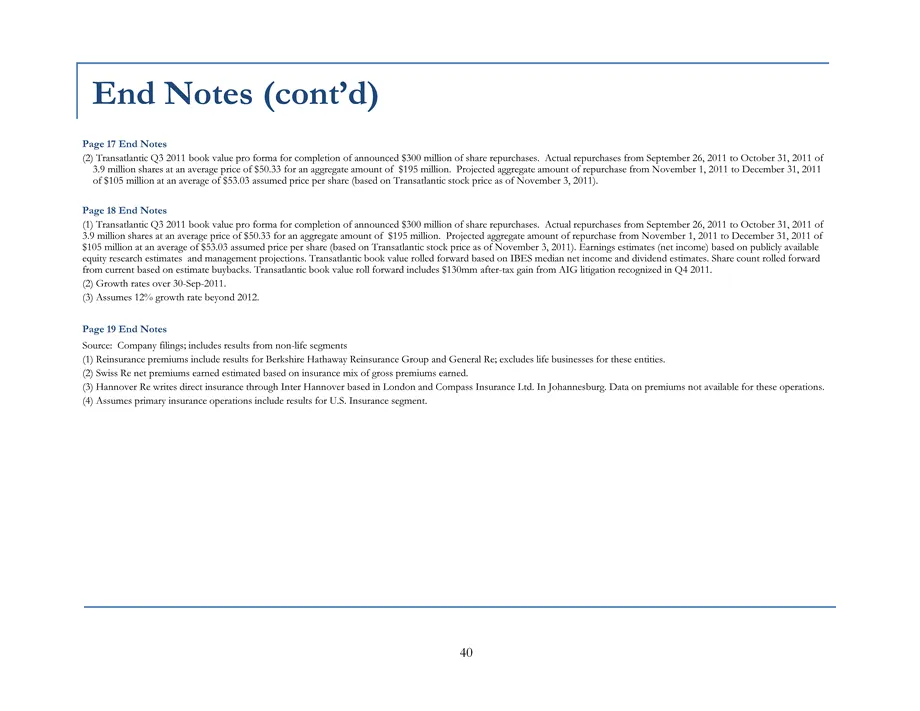
Slide 41: End Notes (cont'd)
End Notes (cont'd) 40 Page 17 End Notes (2) Transatlantic Q3 2011 book value pro forma for completion of announced $300 million of share repurchases. Actual repurchases from September 26, 2011 to October 31, 2011 of 3.9 million shares at an average price of $50.33 for an aggregate amount of $195 mil
Source: SEC EDGAR · 8-K filed Nov 4, 2011
More decks from Transatlantic Holdings Inc
 Q3 2012 Earnings Presentation10 slides · Nov 2, 2012
 Merger or Acquisition (December 2011)40 slides · Dec 1, 2011
 Merger or Acquisition (December 2011)39 slides · Dec 1, 2011
 Merger or Acquisition (November 2011)11 slides · Nov 29, 2011
 Merger or Acquisition (November 2011)28 slides · Nov 10, 2011
 Merger or Acquisition (September 2011)21 slides · Sep 19, 2011