American Realty Capital Trust Inc
American Realty Capital Trust — IPO Roadshow (February 2012)
48 slides from American Realty Capital Trust's IPO roadshow presentation, Feb 15, 2012

Slide 1: American Realty Capital Trust, Inc. NASDAQ: ARCT
American Realty Capital Trust, Inc. NASDAQ: “ARCT” NASDAQ: “ARCT” February 2012
Slide 2: Introductory Notes
Introductory Notes The data and other information described in these slides speaks as of the date of the slides or an earlier date indicated . Future performance may not be consistent with past performance, and is subject to change and inherent risks and uncertainties . This presentation contains ce
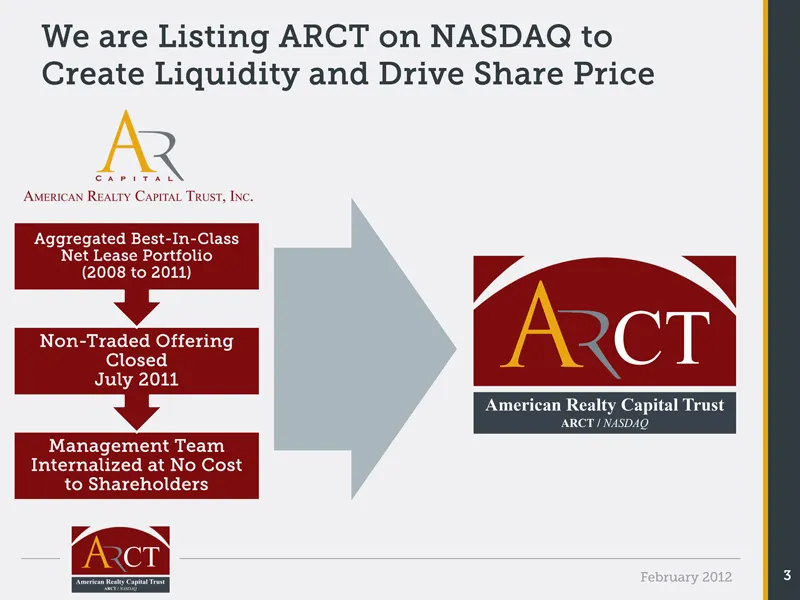
Slide 3: We are Listing ARCT on NASDAQ to Create Liquidity and Drive Share Price
We are Listing ARCT on NASDAQ to Create Liquidity and Drive Share Price Aggregated Best-In-Class Net Lease Portfolio (2008 to 2011) Non-Traded Offering Closed July 2011 Management Team Internalized at No Cost to Shareholders February 2012 3
Slide 4: Advantages to Listing vs. Selling the Portfolio
Advantages to Listing vs. Selling the Portfolio February 2012 4
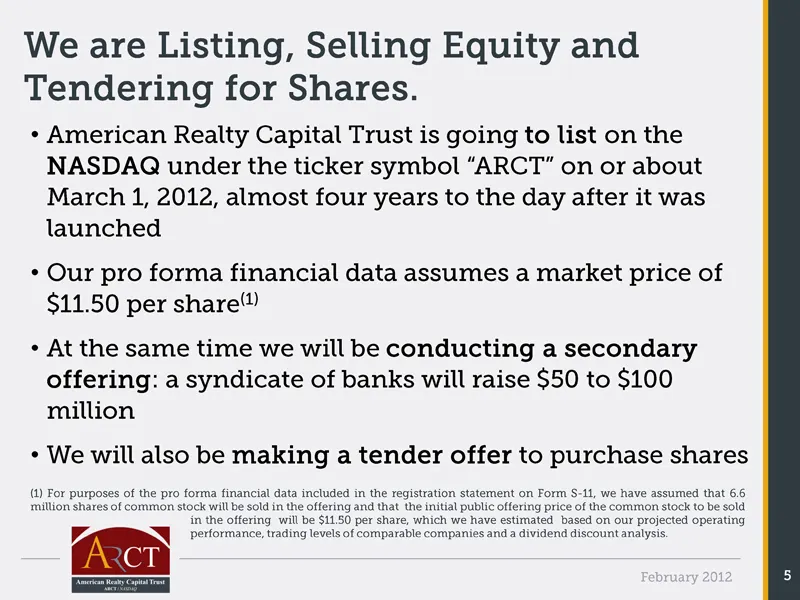
Slide 5: We are Listing, Selling Equity and Tendering for Shares
We are Listing, Selling Equity and Tendering for Shares .. • American Realty Capital Trust is going to list on the NASDAQ under the ticker symbol “ARCT” on or about March 1, 2012, almost four years to the day after it was launched • Our pro forma financial data assumes a market price of $11.50 per s
Slide 6: Why is ARCT Listing?
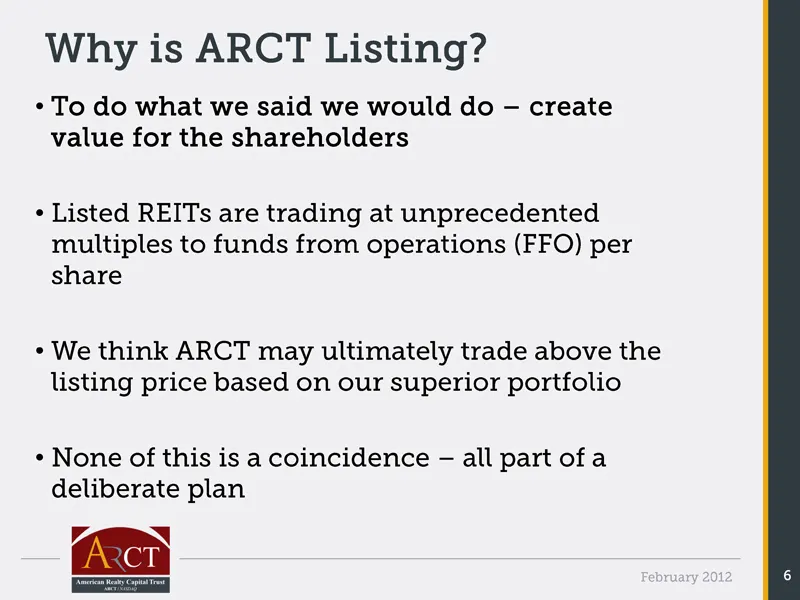
Why is ARCT Listing? • To do what we said we would do – create value for the shareholders • Listed REITs are trading at unprecedented multiples to funds from operations (FFO) per share • We think ARCT may ultimately trade above the listing price based on our superior portfolio • None of this is a co
Slide 7: Durable, Defensive Dividends
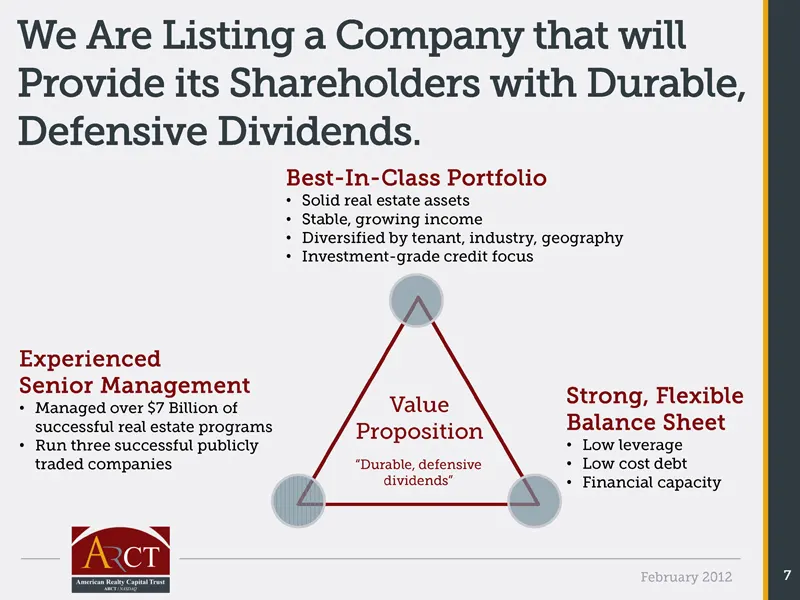
We Are Listing a Company that will Provide its Shareholders with Durable, Defensive Dividends . Best -In-Class Portfolio • Solid real estate assets • Stable, growing income • Diversified by tenant, industry, geography • Investment -grade credit focus Experienced Senior Management Value Strong, Flexi
Slide 8: ARCT Listing vs. Peers
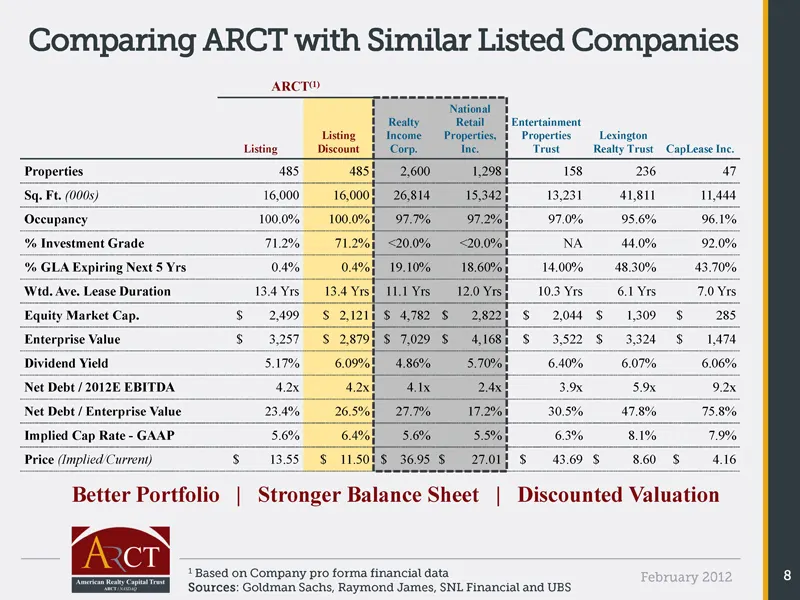
February 2012 8 ARCT(1) Listing Listing Discount Realty Income Corp. National Retail Properties, Inc. Entertainment Properties Trust Lexington Realty Trust CapLease Inc. Properties 485 485 2,600 1,298 158 236 47 Sq. Ft. (000s) 16,000 16,000 26,814 15,342 13,231 41,811 11,444 Occupancy 100.0% 100.0%
Slide 9: Proven Track Record
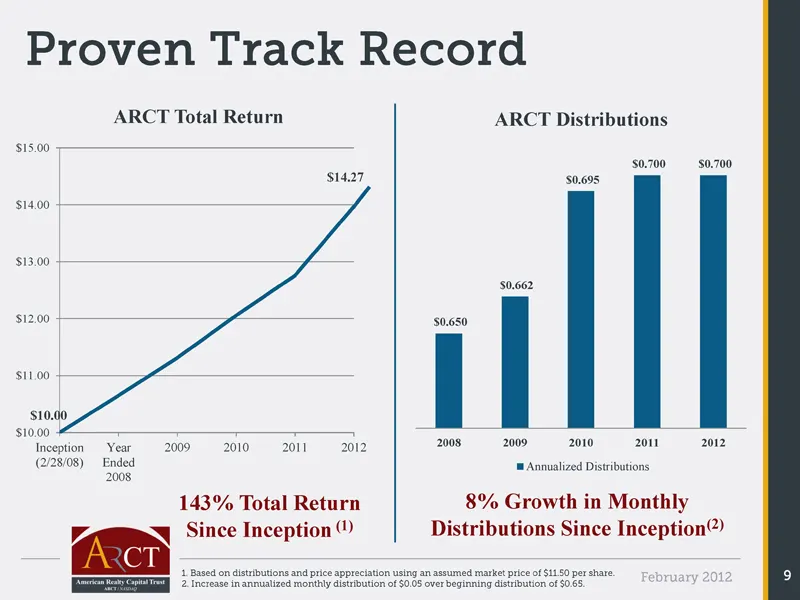
Proven Track Record ARCT Total Return ARCT Distributions $15.00 $0.700 $0.700 $14.27 $0.695 $14.00 $13.00 $0.662 $12.00 $0.650 $11.00 $10.00 $10.00 Inception Year 2009 2010 2011 2012 2008 2009 2010 2011 2012 (2/28/08) Ended Annualized Distributions 2008 143% Total Return 8% Growth in Monthly Since I
Slide 10: ARCT Promote – Interests Aligned
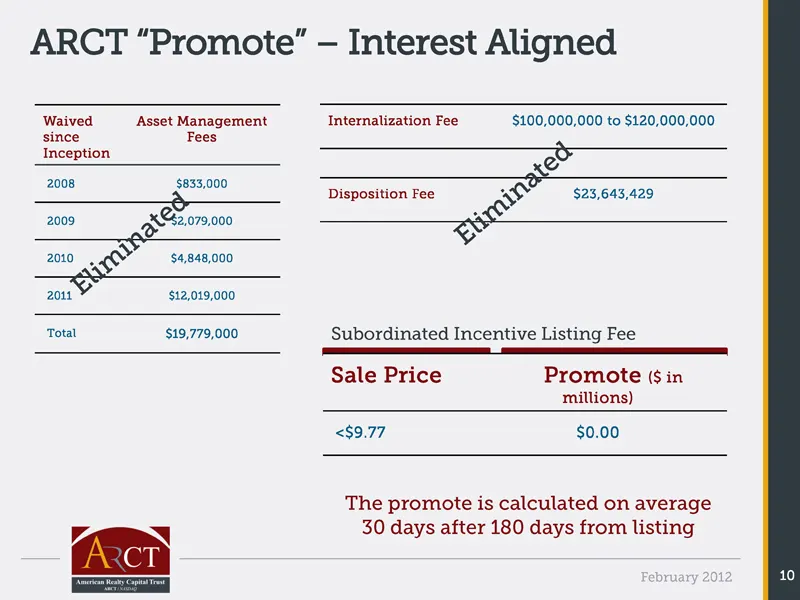
ARCT “Promote” – Interest Aligned Waived Asset Management Internalization Fee $100,000,000 to $120,000,000 since Fees Inception 2008 $833,000 Disposition Fee $23,643,429 2009 $2,079,000 2010 $4,848,000 2011 $12,019,000 Total $19,779,000 Subordinated Incentive Listing Fee Sale Price Promote ($ in mil
Slide 11: How Does the Listing Help our Investors?
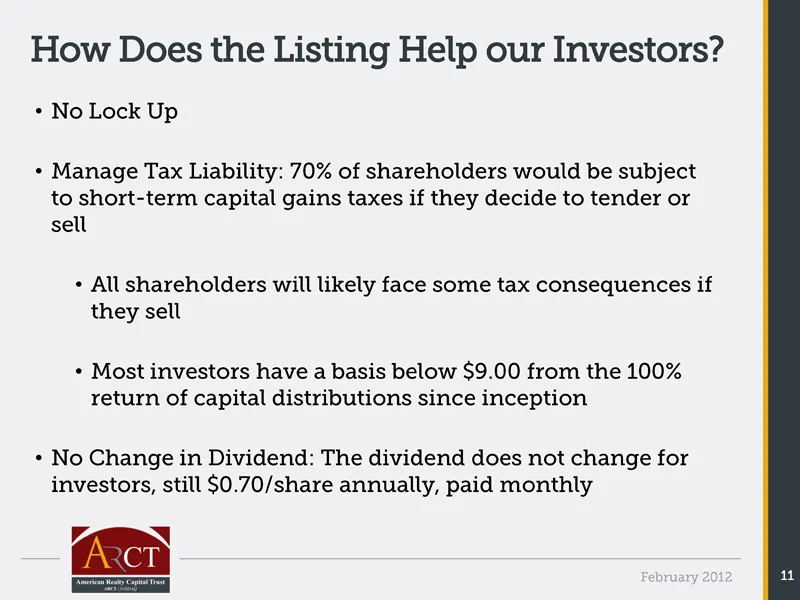
How Does the Listing Help our Investors? • No Lock Up • Manage Tax Liability: 70% of shareholders would be subject to short-term capital gains taxes if they decide to tender or sell • All shareholders will likely face some tax consequences if they sell • Most investors have a basis below $9.00 from

Slide 12: American Realty Capital Trust, Inc.
American Realty Capital Trust, Inc. NASDAQ: “ARCT” NASDAQ: “ARCT” February 2012
Slide 13: Low Risk Strategy
Low Risk Strategy Proven Management Team & Track Record Income, Growth and Value Creation Strong Balance Sheet February 2012 13
Slide 14: Best-In-Class Portfolio
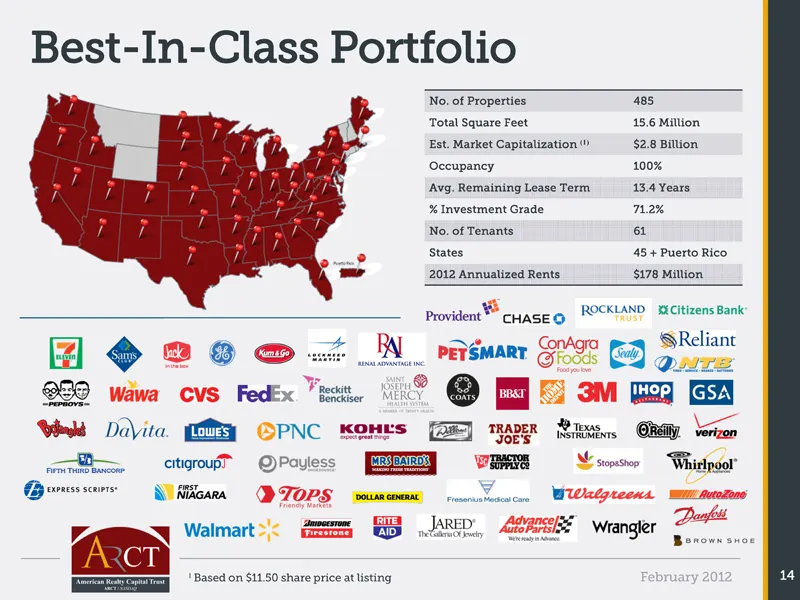
Best -In -Class Portfolio No. of Properties 485 Total Square Feet 15.6 Million Est. Market Capitalization (1) $2.8 Billion Occupancy 100% Avg. Remaining Lease Term 13.4 Years % Investment Grade 71.2% No. of Tenants 61 States 45 + Puerto Rico 2012 Annualized Rents $178 Million 1 Based on $11.50 share
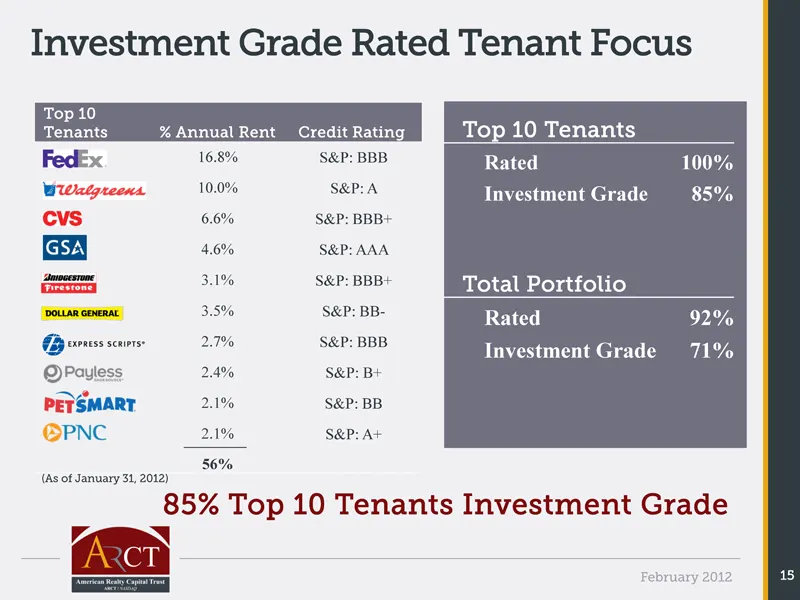
Slide 15: Investment Grade Rated Tenant Focus
Investment Grade Rated Tenant Focus Top 10 Tenants % Annual Rent Credit Rating Top 10 Tenants 16.8% S&P: BBB Rated 100% 10.0% S&P: A Investment Grade 85% 6.6% S&P: BBB+ 4.6% S&P: AAA 3.1% S&P: BBB+ Total Portfolio 3.5% S&P: BB- Rated 92% 2.7% S&P: BBB Investment Grade 71% 2.4% S&P: B+ 2.1% S&P: BB 2
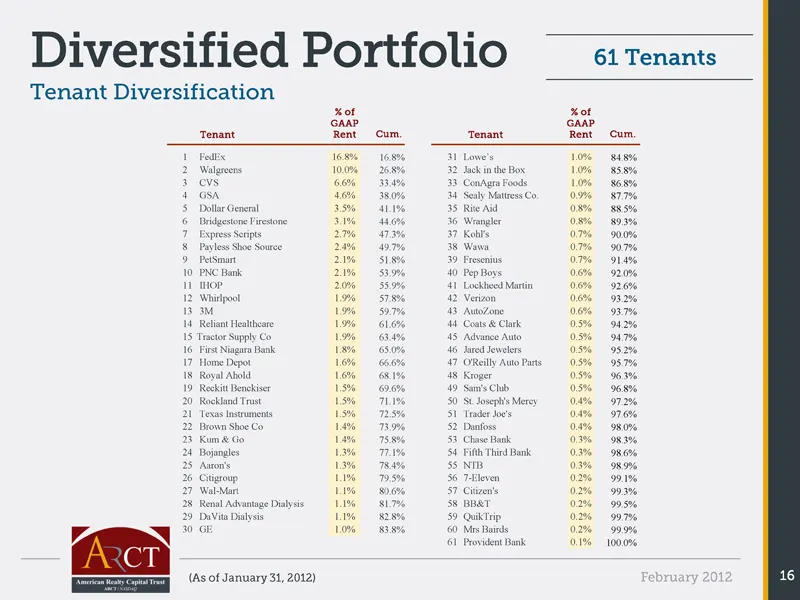
Slide 16: Diversified Portfolio Tenants
Diversified Portfolio 61 Tenants Tenant Diversification % of % of GAAP GAAP Tenant Rent Cum. Tenant Rent Cum. 1 FedEx 16.8% 16.8% 31 Lowe’s 1.0% 84.8% 2 Walgreens 10.0% 26.8% 32 Jack in the Box 1.0% 85.8% 3 CVS 6.6% 33.4% 33 ConAgra Foods 1.0% 86.8% 4 GSA 4.6% 38.0% 34 Sealy Mattress Co. 0.9% 87.7%
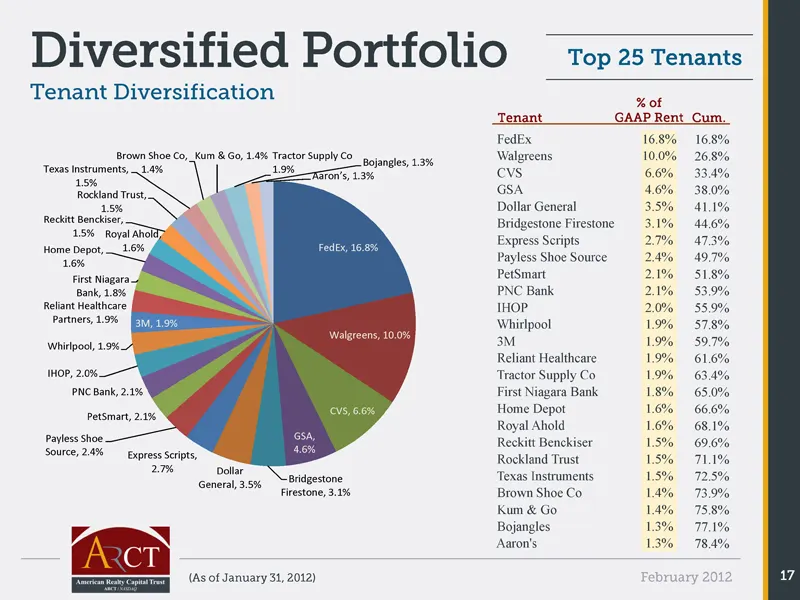
Slide 17: Diversified Portfolio Top Tenants
Diversified Portfolio Top 25 Tenants Tenant Diversification % of Tenant GAAP Rent Cum. FedEx 16.8% 16.8% Brown Shoe Co, .9Kum & Go, 1.4% Tractor Supply Co .9 Walgreens 10.0% 26.8% Bojangles, 1.3% Texas Instruments, .91.4% 1.9% CVS 6.6% 33.4% Aaron’s, 1.3% 1.5% GSA 4.6% 38.0% Rockland Trust, .9 1.5%
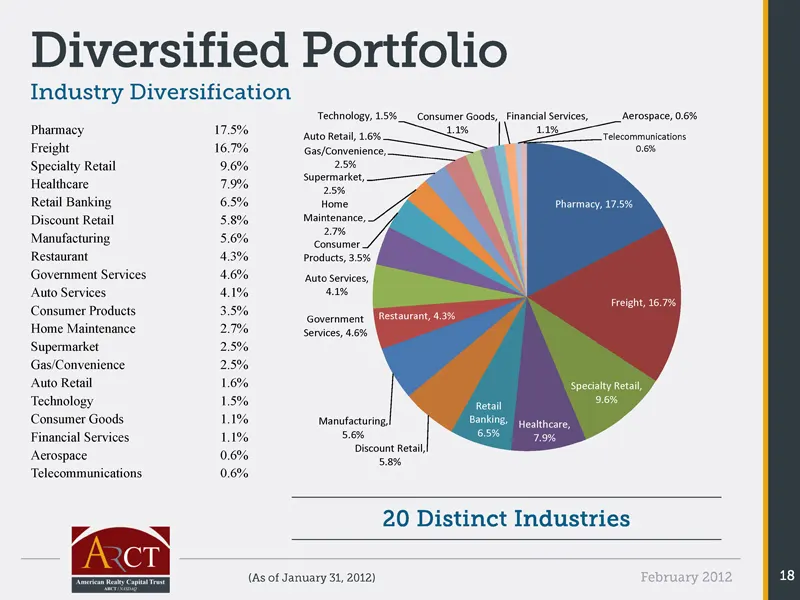
Slide 18: Diversified Portfolio Industry Diversification
Diversified Portfolio Industry Diversification Technology, 1.5% Consumer Goods, .9Financial Services, ..9 Aerospace, 0.6% Pharmacy 17.5% 1.1% 1.1% Auto Retail, 1.6% Telecommunications Freight 16.7% Gas/Convenience, .9 0.6% Specialty Retail 9.6% 2.5% Supermarket, .9 Healthcare 7.9% 2.5% Retail Bankin
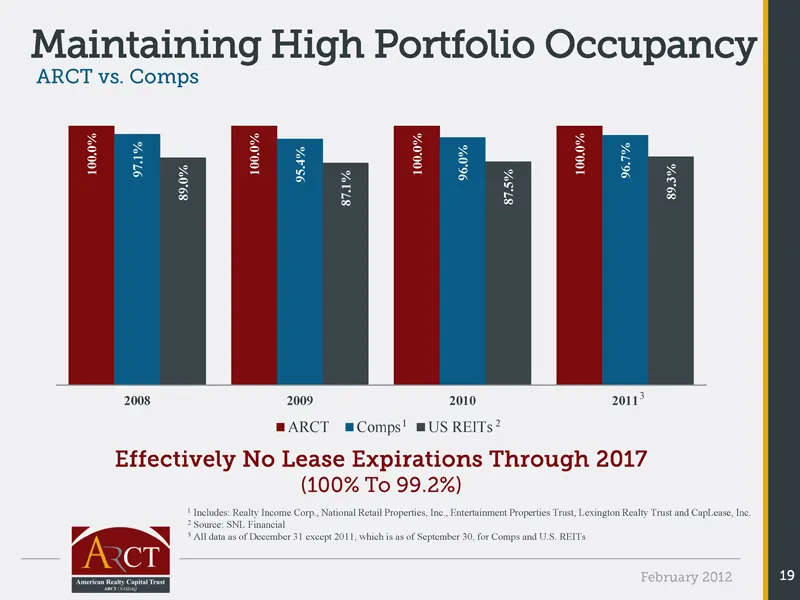
Slide 19: Maintaining High Portfolio Occupancy
Maintaining High Portfolio Occupancy ARCT vs. Comps 0% 0% 0% 0% . 1% . . 0% . 7% . 4% . . 100 97 100 . 100 100 96 0% 95 96 3% . 1% 5% . 89 . . 89 87 87 2008 2009 2010 2011 3 ARCT Comps 1 US REITs 2 Effectively No Lease Expirations Through 2017 (100% To 99.2%) 1 Includes: Realty Income Corp., Nationa
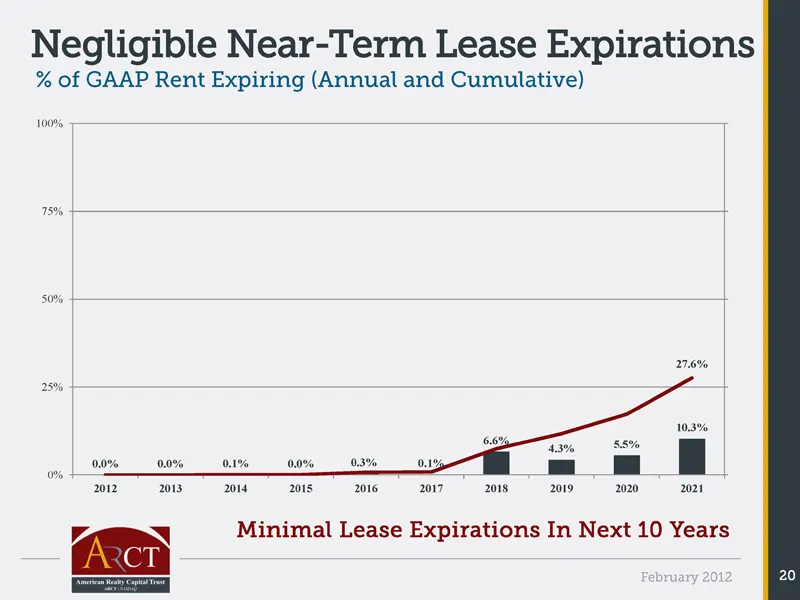
Slide 20: Negligible Near-Term Lease Expirations
Negligible Near-Term Lease Expirations % of GAAP Rent Expiring (Annual and Cumulative) 100% 75% 50% 27.6% 25% 10.3% 6.6% 5.5% 4.3% 0.0% 0.0% 0.1% 0.0% 0.3% 0.1% 0% 2012 2013 2014 2015 2016 2017 2018 2019 2020 2021 Minimal Lease Expirations In Next 10 Years
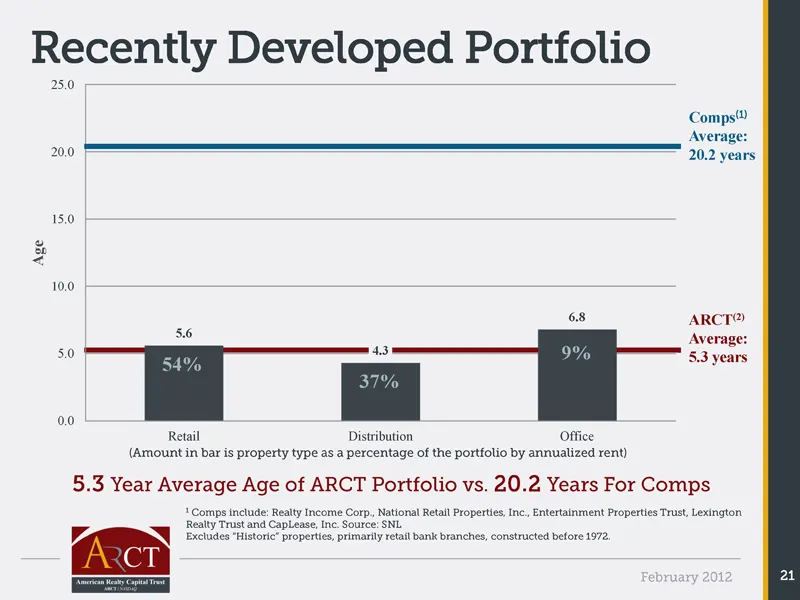
Slide 21: Recently Developed Portfolio
Recently Developed Portfolio 25.0 Comps (1) Average: 20.0 20.2 years 15.0 Age 10.0 6.8 ARCT (2) 5.6 Average: 5.0 4.3 9% 5.3 years 54% 37% 0.0 Retail Distribution Office (Amount in bar is property type as a percentage of the portfolio by annualized rent) 5.3 Year Average Age of ARCT Portfolio vs. 20.
Slide 22: Proven Management Team & Track Record
Low Risk Strategy Proven Management Team & Track Record Income, Growth and Value Creation Strong Balance Sheet February 2012 22
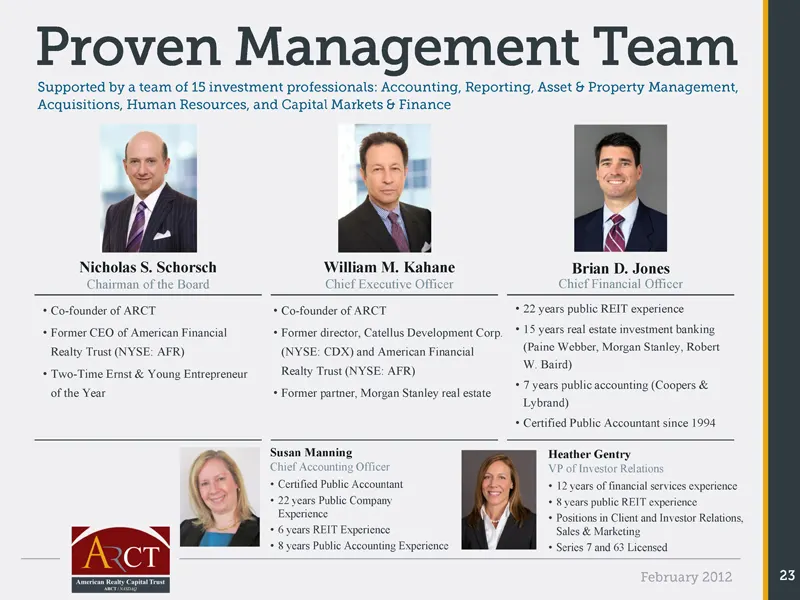
Slide 23: Proven Management Team
Proven Management Team Supported by a team of 15 investment professionals: Accounting, Reporting, Asset & Property Management, Acquisitions, Human Resources, and Capital Markets & Finance Nicholas S. Schorsch William M. Kahane Brian D. Jones Chairman of the Board Chief Executive Officer Chief Financ
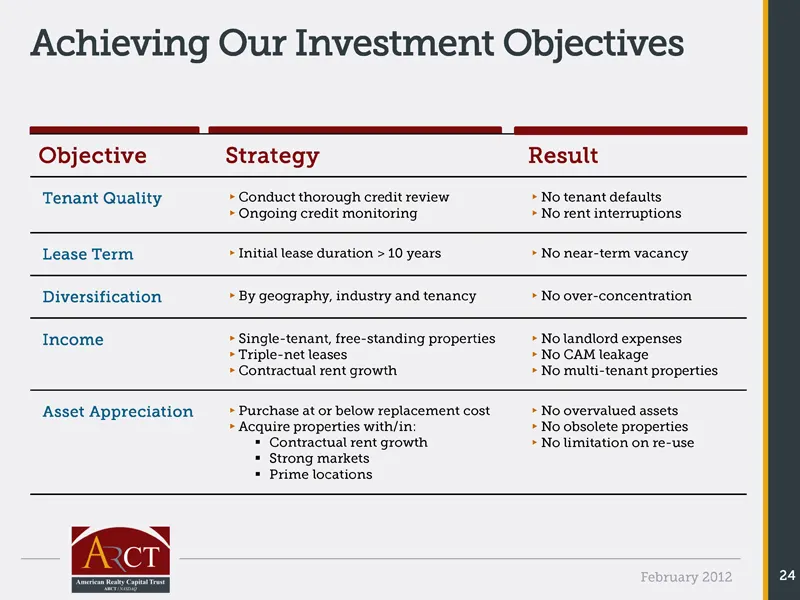
Slide 24: Achieving Our Investment Objectives
Achieving Our Investment Objectives Objective Strategy Result Tenant Quality o Conduct thorough credit review o No tenant defaults o Ongoing credit monitoring o No rent interruptions Lease Term o Initial lease duration > 10 years o No near-term vacancy Diversification o By geography, industry and te
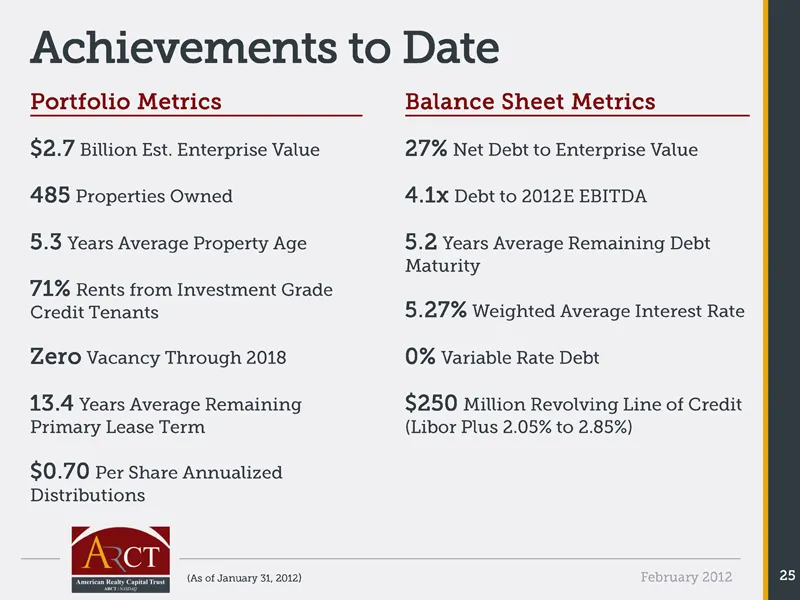
Slide 25: Achievements to Date
Achievements to Date Portfolio Metrics Balance Sheet Metrics $2.7 Billion Est. Enterprise Value 27% Net Debt to Enterprise Value 485 Properties Owned 4.1x Debt to 2012E EBITDA 5.3 Years Average Property Age 5.2 Years Average Remaining Debt Maturity 71% Rents from Investment Grade Credit Tenants 5.27
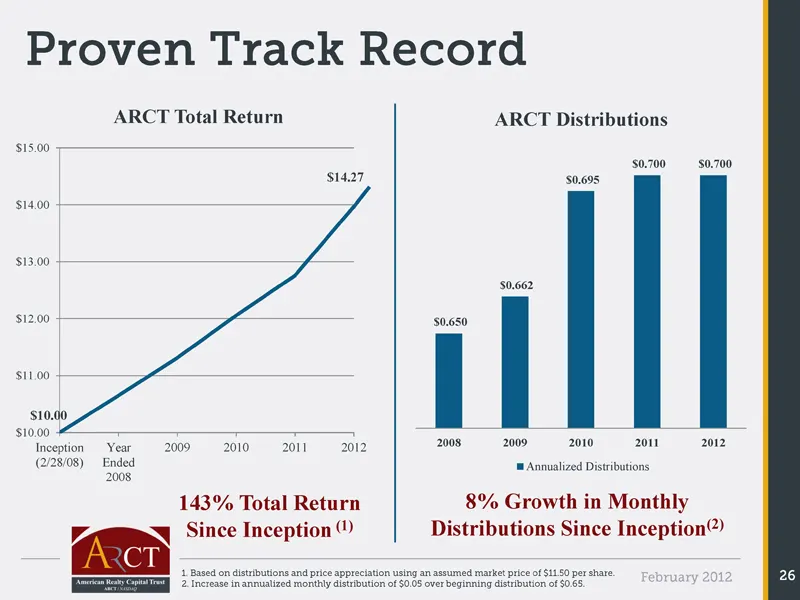
Slide 26: Proven Track Record
Proven Track Record ARCT Total Return ARCT Distributions $15.00 $0.700 $0.700 $14.27 $0.695 $14.00 $13.00 $0.662 $12.00 $0.650 $11.00 $10.00 $10.00 Inception Year 2009 2010 2011 2012 2008 2009 2010 2011 2012 (2/28/08) Ended Annualized Distributions 2008 143% Total Return 8% Growth in Monthly Since I

Slide 27: Income, Growth and Value Creation
Low Risk Strategy Proven Management Team & Track Record Income, Growth and Value Creation Strong Balance Sheet February 2012 27
Slide 28: Investment Goals – Income, Growth, Value Creation
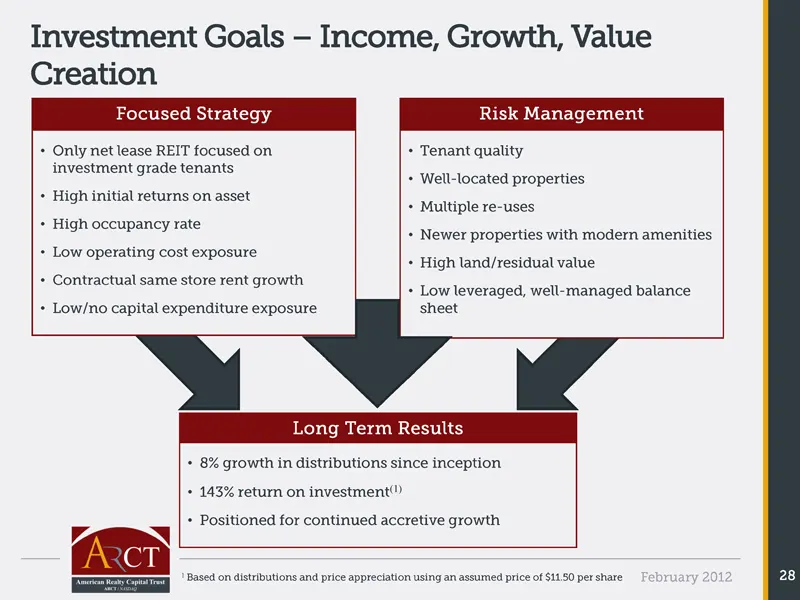
Investment Goals – Income, Growth, Value Creation Focused Strategy Risk Management • Only net lease REIT focused on • Tenant quality investment grade tenants • Well-located properties • High initial returns on asset • Multiple re-uses • High occupancy rate • Newer properties with modern amenities •
Slide 29: Strong Income Growth
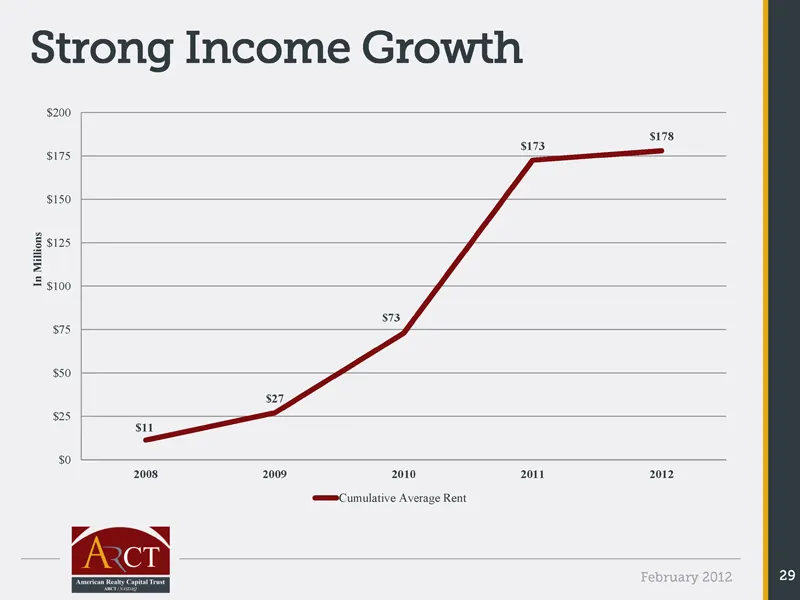
Strong Income Growth $200 $178 $173 $175 $150 Millions $125 In $100 $73 $75 $50 $27 $25 $11 $0 2008 2009 2010 2011 2012 Cumulative Average Rent February 2012 29
Slide 30: Predictable, Sustainable Distributions
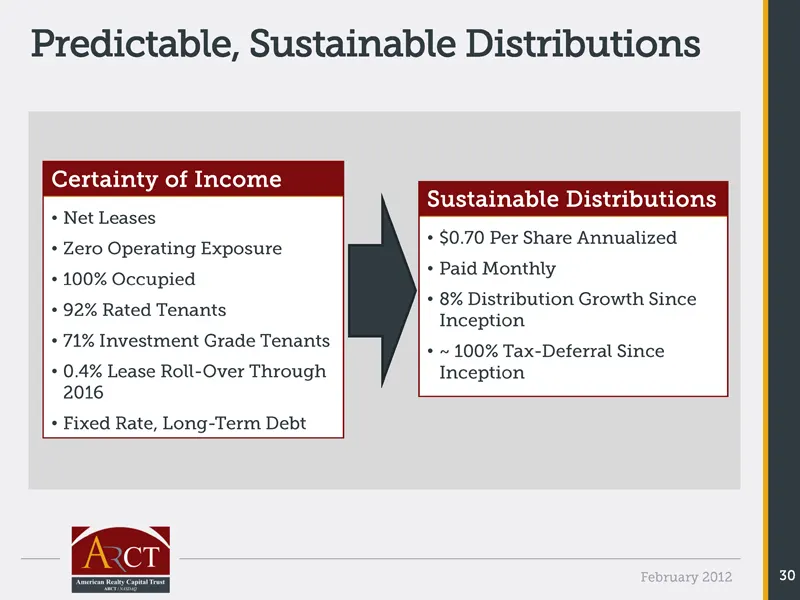
Predictable, Sustainable Distributions Certainty of Income Sustainable Distributions o Net Leases o $0.70 Per Share Annualized o Zero Operating Exposure o Paid Monthly o 100% Occupied o 8% Distribution Growth Since o 92% Rated Tenants Inception o 71% Investment Grade Tenants o ~ 100% Tax-Deferral Si
Slide 31: Revenue Growth
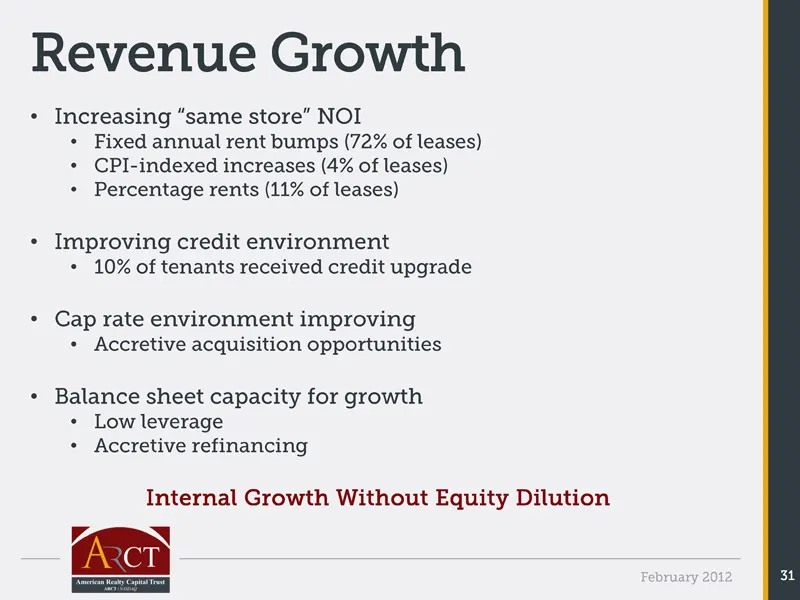
Revenue Growth • Increasing “same store” NOI • Fixed annual rent bumps (72% of leases) • CPI-indexed increases (4% of leases) • Percentage rents (11% of leases) • Improving credit environment • 10% of tenants received credit upgrade • Cap rate environment improving • Accretive acquisition opportunit
Slide 32: Value Creation Tools
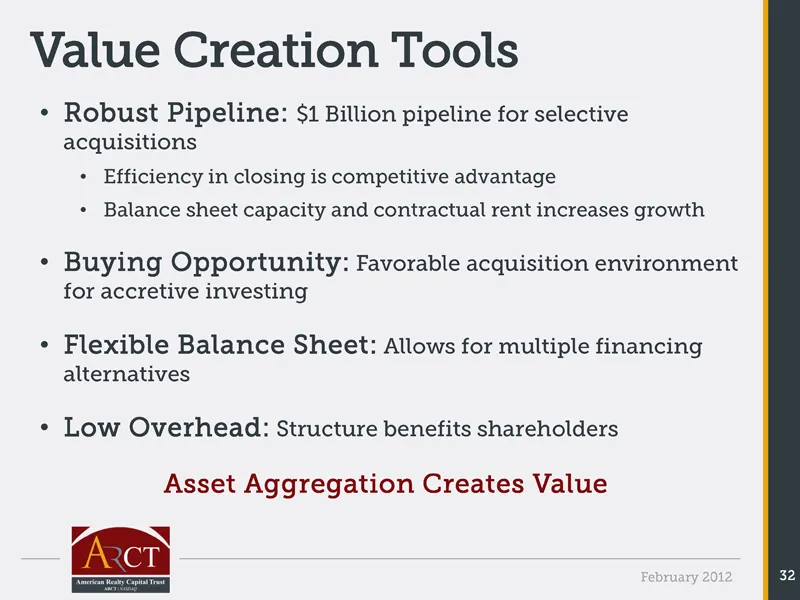
Value Creation Tools • Robust Pipeline: $1 Billion pipeline for selective acquisitions • Efficiency in closing is competitive advantage • Balance sheet capacity and contractual rent increases growth • Buying Opportunity: Favorable acquisition environment for accretive investing • Flexible Balance Sh
Slide 33: Strong Balance Sheet
Low Risk Strategy Proven Management Team & Track Record Income, Growth and Value Creation Strong Balance Sheet February 2012 33
Slide 34: Debt Maturities Well Laddered and Manageable
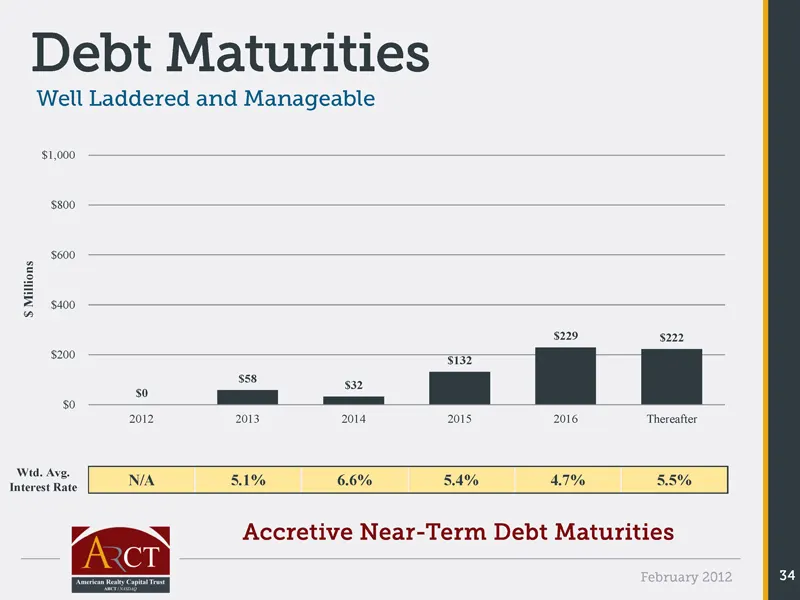
Debt Maturities Well Laddered and Manageable $1,000 $800 $600 Millions $400 $ $229 $222 $200 $132 $58 $32 $0 $0 2012 2013 2014 2015 2016 Thereafter Wtd. Avg. N/A 5.1% 6.6% 5.4% 4.7% 5.5% Interest Rate Accretive Near -Term Debt Maturities February 2012 34
Slide 35: Declining Cost of Debt Financing
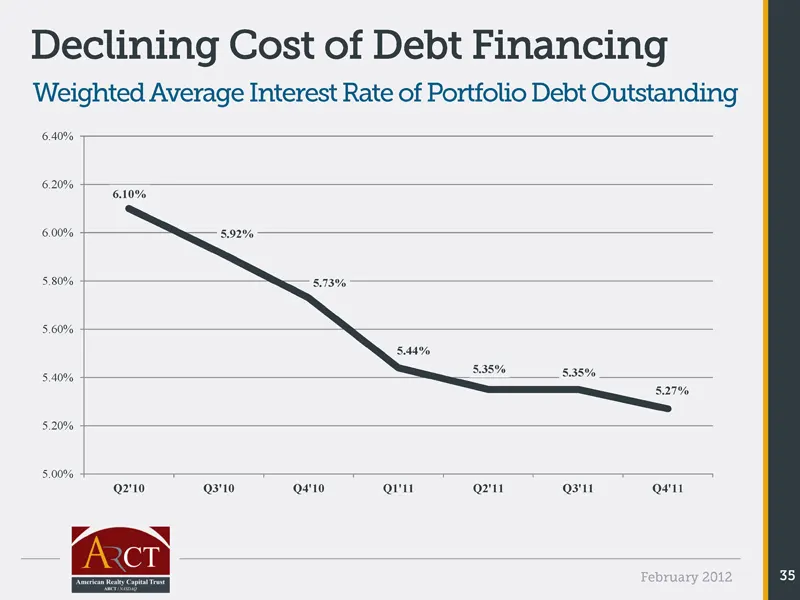
Declining Cost of Debt Financing Weighted Average Interest Rate of Portfolio Debt Outstanding 6.40% 6.20% 6.10% 6.00% 5.92% 5.80% 5.73% 5.60% 5.44% 5.35% 5.35% 5.40% 5.27% 5.20% 5.00% Q2'10 Q3'10 Q4'10 Q1'11 Q2'11 Q3'11 Q4'11 February 2012 35
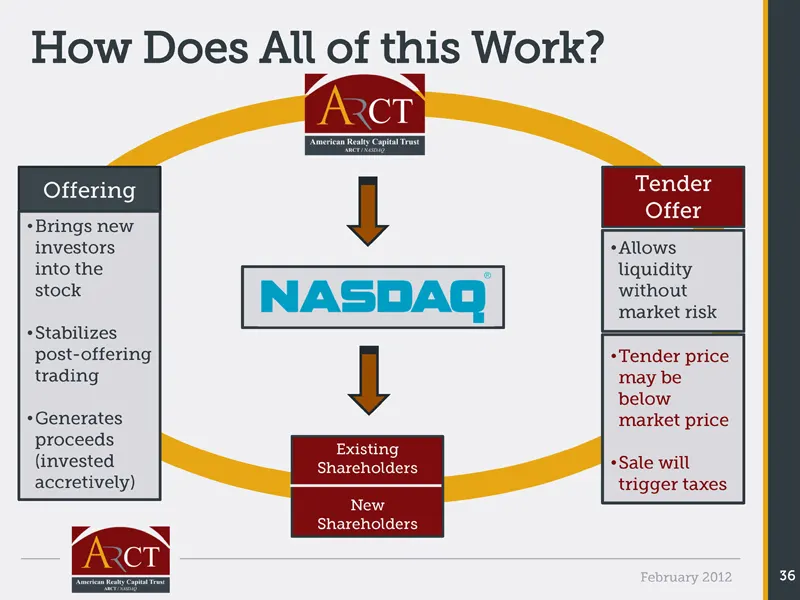
Slide 36: How Does All of this Work?
How Does All of this Work? Offering Tender Offer • Brings new investors • Allows into the liquidity stock without market risk • Stabilizes post-offering • Tender price trading may be below • Generates market price proceeds Existing (invested Shareholders • Sale will accretively) trigger taxes New Sh
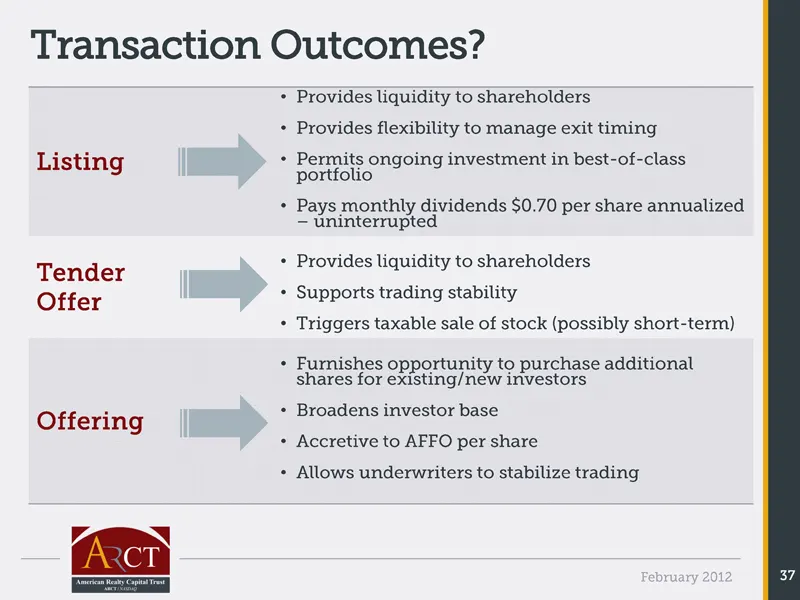
Slide 37: Transaction Outcomes
Transaction Outcomes? • Provides liquidity to shareholders • Provides flexibility to manage exit timing Listing • Permits ongoing investment in best-of-class portfolio • Pays monthly dividends $0.70 per share annualized – uninterrupted Tender • Provides liquidity to shareholders Offer • Supports tra
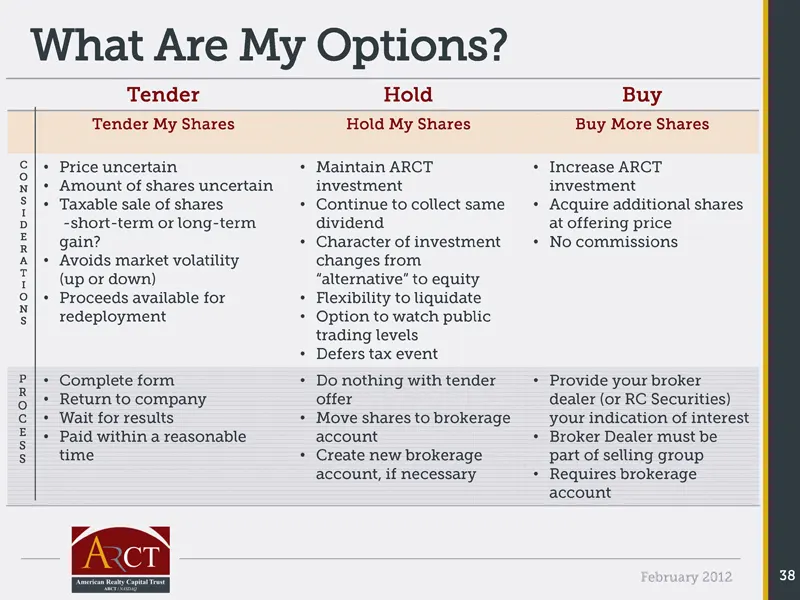
Slide 38: What Are My Options?
What Are My Options? Tender Hold Buy Tender My Shares Hold My Shares Buy More Shares C • Price uncertain • Maintain ARCT • Increase ARCT O N • Amount of shares uncertain investment investment S • Taxable sale of shares • Continue to collect same • Acquire additional shares I D -short-term or long-te
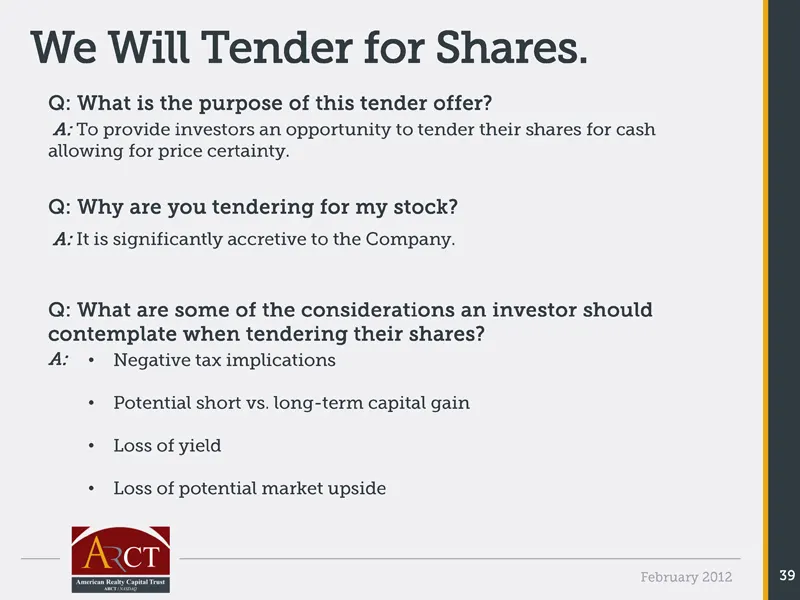
Slide 39: We Will Tender for Shares
We Will Tender for Shares . Q: What is the purpose of this tender offer? A: To provide investors an opportunity to tender their shares for cash allowing for price certainty . Q: Why are you tendering for my stock? A: It is significantly accretive to the Company . Q: What are some of the consideratio

Slide 40: Send us a message
Send us a message You may contact us at Brian Jones, Chief Financial Officer OFFICE (212) 415-6559 | MOBILE (415) 999-3591 EMAIL bjones@arctreit .com Heather Gentry , VP of Investor Relations OFFICE (212) 415-6532 | MOBILE (917) 232-1205 EMAIL hgentry@arctreit .com American Realty Capital Trust 405
Slide 41: Appendix
APPENDIX February 2012 41
Slide 42: Property Type Benchmarking
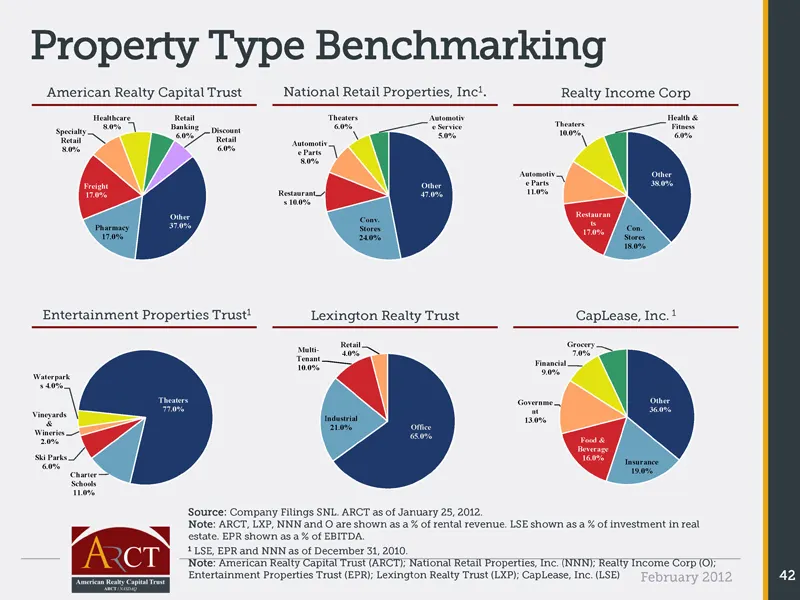
Property Type Benchmarking American Realty Capital Trust National Retail Properties, Inc 1 . Realty Income Corp Healthcare Retail Theaters Automotiv Health & 8.0% Banking 6.0% e Service Theaters Fitness Specialty Discount 10.0% 6.0% 5.0% 6.0% Retail Retail Automotiv 8.0% 6.0% e Parts 8.0% Automotiv
Slide 43: Geographic Benchmarking
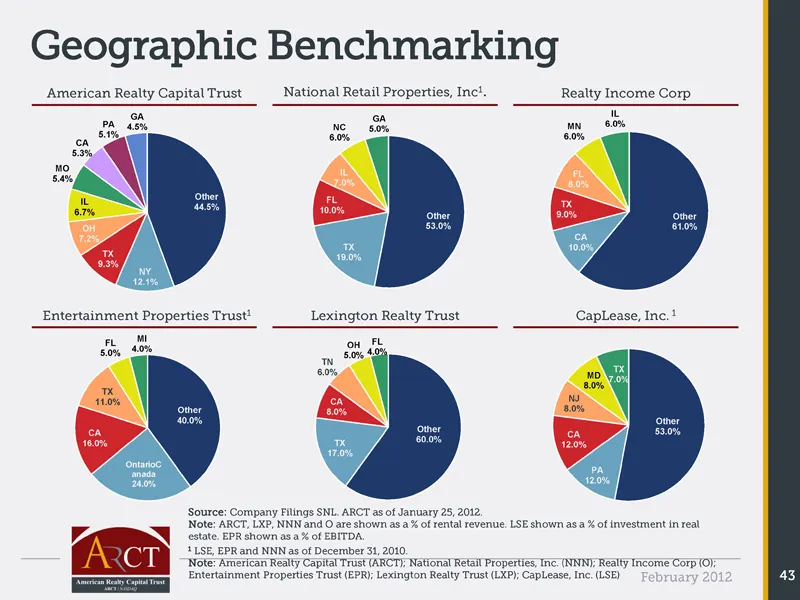
Geographic Benchmarking American Realty Capital Trust National Retail Properties, Inc 1 . Realty Income Corp GA IL GA PA 4.5% NC MN 6.0% 5.0% 5.1% 6.0% 6.0% CA 5.3% MO IL FL 5.4% 7.0% 8.0% Other FL IL TX 44.5% 10.0% 6.7% Other 9.0% Other OH 53.0% 61.0% 7.2% CA TX 10.0% TX 19.0% 9.3% NY 12.1% Enterta
Slide 44: Balance Sheet Benchmarking
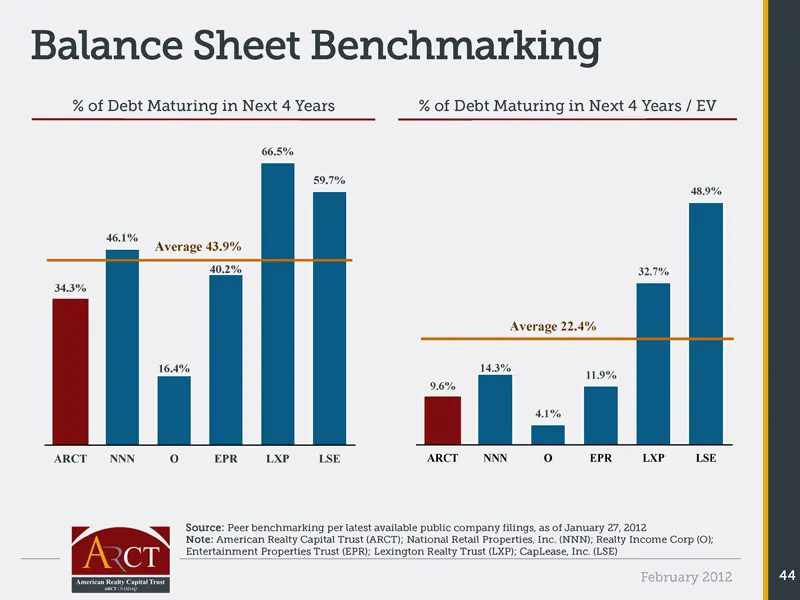
Balance Sheet Benchmarking % of Debt Maturing in Next 4 Years % of Debt Maturing in Next 4 Years / EV 66.5% 59.7% 48.9% 46.1% Average 43.9% 40.2% 32.7% 34.3% Average 22.4% 16.4% 14.3% 11.9% 9.6% 4.1% ARCT NNN O EPR LXP LSE ARCT NNN O EPR LXP LSE Source: Peer benchmarking per latest available public
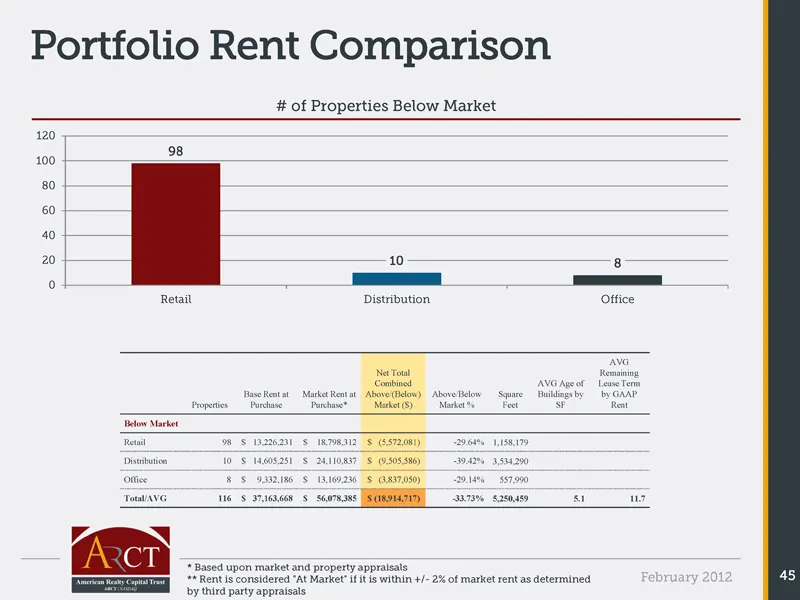
Slide 45: Portfolio Rent Comparison – Below Market
Portfolio Rent Comparison # of Properties Below Market 120 98 100 80 60 40 20 10 8 0 Retail Distribution Office AVG Net Total Remaining Combined AVG Age of Lease Term Base Rent at Market Rent at Above/(Below) Above/Below Square Buildings by by GAAP Properties Purchase Purchase* Market ($) Market % F
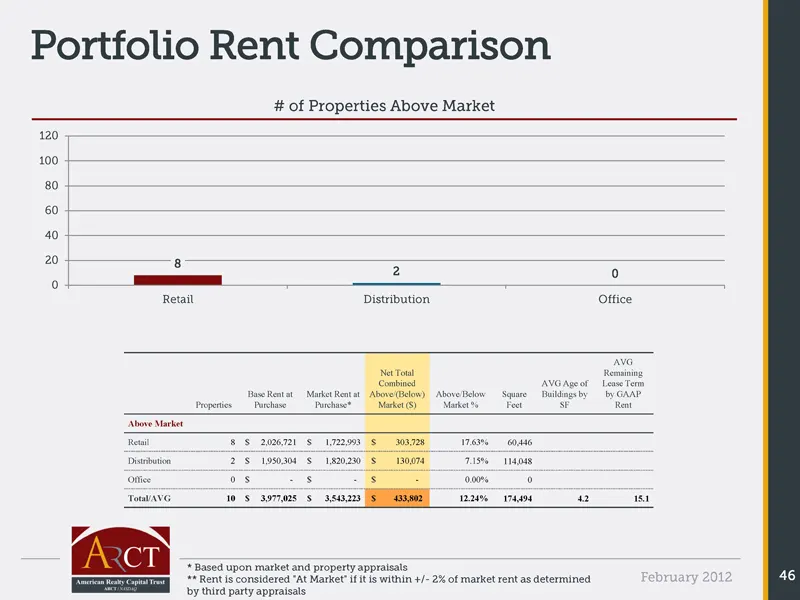
Slide 46: Portfolio Rent Comparison – Above Market
Portfolio Rent Comparison # of Properties Above Market 120 100 80 60 40 20 8 2 0 0 Retail Distribution Office AVG Net Total Remaining Combined AVG Age of Lease Term Base Rent at Market Rent at Above/(Below) Above/Below Square Buildings by by GAAP Properties Purchase Purchase* Market ($) Market % Fee
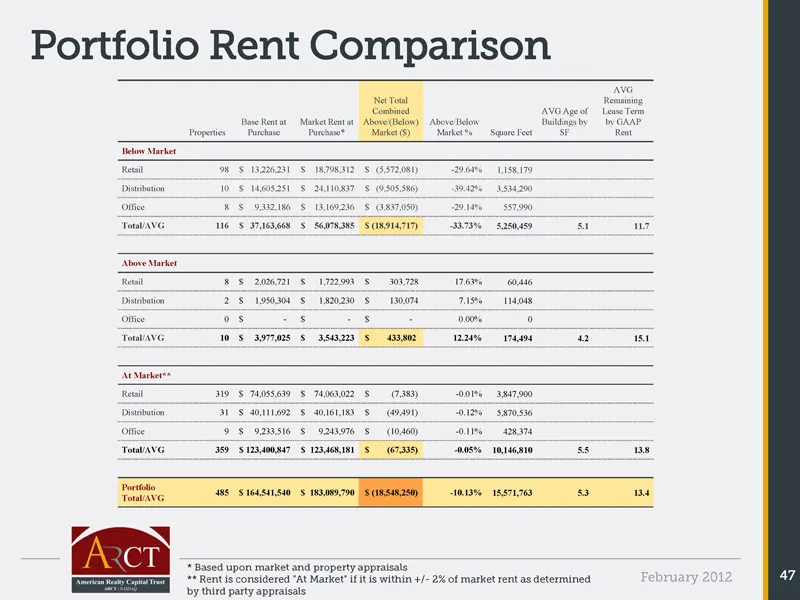
Slide 47: Portfolio Rent Comparison
Portfolio Rent Comparison AVG Net Total Remaining Combined AVG Age of Lease Term Base Rent at Market Rent at Above/(Below) Above/Below Buildings by by GAAP Properties Purchase Purchase* Market ($) Market % Square Feet SF Rent Below Market Retail 98 $ 13,226,231 $ 18,798,312 $ (5,572,081) -29.64% 1,1
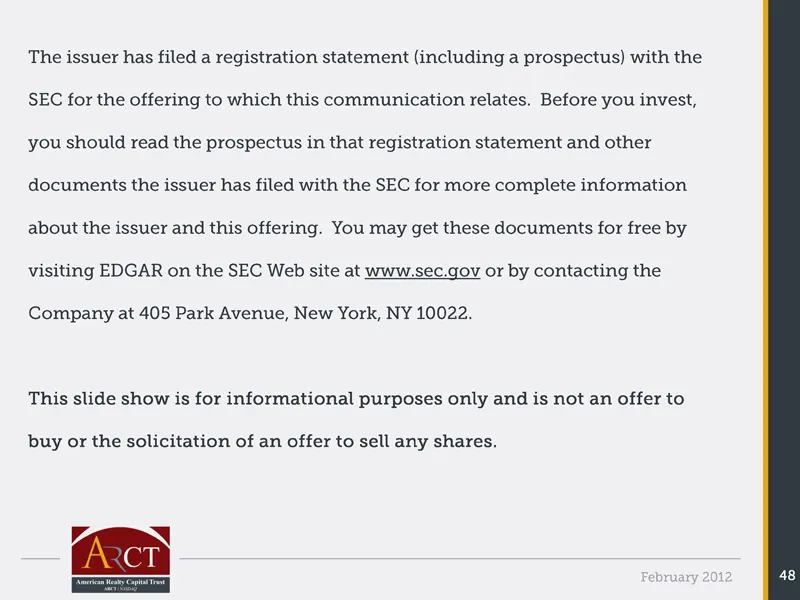
Slide 48: Registration statement legend
The issuer has filed a registration statement (including a prospectus) with the SEC for the offering to which this communication relates . Before you invest, you should read the prospectus in that registration statement and other documents the issuer has filed with the SEC for more complete informat
Source: SEC EDGAR · FWP filed Feb 15, 2012
More decks from American Realty Capital Trust Inc
 Merger or Acquisition (December 2012)35 slides · Dec 21, 2012
 Merger or Acquisition (September 2012)19 slides · Sep 6, 2012
 IPO Roadshow (August 2012)20 slides · Aug 6, 2012
 IPO Roadshow (June 2012)27 slides · Jun 11, 2012
 IPO Roadshow (May 2012)10 slides · May 14, 2012
 Investor Presentation (May 2012)22 slides · May 7, 2012