American Realty Capital Trust Inc
American Realty Capital Trust — IPO Roadshow (May 2012)
10 slides from American Realty Capital Trust's IPO roadshow presentation, May 14, 2012

Slide 1: American Realty Capital Trust - JMP Securities Research Conference
May 2012 NASDAQ: “ARCT” NASDAQ: ARCT JMP Securities Research Conference American Realty Capital Trust Monday, May 14, 2012
Slide 2: Introductory Notes
May 2012 2 The data and other information described in these slides speaks as of the date of the slides or an earlier date indicated . Future performance may not be consistent with past performance, and is subject to change and inherent risks and uncertainties . This presentation contains certain st
Slide 3: ARCT Value Proposition
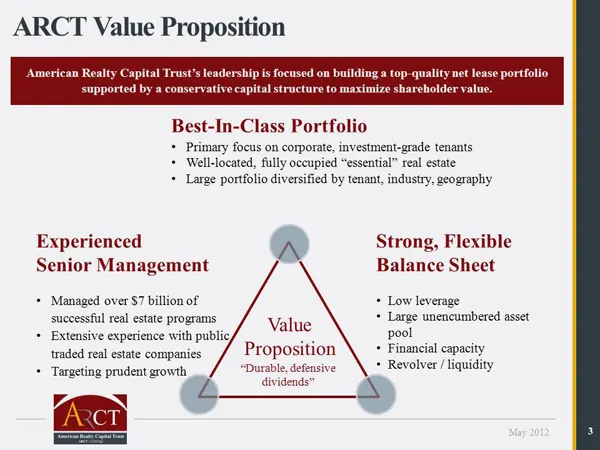
May 2012 3 • Managed over $7 billion of successful real estate programs • Extensive experience with public traded real estate companies • Targeting prudent growth • Low leverage • Large unencumbered asset pool • Financial capacity • Revolver / liquidity Best - In - Class Portfolio • Primary focus on
Slide 4: Portfolio Highlights Overview
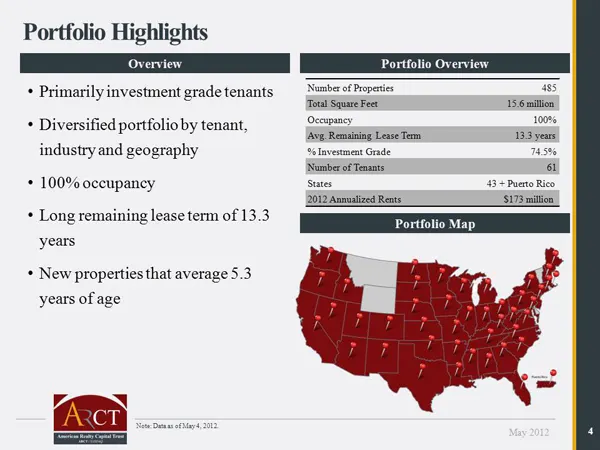
May 2012 4 Portfolio Highlights Overview Portfolio Map Portfolio Overview • Primarily investment grade tenants • Diversified portfolio by tenant, industry and geography • 100% occupancy • Long remaining lease term of 13.3 years • New properties that average 5.3 years of age Note: Data as of May 4, 2
Slide 5: Investment Grade Rated Tenant Focus
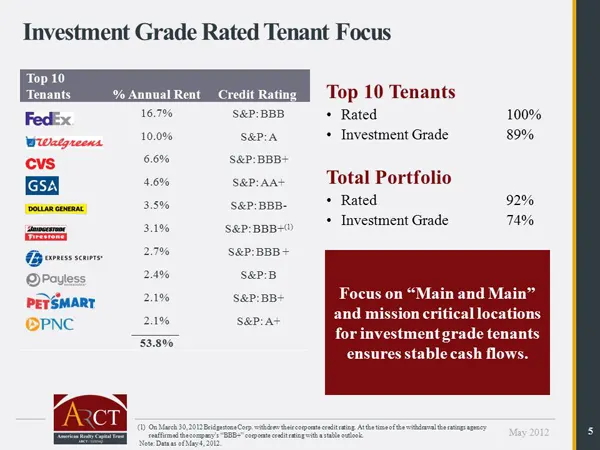
May 2012 5 Investment Grade Rated Tenant Focus Top 10 Tenants % Annual Rent Credit Rating 16.7% S&P: BBB 10.0% S&P: A 6.6% S&P: BBB+ 4.6% S&P: AA+ 3.5% S&P: BBB - 3.1% S&P: BBB+ (1) 2.7% S&P: BBB + 2.4% S&P: B 2.1% S&P: BB+ 2.1% S&P: A+ 53.8% Top 10 Tenants • Rated 100% • Investment Grade 89% Total
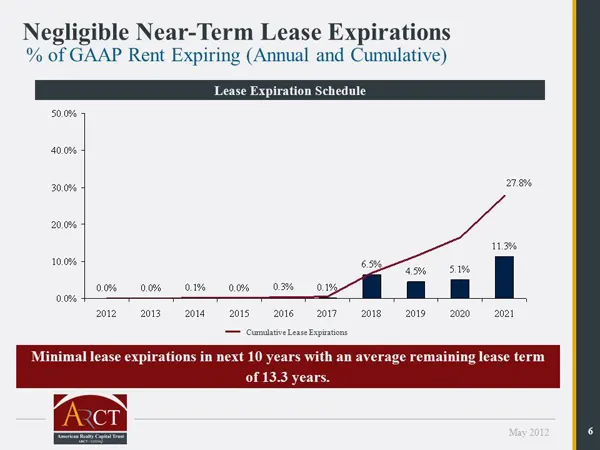
Slide 6: Negligible Near-Term Lease Expirations
May 2012 6 Minimal lease expirations in next 10 years with an average remaining lease term of 13.3 years. % of GAAP Rent Expiring (Annual and Cumulative) Negligible Near - Term Lease Expirations Lease Expiration Schedule 0.0% 0.0% 0.1% 0.0% 0.3% 0.1% 6.5% 4.5% 5.1% 11.3% 27.8% 0.0% 10.0% 20.0% 30.0%
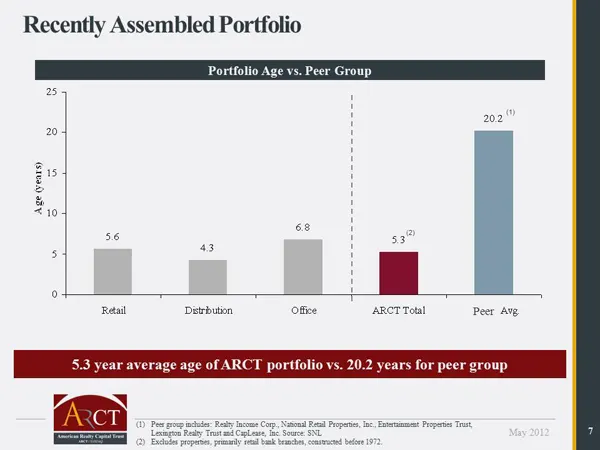
Slide 7: Recently Assembled Portfolio: Portfolio Age vs. Peer Group
May 2012 7 5.6 4.3 6.8 5.3 20.2 0 5 10 15 20 25 Retail Distribution Office ARCT Total Comps Avg. Age (years) Recently Assembled Portfolio 5.3 year average age of ARCT portfolio vs. 20.2 years for peer group (1) (2) Portfolio Age vs. Peer Group Peer (1) Peer group includes: Realty Income Corp., Natio
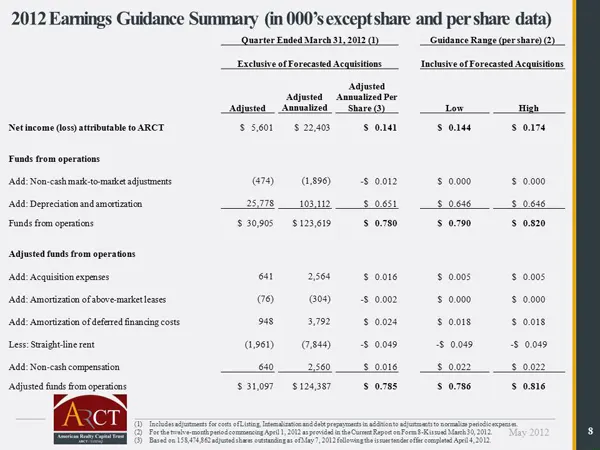
Slide 8: 2012 Earnings Guidance Summary
May 2012 8 2012 Earnings Guidance Summary (in 000’s except share and per share data) (1) Includes adjustments for costs of Listing, Internalization and debt prepayments in addition to adjustments to normalize perio dic expenses. (2) For the twelve - month period commencing April 1, 2012 as provided
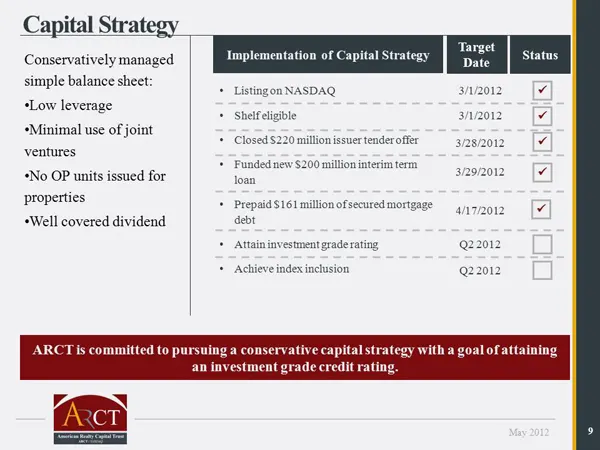
Slide 9: Capital Strategy
May 2012 9 Capital Strategy Conservatively managed simple balance sheet: • Low leverage • Minimal use of joint ventures • No OP units issued for properties • Well covered dividend Implementation of Capital Strategy Status • Listing on NASDAQ • Shelf eligible • Closed $220 million issuer tender offer
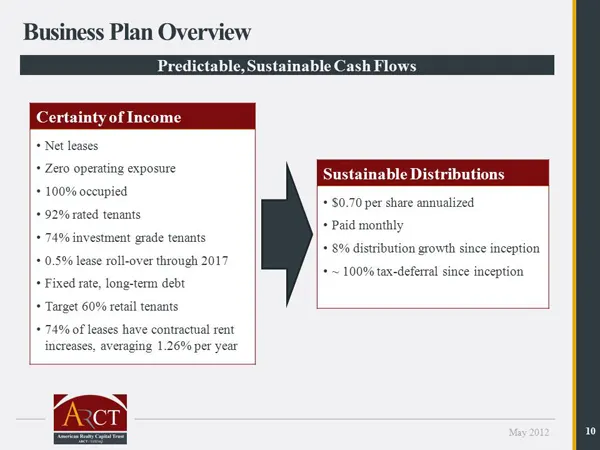
Slide 10: Business Plan Overview
May 2012 10 Business Plan Overview Certainty of Income • Net leases • Zero operating exposure • 100% occupied • 92% rated tenants • 74% investment grade tenants • 0.5% lease roll - over through 2017 • Fixed rate, long - term debt • Target 60% retail tenants • 74% of leases have contractual rent incr
Source: SEC EDGAR · FWP filed May 14, 2012
More decks from American Realty Capital Trust Inc
 Merger or Acquisition (December 2012)35 slides · Dec 21, 2012
 Merger or Acquisition (September 2012)19 slides · Sep 6, 2012
 IPO Roadshow (August 2012)20 slides · Aug 6, 2012
 IPO Roadshow (June 2012)27 slides · Jun 11, 2012
 Investor Presentation (May 2012)22 slides · May 7, 2012
 Investor Presentation (March 2012)29 slides · Mar 30, 2012