Pioneer Energy Services — Non-Deal Roadshow (April 2013)
30 slides from Pioneer Energy Services's roadshow presentation, Apr 2, 2013

Slide 1: GHS Non-Deal NY Roadshow April 2nd, 2013
GHS Non-Deal NY Roadshow April 2nd, 2013
Slide 2: Forward-looking Statements
Forward-looking Statements This presentation contains various forward-looking statements and information that are based on management’s current expectations and assumptions about future events. Forward-looking statements are generally accompanied by words such as “estimate,” “project,” “predict,” “e
Slide 3: Overview
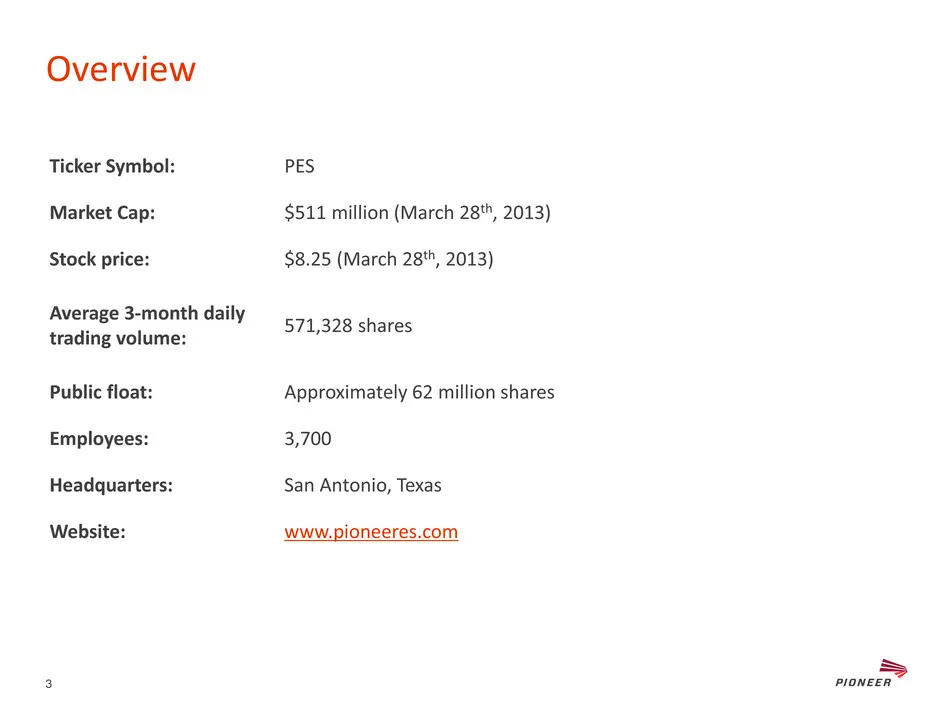
Overview Ticker Symbol: PES Market Cap: $511 million (March 28th, 2013) Stock price: $8.25 (March 28th, 2013) Average 3-month daily trading volume: 571,328 shares Public float: Approximately 62 million shares Employees: 3,700 Headquarters: San Antonio, Texas Website: www.pioneeres.com 3
Slide 4: Pioneer Energy Services rigs and units by location
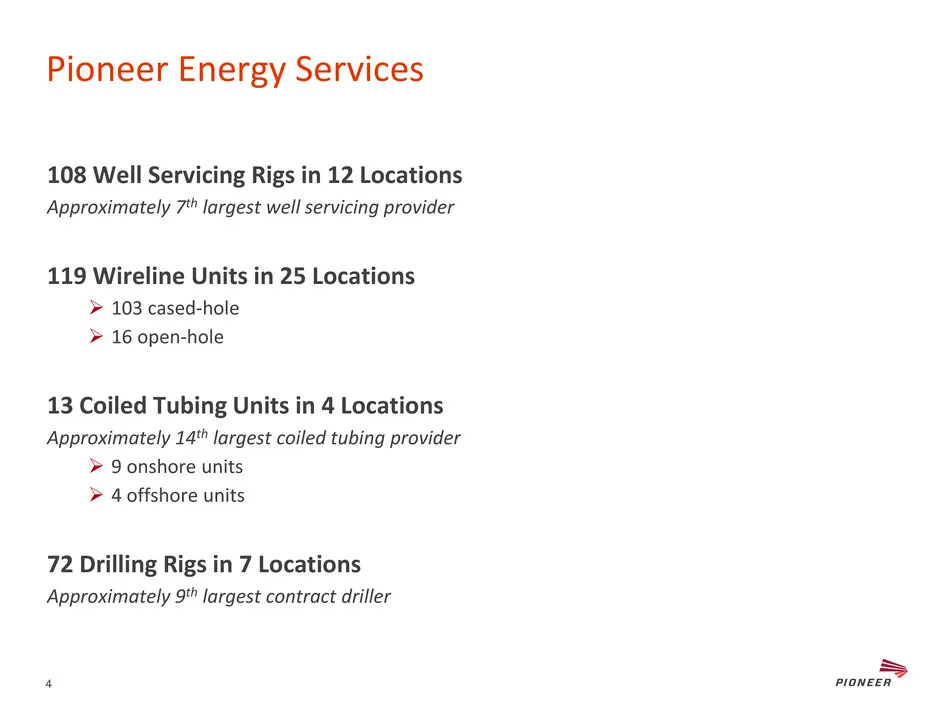
Pioneer Energy Services 108 Well Servicing Rigs in 12 Locations Approximately 7th largest well servicing provider 119 Wireline Units in 25 Locations 103 cased-hole 16 open-hole 13 Coiled Tubing Units in 4 Locations Approximately 14th largest coiled tubing provider 9 onshore units 4 offshore
Slide 5: Recent Updates
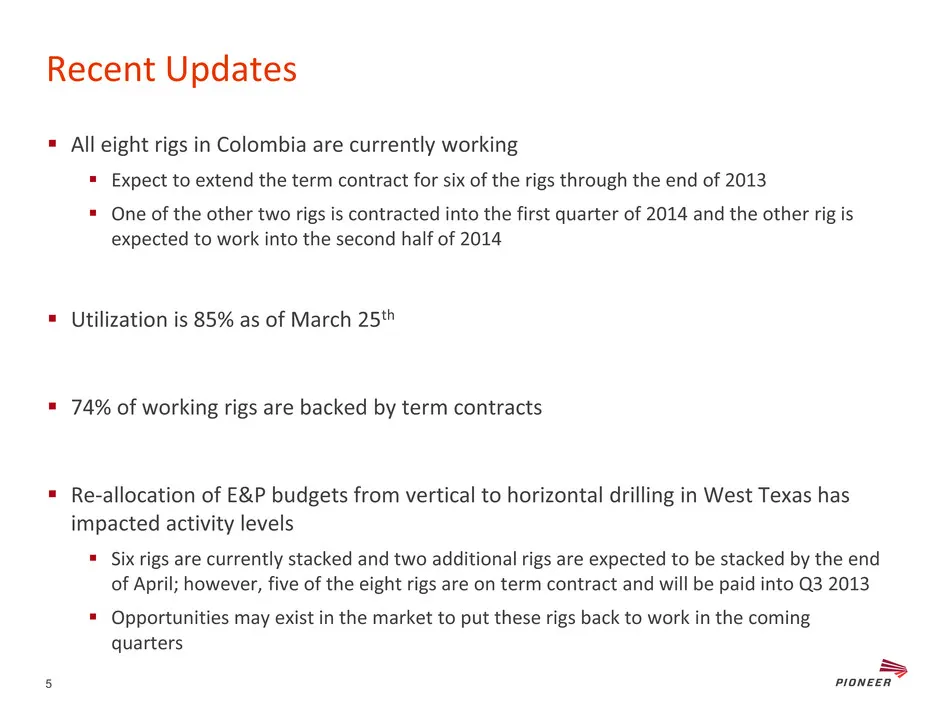
Recent Updates All eight rigs in Colombia are currently working Expect to extend the term contract for six of the rigs through the end of 2013 One of the other two rigs is contracted into the first quarter of 2014 and the other rig is expected to work into the second half of 2014 Utilization
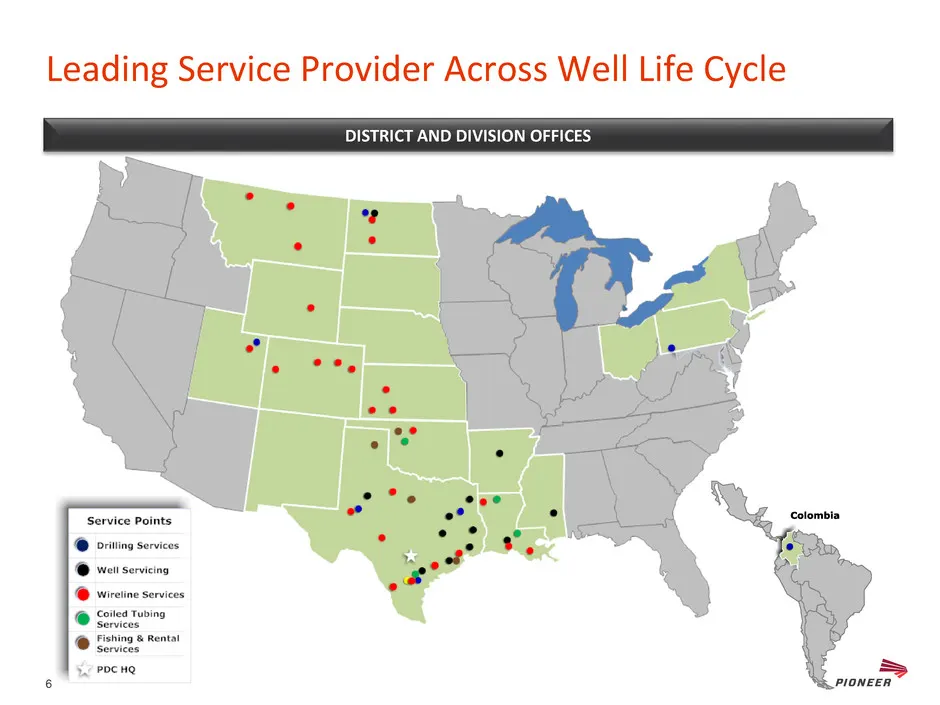
Slide 6: Leading Service Provider Across Well Life Cycle
Leading Service Provider Across Well Life Cycle DISTRICT AND DIVISION OFFICES 6
Slide 7: Stable, Balanced Earnings
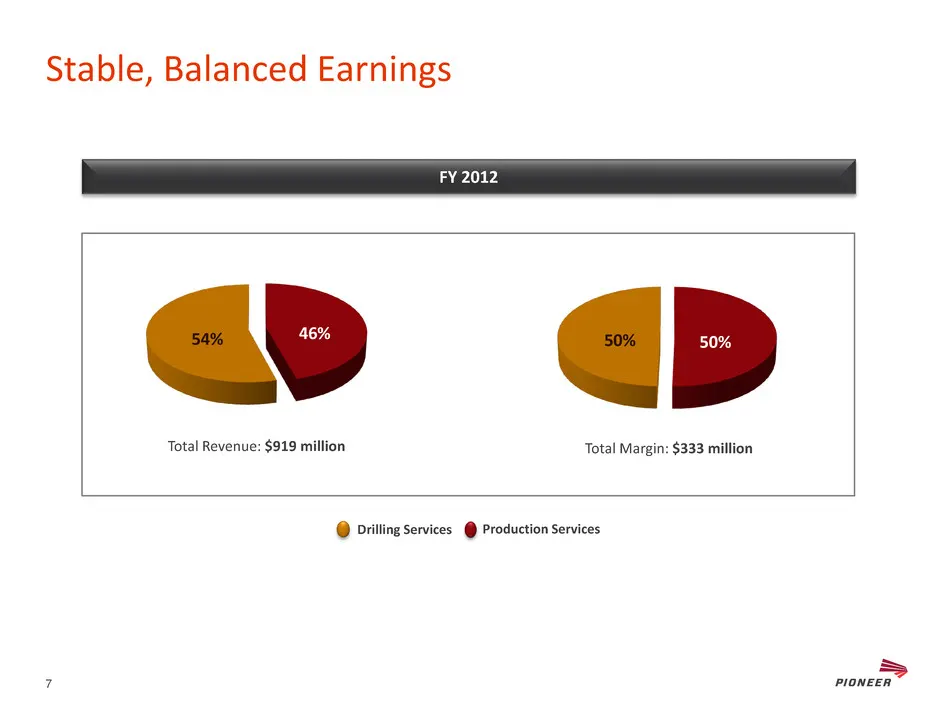
50% 50% 46% 54% Stable, Balanced Earnings FY 2012 Total Revenue: $919 million Total Margin: $333 million Drilling Services Production Services 7
Slide 8: Steady Organic Asset Growth
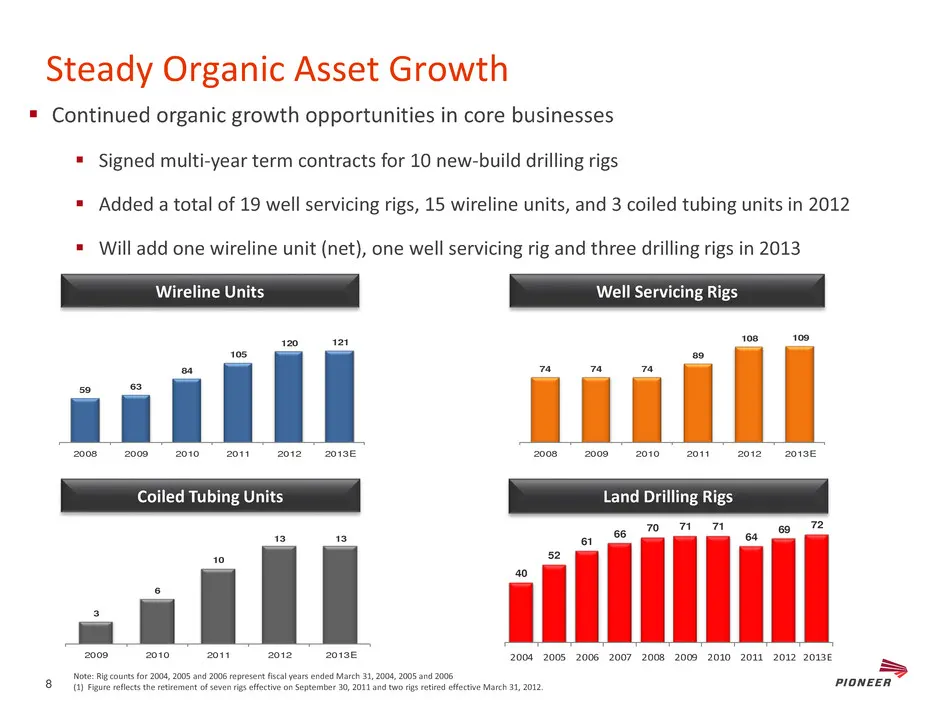
Steady Organic Asset Growth 40 52 61 66 70 71 71 64 69 72 2004 2005 2006 2007 2008 2009 2010 2011 2012 2013E 3 6 10 13 13 2009 2010 11 2012 2013E Coiled Tubing Units Wireline Units Land Drilling Rigs Well Servicing Rigs Continued organic growth opportunities in core businesses Signed multi-year
Slide 9: Top-tier Safety
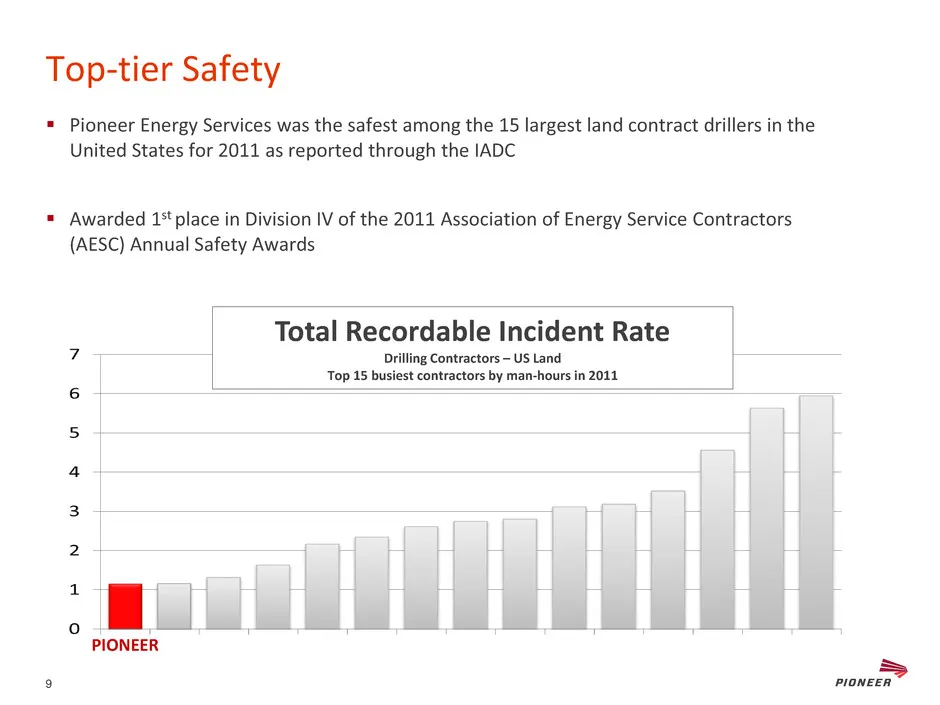
Top-tier Safety PIONEER Total Recordable Incident Rate Drilling Contractors – US Land Top 15 busiest contractors by man-hours in 2011 Pioneer Energy Services was the safest among the 15 largest land contract drillers in the United States for 2011 as reported through the IADC Awarded 1st place in
Slide 10: Top-tier Safety
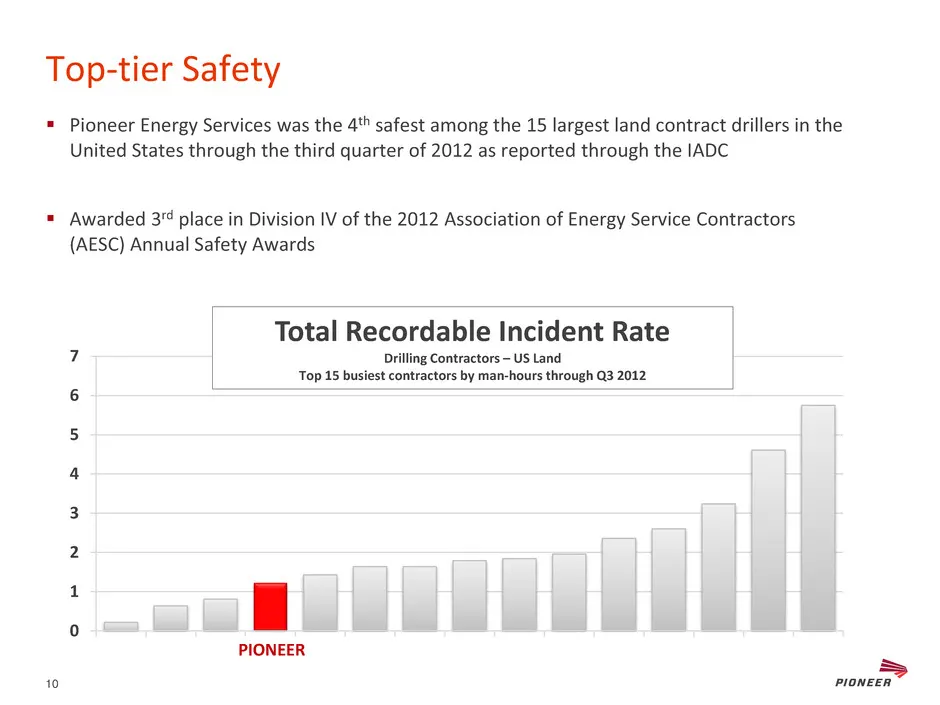
0 1 2 3 4 5 6 7 Top-tier Safety PIONEER Total Recordable Incident Rate Drilling Contractors – US Land Top 15 busiest contractors by man-hours through Q3 2012 Pioneer Energy Services was the 4th safest among the 15 largest land contract drillers in the United States through the third quarter of 201
Slide 11: Well Servicing
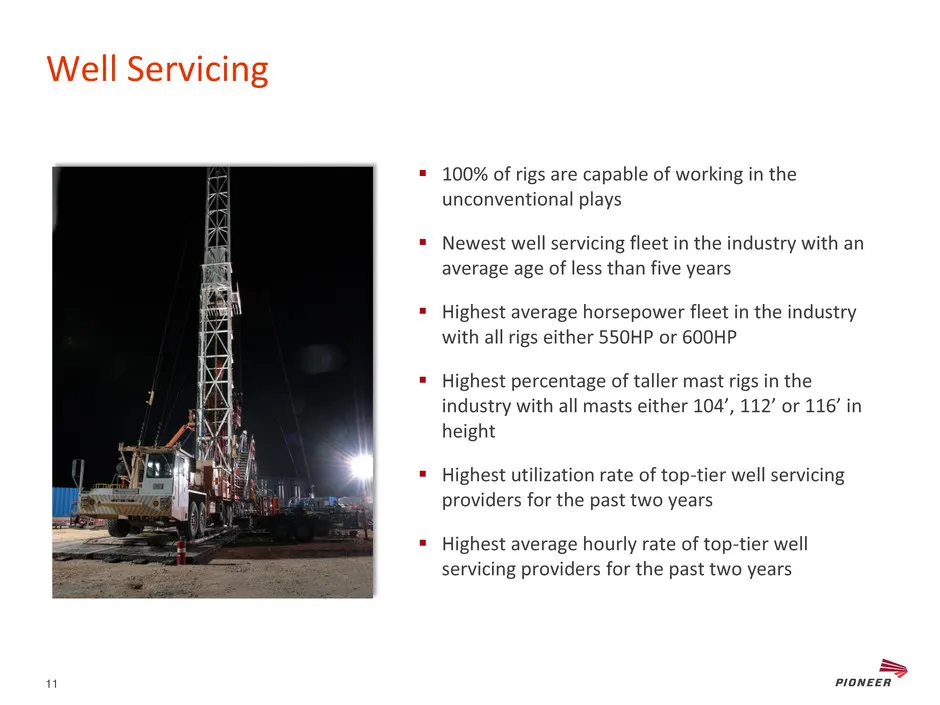
Well Servicing 100% of rigs are capable of working in the unconventional plays Newest well servicing fleet in the industry with an average age of less than five years Highest average horsepower fleet in the industry with all rigs either 550HP or 600HP Highest percentage of taller mast rigs i
Slide 12: Well Servicing
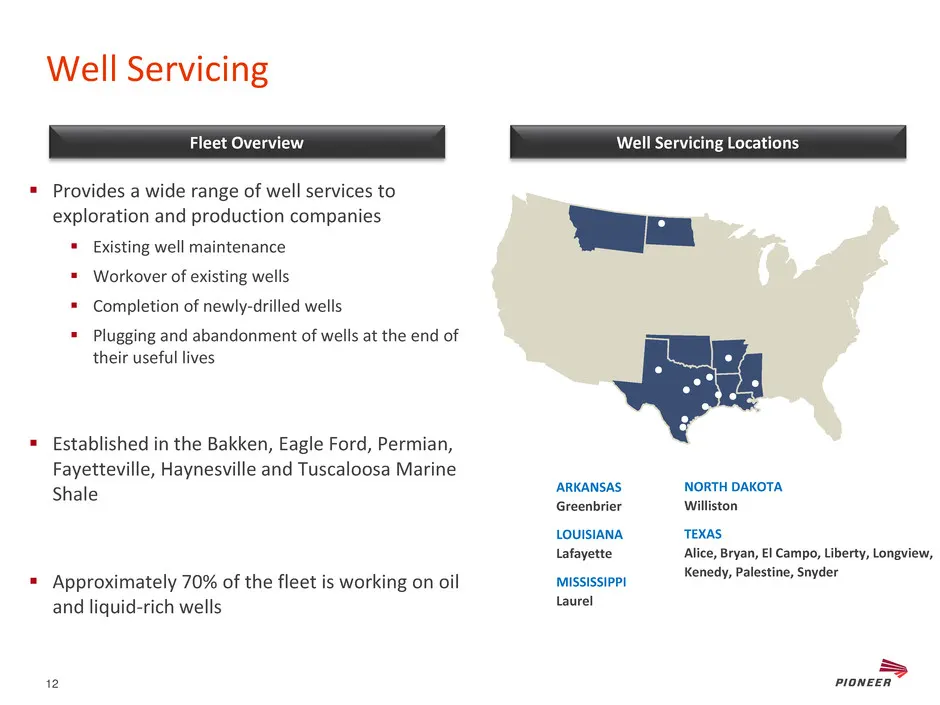
Well Servicing Provides a wide range of well services to exploration and production companies Existing well maintenance Workover of existing wells Completion of newly-drilled wells Plugging and abandonment of wells at the end of their useful lives Established in the Bakken, Eagle Ford, P
Slide 13: Wireline
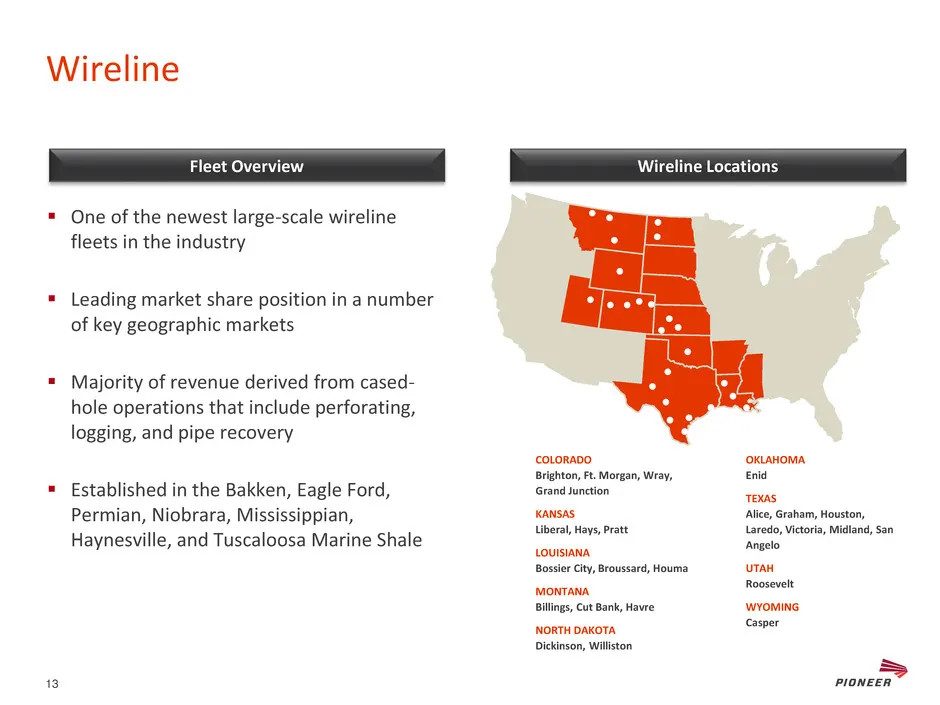
Wireline One of the newest large-scale wireline fleets in the industry Leading market share position in a number of key geographic markets Majority of revenue derived from cased- hole operations that include perforating, logging, and pipe recovery Established in the Bakken, Eagle Ford, Permi
Slide 14: Coiled Tubing
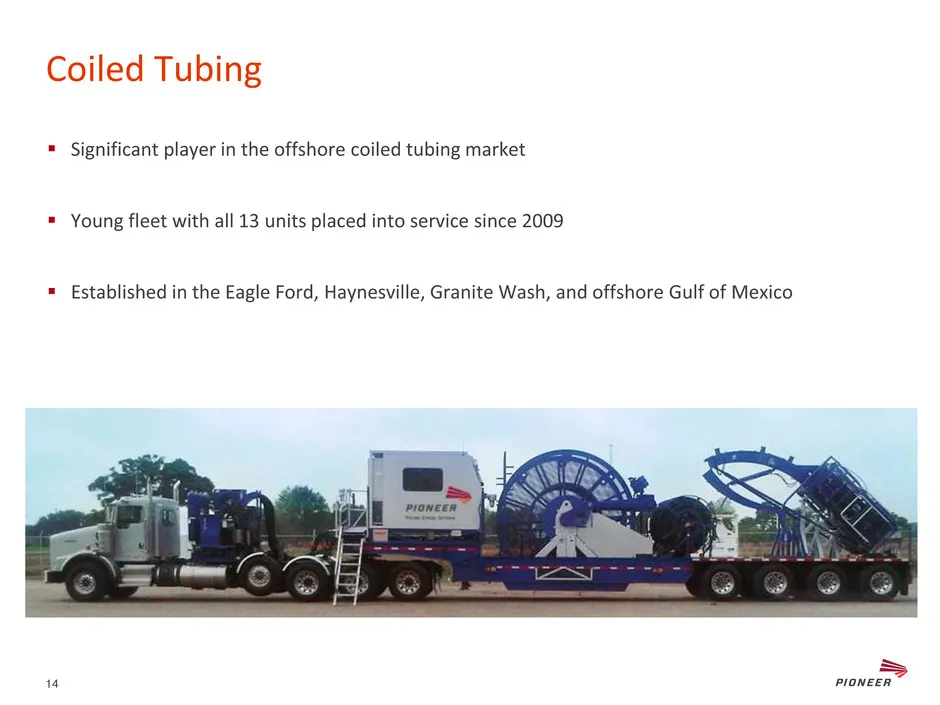
Coiled Tubing Significant player in the offshore coiled tubing market Young fleet with all 13 units placed into service since 2009 Established in the Eagle Ford, Haynesville, Granite Wash, and offshore Gulf of Mexico 14
Slide 15: Coiled Tubing
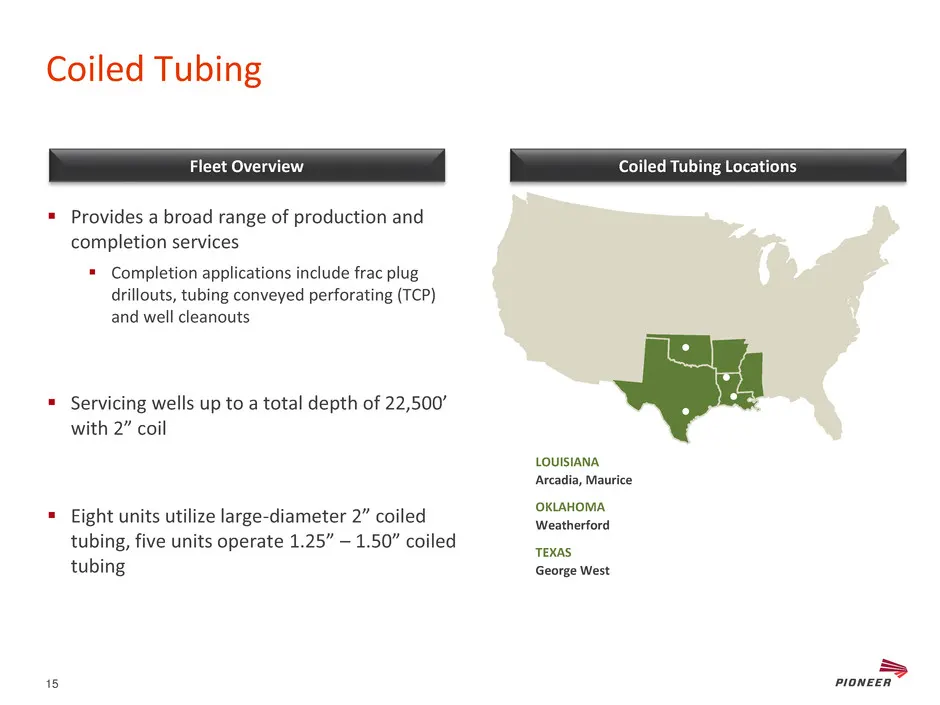
Coiled Tubing Provides a broad range of production and completion services Completion applications include frac plug drillouts, tubing conveyed perforating (TCP) and well cleanouts Servicing wells up to a total depth of 22,500’ with 2” coil Eight units utilize large-diameter 2” coiled tubing
Slide 16: Drilling Services
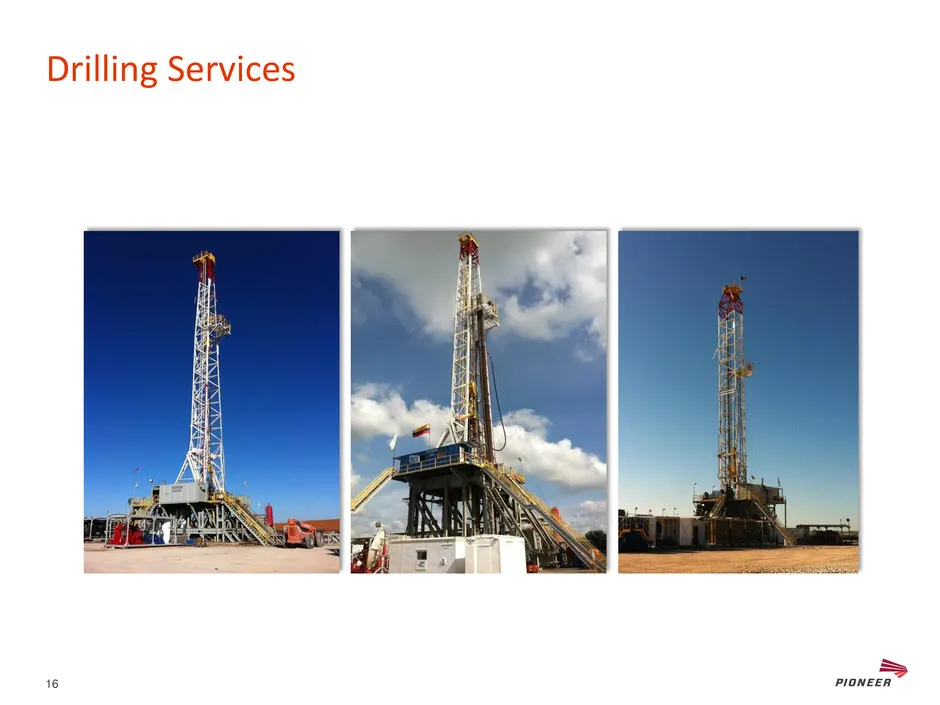
Drilling Services 16
Slide 17: High Quality Drilling Fleet, Focused On Unconventional Plays
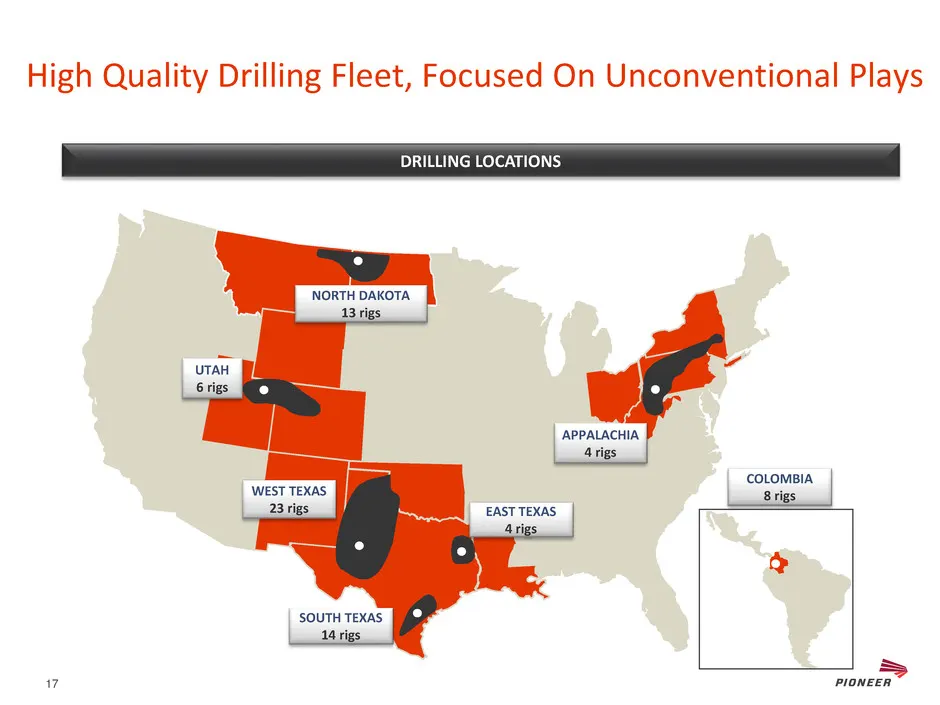
High Quality Drilling Fleet, Focused On Unconventional Plays SOUTH TEXAS 14 rigs EAST TEXAS 4 rigs NORTH DAKOTA 13 rigs UTAH 6 rigs COLOMBIA 8 rigs APPALACHIA 4 rigs DRILLING LOCATIONS WEST TEXAS 23 rigs 17
Slide 18: Pioneer Rig Class Comparison
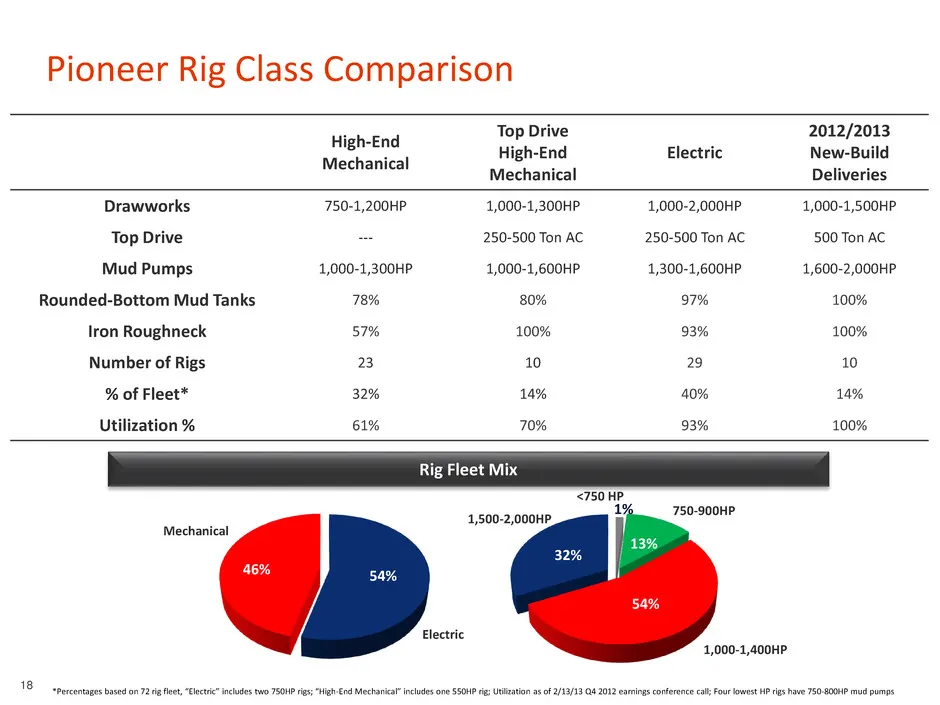
54% 46% 1% 13% 54% 32% Pioneer Rig Class Comparison High-End Mechanical Top Drive High-End Mechanical Electric 2012/2013 New-Build Deliveries Drawworks 750-1,200HP 1,000-1,300HP 1,000-2,000HP 1,000-1,500HP Top Drive --- 250-500 Ton AC 250-500 Ton AC 500 Ton AC Mud Pumps 1,000-1,300HP 1,000-1,600HP 1
Slide 19: Strong Utilization Through the Cycles
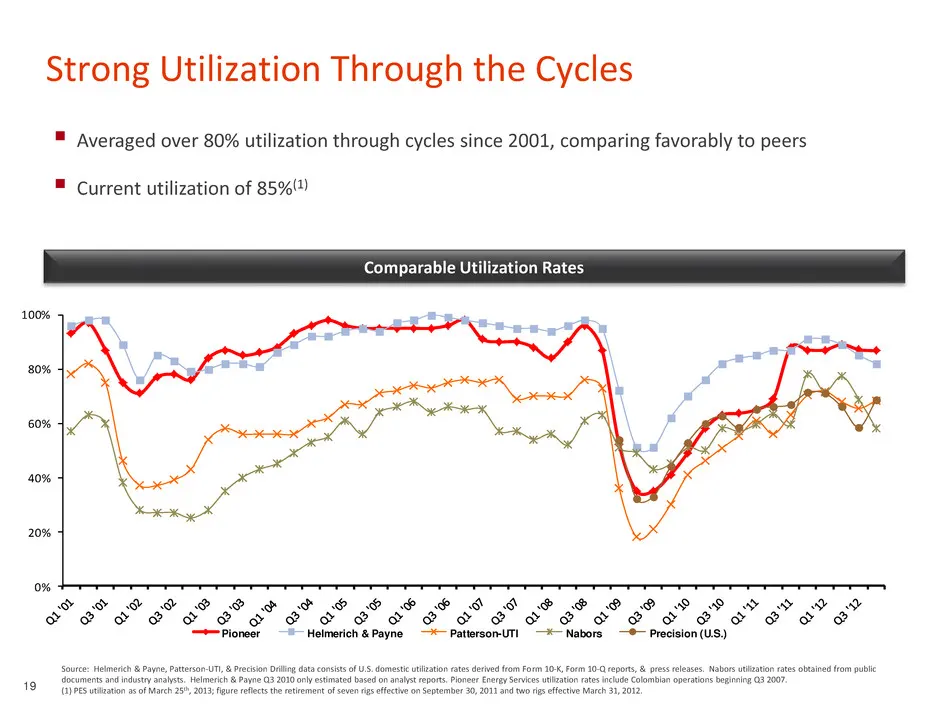
0% 20% 40% 60% 80% 100% Pioneer Helmerich & Payne Patterson-UTI Nabors Precision (U.S.) Strong Utilization Through the Cycles Source: Helmerich & Payne, Patterson-UTI, & Precision Drilling data consists of U.S. domestic utilization rates derived from Form 10-K, Form 10-Q reports, & press releases. N
Slide 20: Modern, Efficient Drilling Fleet
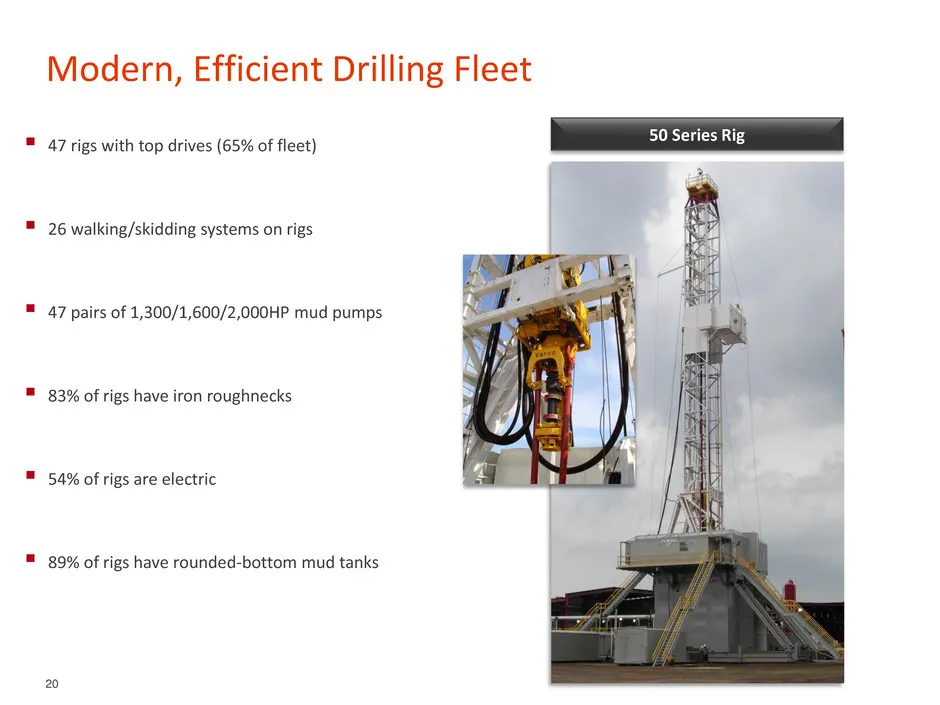
Modern, Efficient Drilling Fleet 47 rigs with top drives (65% of fleet) 26 walking/skidding systems on rigs 47 pairs of 1,300/1,600/2,000HP mud pumps 83% of rigs have iron roughnecks 54% of rigs are electric 89% of rigs have rounded-bottom mud tanks 50 Series Rig 20
Slide 21: New-Build Features
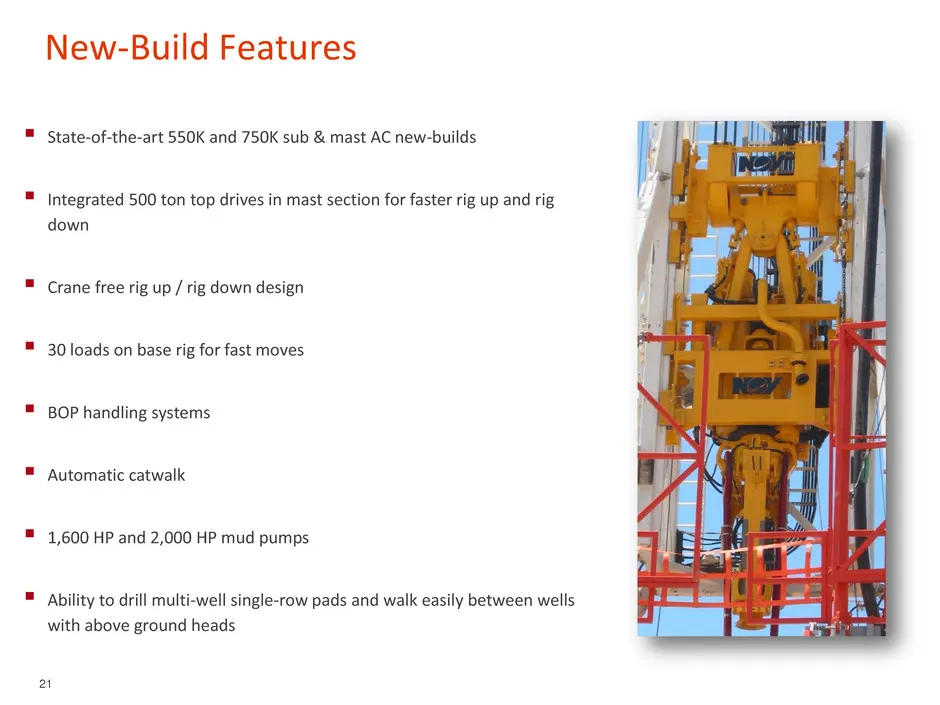
New-Build Features 21 State-of-the-art 550K and 750K sub & mast AC new-builds Integrated 500 ton top drives in mast section for faster rig up and rig down Crane free rig up / rig down design 30 loads on base rig for fast moves BOP handling systems Automatic catwalk 1,600 HP and 2,000 H
Slide 22: New-Build Pad Drilling Capability
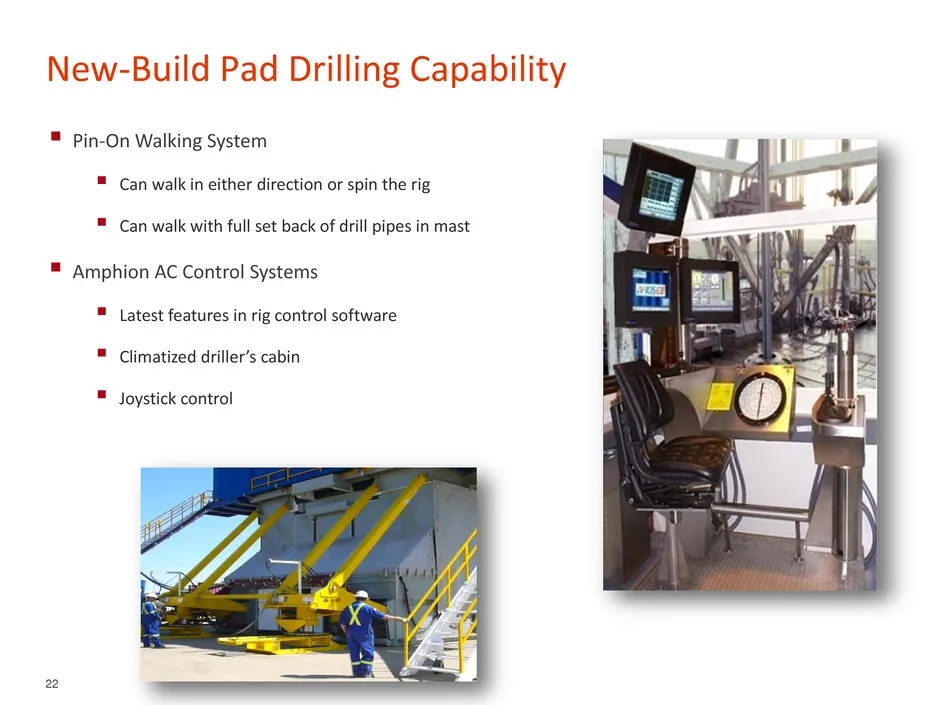
New-Build Pad Drilling Capability 22 Pin-On Walking System Can walk in either direction or spin the rig Can walk with full set back of drill pipes in mast Amphion AC Control Systems Latest features in rig control software Climatized driller’s cabin Joystick control
Slide 23: New-Build Advanced Electrical System
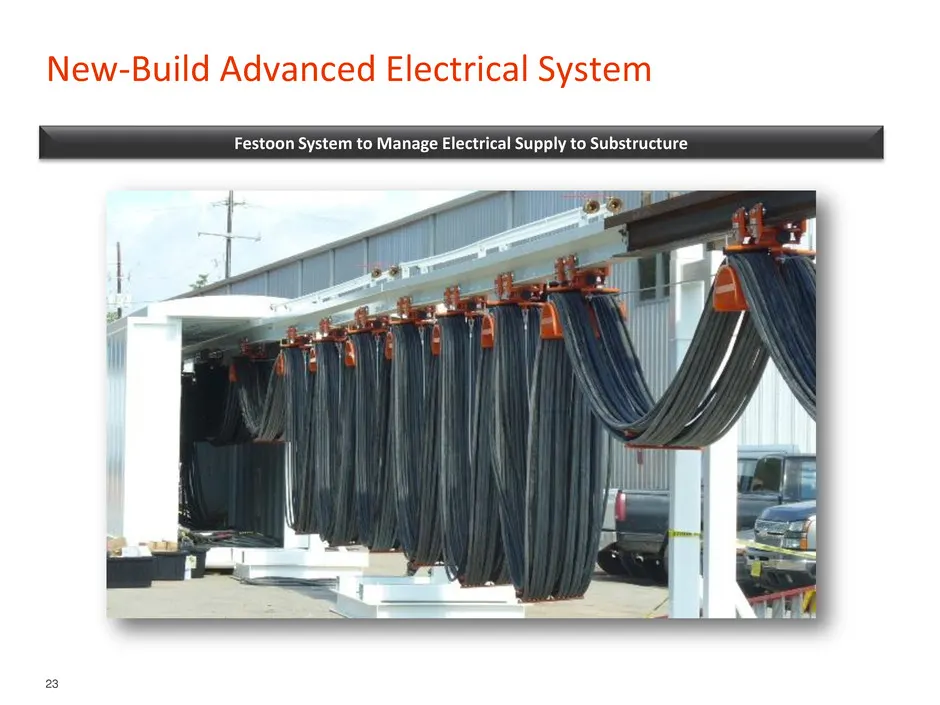
New-Build Advanced Electrical System 23 Festoon System to Manage Electrical Supply to Substructure
Slide 24: Financials
Financials 24
Slide 25: Strong Revenue and Adjusted EBITDA Growth
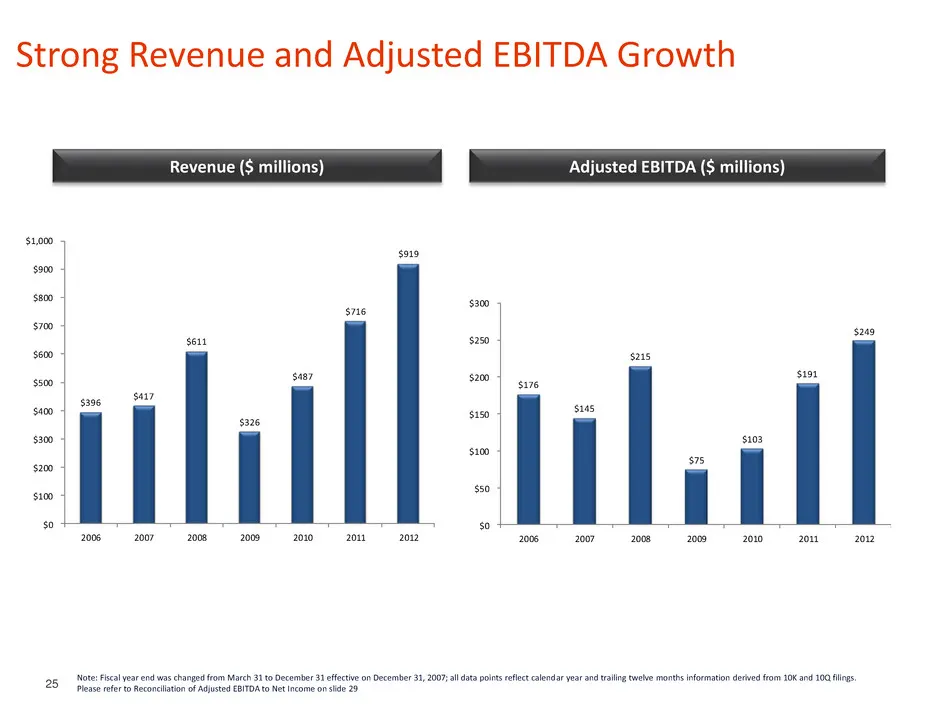
$176 $145 $215 $75 $103 $191 $249 $0 $50 $100 $150 $200 $250 $300 2006 2007 2008 2009 2010 2011 2012 Strong Revenue and Adjusted EBITDA Growth Revenue ($ millions) Adjusted EBITDA ($ millions) $396 $417 $611 $326 $487 $716 $919 $0 $100 $200 $300 $400 $500 $600 $700 $800 $900 $1,000 2006 2007 2008 20
Slide 26: Contribution by Segment
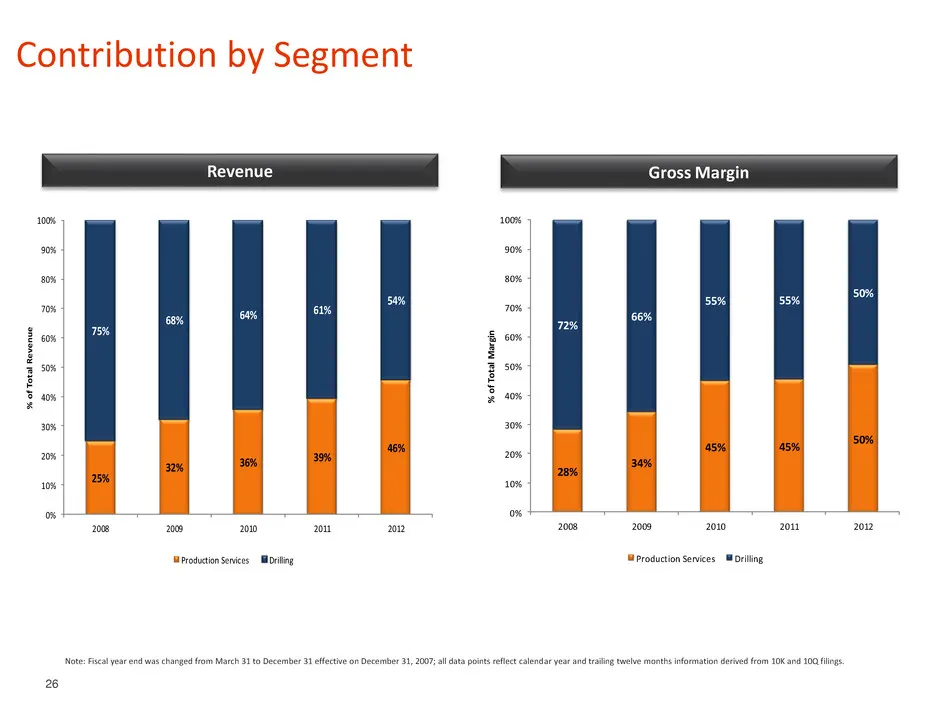
25% 32% 36% 39% 46% 75% 68% 64% 61% 54% 0% 10% 20% 30% 40% 50% 60% 70% 80% 90% 100% 2008 2009 2010 2011 2012 % o f T ot al R ev en ue Production Services Drilling Contribution by Segment Note: Fiscal year end was changed from March 31 to December 31 effective on December 31, 2007; all data points re
Slide 27: Liquidity and Capital Structure
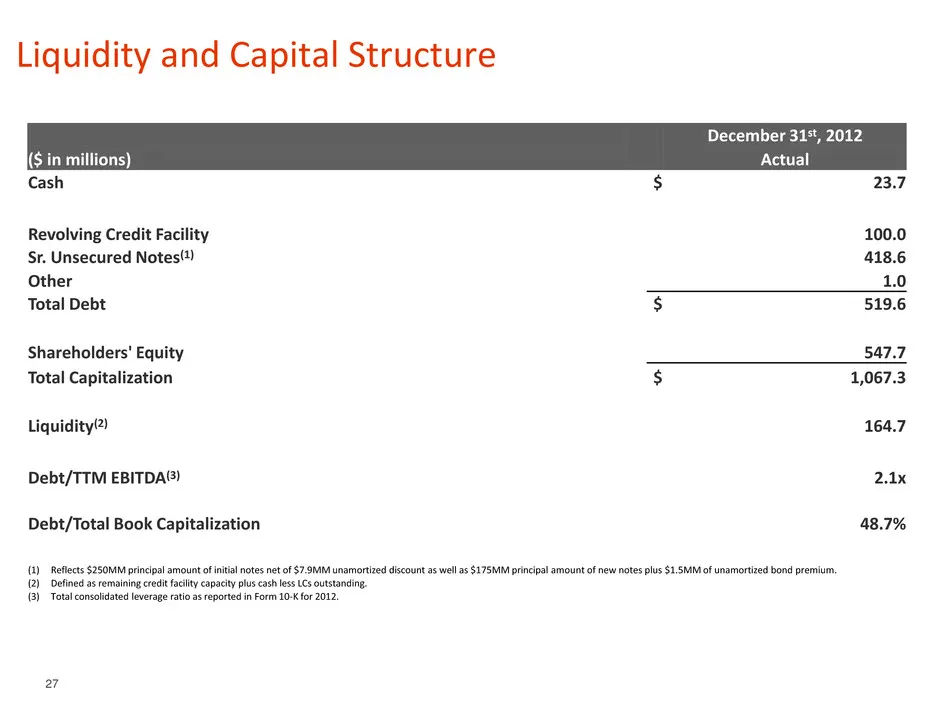
Liquidity and Capital Structure December 31st, 2012 ($ in millions) Actual Cash $ 23.7 Revolving Credit Facility 100.0 Sr. Unsecured Notes(1) 418.6 Other 1.0 Total Debt $ 519.6 Shareholders' Equity 547.7 Total Capitalization $ 1,067.3 Liquidity(2) 164.7 Debt/TTM EBITDA(3) 2.1x Debt/Total Book Capita
Slide 28: Appendix
Appendix 28
Slide 29: Reconciliation of Adjusted EBITDA to Net Income
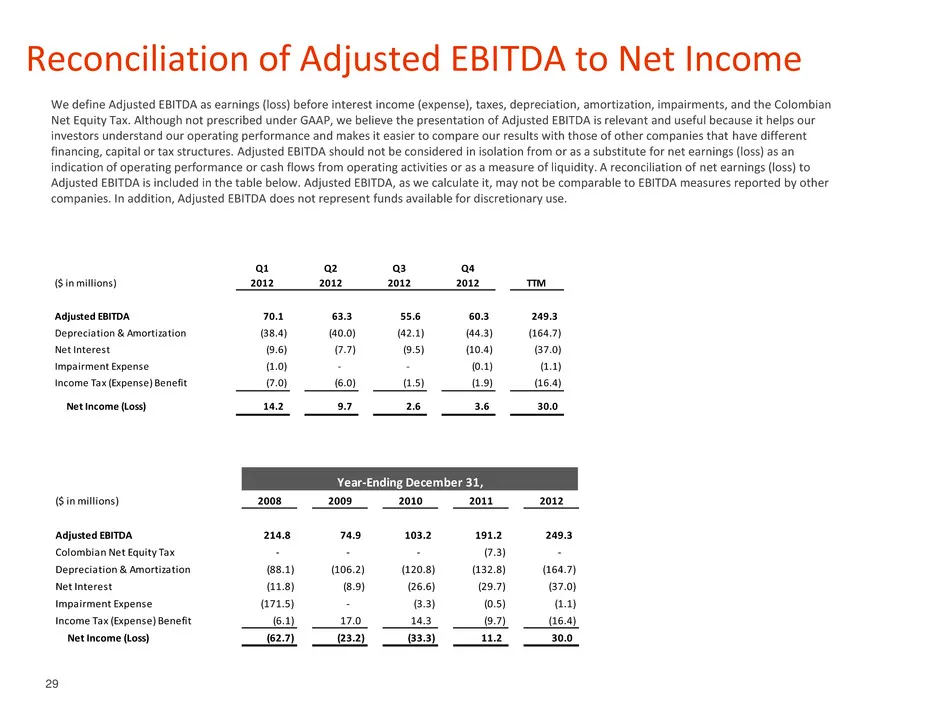
Reconciliation of Adjusted EBITDA to Net Income We define Adjusted EBITDA as earnings (loss) before interest income (expense), taxes, depreciation, amortization, impairments, and the Colombian Net Equity Tax. Although not prescribed under GAAP, we believe the presentation of Adjusted EBITDA is relev
Slide 30: PIONEER
—— ——_ PIONEER
Source: SEC EDGAR · 8-K filed Apr 2, 2013
More decks from Pioneer Energy Services Corp
 Merger or Acquisition (July 2021)17 slides · Jul 8, 2021
 2019 Simmons Energy Conference22 slides · Feb 27, 2019
 Goldman Sachs Global Energy Conference 201922 slides · Jan 9, 2019
 Jefferies Energy Conference 201822 slides · Nov 27, 2018
 Johnson Rice 2018 Energy Conference22 slides · Sep 26, 2018
 SGS Energy & Industrials Conference 201822 slides · Aug 28, 2018