Pioneer Energy Services — SGS Energy & Industrials Conference 2018
22 slides from Pioneer Energy Services's conference presentation, Aug 28, 2018
Slide 1: SGS Energy & Industrials Conference August 28th, 2018
ibdroot\Projects\IBD-NY\thaw2016\595552_1\06. Road Show\PES Company Presentation GS EQUITY v02.pptx SGS Energy & Industrials Conference August 28th, 2018
Slide 2: Forward-looking Statements
ibdroot\Projects\IBD-NY\thaw2016\595552_1\06. Road Show\PES Company Presentation GS EQUITY v02.pptx Forward-looking Statements This presentation contains various forward-looking statements and information that are based on management’s current expectations and assumptions about future events. Forwar
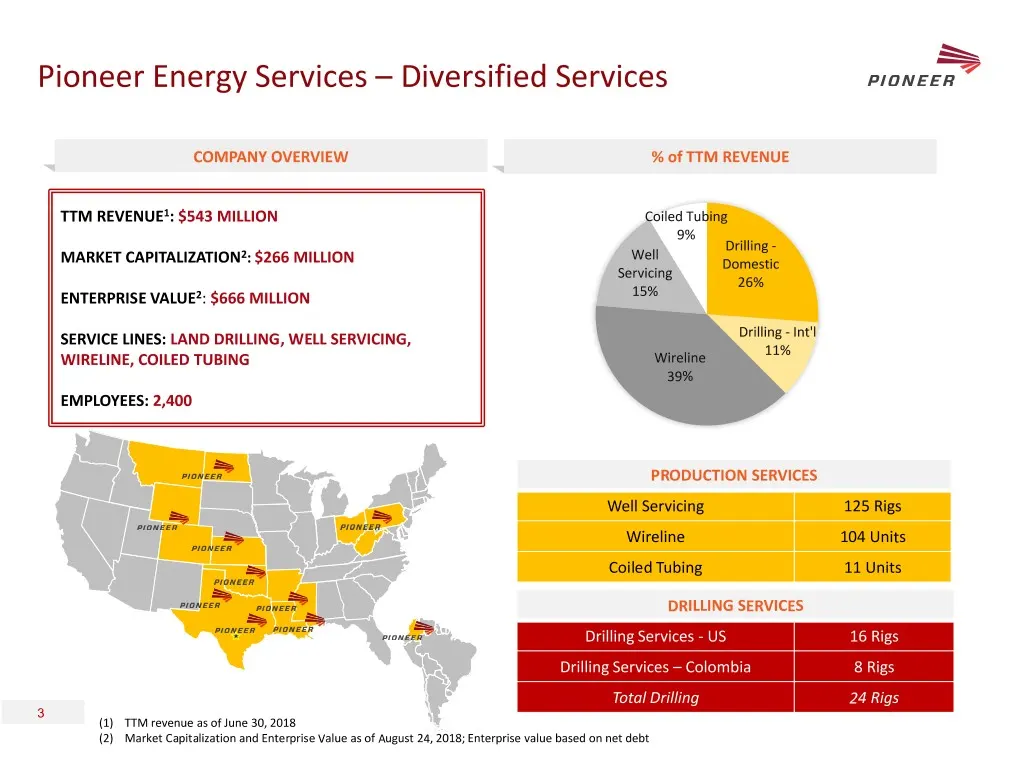
Slide 3: Pioneer Energy Services – Diversified Services
ibdroot\Projects\IBD-NY\thaw2016\595552_1\06. Road Show\PES Company Presentation GS EQUITY v02.pptx Pioneer Energy Services – Diversified Services COMPANY OVERVIEW % of TTM REVENUE TTM REVENUE1: $543 MILLION Coiled Tubing 9% Drilling - 2 Well MARKET CAPITALIZATION : $266 MILLION Domestic Servicing 2
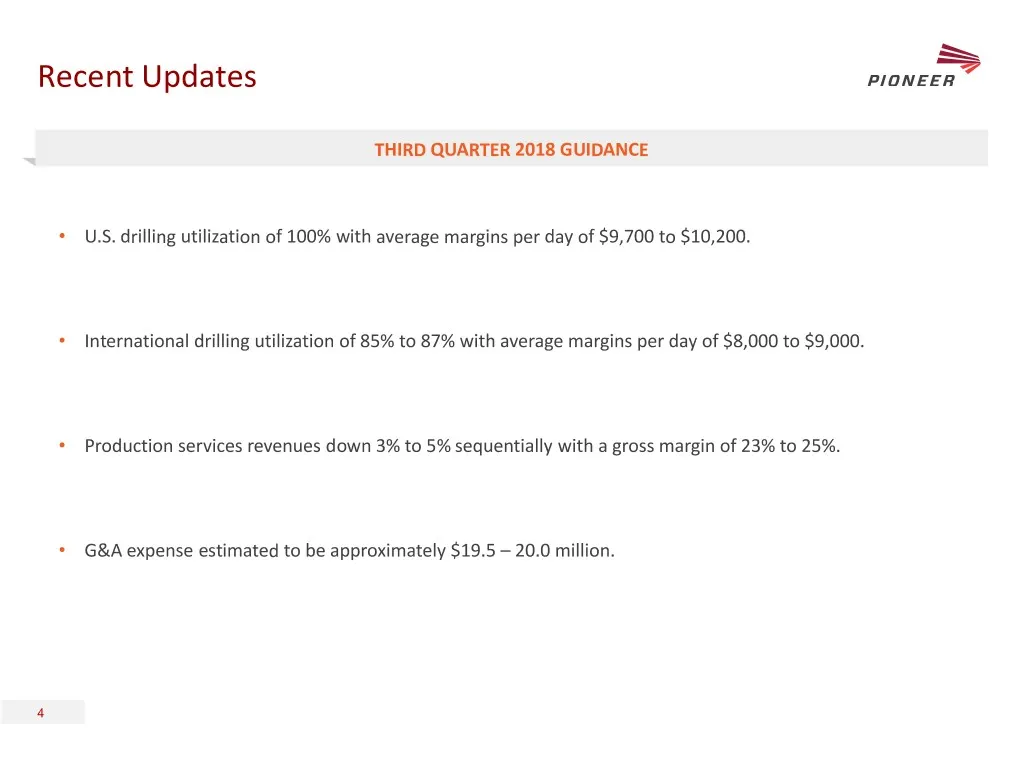
Slide 4: Recent Updates: Third Quarter 2018 Guidance
ibdroot\Projects\IBD-NY\thaw2016\595552_1\06. Road Show\PES Company Presentation GS EQUITY v02.pptx Recent Updates THIRD QUARTER 2018 GUIDANCE • U.S. drilling utilization of 100% with average margins per day of $9,700 to $10,200. • International drilling utilization of 85% to 87% with average margin
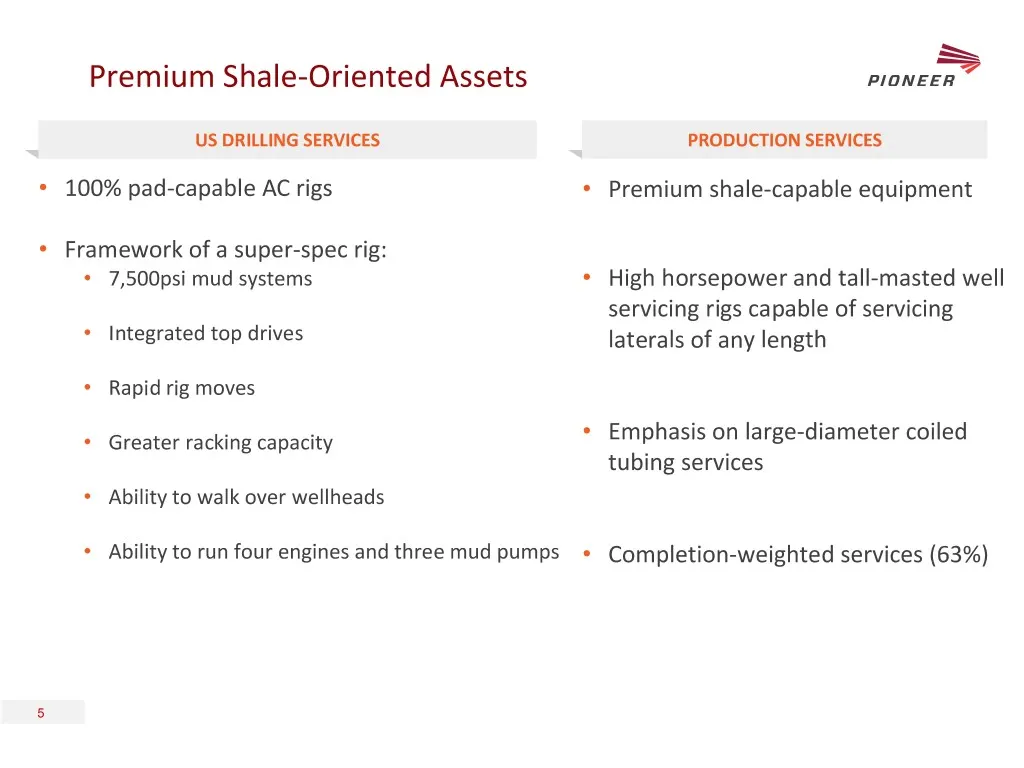
Slide 5: Premium Shale-Oriented Assets
ibdroot\Projects\IBD-NY\thaw2016\595552_1\06. Road Show\PES Company Presentation GS EQUITY v02.pptx Premium Shale-Oriented Assets US DRILLING SERVICES PRODUCTION SERVICES • 100% pad-capable AC rigs • Premium shale-capable equipment • Framework of a super-spec rig: • 7,500psi mud systems • High horse
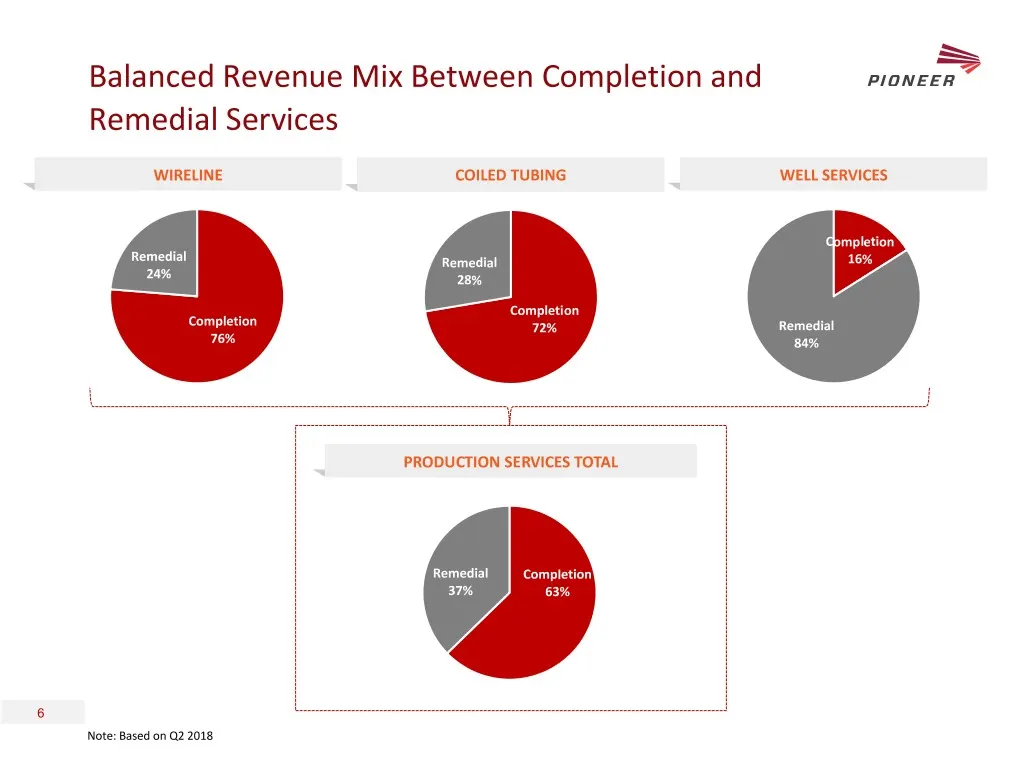
Slide 6: Balanced Revenue Mix Between Completion and Remedial Services
ibdroot\Projects\IBD-NY\thaw2016\595552_1\06. Road Show\PES Company Presentation GS EQUITY v02.pptx Balanced Revenue Mix Between Completion and Remedial Services WIRELINE COILED TUBING WELL SERVICES Completion Remedial Remedial 16% 24% 28% Completion Completion 72% Remedial 76% 84% PRODUCTION SERVIC
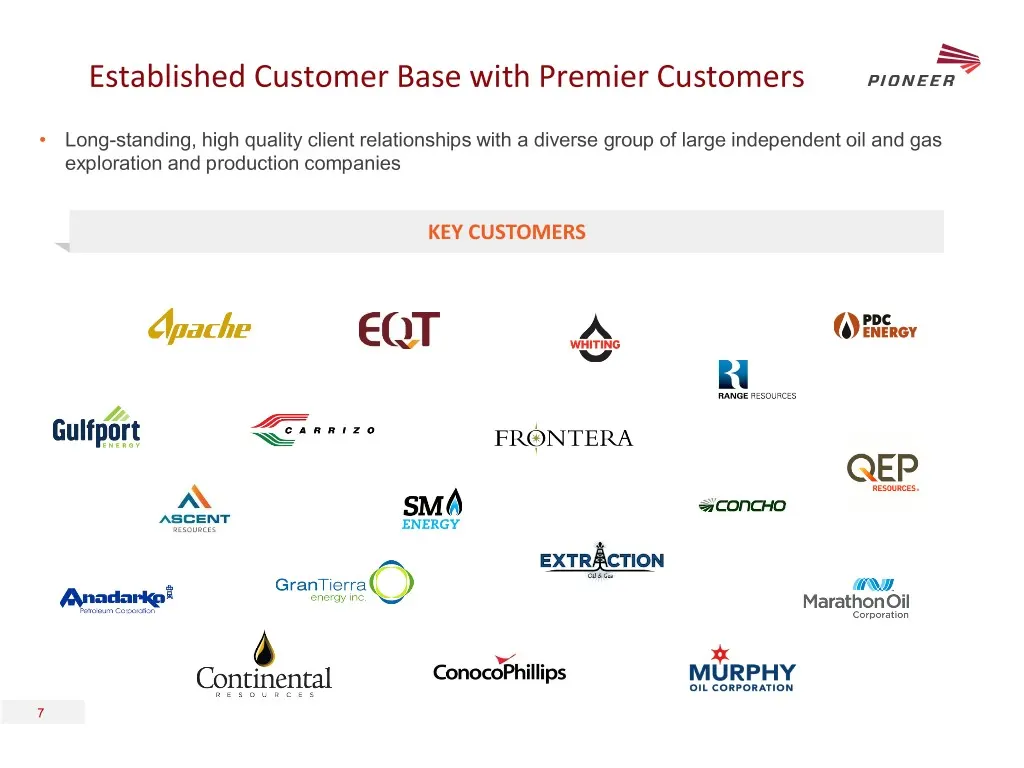
Slide 7: Established Customer Base with Premier Customers
ibdroot\Projects\IBD-NY\thaw2016\595552_1\06. Road Show\PES Company Presentation GS EQUITY v02.pptx Established Customer Base with Premier Customers • Long-standing, high quality client relationships with a diverse group of large independent oil and gas exploration and production companies KEY CUSTO
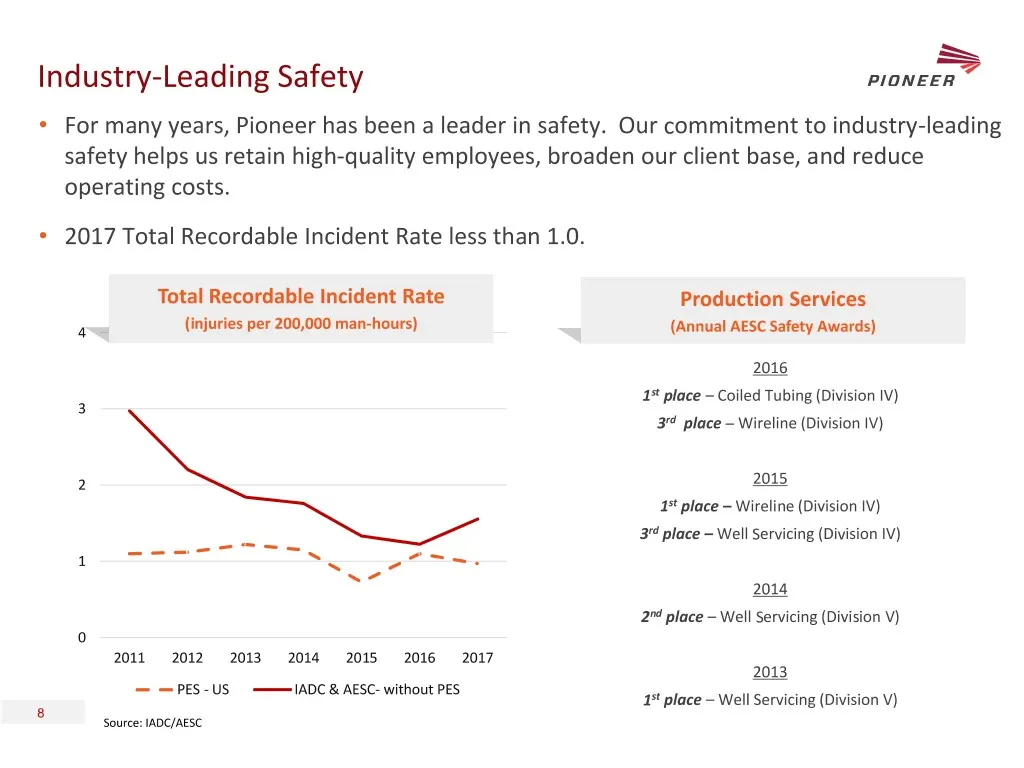
Slide 8: Industry-Leading Safety
ibdroot\Projects\IBD-NY\thaw2016\595552_1\06. Road Show\PES Company Presentation GS EQUITY v02.pptx Industry-Leading Safety • For many years, Pioneer has been a leader in safety. Our commitment to industry-leading safety helps us retain high-quality employees, broaden our client base, and reduce ope
Slide 9: Production Services
ibdroot\Projects\IBD-NY\thaw2016\595552_1\06. Road Show\PES Company Presentation GS EQUITY v02.pptx PRODUCTION SERVICES 9
Slide 10: Well Servicing
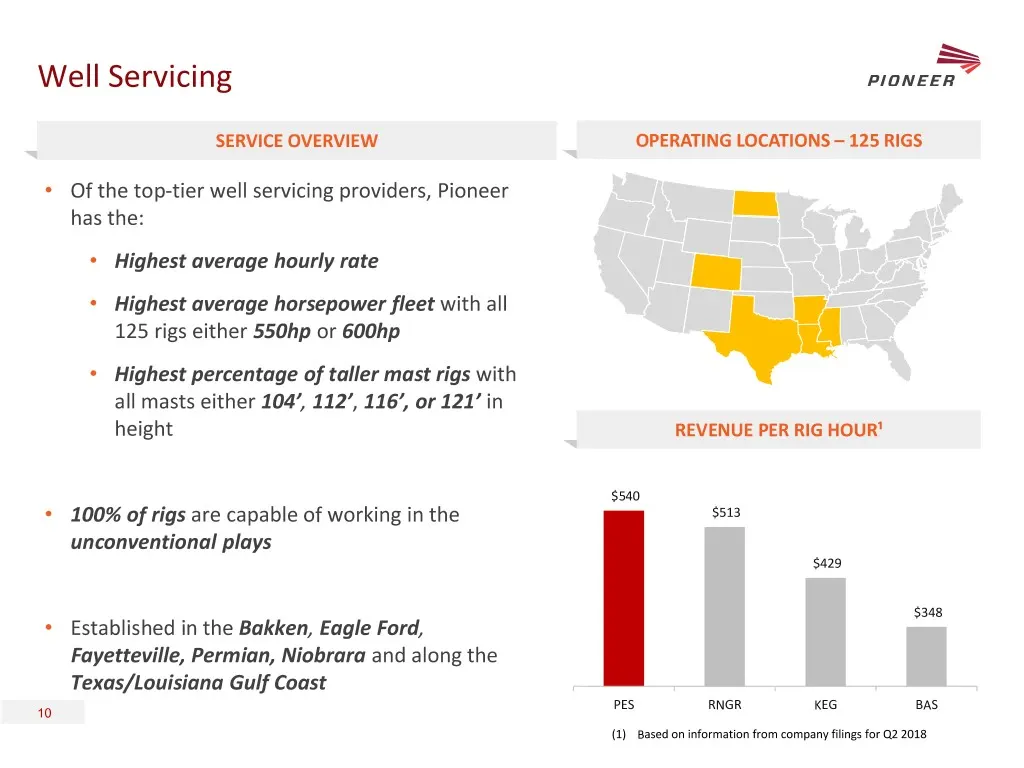
ibdroot\Projects\IBD-NY\thaw2016\595552_1\06. Road Show\PES Company Presentation GS EQUITY v02.pptx Well Servicing SERVICE OVERVIEW OPERATING LOCATIONS – 125 RIGS • Of the top-tier well servicing providers, Pioneer has the: • Highest average hourly rate • Highest average horsepower fleet with all 12
Slide 11: Wireline
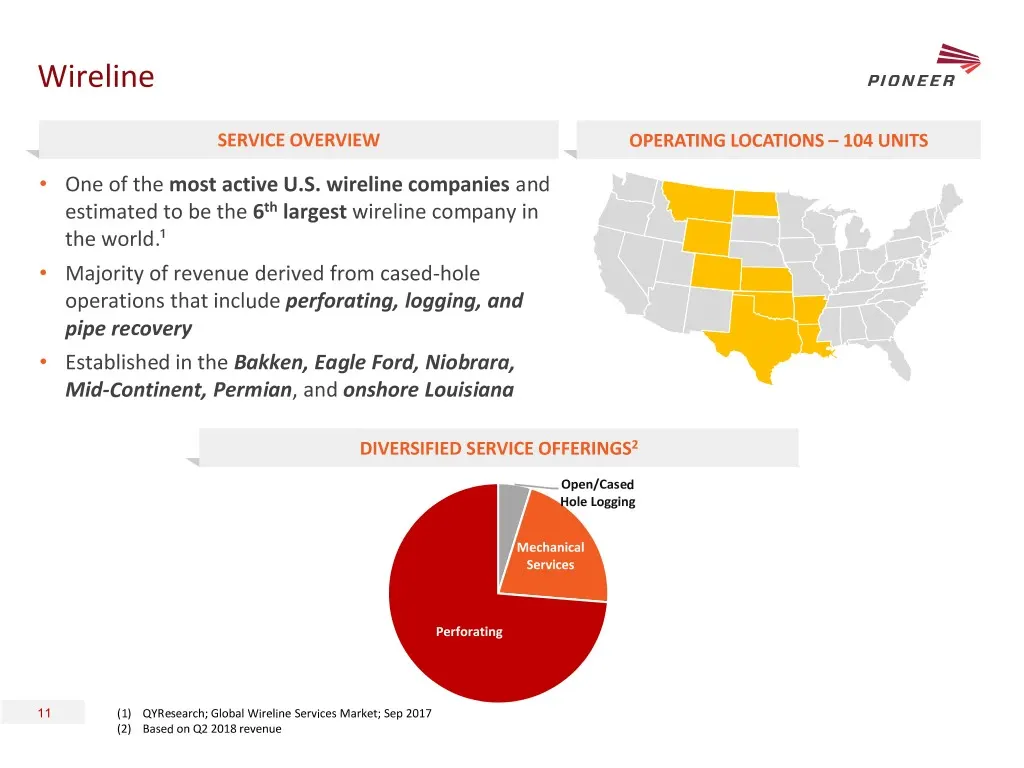
ibdroot\Projects\IBD-NY\thaw2016\595552_1\06. Road Show\PES Company Presentation GS EQUITY v02.pptx Wireline SERVICE OVERVIEW OPERATING LOCATIONS – 104 UNITS • One of the most active U.S. wireline companies and estimated to be the 6th largest wireline company in the world.¹ • Majority of revenue der
Slide 12: Coiled Tubing
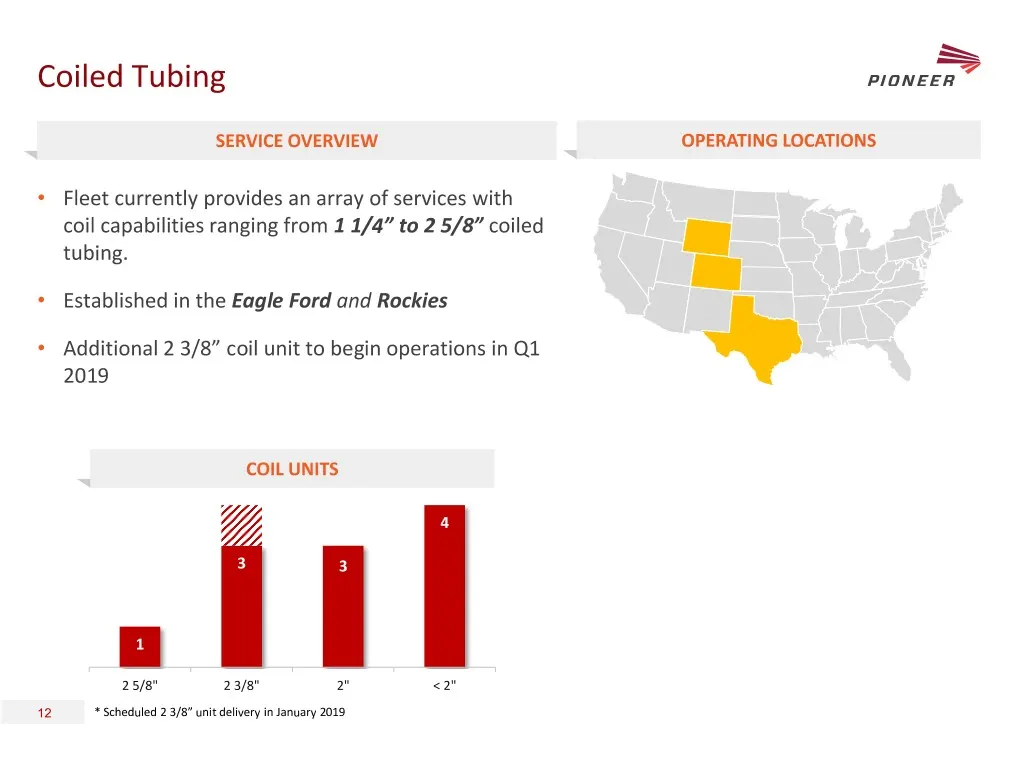
ibdroot\Projects\IBD-NY\thaw2016\595552_1\06. Road Show\PES Company Presentation GS EQUITY v02.pptx Coiled Tubing SERVICE OVERVIEW OPERATING LOCATIONS • Fleet currently provides an array of services with coil capabilities ranging from 1 1/4” to 2 5/8” coiled tubing. • Established in the Eagle Ford a
Slide 13: Drilling Services
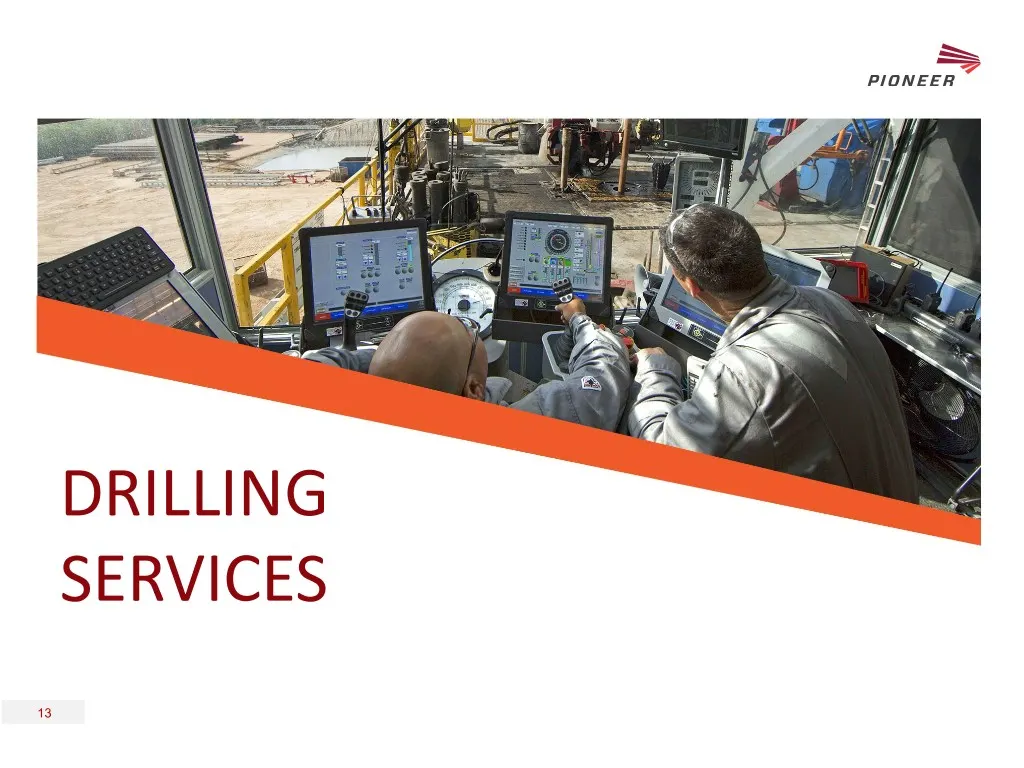
ibdroot\Projects\IBD-NY\thaw2016\595552_1\06. Road Show\PES Company Presentation GS EQUITY v02.pptx DRILLING SERVICES 13
Slide 14: Drilling Services
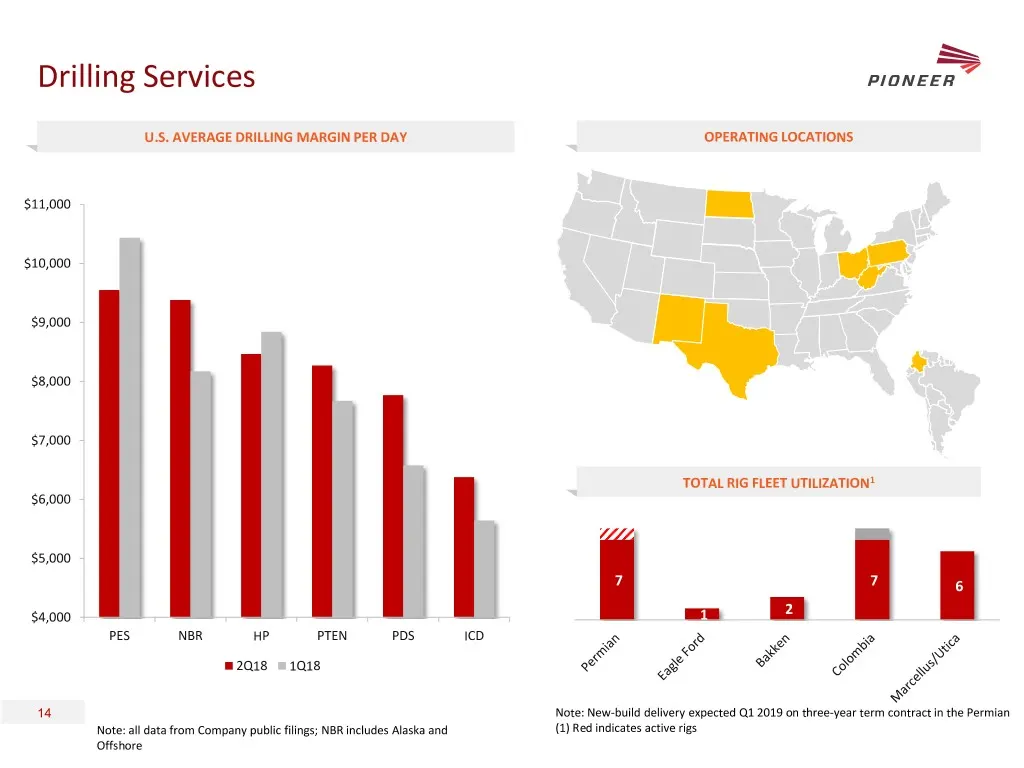
ibdroot\Projects\IBD-NY\thaw2016\595552_1\06. Road Show\PES Company Presentation GS EQUITY v02.pptx Drilling Services U.S. AVERAGE DRILLING MARGIN PER DAY OPERATING LOCATIONS $11,000 $10,000 $9,000 $8,000 $7,000 TOTAL RIG FLEET UTILIZATION1 $6,000 $5,000 7 7 6 2 $4,000 1 PES NBR HP PTEN PDS ICD 2Q18
Slide 15: Drilling Services
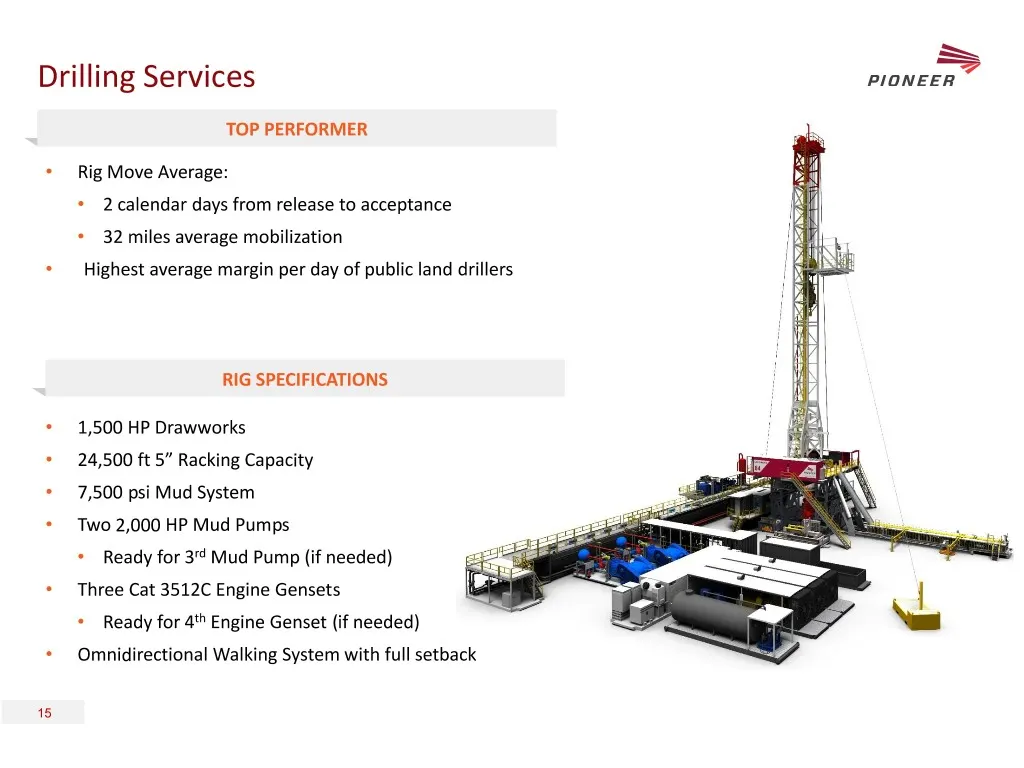
ibdroot\Projects\IBD-NY\thaw2016\595552_1\06. Road Show\PES Company Presentation GS EQUITY v02.pptx Drilling Services TOP PERFORMER • Rig Move Average: • 2 calendar days from release to acceptance • 32 miles average mobilization • Highest average margin per day of public land drillers RIG SPECIFICAT
Slide 16: Drilling Services
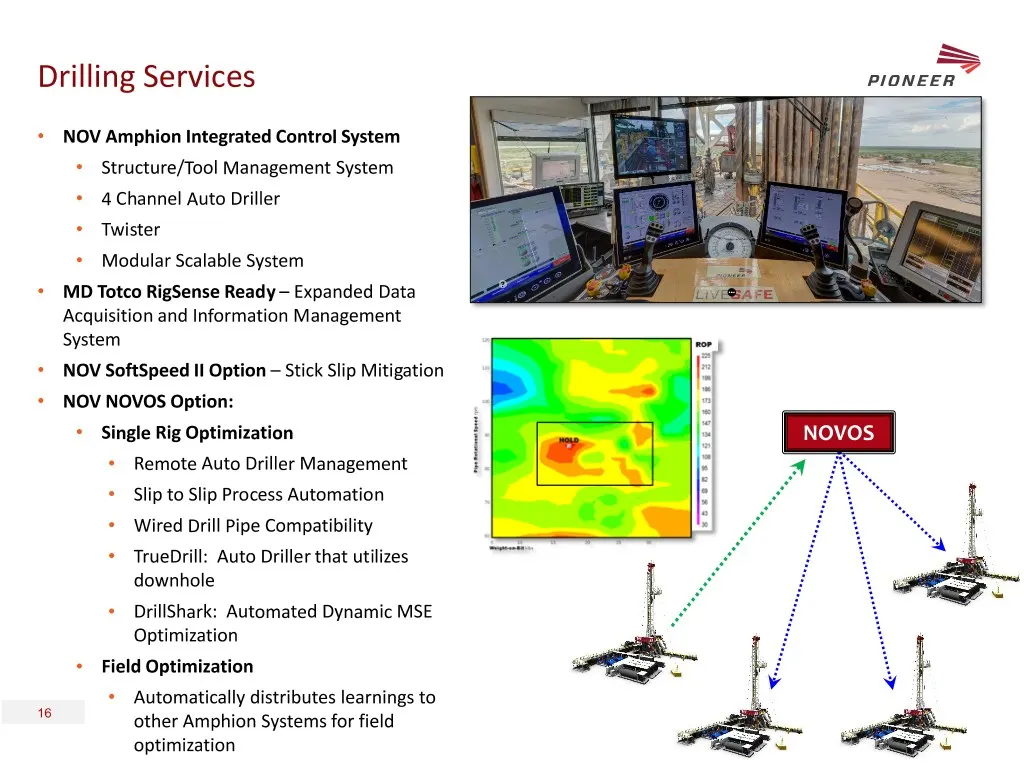
ibdroot\Projects\IBD-NY\thaw2016\595552_1\06. Road Show\PES Company Presentation GS EQUITY v02.pptx Drilling Services • NOV Amphion Integrated Control System • Structure/Tool Management System • 4 Channel Auto Driller • Twister • Modular Scalable System • MD Totco RigSense Ready – Expanded Data Acqu
Slide 17: ibdroot\Projects\IBD-NY\thaw2016\595552_1\06. Road Show\PES Company Presentation GS EQUITY v02.pptx 17
ibdroot\Projects\IBD-NY\thaw2016\595552_1\06. Road Show\PES Company Presentation GS EQUITY v02.pptx 17
Slide 18: Balance Sheet and Cash Flow Management
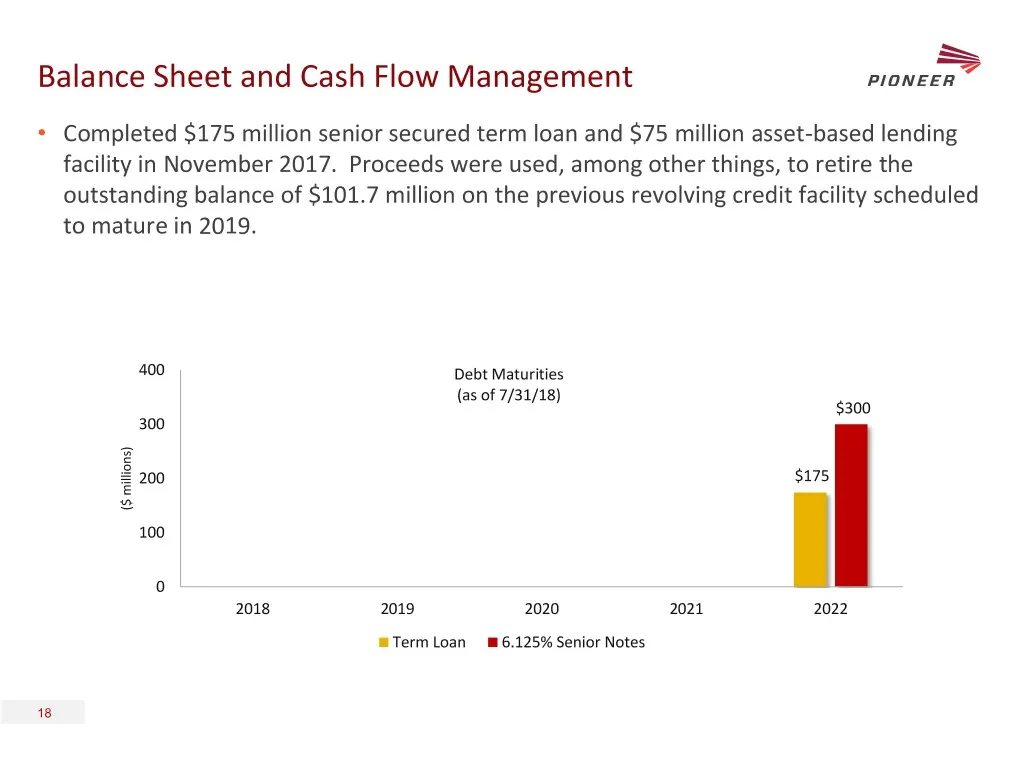
ibdroot\Projects\IBD-NY\thaw2016\595552_1\06. Road Show\PES Company Presentation GS EQUITY v02.pptx Balance Sheet and Cash Flow Management • Completed $175 million senior secured term loan and $75 million asset-based lending facility in November 2017. Proceeds were used, among other things, to retir
Slide 19: Historical Financial Results
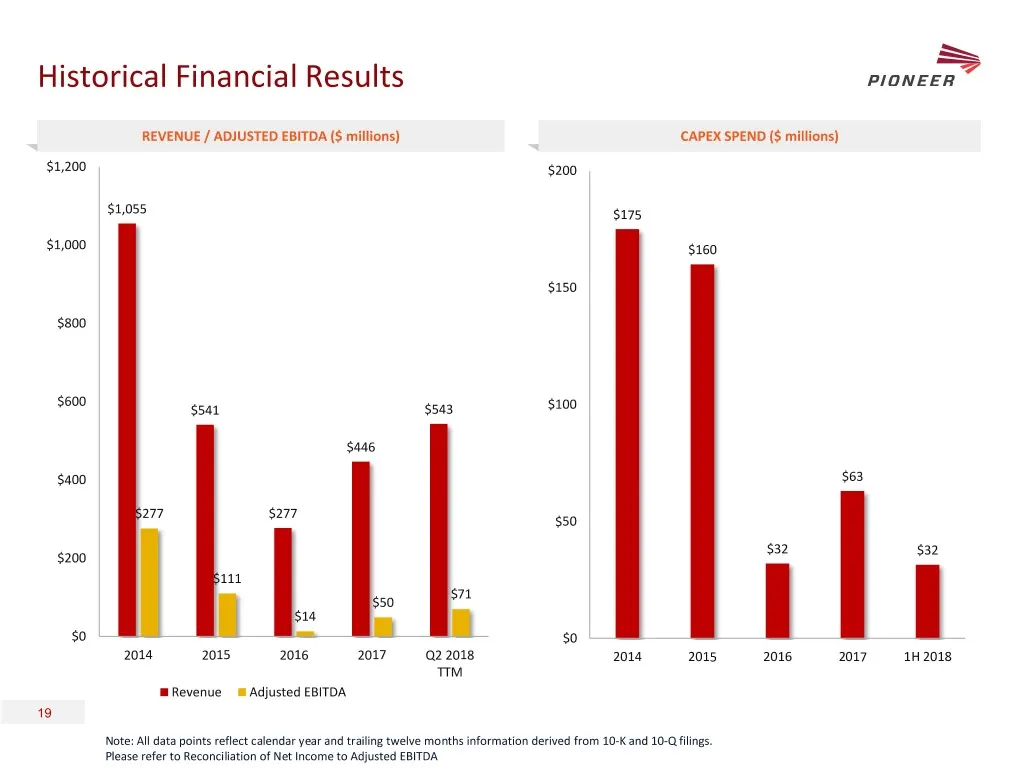
ibdroot\Projects\IBD-NY\thaw2016\595552_1\06. Road Show\PES Company Presentation GS EQUITY v02.pptx Historical Financial Results REVENUE / ADJUSTED EBITDA ($ millions) CAPEX SPEND ($ millions) $1,200 $200 $1,055 $175 $1,000 $160 $150 $800 $600 $541 $543 $100 $446 $400 $63 $277 $277 $50 $32 $32 $200
Slide 20: Liquidity and Capital Structure
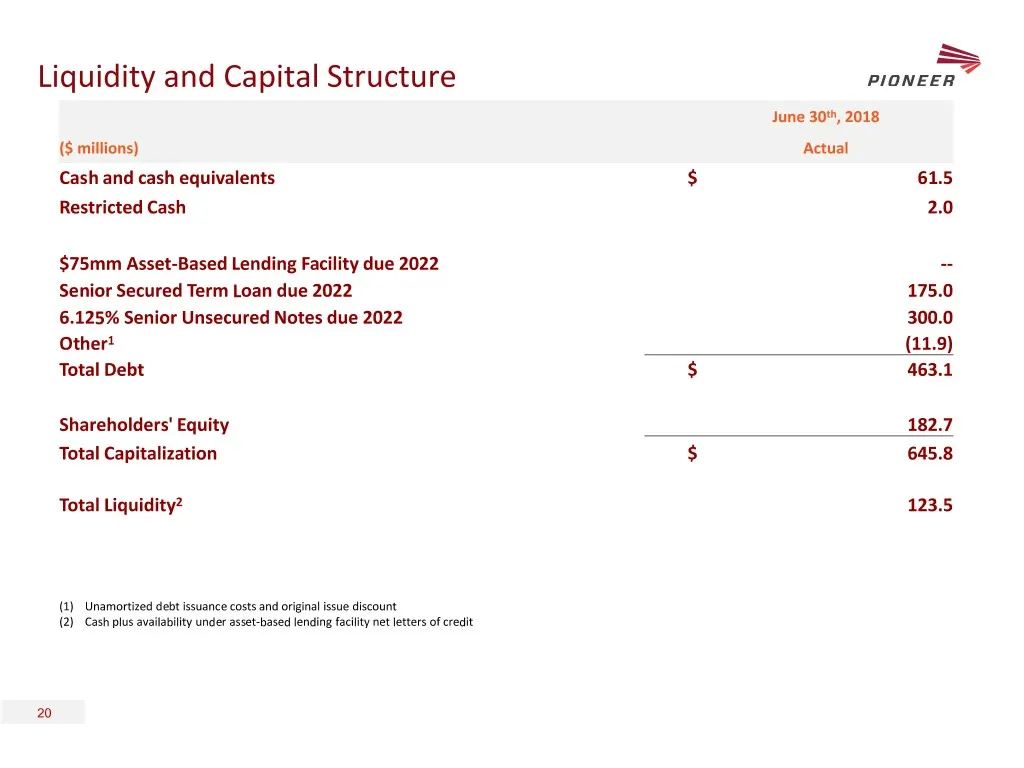
ibdroot\Projects\IBD-NY\thaw2016\595552_1\06. Road Show\PES Company Presentation GS EQUITY v02.pptx Liquidity and Capital Structure June 30th, 2018 ($ millions) Actual Cash and cash equivalents $ 61.5 Restricted Cash 2.0 $75mm Asset-Based Lending Facility due 2022 -- Senior Secured Term Loan due 202
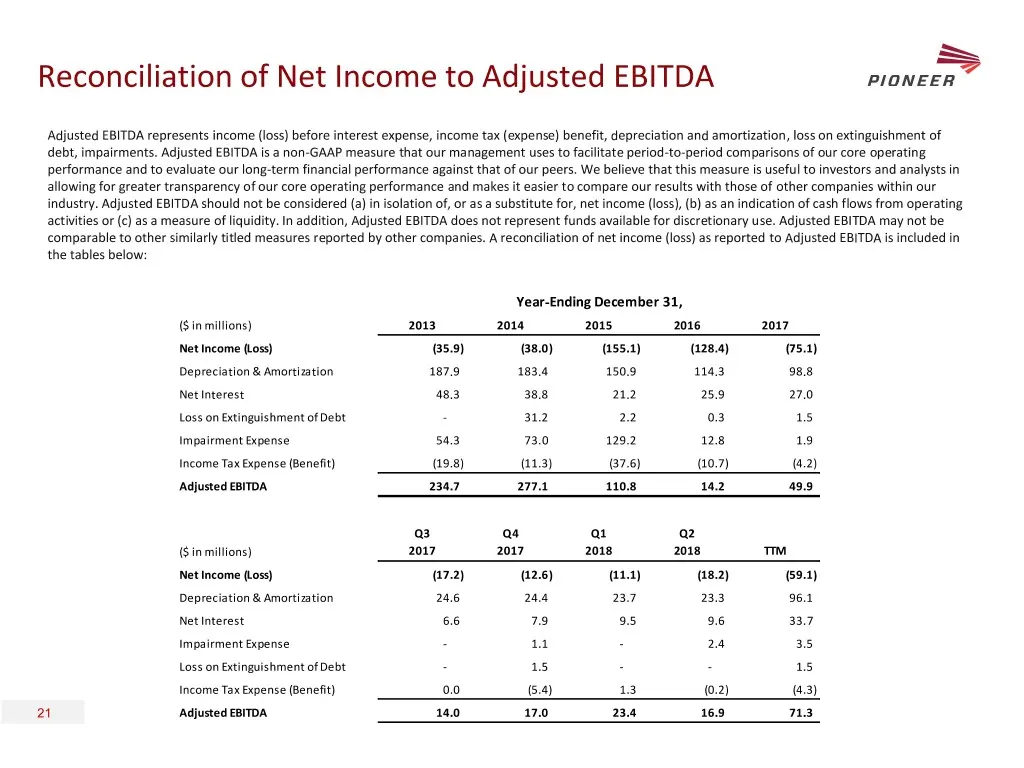
Slide 21: Reconciliation of Net Income to Adjusted EBITDA
ibdroot\Projects\IBD-NY\thaw2016\595552_1\06. Road Show\PES Company Presentation GS EQUITY v02.pptx Reconciliation of Net Income to Adjusted EBITDA Adjusted EBITDA represents income (loss) before interest expense, income tax (expense) benefit, depreciation and amortization, loss on extinguishment of
Slide 22: ibdroot\Projects\IBD-NY\thaw2016\595552_1\06. Road Show\PES Company Presentation GS EQUITY v02.pptx
ibdroot\Projects\IBD-NY\thaw2016\595552_1\06. Road Show\PES Company Presentation GS EQUITY v02.pptx
Source: SEC EDGAR · 8-K filed Aug 28, 2018
More decks from Pioneer Energy Services Corp
 Merger or Acquisition (July 2021)17 slides · Jul 8, 2021
 2019 Simmons Energy Conference22 slides · Feb 27, 2019
 Goldman Sachs Global Energy Conference 201922 slides · Jan 9, 2019
 Jefferies Energy Conference 201822 slides · Nov 27, 2018
 Johnson Rice 2018 Energy Conference22 slides · Sep 26, 2018
 Wells Fargo Securities 3rd Annual West Coast Energy Conference 201822 slides · Jun 12, 2018