SunTrust Banks — 2018 Barclays Global Financial Services Conference
26 slides from SunTrust Banks's conference presentation, Sep 12, 2018
Slide 1: 2018 Barclays Global Financial Services Conference
2018 BARCLAYS GLOBAL FINANCIAL SERVICES CONFERENCE Allison Dukes, Chief Financial Officer September 12, 2018 © 2018 SunTrust Banks, Inc. SunTrust is a federally registered trademark of SunTrust Banks, Inc.
Slide 2: Important Cautionary Statement
IMPORTANT CAUTIONARY STATEMENT The following should be read in conjunction with the financial statements, notes and other information contained in the Company’s 2017 Annual Report on Form 10-K, Quarterly Reports on Form 10-Q, and Current Reports on Form 8-K. This presentation includes non-GAAP finan
Slide 3: SunTrust Overview
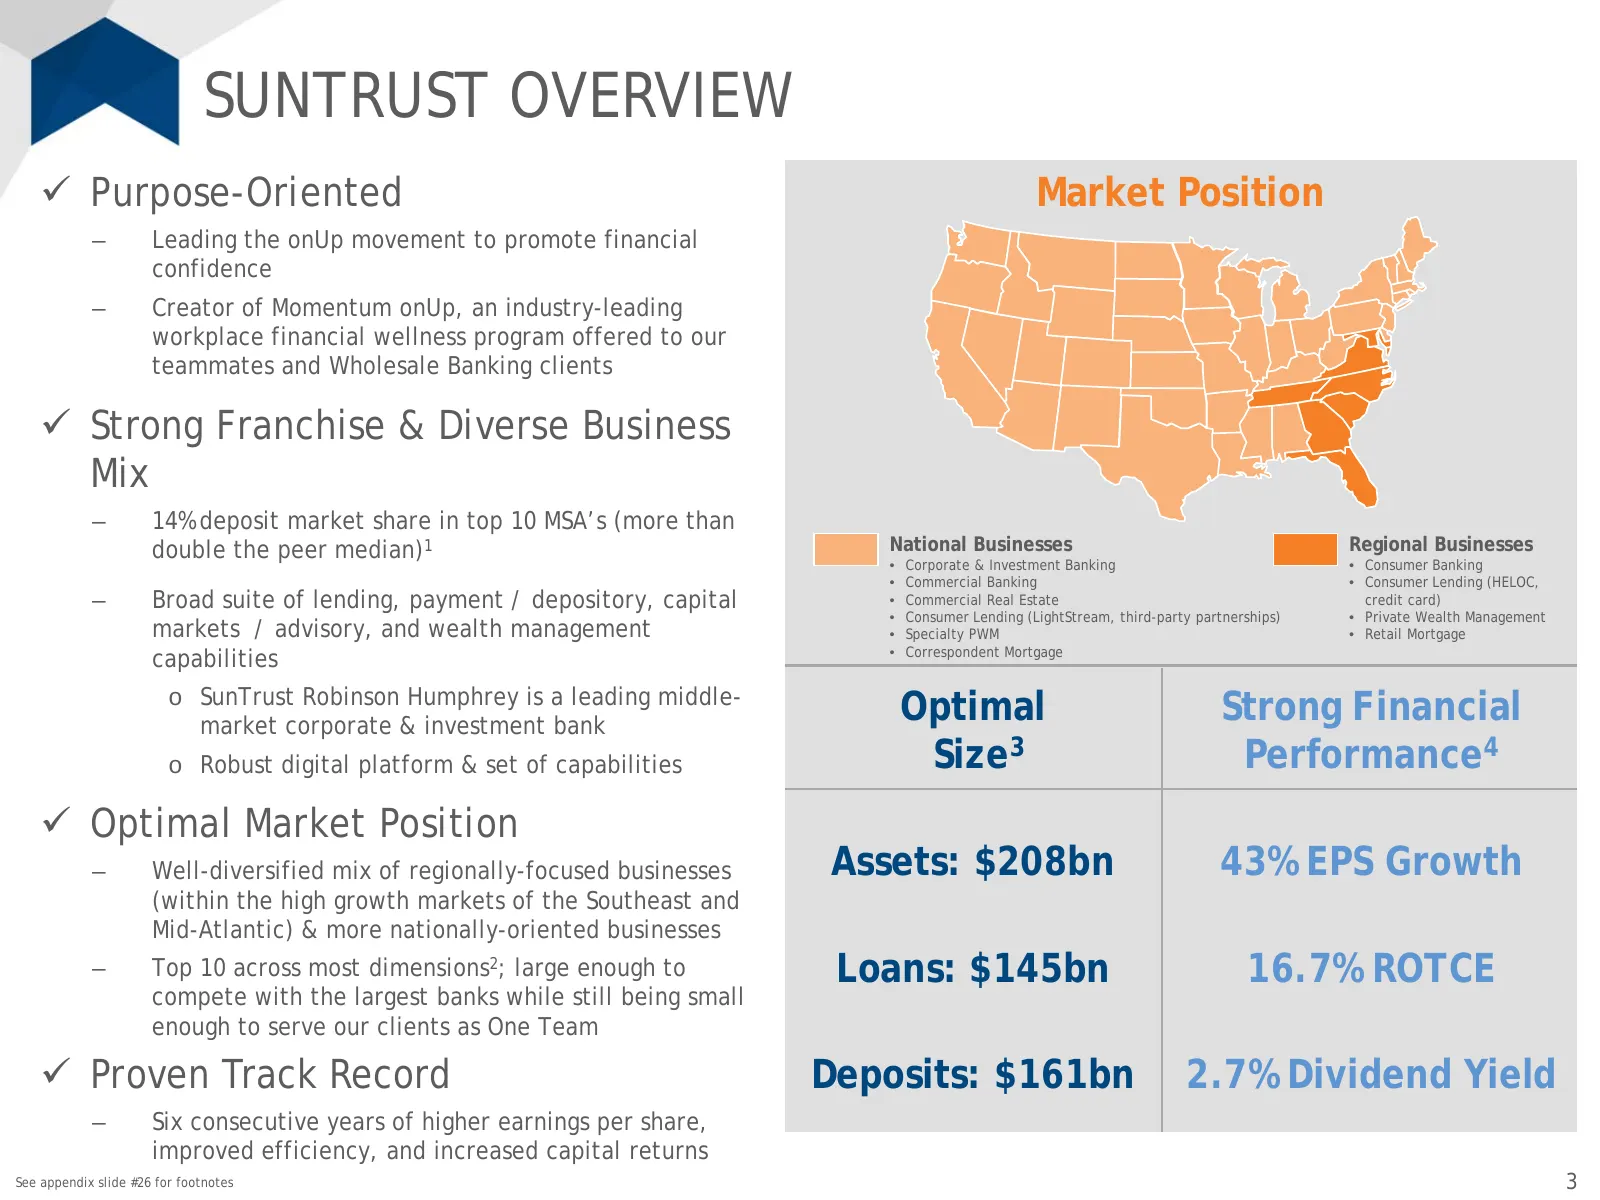
SUNTRUST OVERVIEW Purpose-Oriented Market Position – Leading the onUp movement to promote financial confidence – Creator of Momentum onUp, an industry-leading workplace financial wellness program offered to our teammates and Wholesale Banking clients Strong Franchise & Diverse Business Mix – 14%
Slide 4: Strong Funding Profile
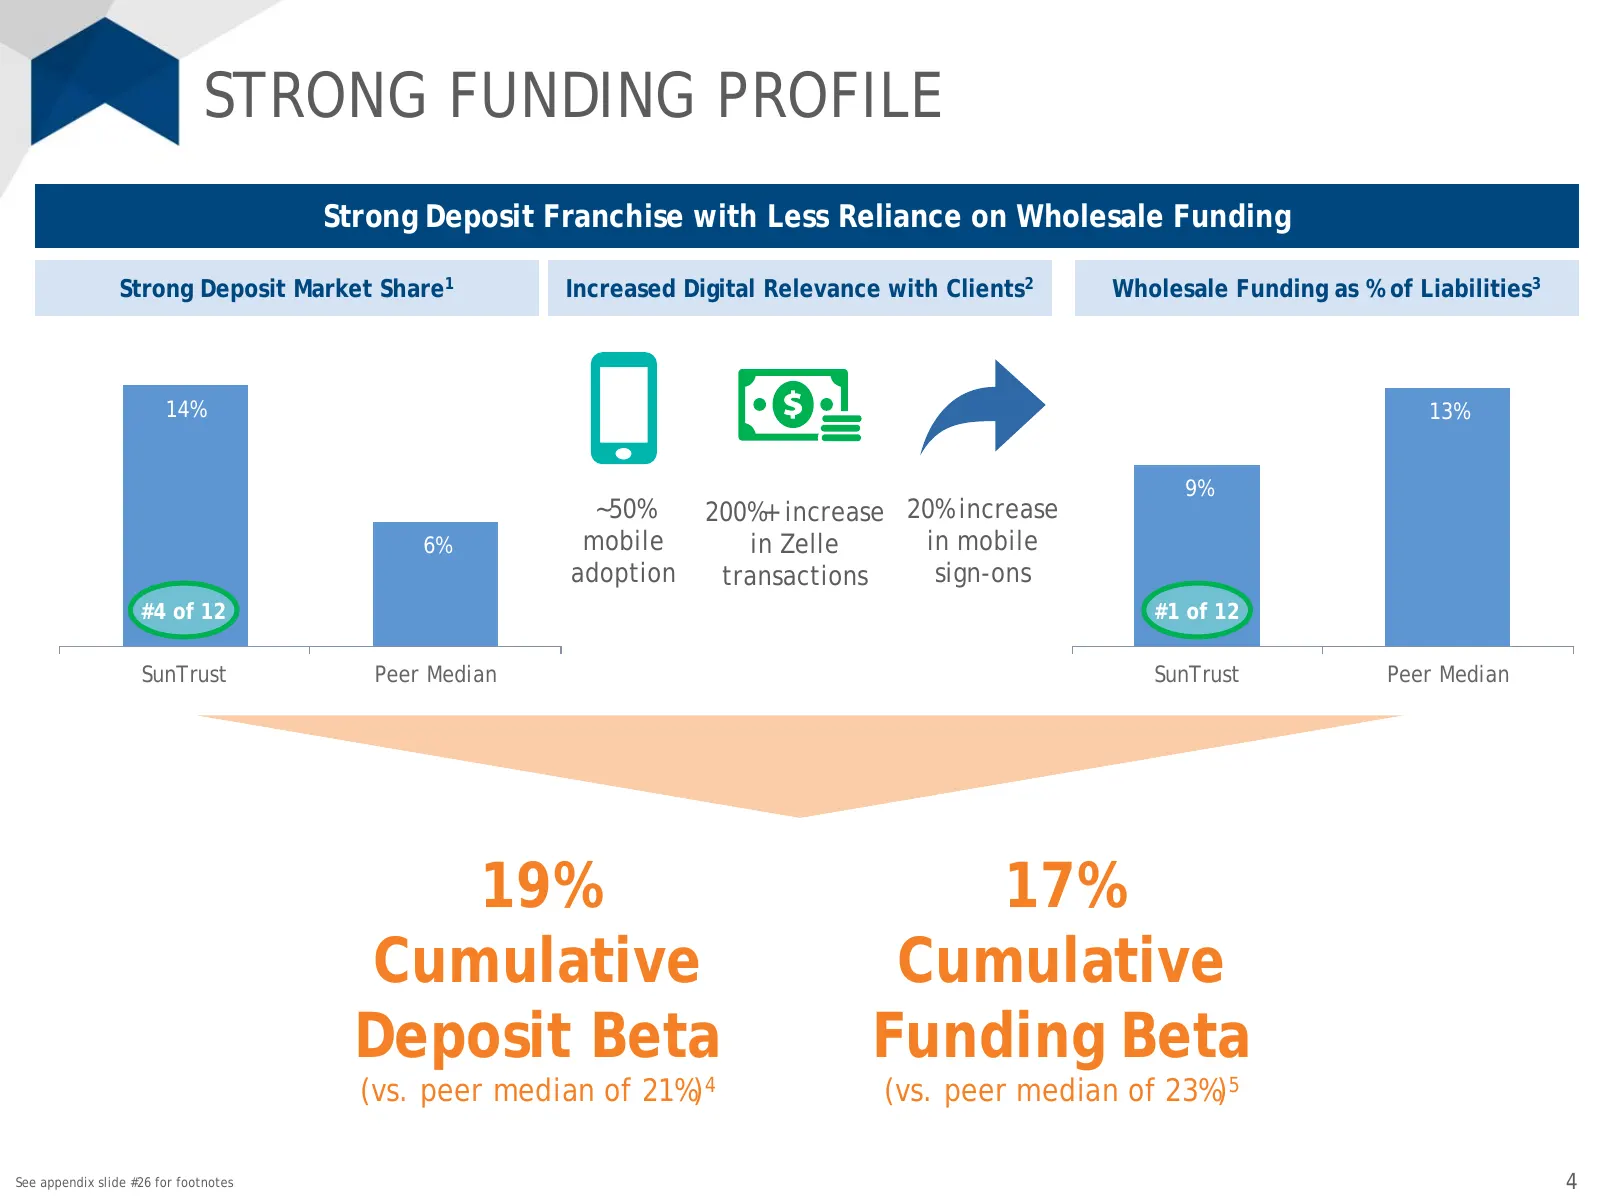
STRONG FUNDING PROFILE Strong Deposit Franchise with Less Reliance on Wholesale Funding Strong Deposit Market Share1 Increased Digital Relevance with Clients2 Wholesale Funding as % of Liabilities3 14% 13% 9% ~50% 200%+ increase 20% increase 6% mobile in Zelle in mobile adoption transactions sign-on
Slide 5: Investment Thesis
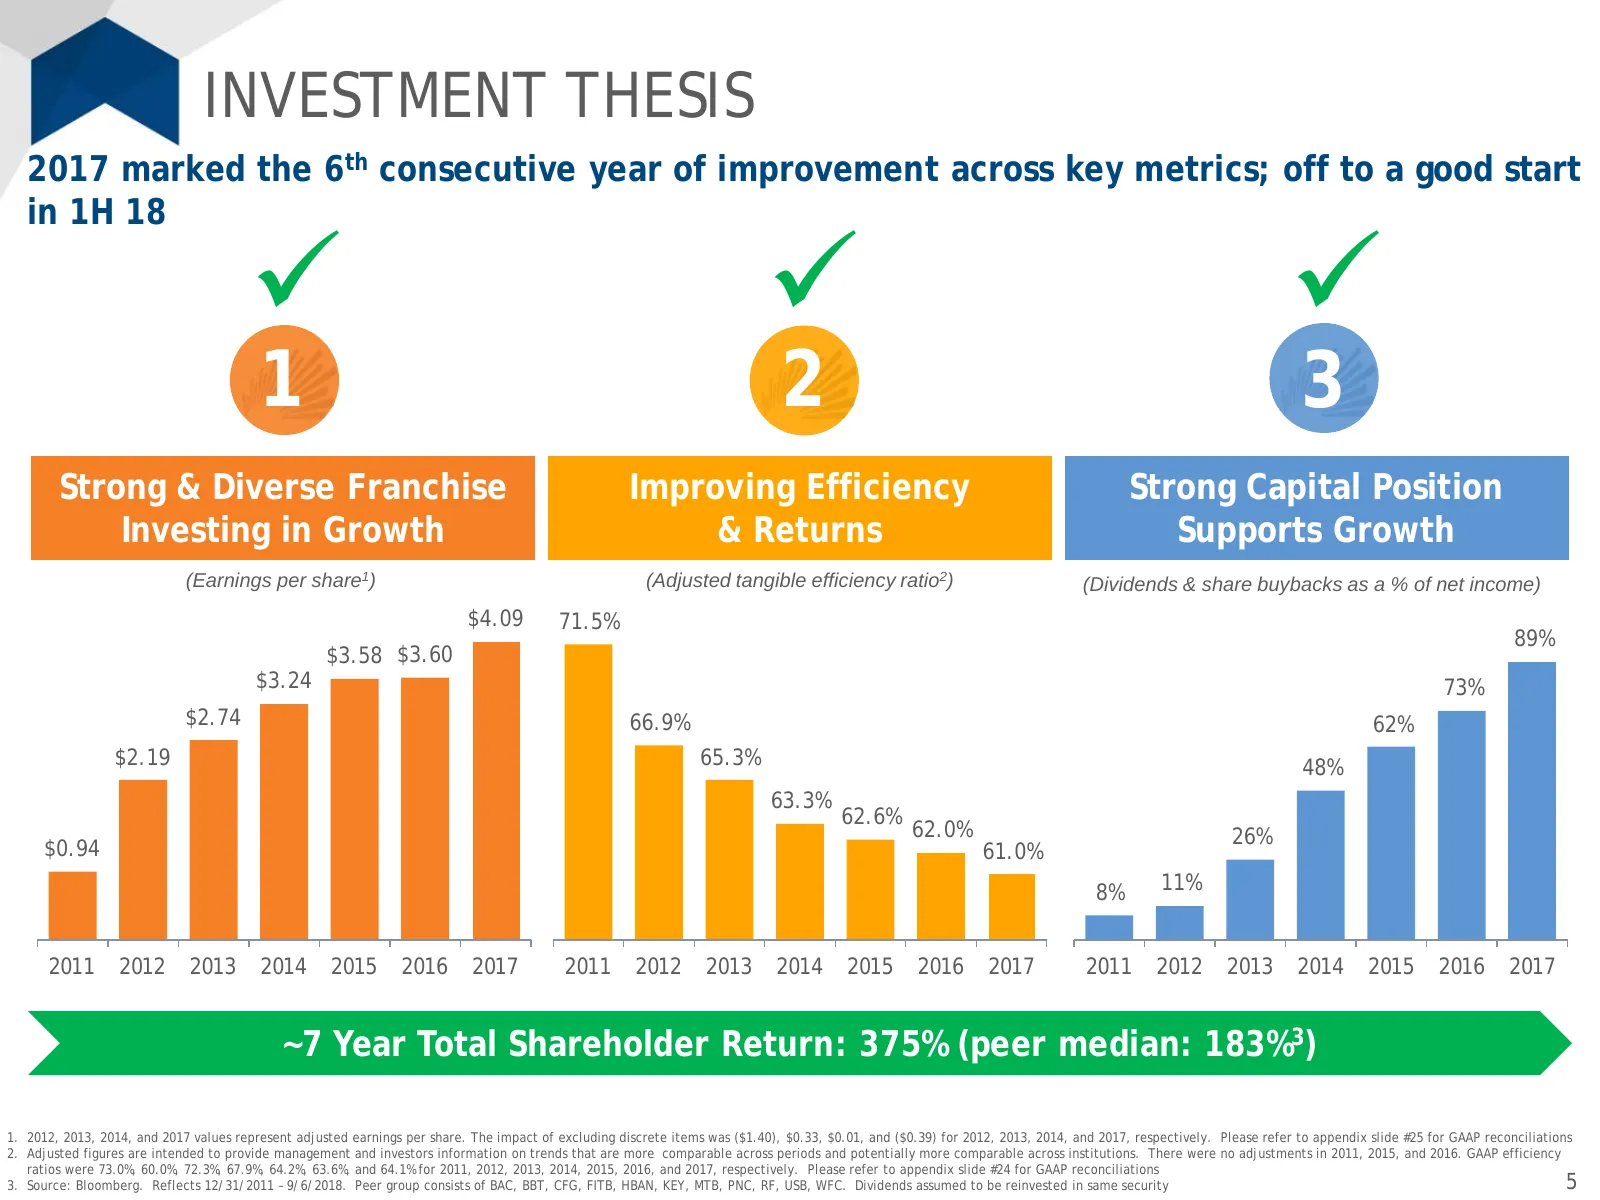
INVESTMENT THESIS 2017 marked the 6th consecutive year of improvement across key metrics; off to a good start in 1H 18 1 2 3 Strong & Diverse Franchise Improving Efficiency Strong Capital Position Investing in Growth & Returns Supports Growth (Earnings per share1) (Adjusted tangible efficiency
Slide 6: Strong & Diverse Franchise: Investing in Growth
1 STRONG & DIVERSE FRANCHISE Investing in Growth
Slide 7: Wholesale Segment: Competitive Advantage
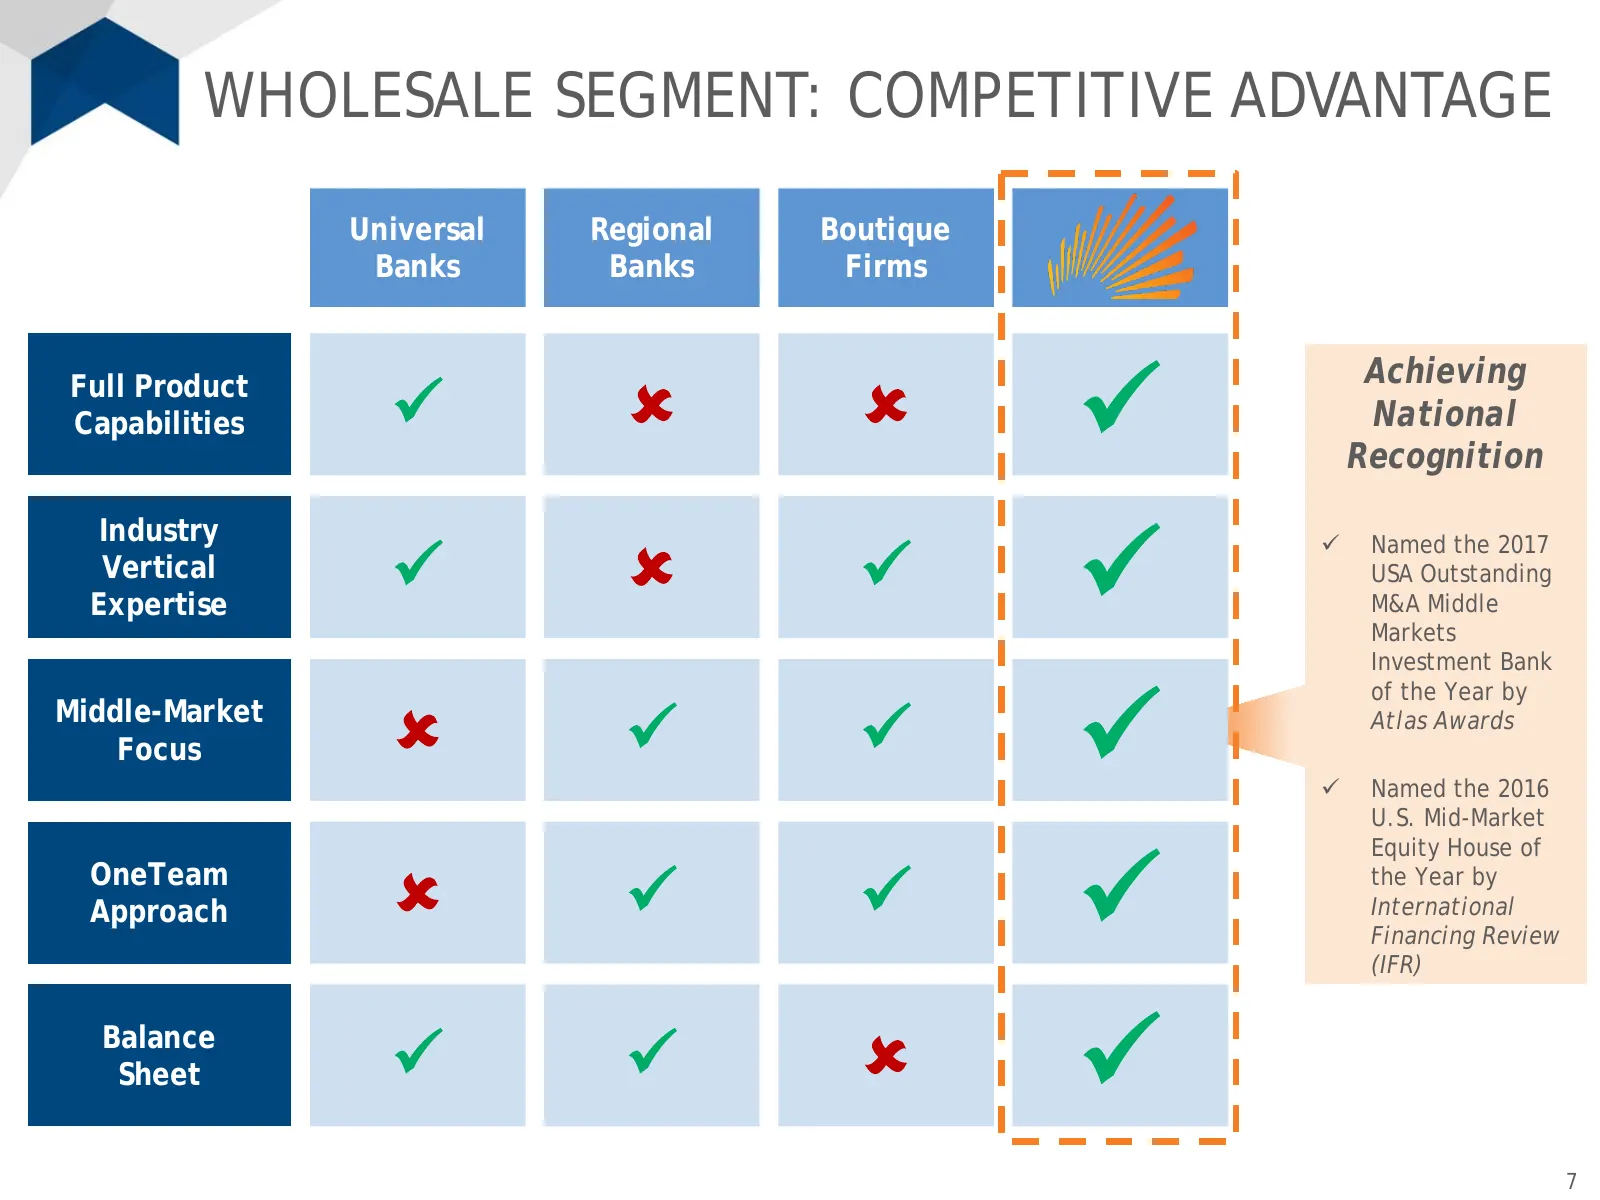
WHOLESALE SEGMENT: COMPETITIVE ADVANTAGE Universal Regional Boutique Banks Banks Firms Achieving Full Product Capabilities National Recognition Industry Vertical Expertise Named the 2017 USA Outstanding M&A Middle Markets Investment Bank of the Year by Middle-Market Focus A
Slide 8: Investment Banking: Sustainable Growth
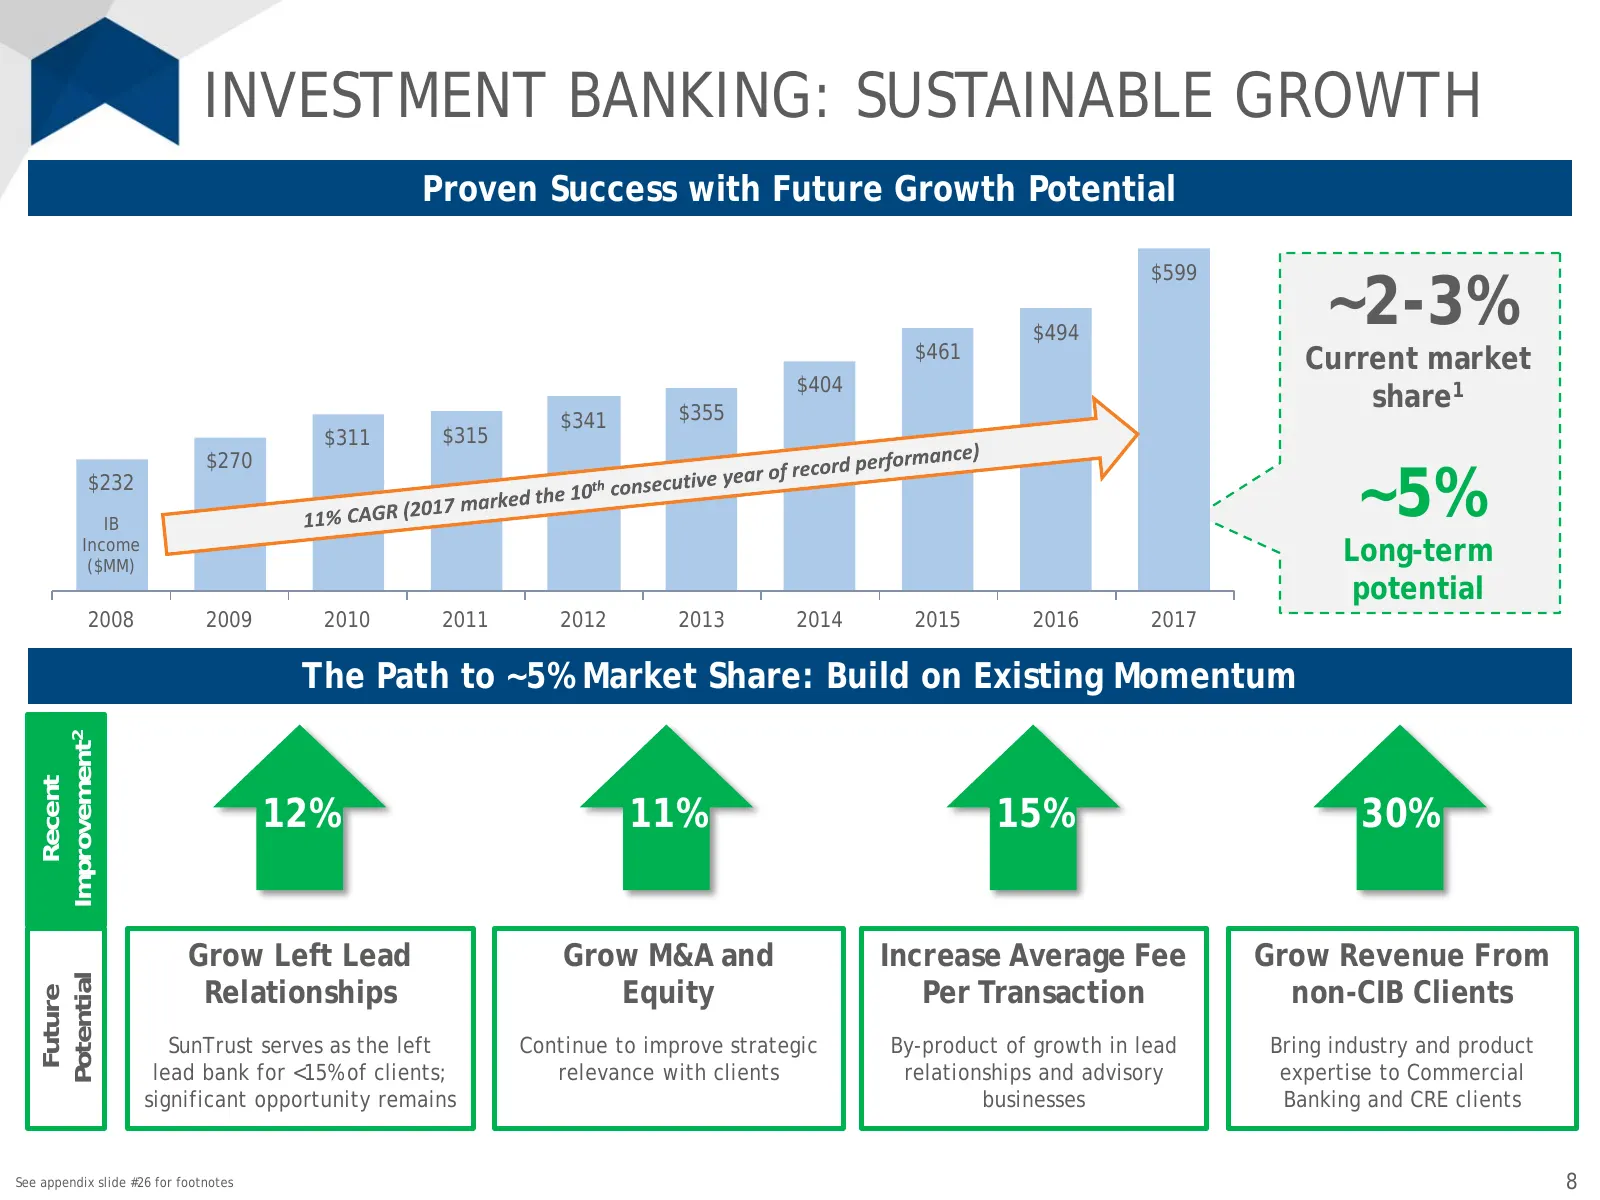
INVESTMENT BANKING: SUSTAINABLE GROWTH Proven Success with Future Growth Potential ~2-3% $599 $494 $461 Current market $404 $355 share1 $341 $311 $315 $270 $232 IB ~5% Income ($MM) Long-term potential 2008 2009 2010 2011 2012 2013 2014 2015 2016 2017 The Path to ~5% Market Share: Build on Existing M
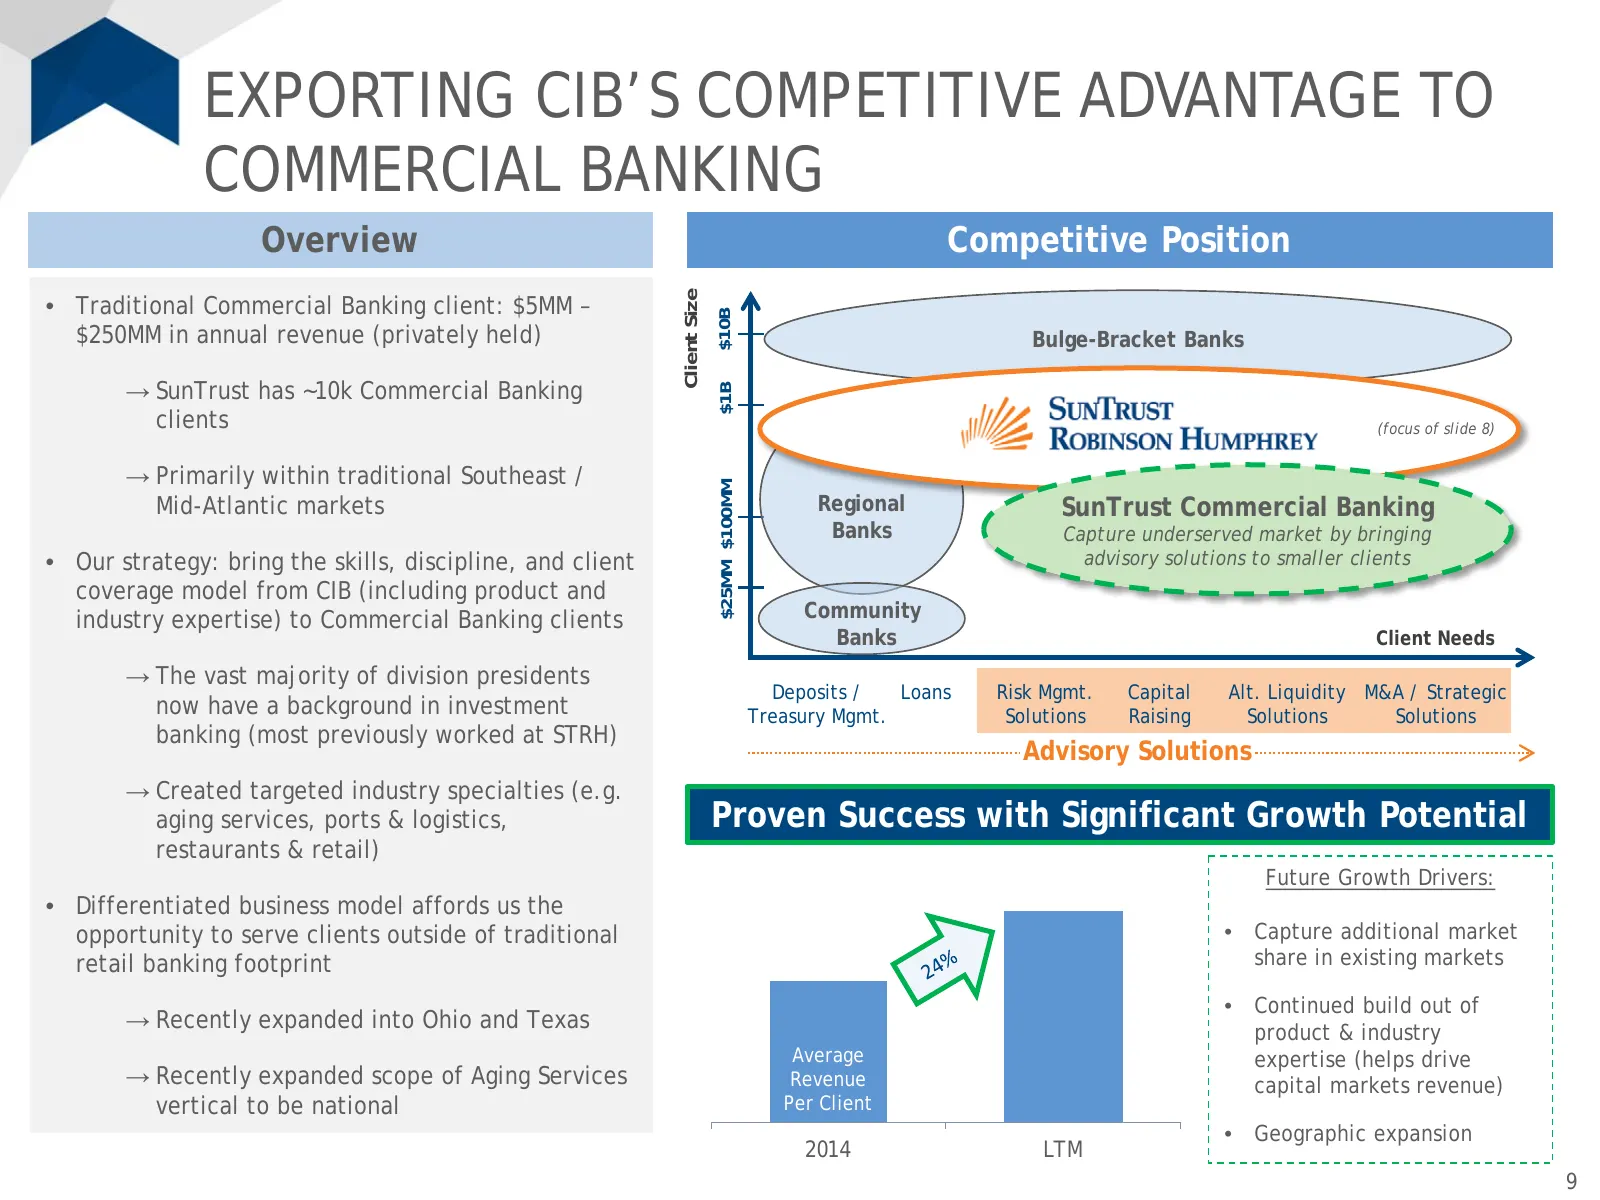
Slide 9: Exporting CIB's Competitive Advantage to Commercial Banking
EXPORTING CIB’S COMPETITIVE ADVANTAGE TO COMMERCIAL BANKING Overview Competitive Position Client Size • Traditional Commercial Banking client: $5MM – $10B $250MM in annual revenue (privately held) Bulge-Bracket Banks → SunTrust has ~10k Commercial Banking $1B clients (focus of slide 8) → Primarily w
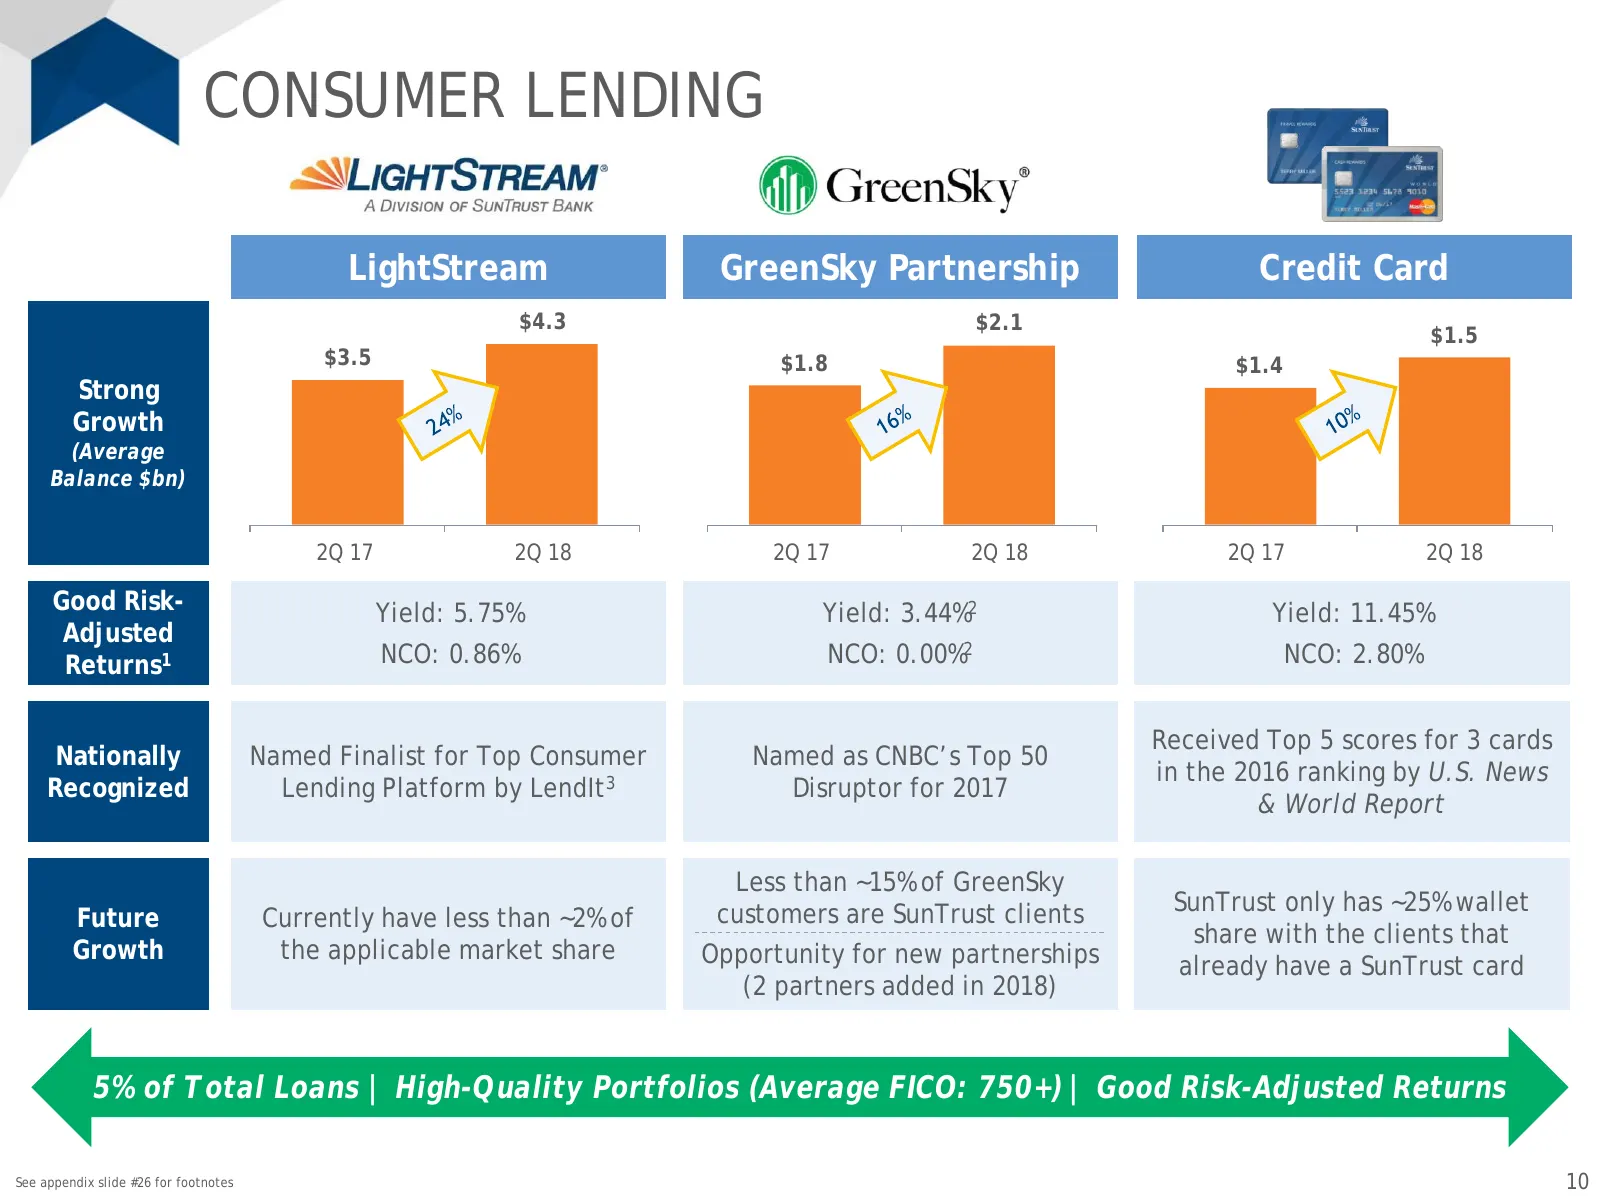
Slide 10: Consumer Lending
CONSUMER LENDING LightStream GreenSky Partnership Credit Card $4.3 $2.1 $1.5 $3.5 $1.8 $1.4 Strong Growth (Average Balance $bn) 2Q 17 2Q 18 2Q 17 2Q 18 2Q 17 2Q 18 Good Risk- Yield: 5.75% Yield: 3.44%2 Yield: 11.45% Adjusted Returns1 NCO: 0.86% NCO: 0.00%2 NCO: 2.80% Received Top 5 scores for 3 card
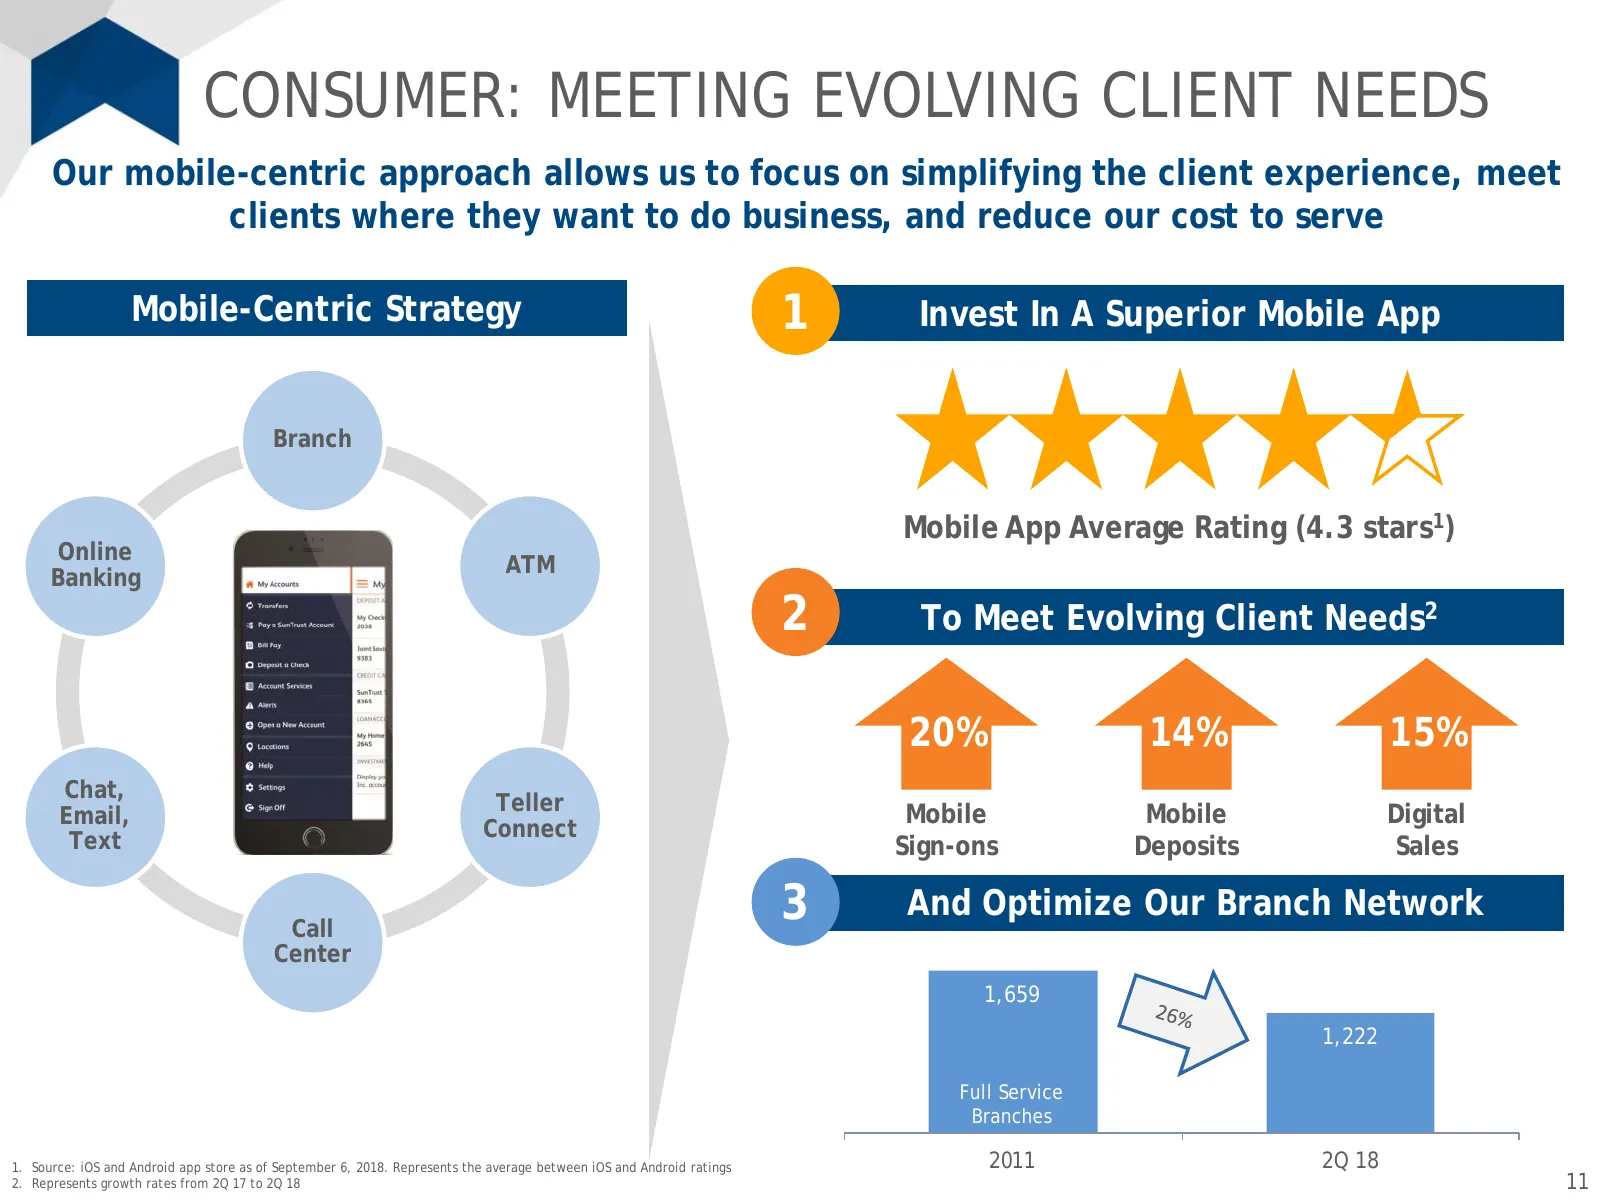
Slide 11: Consumer: Meeting Evolving Client Needs
CONSUMER: MEETING EVOLVING CLIENT NEEDS Our mobile-centric approach allows us to focus on simplifying the client experience, meet clients where they want to do business, and reduce our cost to serve Mobile-Centric Strategy 1 Invest In A Superior Mobile App Branch Mobile App Average Rating (4.3 stars
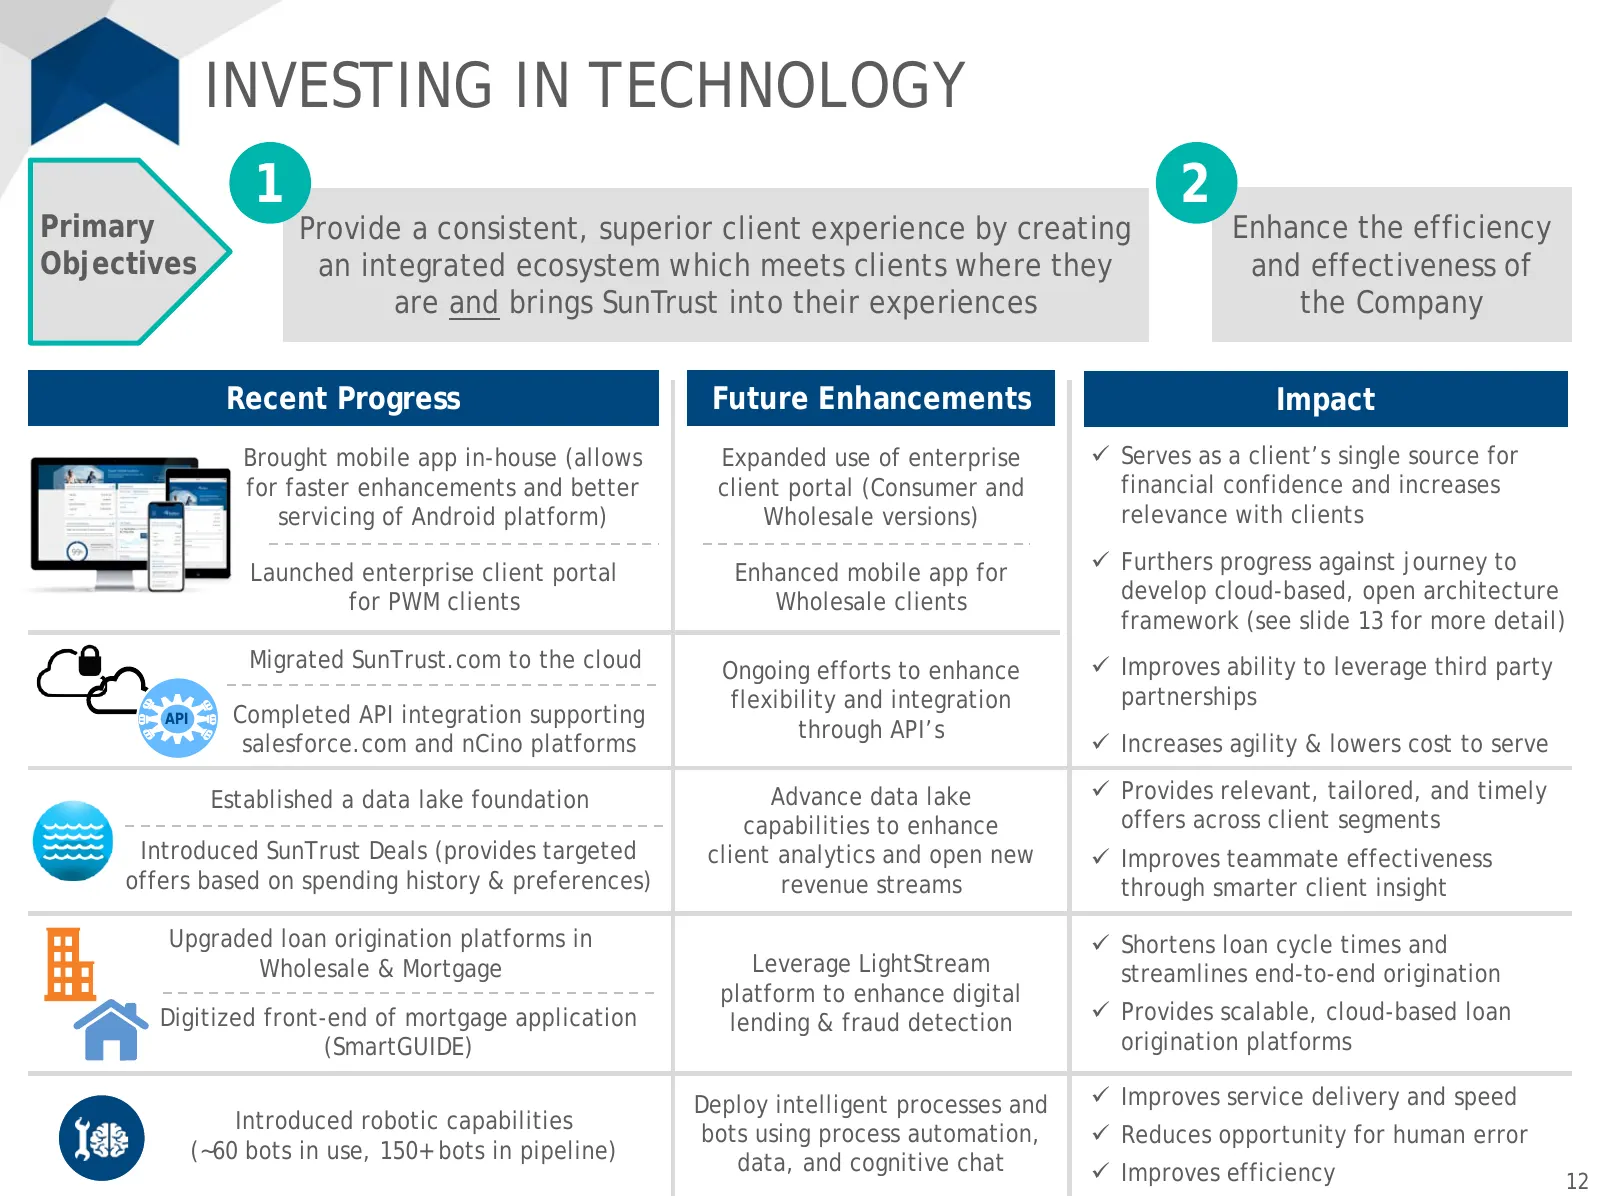
Slide 12: Investing in Technology
INVESTING IN TECHNOLOGY 1 2 Primary Provide a consistent, superior client experience by creating Enhance the efficiency Objectives an integrated ecosystem which meets clients where they and effectiveness of are and brings SunTrust into their experiences the Company Recent Progress Future Enhancement
Slide 13: Scale Is Not the Only Determinant of Success
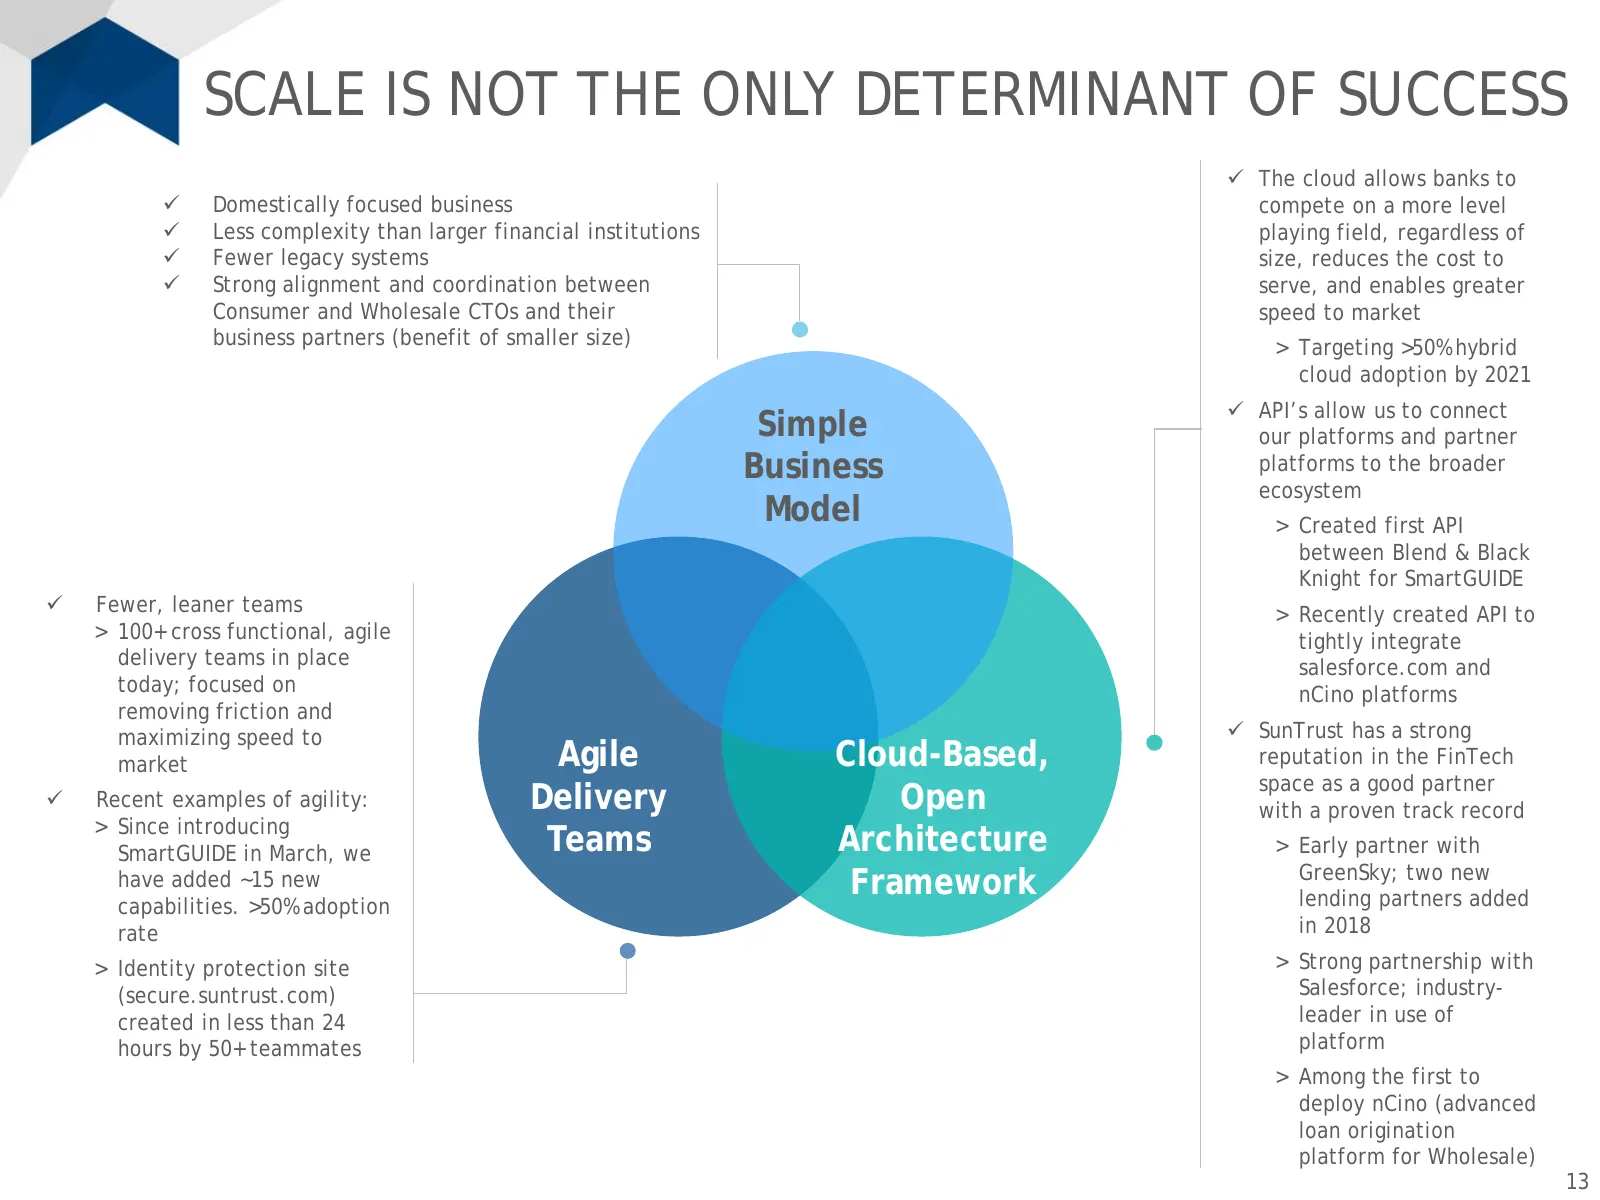
SCALE IS NOT THE ONLY DETERMINANT OF SUCCESS The cloud allows banks to Domestically focused business compete on a more level Less complexity than larger financial institutions playing field, regardless of Fewer legacy systems size, reduces the cost to Strong alignment and coordination betw
Slide 14: Improving Efficiency & Returns
2 IMPROVING EFFICIENCY & RETURNS
Slide 15: Savings Fund Investments
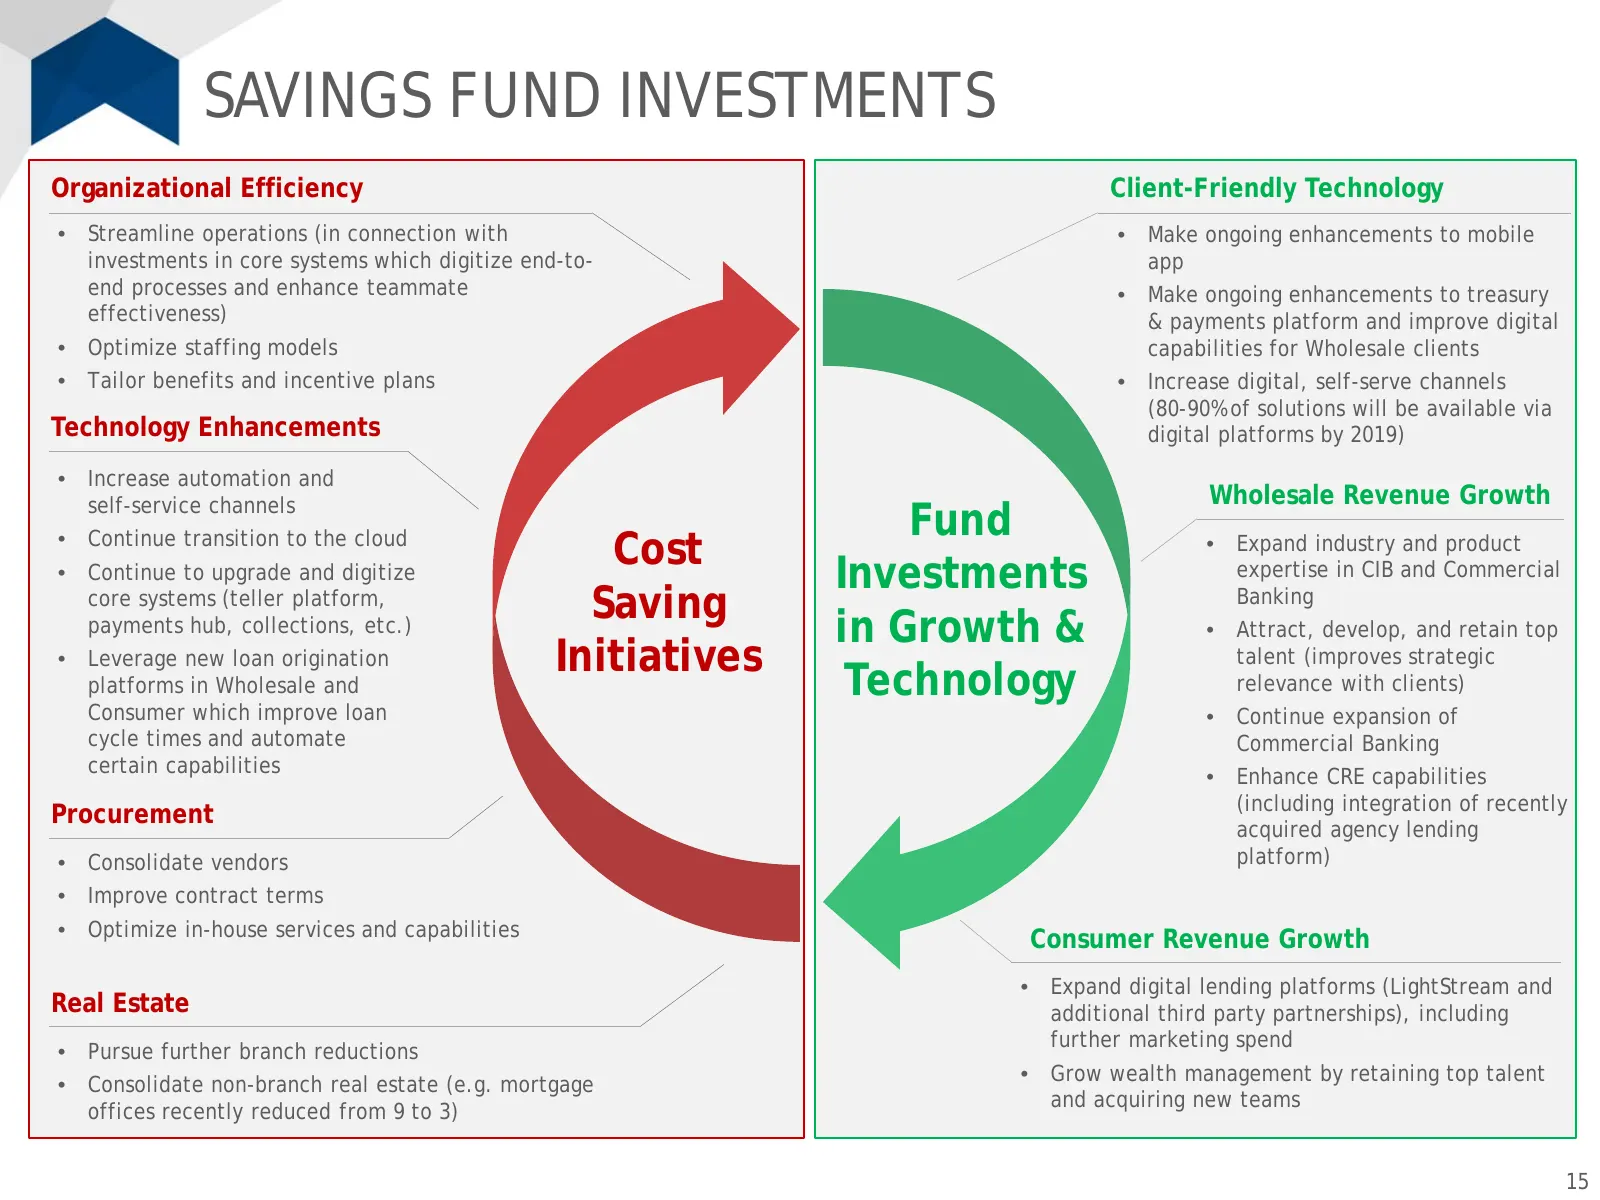
SAVINGS FUND INVESTMENTS Organizational Efficiency Client-Friendly Technology • Streamline operations (in connection with • Make ongoing enhancements to mobile investments in core systems which digitize end-to- app end processes and enhance teammate • Make ongoing enhancements to treasury effectiven
Slide 16: Improving Efficiency: Proven Success & Future Opportunity
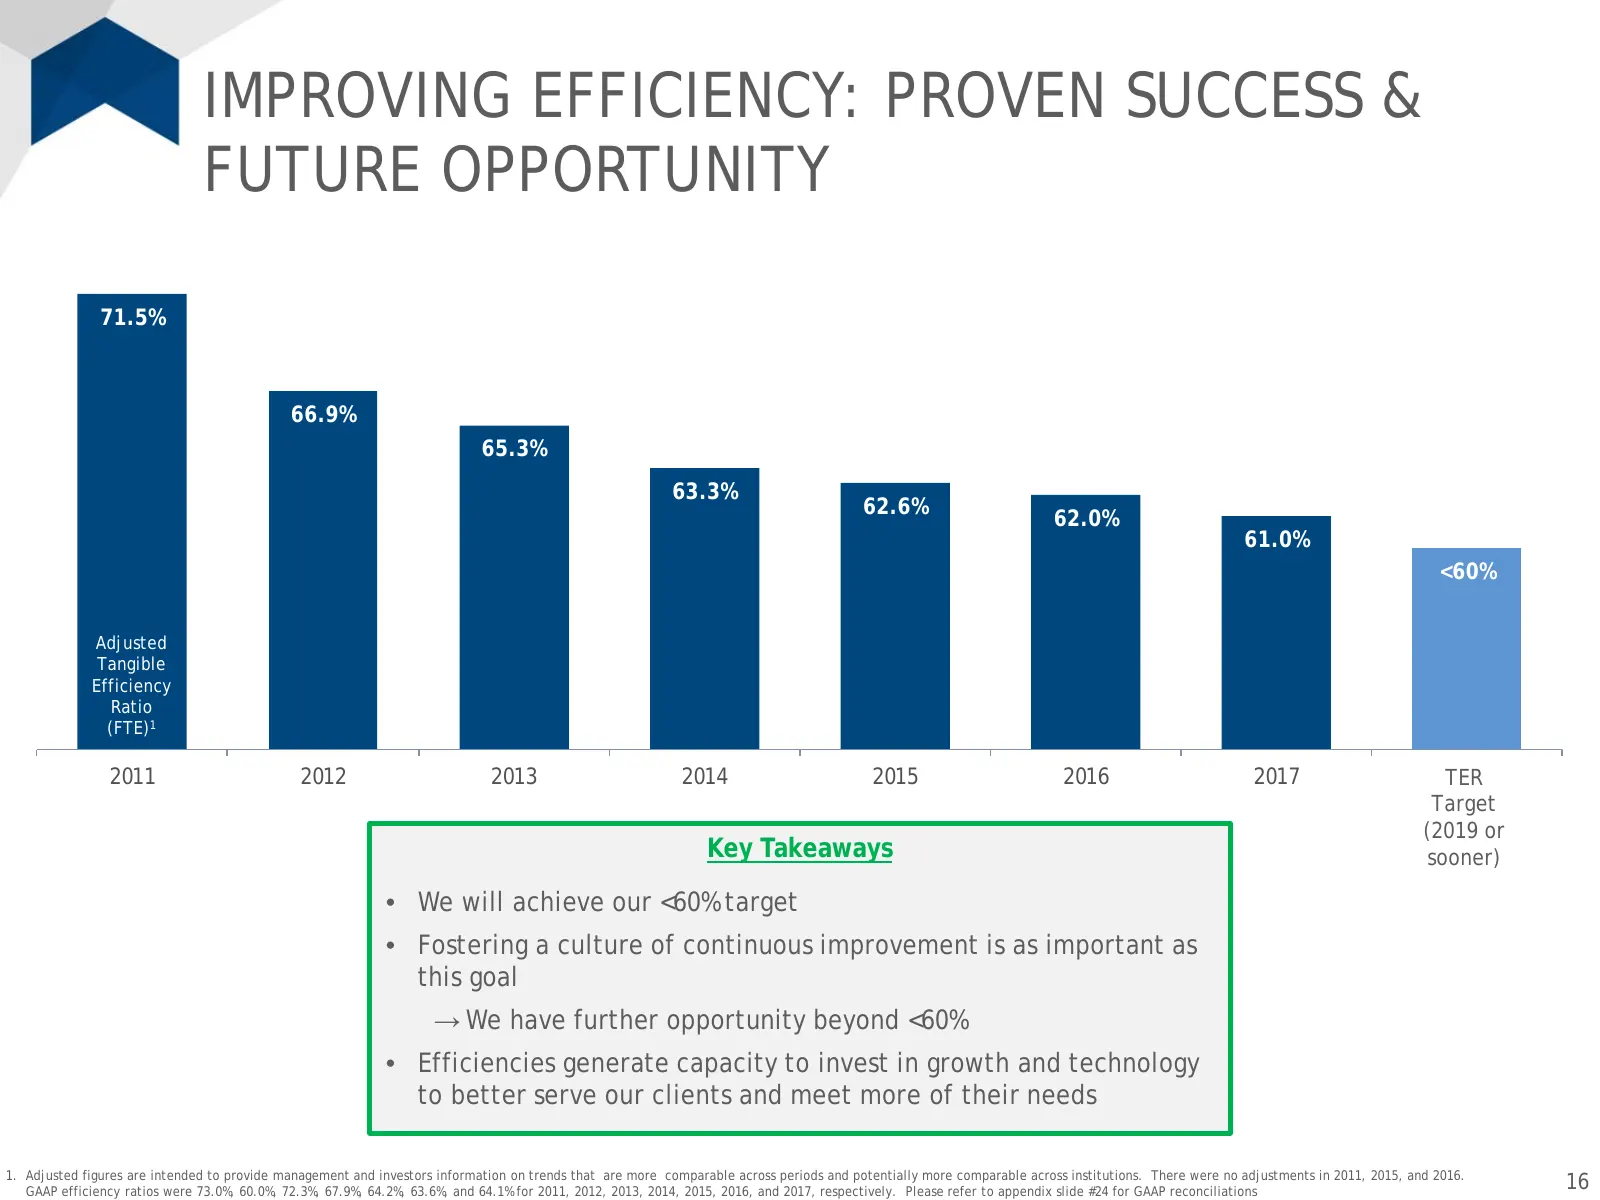
IMPROVING EFFICIENCY: PROVEN SUCCESS & FUTURE OPPORTUNITY 71.5% 66.9% 65.3% 63.3% 62.6% 62.0% 61.0% <60% Adjusted Tangible Efficiency Ratio (FTE)1 2011 2012 2013 2014 2015 2016 2017 TER Target (2019 or Key Takeaways sooner) • We will achieve our <60% target • Fostering a culture of continuous improv
Slide 17: Well-Positioned for Through the Cycle Performance
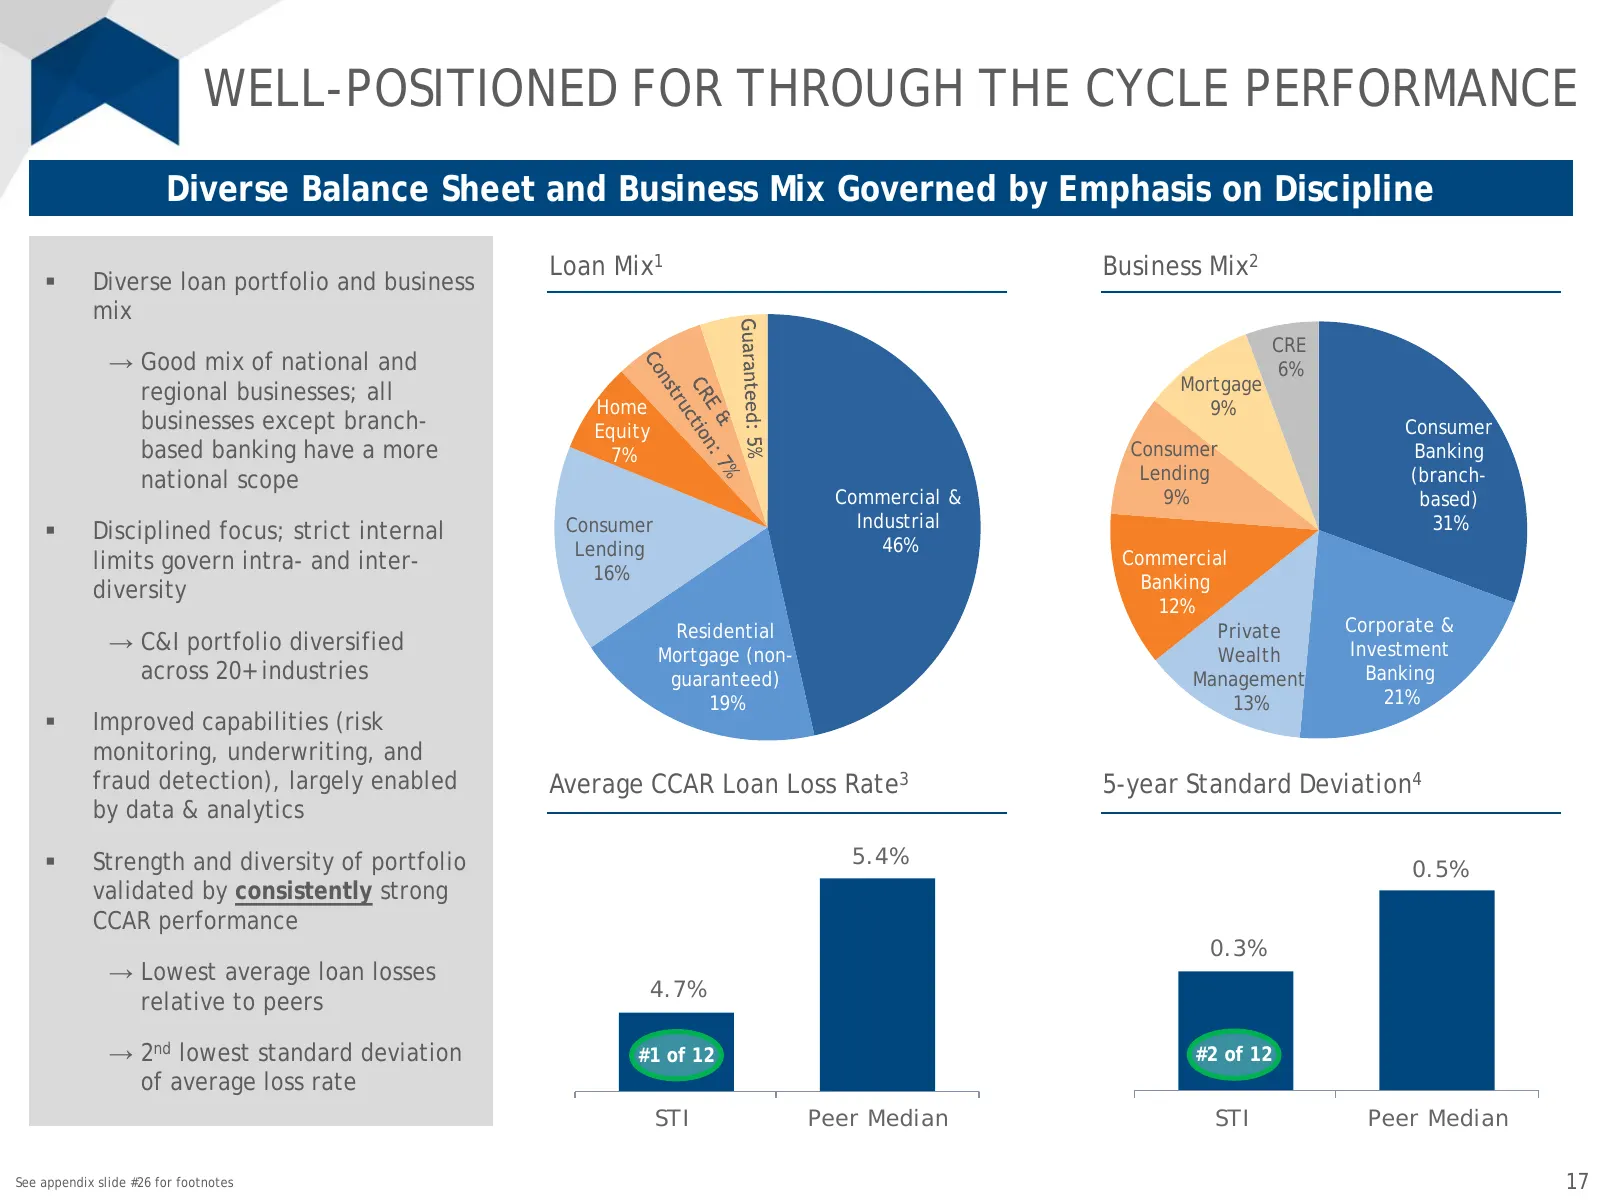
WELL-POSITIONED FOR THROUGH THE CYCLE PERFORMANCE Diverse Balance Sheet and Business Mix Governed by Emphasis on Discipline Loan Mix1 Business Mix2 Diverse loan portfolio and business mix CRE → Good mix of national and 6% regional businesses; all Mortgage Home 9% businesses except branch- Equity C
Slide 18: Strong Capital Position Supports Growth
3 STRONG CAPITAL POSITION SUPPORTS GROWTH
Slide 19: Strong Capital Position
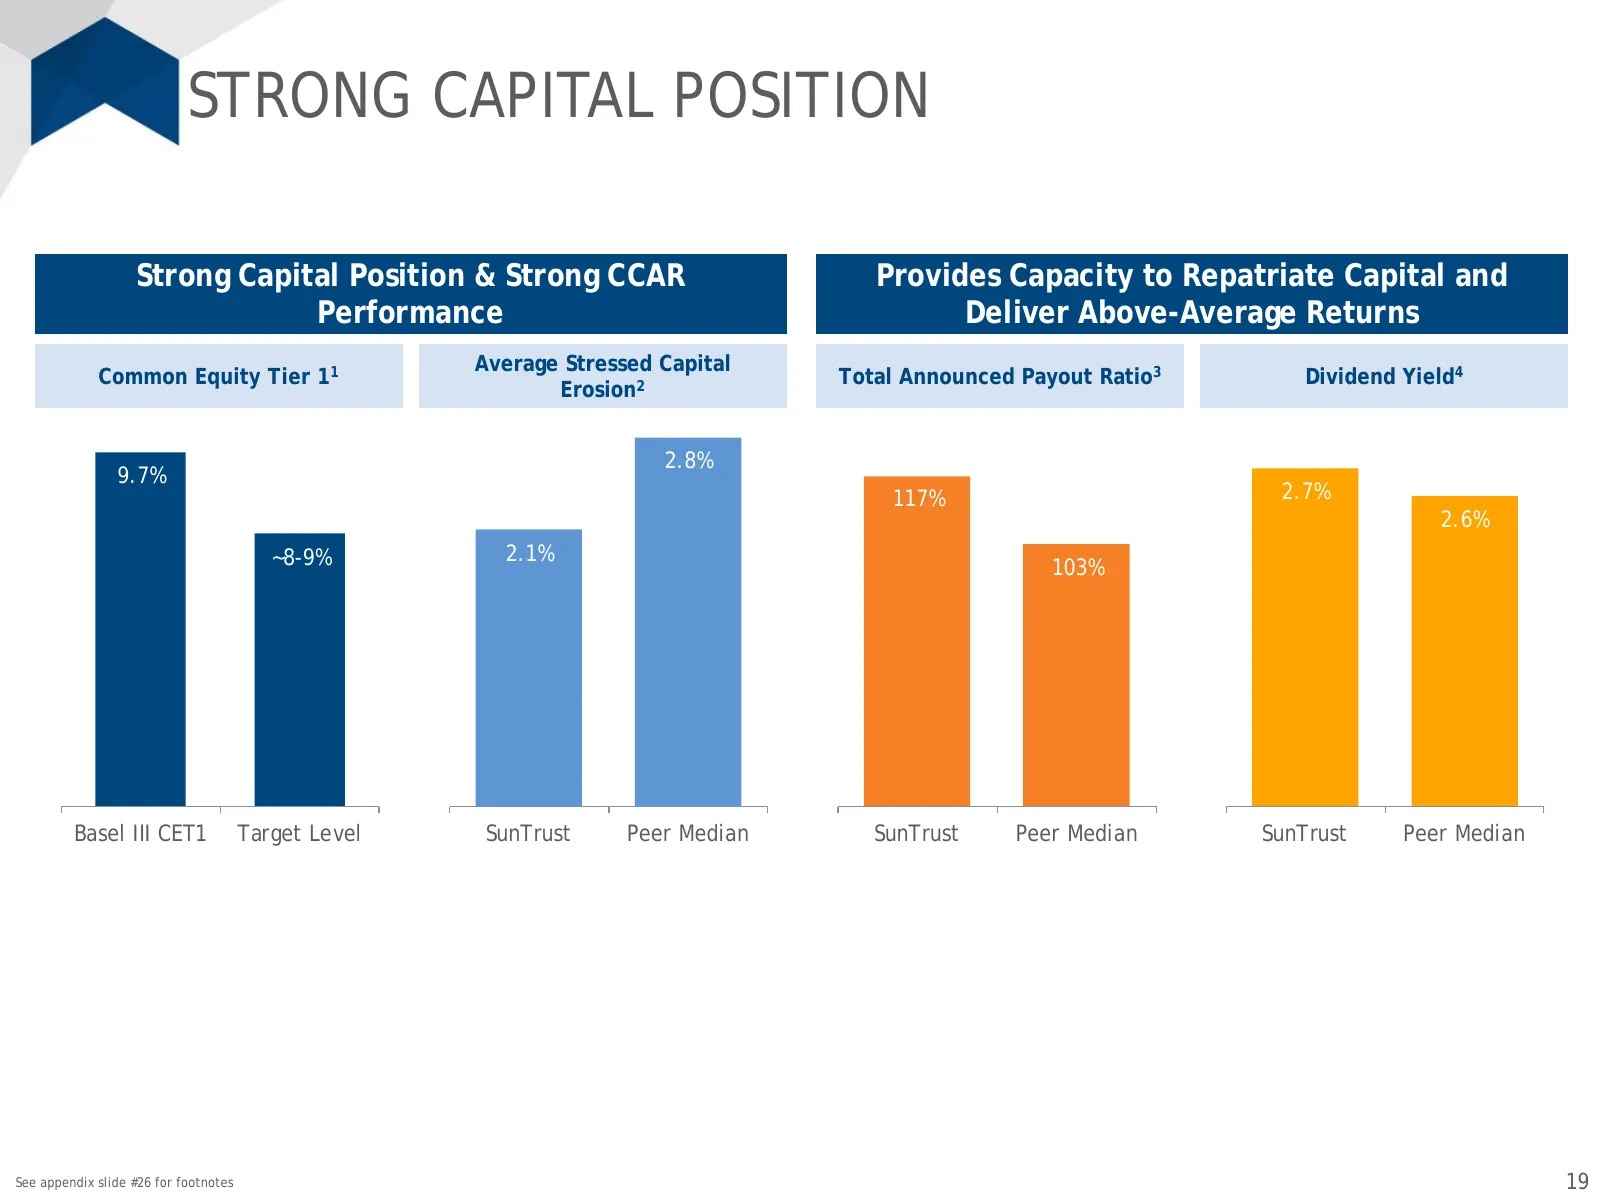
STRONG CAPITAL POSITION Strong Capital Position & Strong CCAR Provides Capacity to Repatriate Capital and Performance Deliver Above-Average Returns Average Stressed Capital Common Equity Tier 11 Total Announced Payout Ratio3 Dividend Yield4 Erosion2 2.8% 9.7% 117% 2.7% 2.6% ~8-9% 2.1% 103% Basel III
Slide 20: Recap: Why Invest in SunTrust?
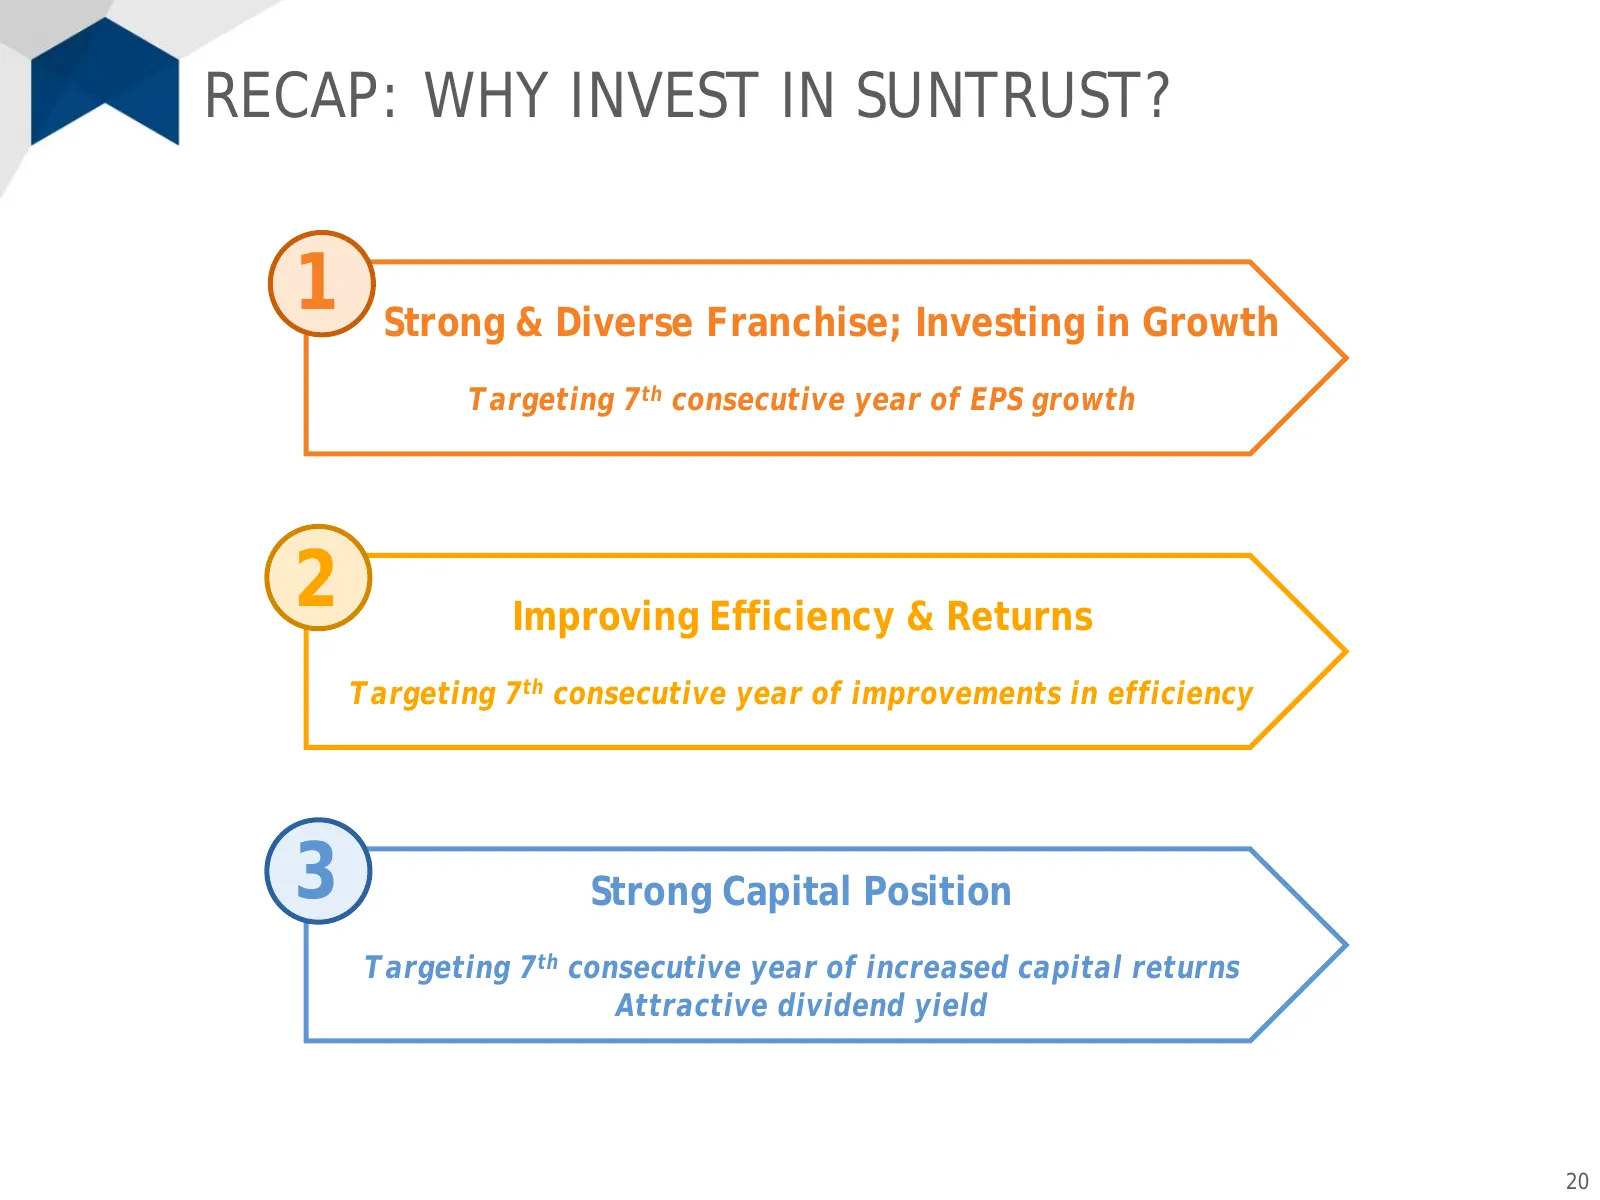
RECAP: WHY INVEST IN SUNTRUST? 1 Strong & Diverse Franchise; Investing in Growth Targeting 7th consecutive year of EPS growth 2 Improving Efficiency & Returns Targeting 7th consecutive year of improvements in efficiency 3 Strong Capital Position Targeting 7th consecutive year of increased capital re

Slide 21: Appendix
APPENDIX SUNTRUST
Slide 22: Consistently Strong CCAR Performance
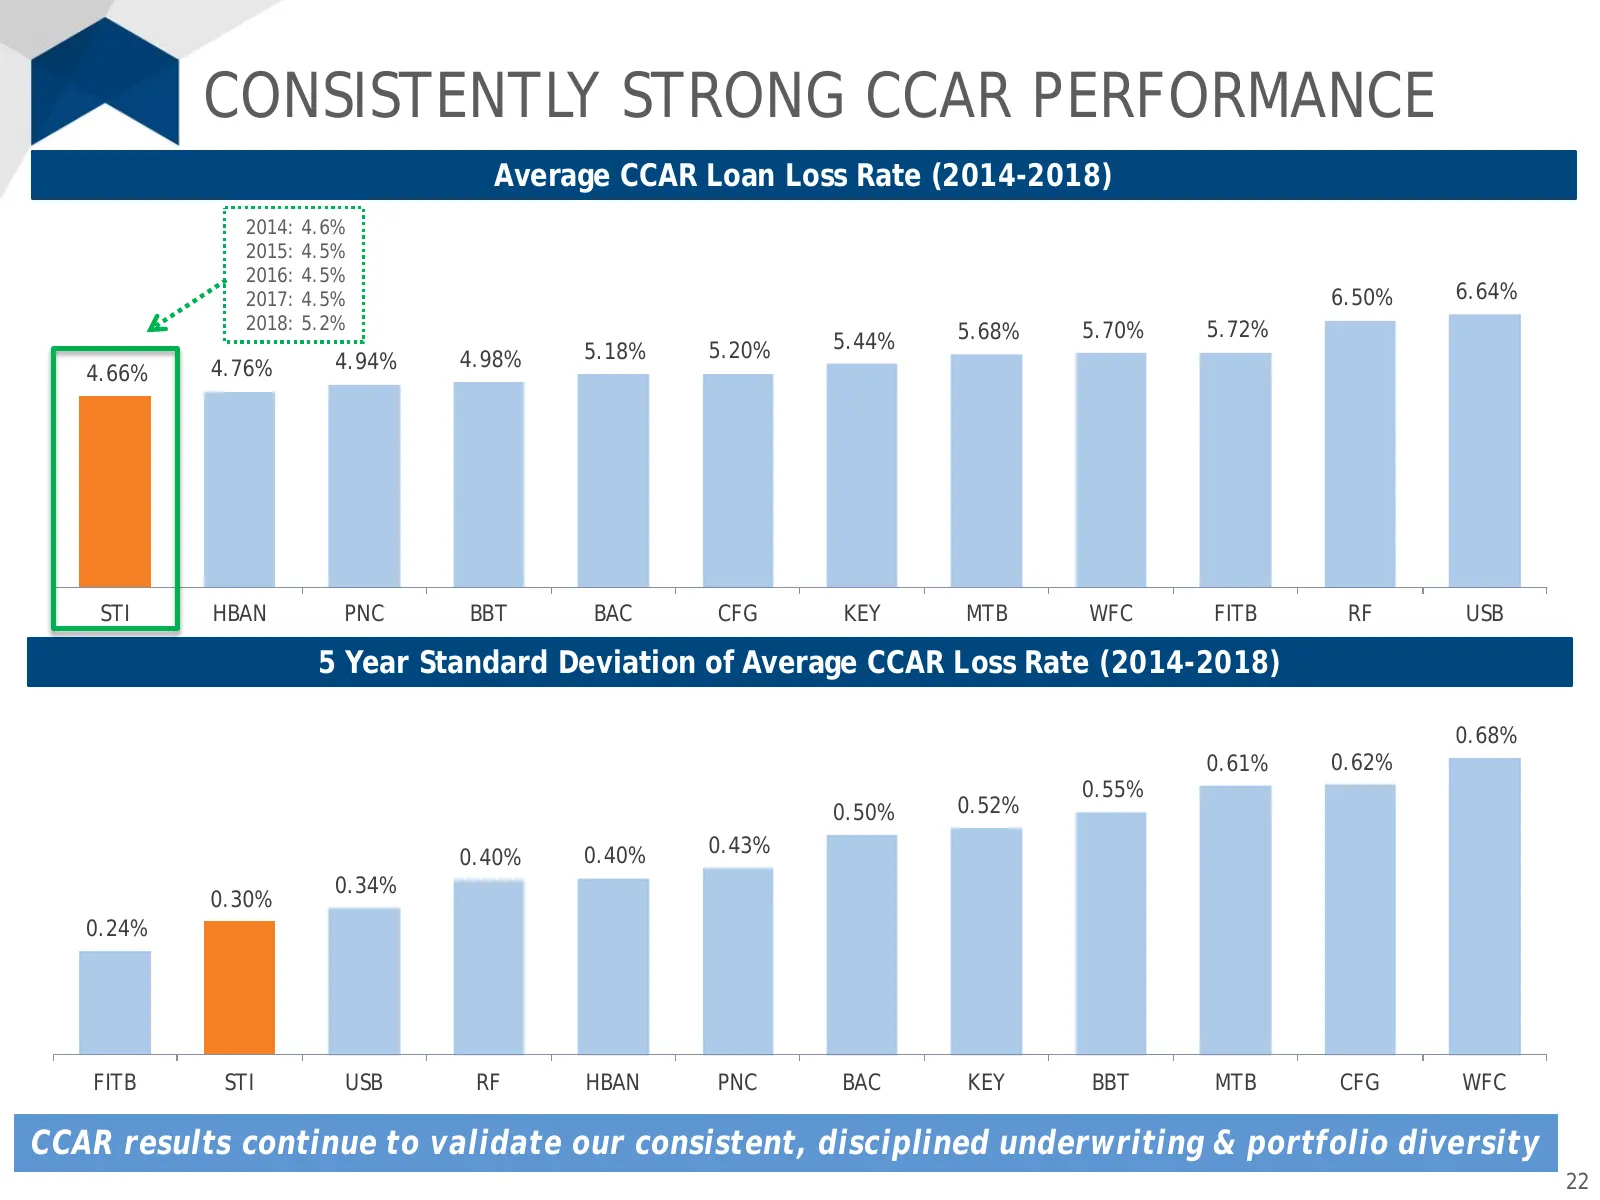
CONSISTENTLY STRONG CCAR PERFORMANCE Average CCAR Loan Loss Rate (2014-2018) 2014: 4.6% 2015: 4.5% 2016: 4.5% 2017: 4.5% 6.50% 6.64% 2018: 5.2% 5.68% 5.70% 5.72% 5.18% 5.20% 5.44% 4.76% 4.94% 4.98% 4.66% STI HBAN PNC BBT BAC CFG KEY MTB WFC FITB RF USB 5 Year Standard Deviation of Average CCAR Loss
Slide 23: Strong Credit Quality
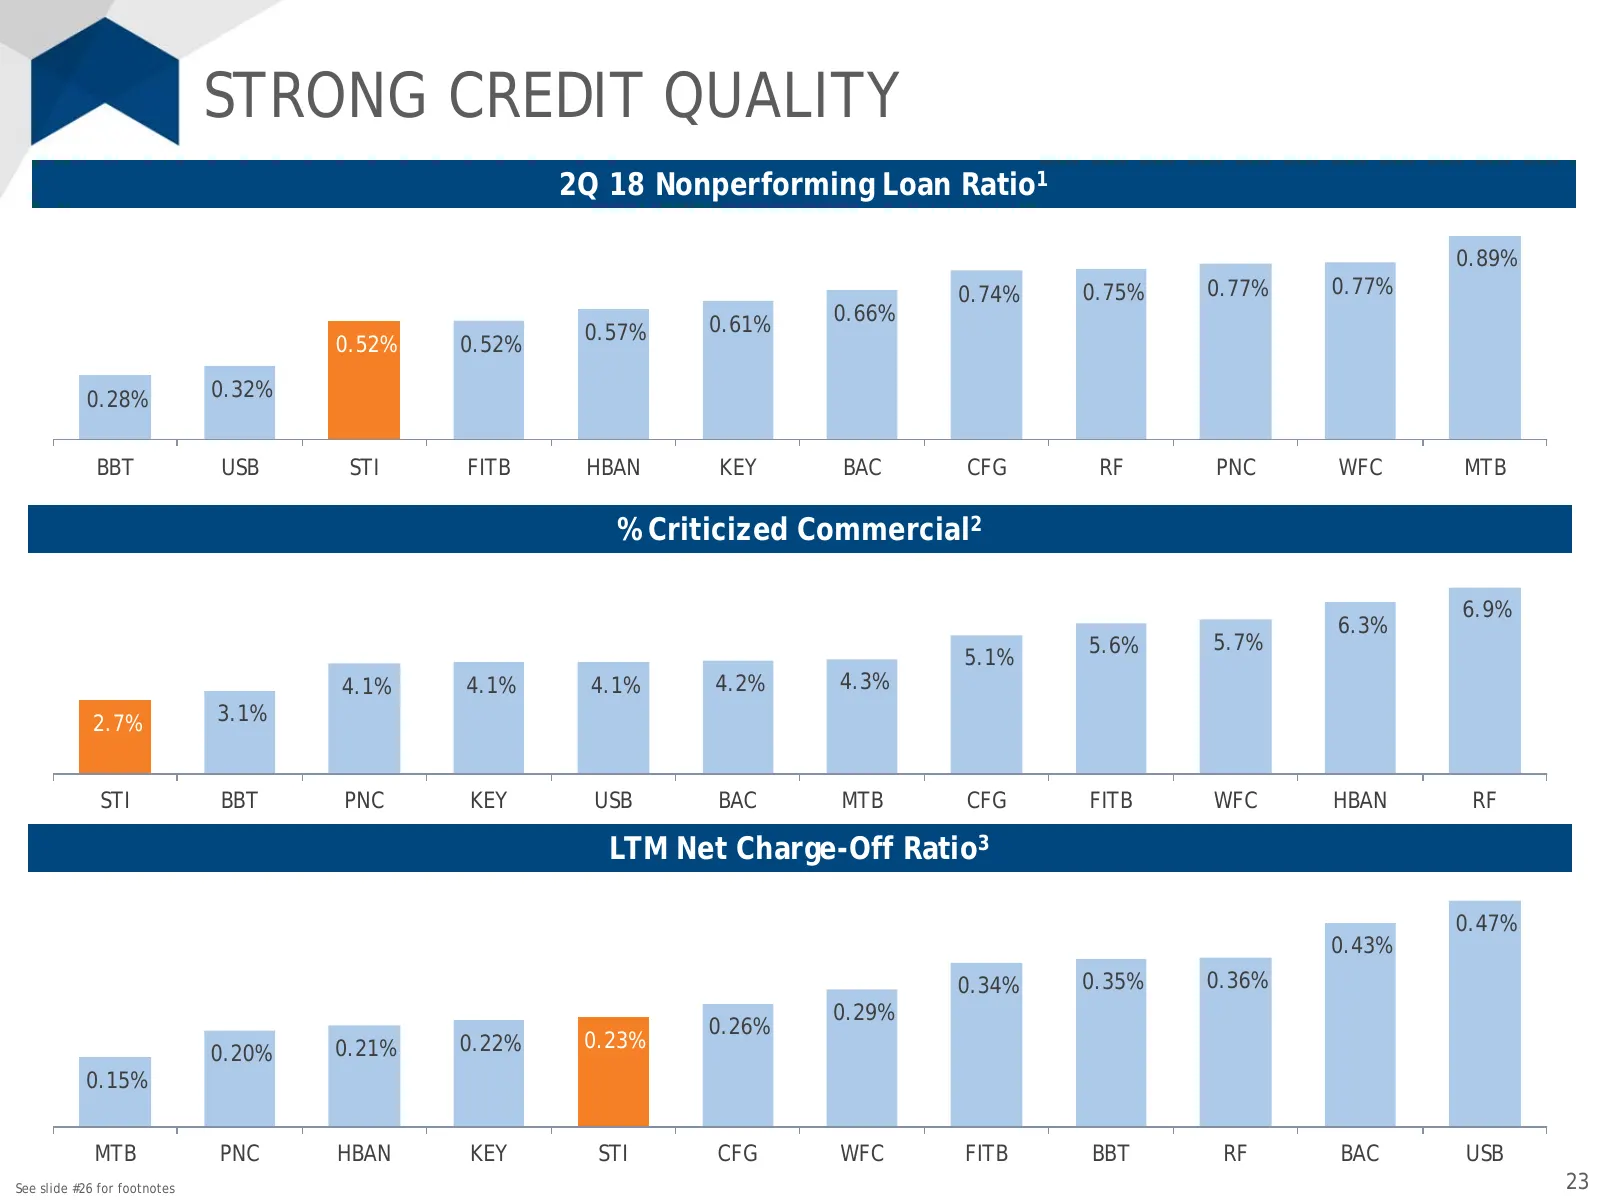
STRONG CREDIT QUALITY 2Q 18 Nonperforming Loan Ratio1 0.89% 0.74% 0.75% 0.77% 0.77% 0.61% 0.66% 0.57% 0.52% 0.52% 0.28% 0.32% BBT USB STI FITB HBAN KEY BAC CFG RF PNC WFC MTB % Criticized Commercial2 6.9% 6.3% 5.6% 5.7% 5.1% 4.1% 4.1% 4.1% 4.2% 4.3% 2.7% 3.1% STI BBT PNC KEY USB BAC MTB CFG FITB WFC
Slide 24: Reconciliation: Adjusted Efficiency Ratio (FTE) & Adjusted Tangible Efficiency Ratio (FTE)
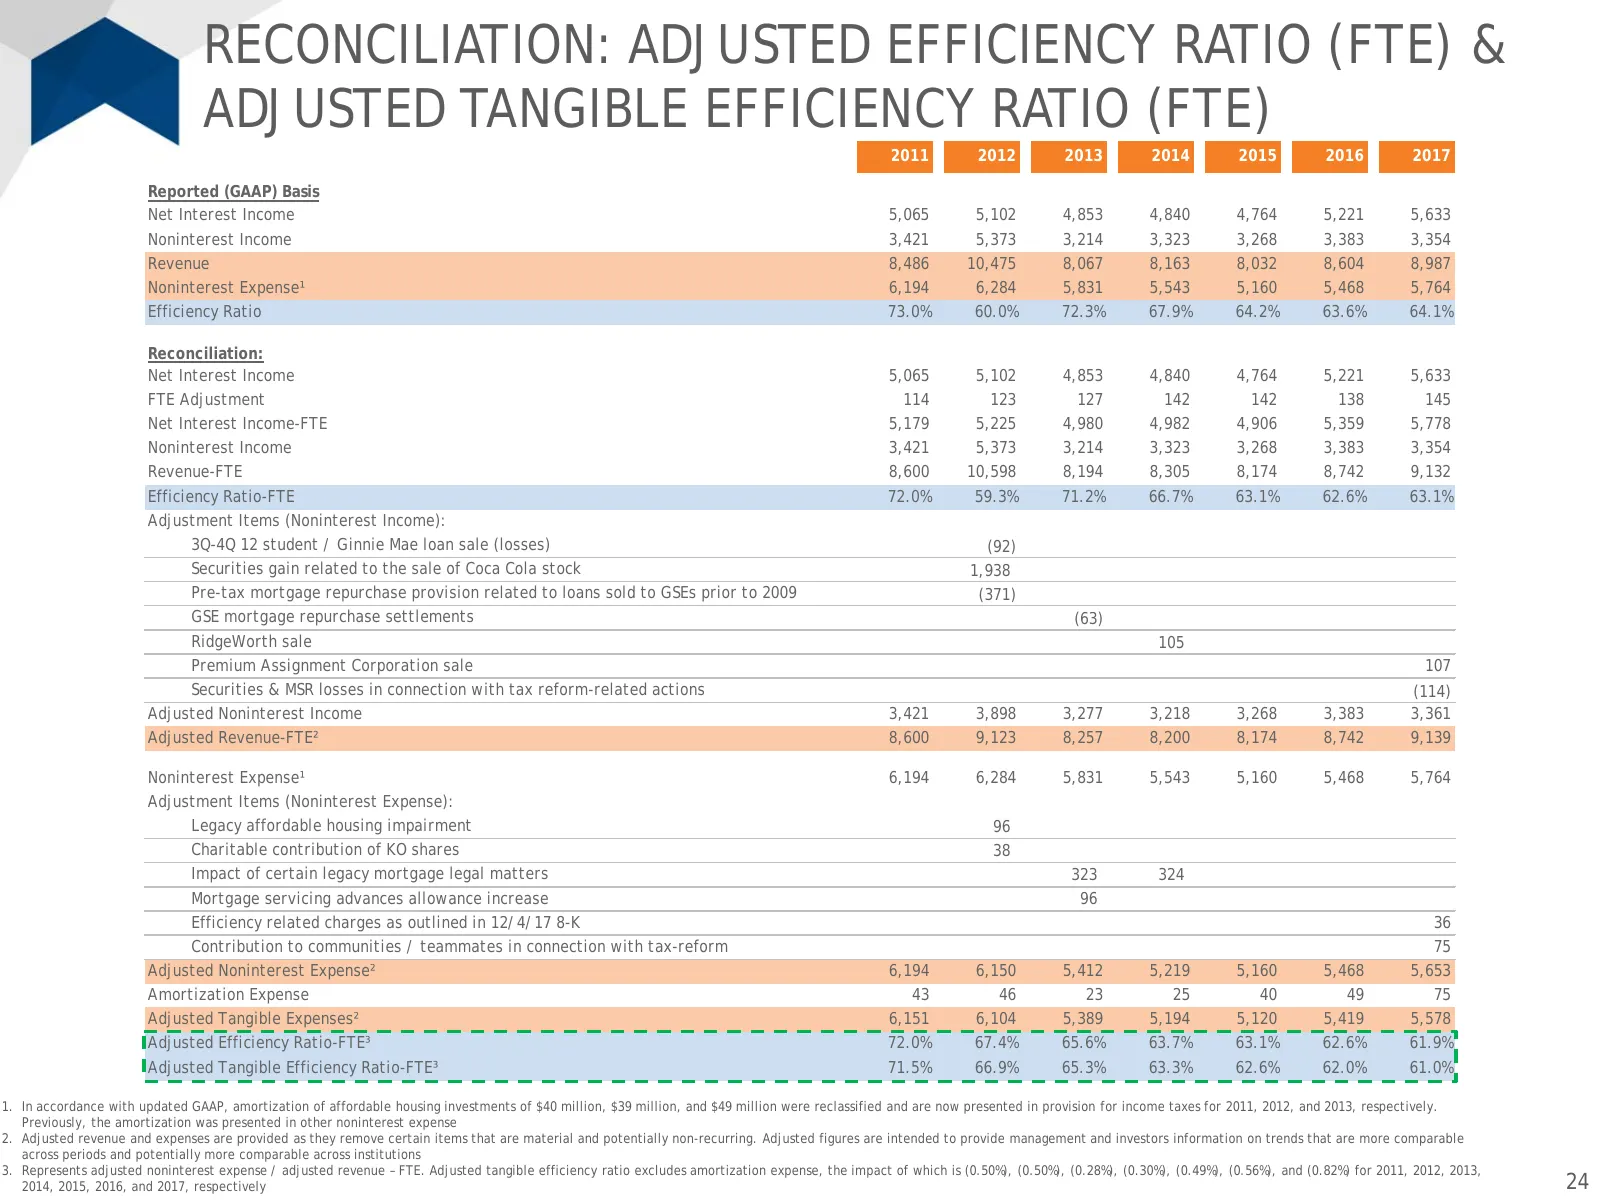
RECONCILIATION: ADJUSTED EFFICIENCY RATIO (FTE) & ADJUSTED TANGIBLE EFFICIENCY RATIO (FTE) 2011 2012 2013 2014 2015 2016 2017 Reported (GAAP) Basis Net Interest Income 5,065 5,102 4,853 4,840 4,764 5,221 5,633 Noninterest Income 3,421 5,373 3,214 3,323 3,268 3,383 3,354 Revenue 8,486 10,475 8,067 8,
Slide 25: Reconciliation of Earnings Per Share
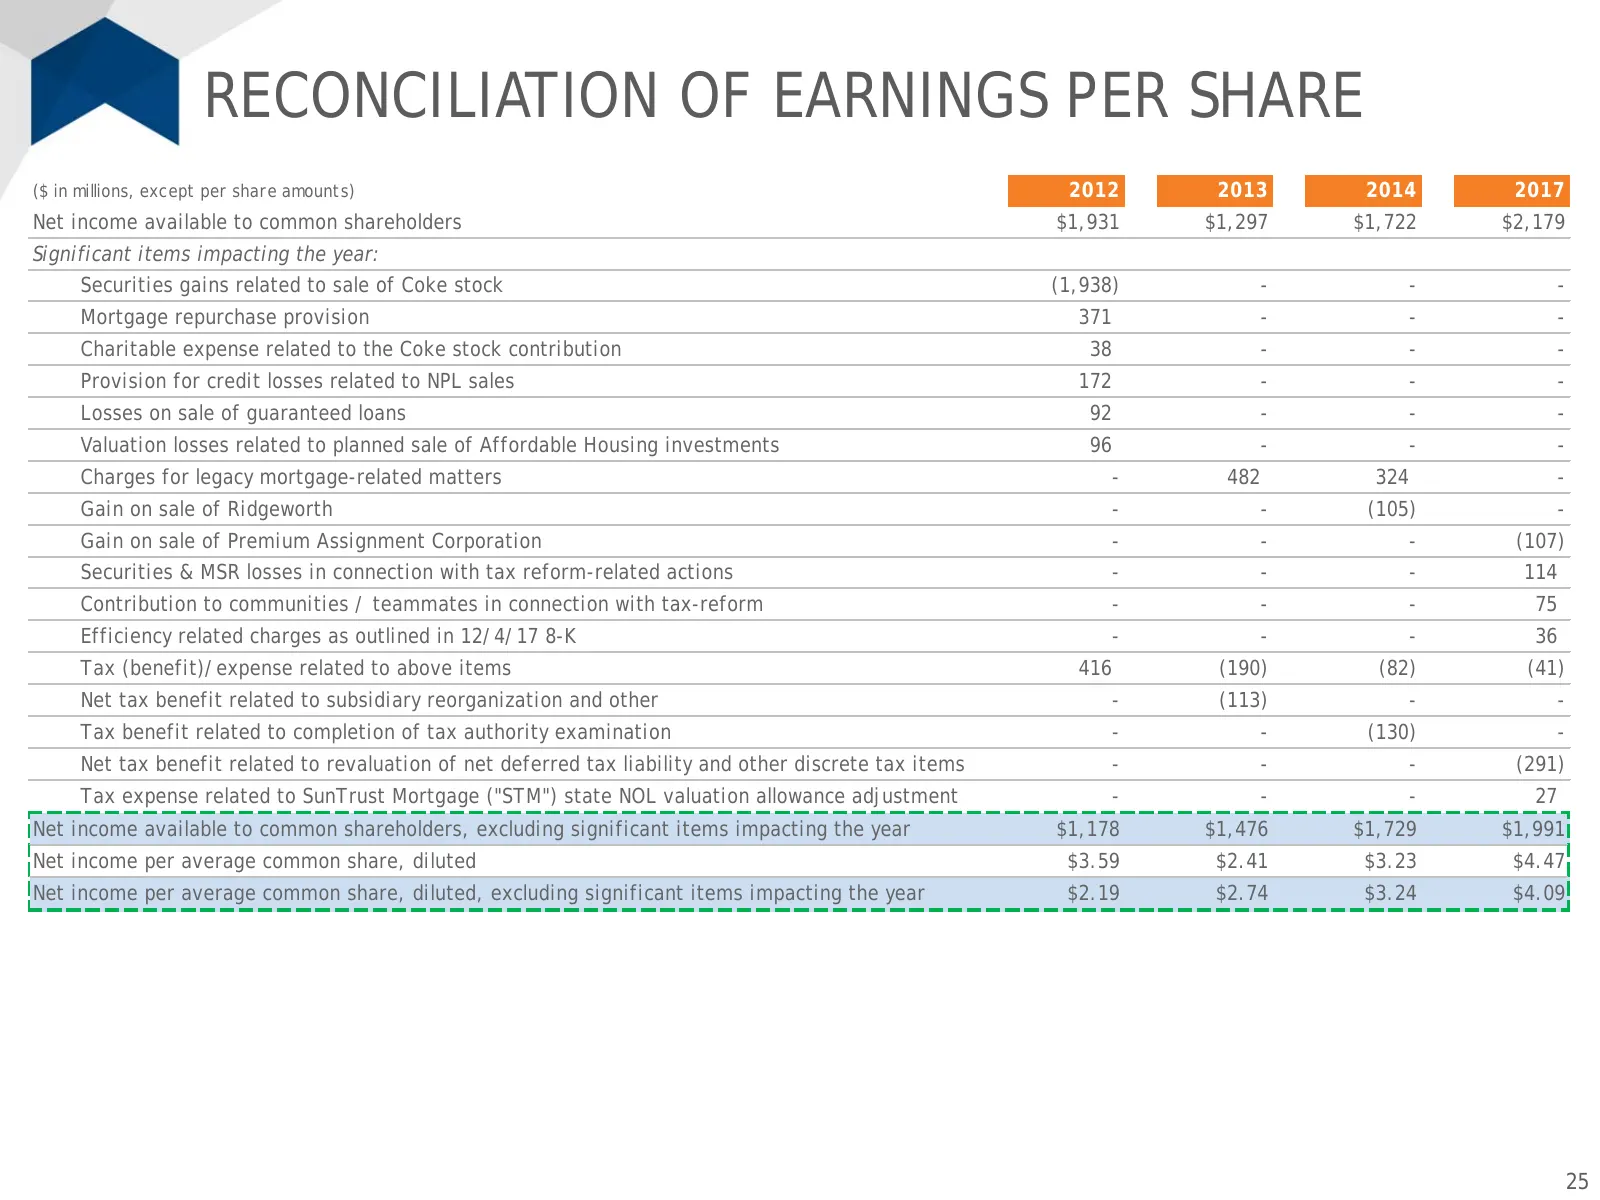
RECONCILIATION OF EARNINGS PER SHARE ($ in millions, except per share amounts) 2012 2013 2014 2017 Net income available to common shareholders $1,931 $1,297 $1,722 $2,179 Significant items impacting the year: Securities gains related to sale of Coke stock (1,938) - - - Mortgage repurchase provision
Slide 26: Footnotes
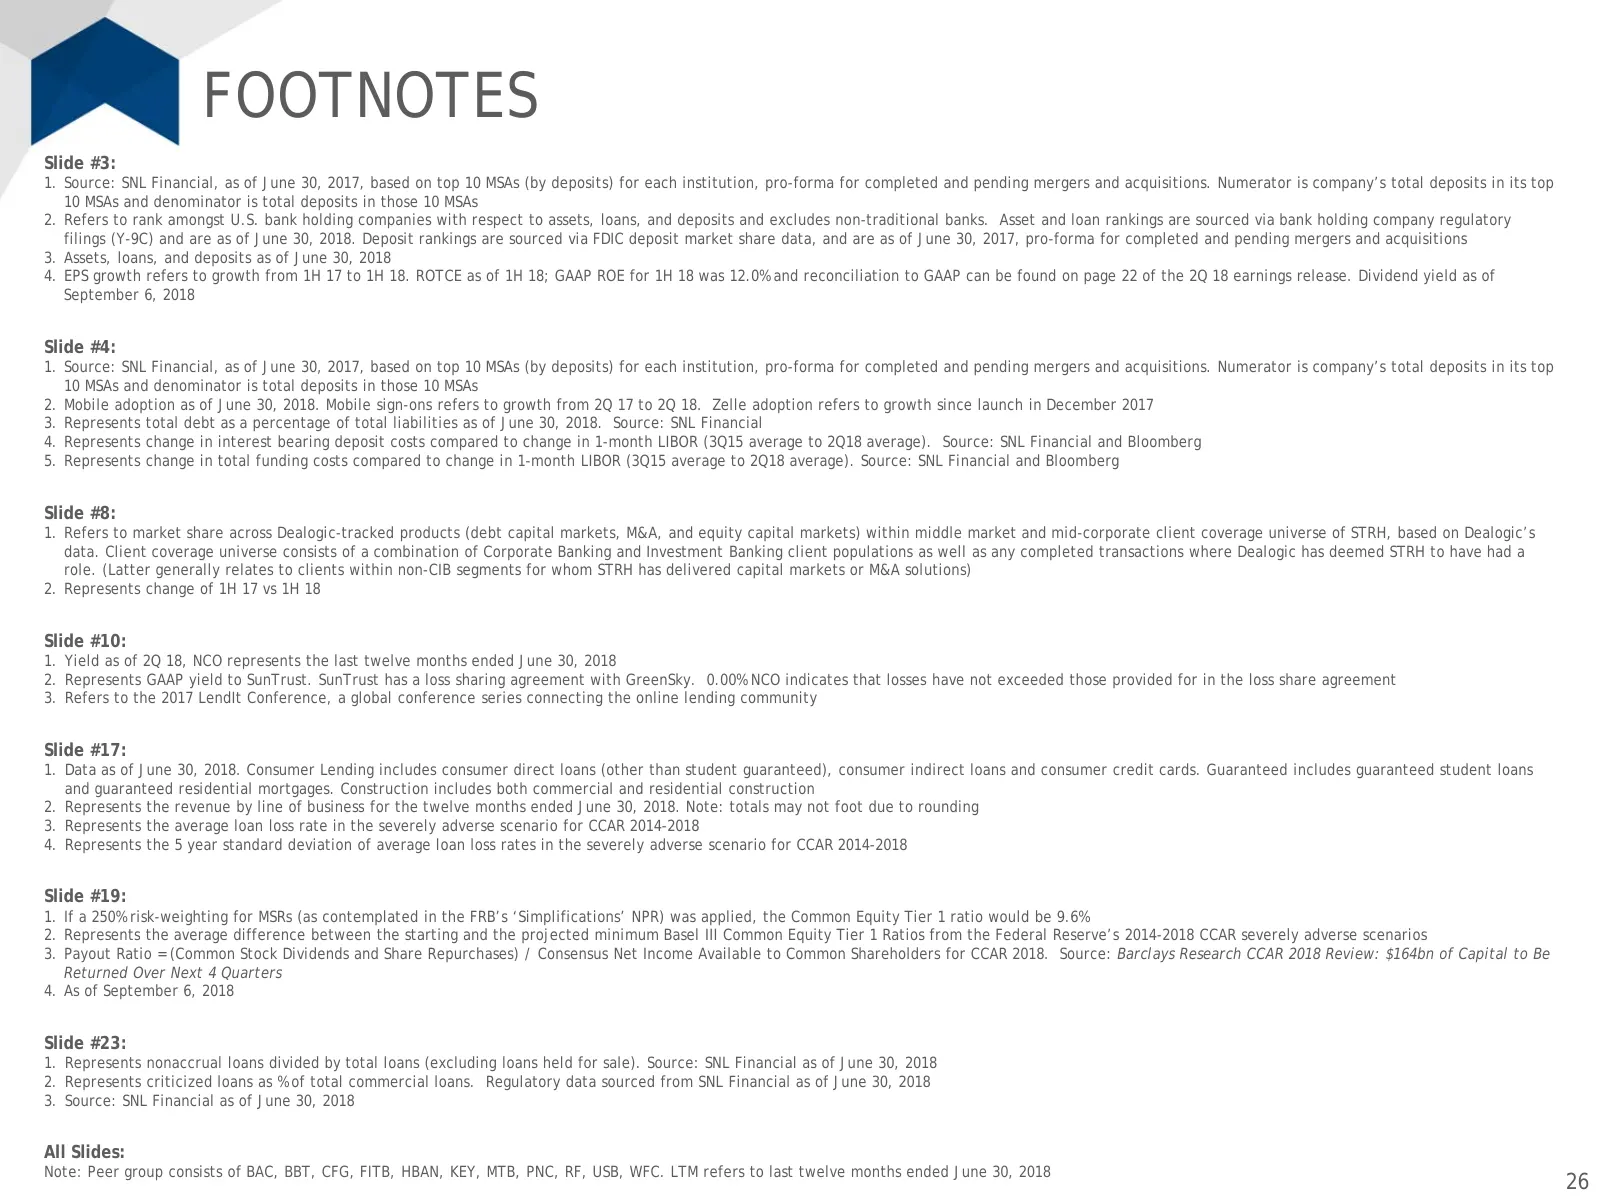
FOOTNOTES Slide #3: 1. Source: SNL Financial, as of June 30, 2017, based on top 10 MSAs (by deposits) for each institution, pro-forma for completed and pending mergers and acquisitions. Numerator is company’s total deposits in its top 10 MSAs and denominator is total deposits in those 10 MSAs 2. Ref
Source: SEC EDGAR · 8-K filed Sep 12, 2018
More decks from SunTrust Banks Inc
 Q3 2019 Earnings Presentation21 slides · Oct 17, 2019
 Q2 2019 Earnings Presentation22 slides · Jul 18, 2019
 Q1 2019 Earnings Presentation22 slides · Apr 18, 2019
 Merger or Acquisition (February 2019)38 slides · Feb 7, 2019
 Q4 2018 Earnings Presentation23 slides · Jan 18, 2019
 2018 Goldman Sachs US Financial Services Conference30 slides · Dec 4, 2018