Endeavour International — Corporate Update (February 2015)
23 slides from Endeavour International's corporate update, Feb 27, 2015

Slide 1: Year Plan 2015-2017 Update
Year Plan 2015-2017 Update February 12, 2015

Slide 2: Key Business Highlights – January 26, 2015 Update
Key Business Highlights – January 26, 2015 Update Production Q4 2014 physical production 12,100 boe/d, up 25% over 9,700 boe/d in Q3 2014. 2014 annual production 11,000 boe/d represents an 11% increase from 9,900 boe/d in 2013. Cash Received $12.7 million for a portion of Alba insurance proceeds in

Slide 3: U.K. Operations – January 26 Update
U.K. Operations – January 26, Update Rochelle Gas production capacity at Scott platform of over 100 mmcf/d gross has been available for Rochelle since May 2014. Consistently producing at above 100 mmcf/d gas gross with over 4,000 bbl/d gross associated liquids. Reliability studies ongoing to further

Slide 4: U.S. Operations – January 26 Update
U.S. Operations – January 26, Update Marcellus 5 producing wells with 4 horizontal wells waiting on tie-in. 2 recently completed horizontals IP 4.5-6.5 mmcf/d gross. 10 mmcf/d gross take-away capacity on the EQT line recently tied in to Daniel Gathering System. Liquids-rich, Niobrara/Frontier plays
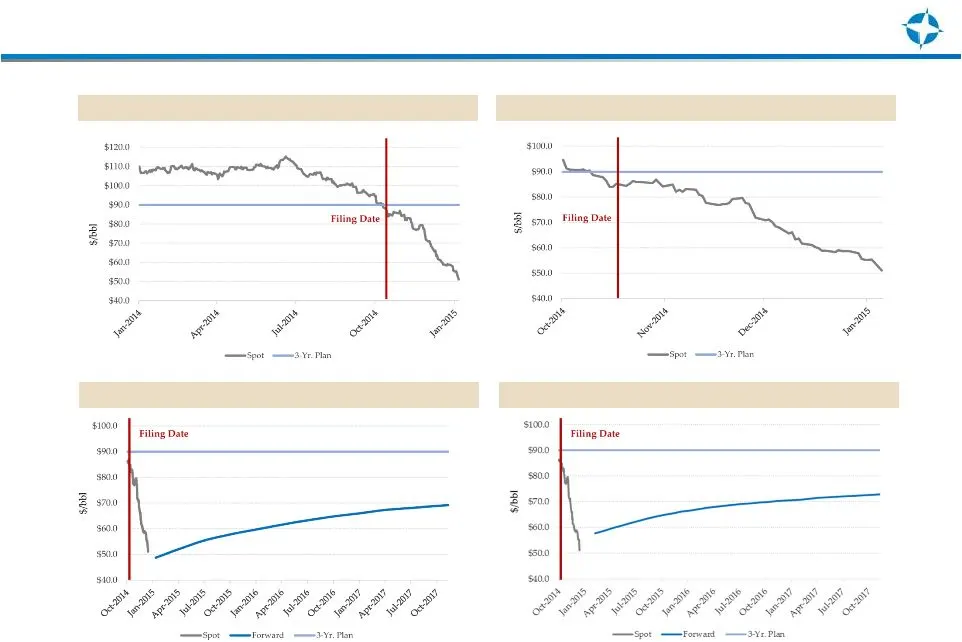
Slide 5: UK Commodity Prices – Oil
UK COMMODITY PRICES - OIL ONE YEAR: BRENT POST PETITION: BRENT BRENT SPOT AND FORWARD CURVE AS OF 1/14/2015 BRENT SPOT AND FORWARD CURVE AS OF 2/6/2015
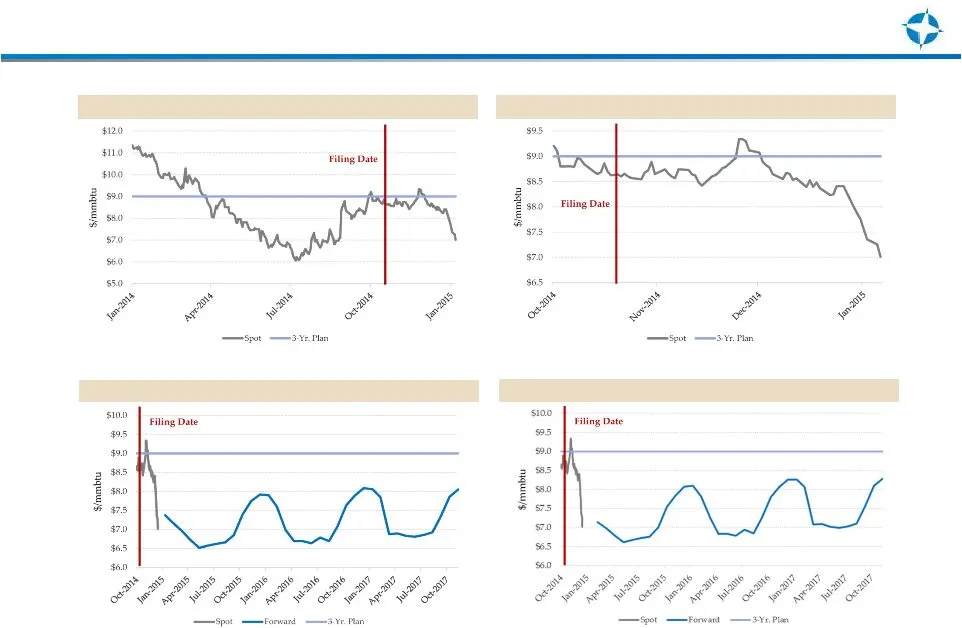
Slide 6: UK Commodity Prices – Gas
UK COMMODITY PRICES - GAS ONE YEAR: NORTH SEA NAT GAS POST PETITION: NORTH SEA NAT GAS NORTH SEA NAT GAS SPOT/FORWARD CURVE AS OF 1/14/2015 NORTH SEA NAT GAS SPOT/FORWARD CURVE AS OF 2/6/2015
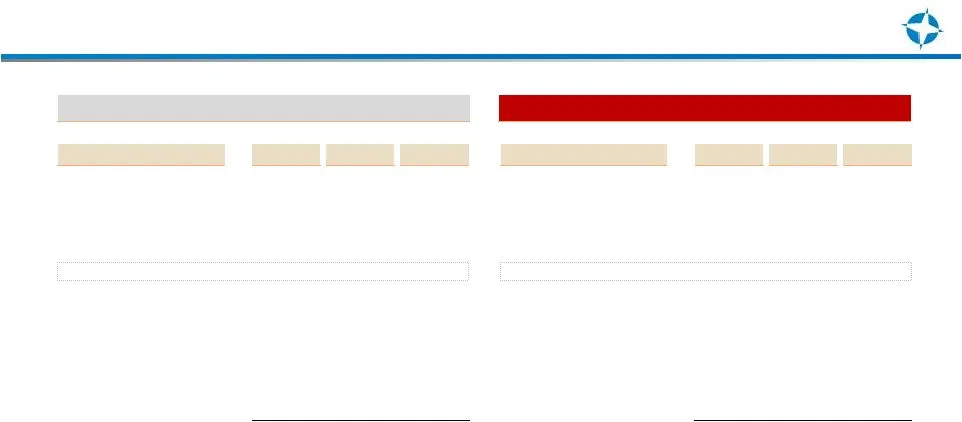
Slide 7: Update (Pricing as of 1/14/15): Base Case Global Free Cash Flow Comparison
UPDATE (PRICING AS OF 1/14/15) BASE CASE: GLOBAL FREE CASH FLOW COMPARISON 3 YEAR PLAN IN DISCLOSURE STATEMENT UK Average Price Deck Oil ($/bbl) 54.68 $ 62.49 $ 67.65 $ Gas ($/mcf) 7.01 $ 7.20 $ 8.08 $ US Average Price Deck Oil ($/bbl) 52.16 $ 58.34 $ 63.11 $ Gas ($/mcf) 3.20 $ 3.48 $ 3.66 $ UK Pric
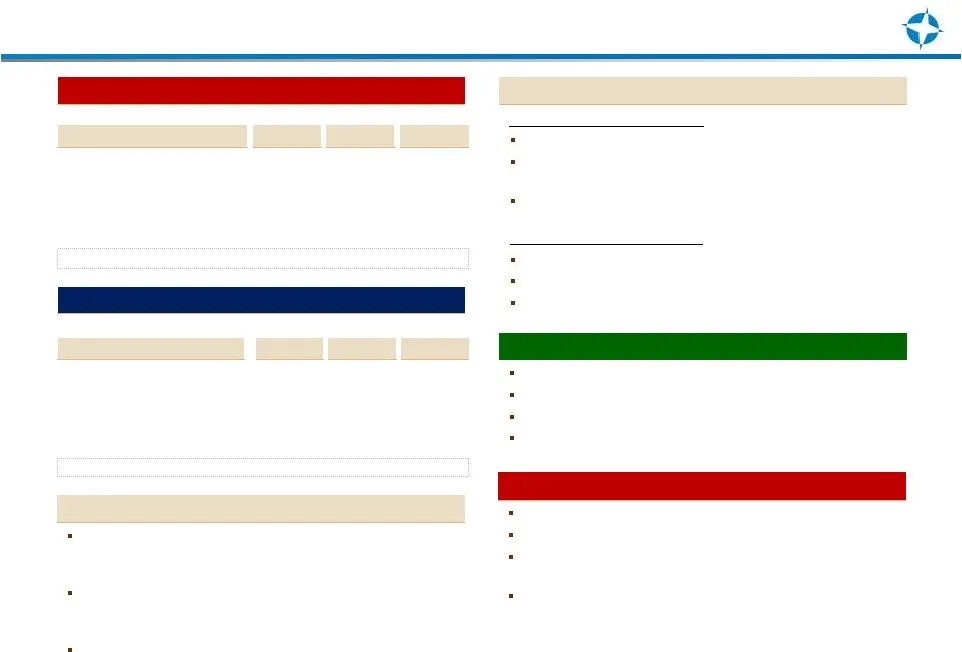
Slide 8: Upside Downside, UK Plan, US Plan (Pricing as of 1/14/15)
UPSIDE DOWNSIDE UK PLAN (PRICING AS OF 1/14/15) US PLAN (PRICING AS OF 1/14/15) FORECAST ASSUMPTIONS Changes in commodity prices. Improvement to operational efficiency ratio. Operating costs soften. Purchases of reserves in place – at historically strong metrics. Changes in commodity prices. Erosion
Slide 9: Update (Pricing as of 1/14/15) (UK) Base Case UK Free Cash Flow
UPDATE (PRICING AS OF 1/14/15) (UK) BASE CASE: UK FREE CASH FLOW 3 YEAR PLAN IN DISCLOSURE STATEMENT (UK) ($ in thousands) EBITDA 94,231 $ 95,353 $ 130,926 $ Less: PRT 3,232 7,102 1,792 Less: Capex (40,921) (52,555) (48,798) Less: Abandonment (32,000) (36,800) - Plus: Property Insurance Proceeds 7,0
Slide 10: Global EBITDA Reconciliations and Quarterly Statistics
UPDATE PLAN (USING PRICING AS OF 1/14/15) (GLOBAL) QUARTERLY STATISTICS (USING PRICING AS OF 1/14/15) (GLOBAL) GLOBAL EBITDA RECONCILIATIONS 3 YEAR PLAN IN DISCLOSURE STATEMENT (GLOBAL) ($ in thousands) Net income (loss) (157,817) $ (111,705) $ (104,208) $ Depreciation, depletion and amortization 18
Slide 11: EBITDA Reconciliations (UK and US)
UPDATE PLAN (USING PRICING AS OF 1/14/15) (UK) UPDATE PLAN (USING PRICING AS OF 1/14/15) (US) EBITDA RECONCILIATIONS 3 YEAR PLAN IN DISCLOSURE STATEMENT (UK) 3 YEAR PLAN IN DISCLOSURE STATEMENT (US) ($ in thousands) Net income (loss) (44,713) $ (42,556) $ (55,144) $ Depreciation, depletion and amort
Slide 12: Global, UK and US Update (Pricing as of 2/06/15)
GLOBAL UPDATE (PRICING AS OF 2/06/15)¹ UPDATE UK (PRICING AS OF 2/06/15)¹ UPDATE US (PRICING AS OF 2/06/15) 1 2/6/2015 UPDATE UK Average Price Deck Oil ($/bbl) 59.76 $ 68.40 $ 71.72 $ Gas ($/mcf) 7.03 $ 7.38 $ 7.57 $ US Average Price Deck Oil ($/bbl) 54.74 $ 62.48 $ 64.88 $ Gas ($/mcf) 2.79 $ 3.21 $
Slide 13: Reconciliation Update (Pricing as of 2/06/15)
RECONCILIATION UPDATE (USING PRICING AS OF 2/06/15) (GLOBAL) 1 RECONCILIATION UPDATE PLAN (USING PRICING AS OF 2/06/15) (UK) 1 RECONCILIATION UPDATE PLAN (USING PRICING AS OF 2/06/15) (UK) 1 QUARTERLY STATISTICS (USING PRICING AS OF 2/06/15) (GLOBAL) 1 2/6/2015 PRICING UPDATE CONTINUED 1) Forecast a
Slide 14
Slide 15: Mabry Exploration Overview
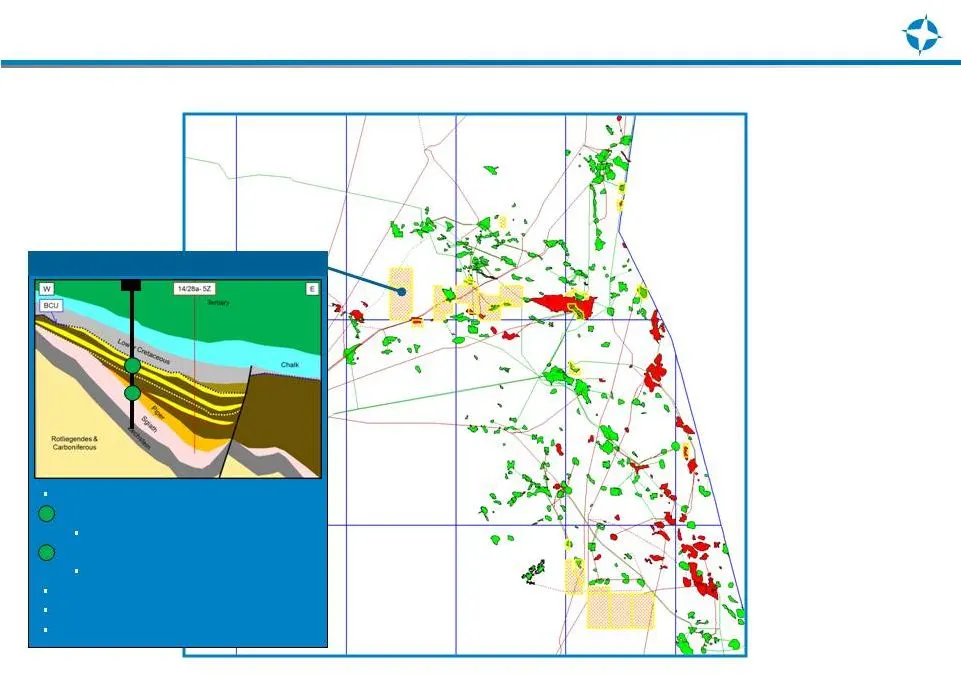
14/28 Mabry Upper 2016 Well as Per 3yr Business Plan Primary Target: Jurassic Piper Sandstone Mean Reserves 125 mmboe / Pg 29% Secondary Target: Jurassic Dirk Sandstone Mean Reserves 192mmboe / Pg 8% Single well to hit both targets NPV 15 $209mm (Dec 2014) EEUK 50% Equity 1 2 2 1 Expl MABRY EXPLORAT
Slide 16: Mabry 2016 Well per 3yr Business Plan
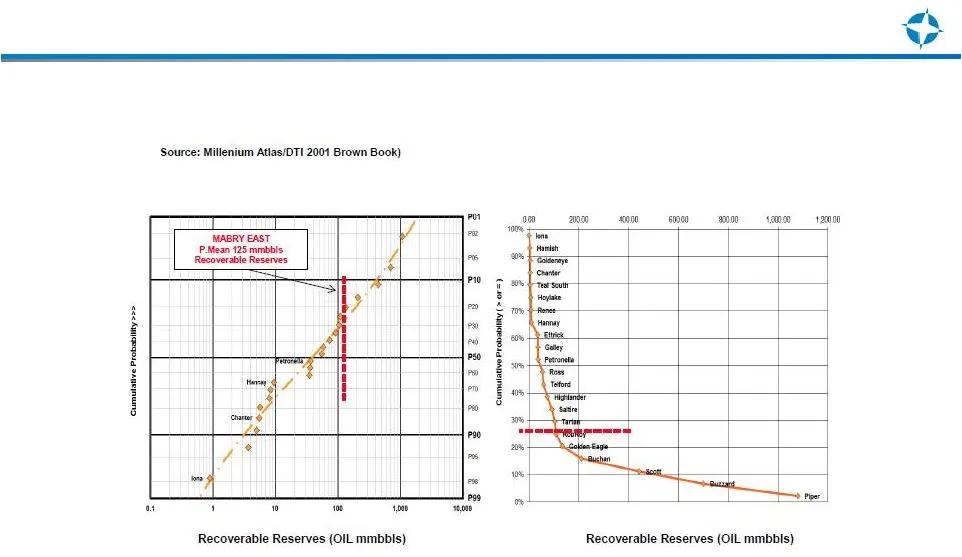
2016 Well as Per 3yr Business Plan Primary Target: Jurassic Piper Sandstone Mean Reserves 125 mmboe / Pg 29% Secondary Target: Jurassic Dirk Sandstone Mean Reserves 192mmboe / Pg 8% Single well to hit both targets NPV 15 $209mm (Dec 2014) EEUK 50% Equity Inner/Outer Moray Firth Upper Jurassic Field
Slide 17: Columbus Field Overview
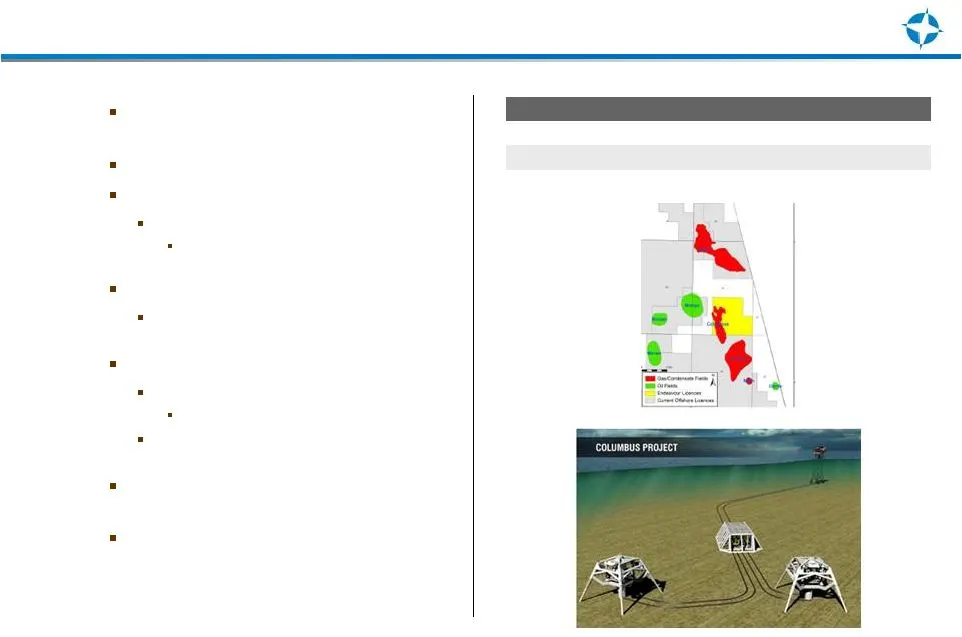
Company (1) Equity Columbus Field Overview Serica (Operator) 50% Endeavour 25% EOG 25% Blocks 23/16f & 23/21, 275ft water depth Discovered 2006 Palaeocene reservoir at ~9,800ft SS Stratigraphic trap in submarine fan 50% NTG / ~19% porosity / ~1 to 50mD permeability GIIP ~170 Bcf Gas condensate with
Slide 18: US Portfolio Details
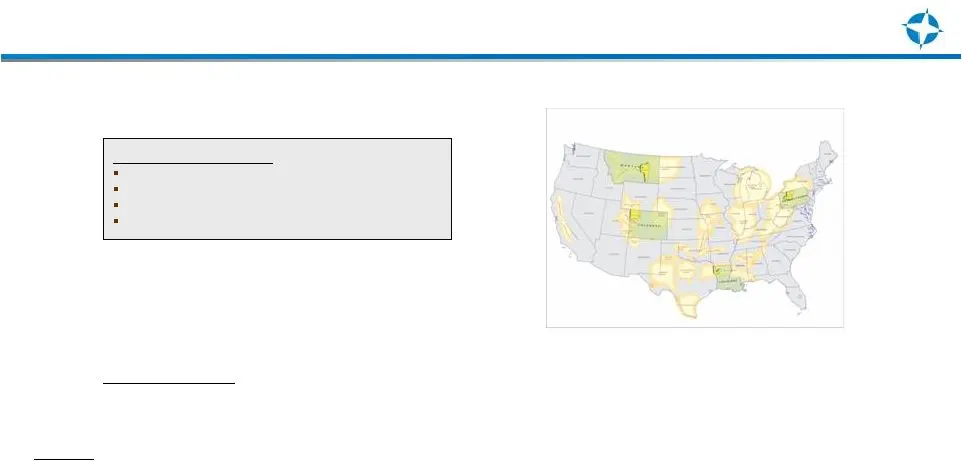
US Portfolio Details Active Projects Haynesville Marcellus Heath Colorado Totals WI (%) Fluid type dry gas dry gas oil mixed Impact Gross/Net Acres (1,000's) 7.2/3.3 46/31* Gross Unrisked Locations 70-100 130-180 150-300 150-200+ 500-800+ Net Unrisked Resource (BCFe) 70-100 250-350 25-50 450-1000+ 8
Slide 19: Endeavour – NW Colorado Piceance Basin Rim Play
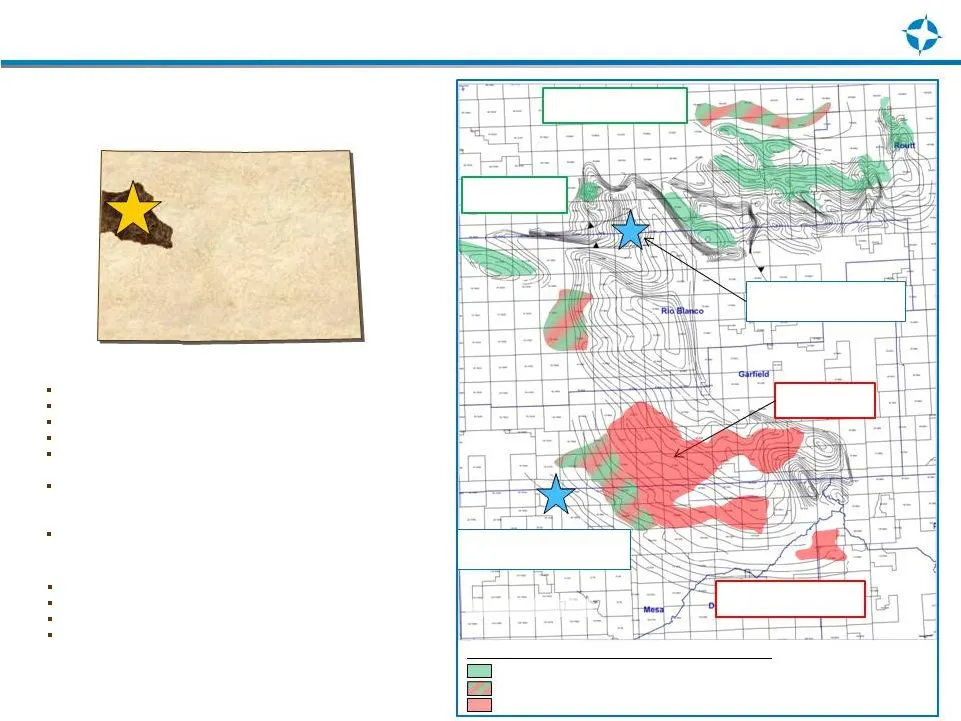
Endeavour - NW Colorado Piceance Basin Rim Play Buck Peak Niobrara trend 20-30 mmbo Encana’s Orchard Niobrara gas development WPX 12mmcf/d Niobrara well Rangely Niobrara 15 mmbo NBRR Petroleum System: Proven HC productive areas Oil window Wet gas window Dry gas window Wiley Prospect Hz well complete
Slide 20: Marcellus Assets – Cameron County, PA
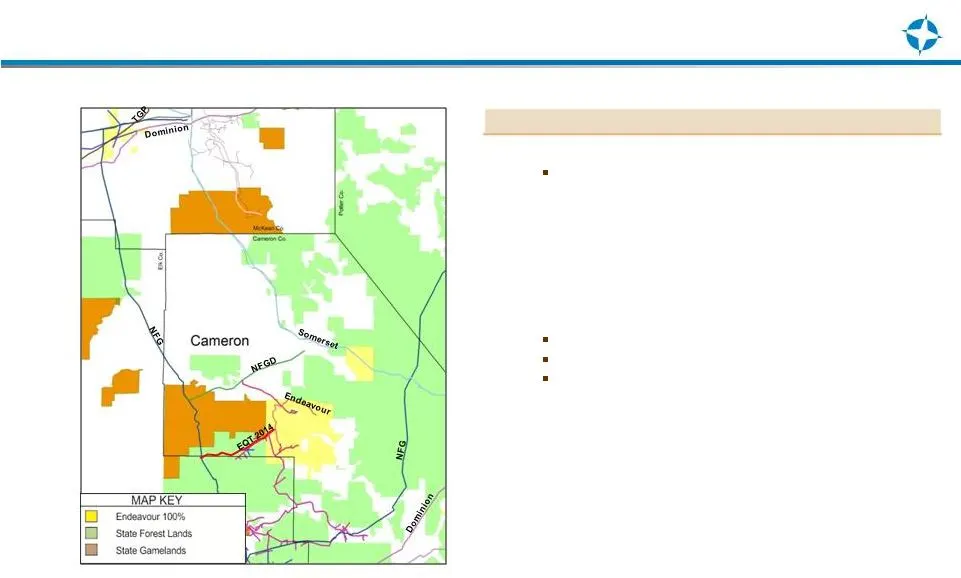
26,200 net JV acres (majority HBP) 50/50 Samson JV 500-700+ BCFE net JV Marcellus potential 1 TCF potential with adjacent State Lands included 1+ TCF additional potential in Utica Shale 10 MMCFD take-away capacity on EQT line; first production expected in Feb 2015 4 new horizontal wells coming on-li
Slide 21: Utica Shale Point Pleasant Target
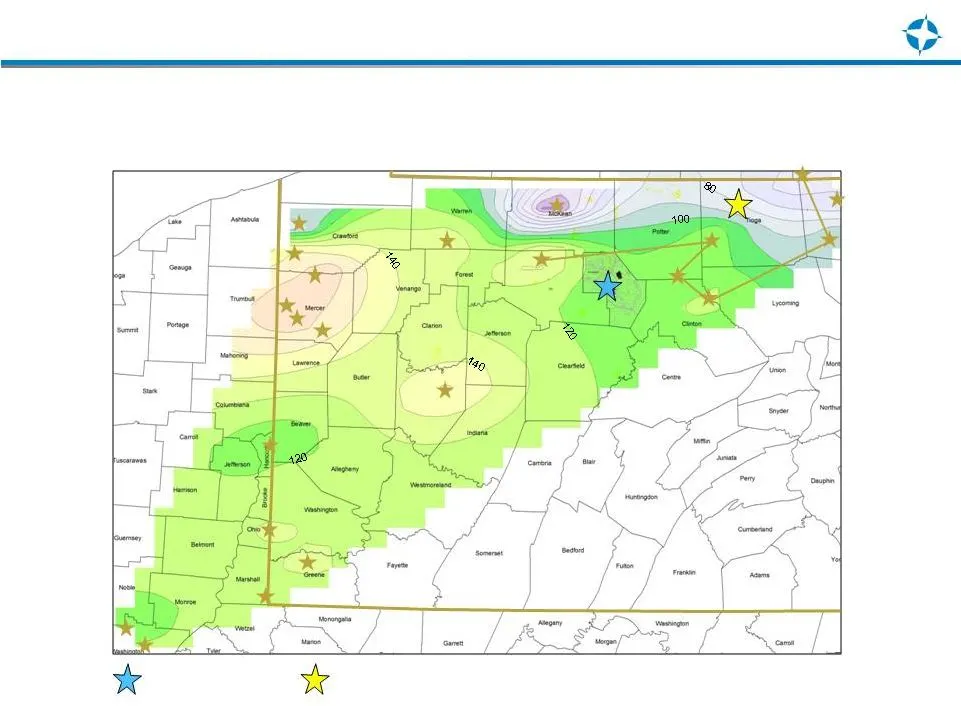
Target: Utica Shale where Point Pleasant is present – various facies, generally porous and brittle Point Pleasant 100’ – 140’ thick across western PA, thins toward southern NY Shell announced two Utica discoveries in Tioga Co. – 11.2mmcf/d and 26.5mmcf/d END Shell (Isopach Point Pleasant, c.i. = 10’
Slide 22: Industry Activity in END Play Area
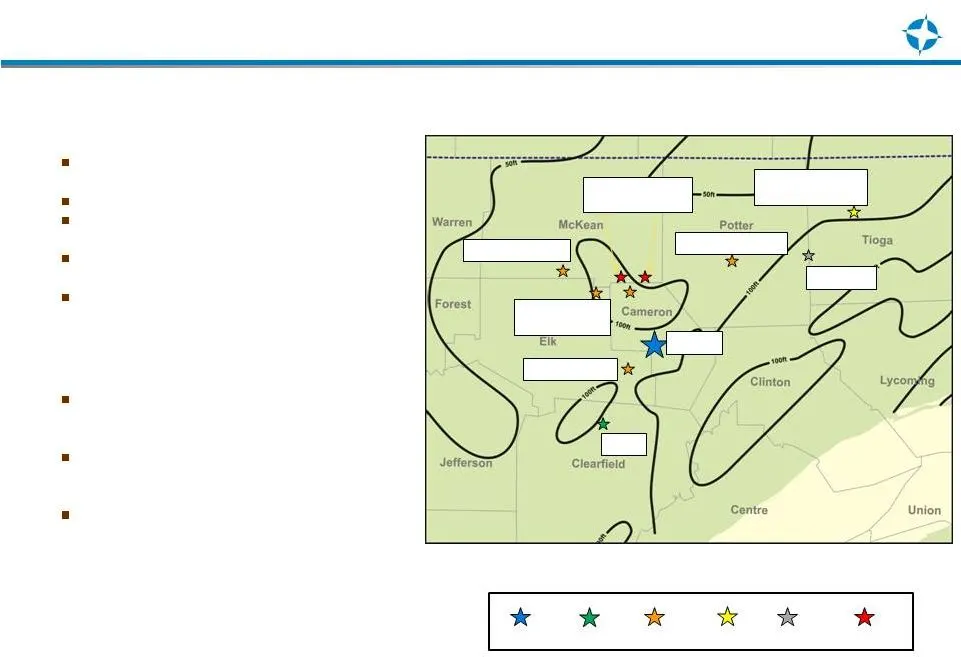
Industry Activity in END Play Area END EOG Seneca Shell Ultra PGE/Exxon Reported Marcellus EURs 4 – 8+ Bcf Seneca – Cameron County Reported 7.8 mmcf/d, 7 Bcf EUR EUR range 4.5 – 8.6 Bcf Ultra – Potter & Tioga Counties 5 Bcf EURs EOG/Seneca – Northern Clearfield Co. Recent IP’s 7 - 9+ mmcf/d PGE/Exxo
Slide 23: TROL,
aa sa TROL,
Source: SEC EDGAR · 8-K filed Feb 27, 2015
More decks from Endeavour International Corp
 Presentation (May 2015)5 slides · May 7, 2015
 Debt Investor Presentation (October 2014)16 slides · Oct 14, 2014
 Q2 2014 Earnings Presentation12 slides · Aug 5, 2014
 Proxy Contest (May 2014)45 slides · May 8, 2014
 Q1 2014 Earnings Presentation12 slides · May 7, 2014
 Howard Weil Energy Conference 201424 slides · Mar 26, 2014