Endeavour International — Howard Weil Energy Conference 2014
24 slides from Endeavour International's conference presentation, Mar 26, 2014
Slide 1: Howard Weil Energy Conference
Howard Weil Energy Conference March 27, 2014 Exhibit 99.1
Slide 2: Endeavour at a Glance
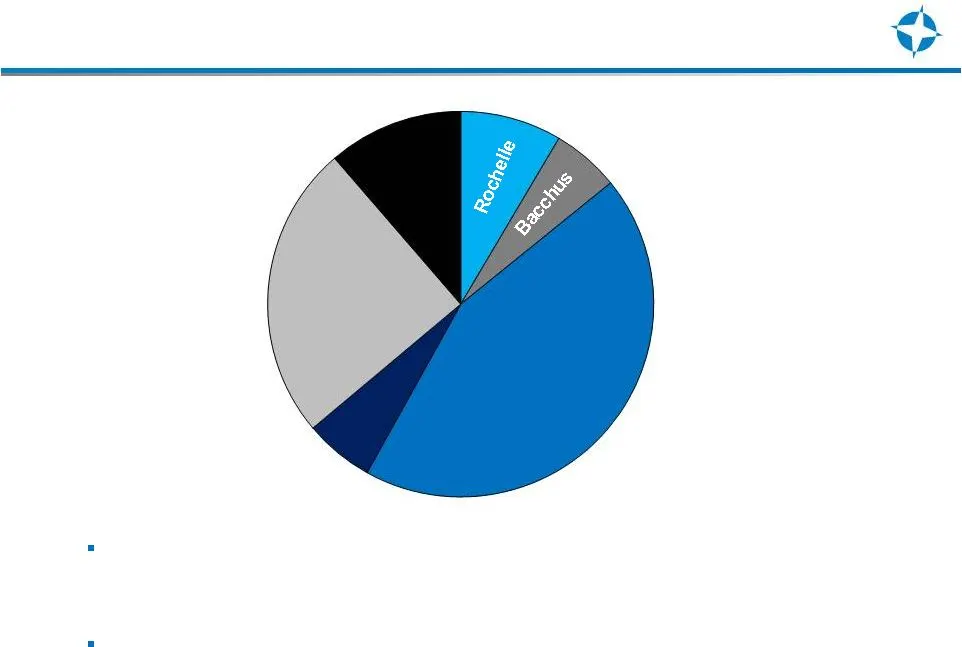
Key Figures Endeavour at a Glance Distinctive Portfolio • Exceptional operating margins from three core assets • Brent crude oil and European natural gas exposure • Developing U.S. resource plays at very low cost Strong Production Growth • All three U.K. developments on-line • Rochelle – Gas with as
Slide 3: Endeavour's Growing Resource Base
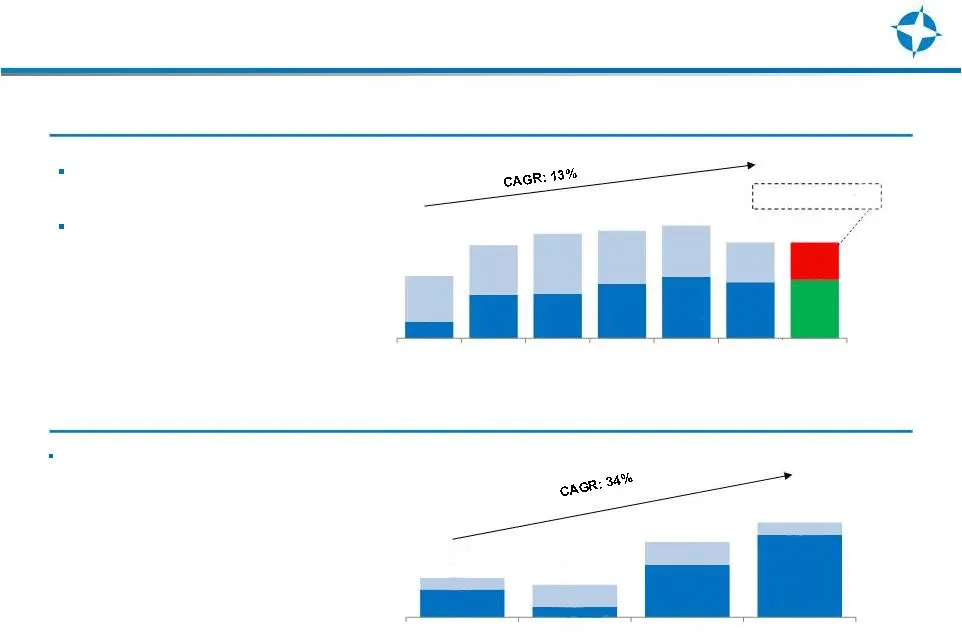
2.9 1.1 5.5 8.6 6.8 18.2 18.7 22.7 25.7 23.5 61% Oil Endeavour’s Growing Resource Base Asset base has become increasingly more oil levered 87% of proved and probable (2P) gas reserves are in the U.K. Reserve growth Production growth Production has grown over time with significant contribution increa
Slide 4: Production Sold Into Higher-Valued European Markets
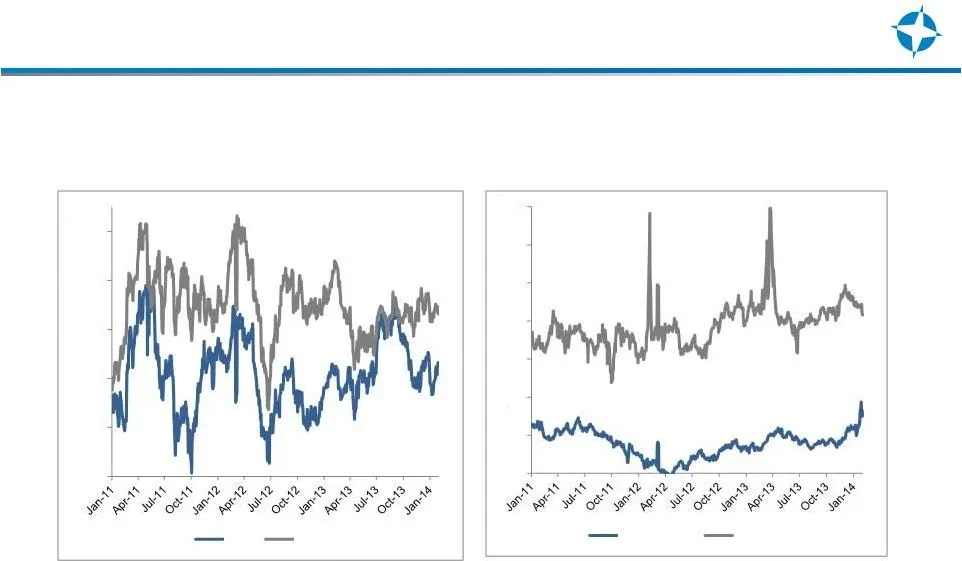
Production Sold Into Higher-Valued European Markets Crude oil Natural gas Average spread over the period: $6.21 Average spread over the period: $14.34 $2 $4 $6 $8 $10 $12 $14 $16 Henry Hub UK NBP $75 $85 $95 $105 $115 $125 WTI Brent
Slide 5: Reserve Valuation
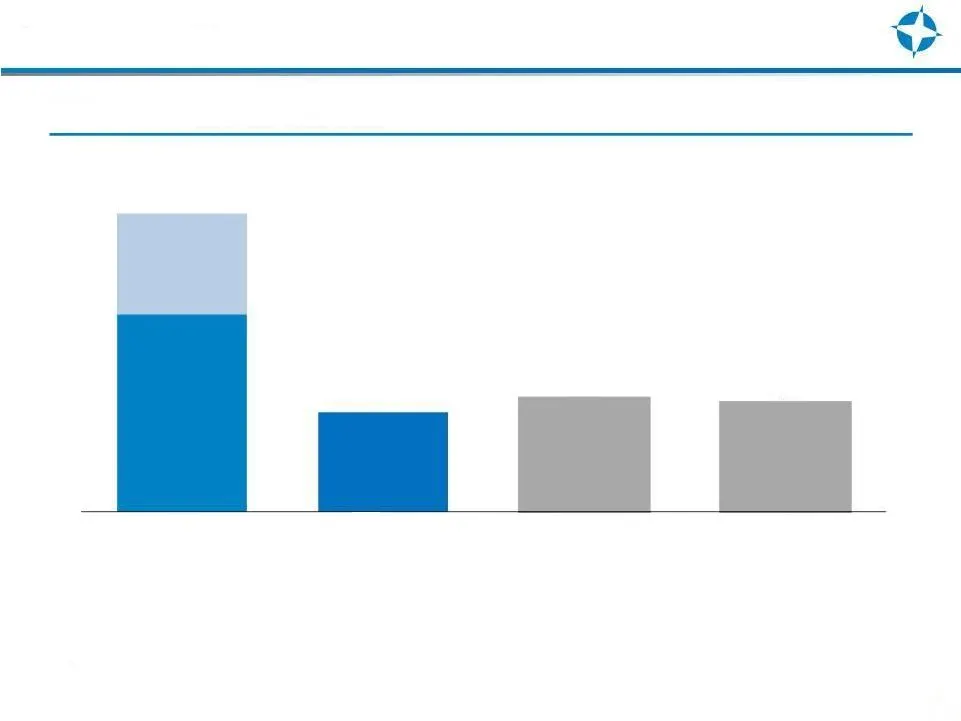
Reserve Valuation Pro forma net asset valuation (1) Excluding monetary production payment of $162 million. ($ in millions) $1,531 $773 $883 (1) $848 (1) 2P and 3P PV-10 1P PV-10 Total debt Net debt $2,309 (as of 12/31/13)
Slide 6: Production volume up 27% year-over-year
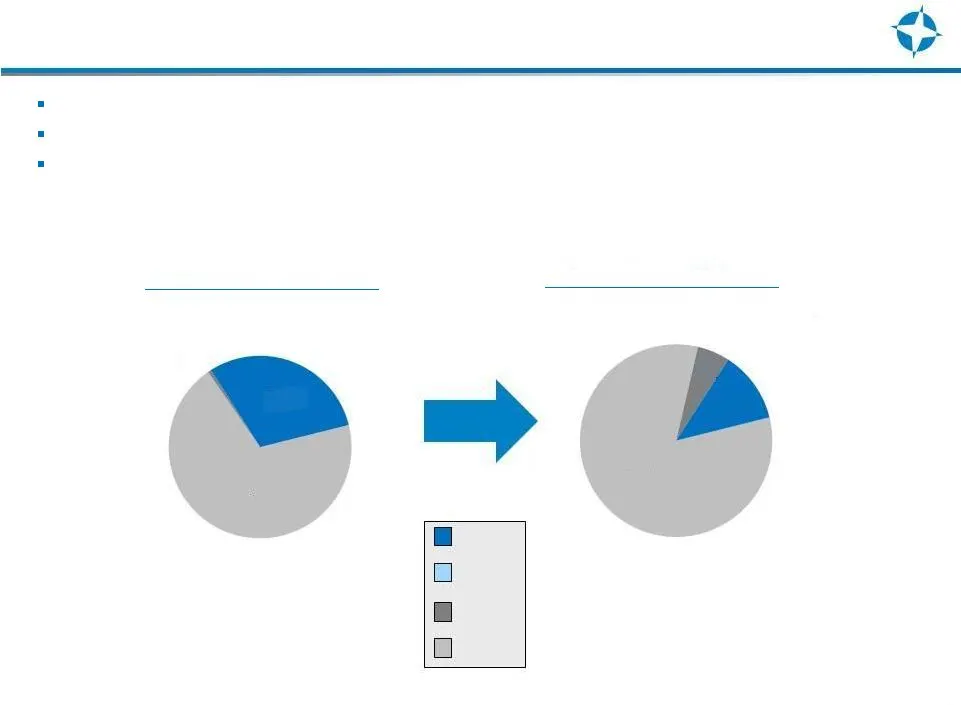
Production volume up 27% year-over-year Increasing production in higher valued commodity markets Brent and U.K. NBP prices have averaged ~$108.46 and ~$10.63, respectively for 2013 $$$$ Significant Proved Reserves and Production Production Volumes Production Volumes Full Year = 7,868 Full Year = 10,
Slide 7: Historical Financials Summary
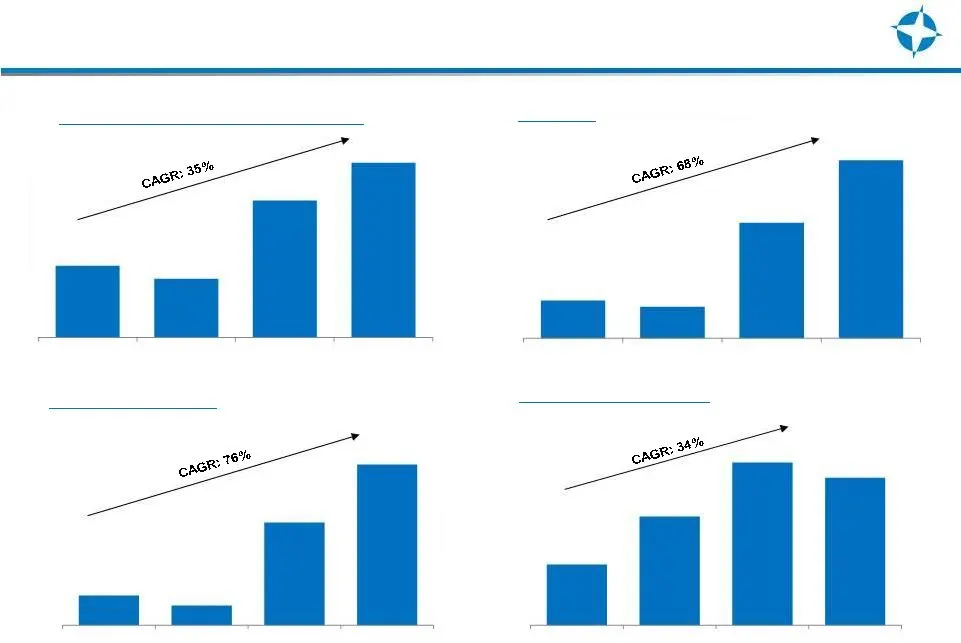
Historical Financials Summary ($ in millions) ($ in millions) ($ in millions) Average Daily Production (boepd) Revenue Adjusted EBITDAX Capital Expenditures $37.6 $25.1 $129.9 $203.3 4,115 3,382 7,868 10,017 $71.7 $60.1 $219.1 $337.7 $92.0 $165.1 $246.9 $223.7
Slide 8: Attractive Margins and Expense Structure
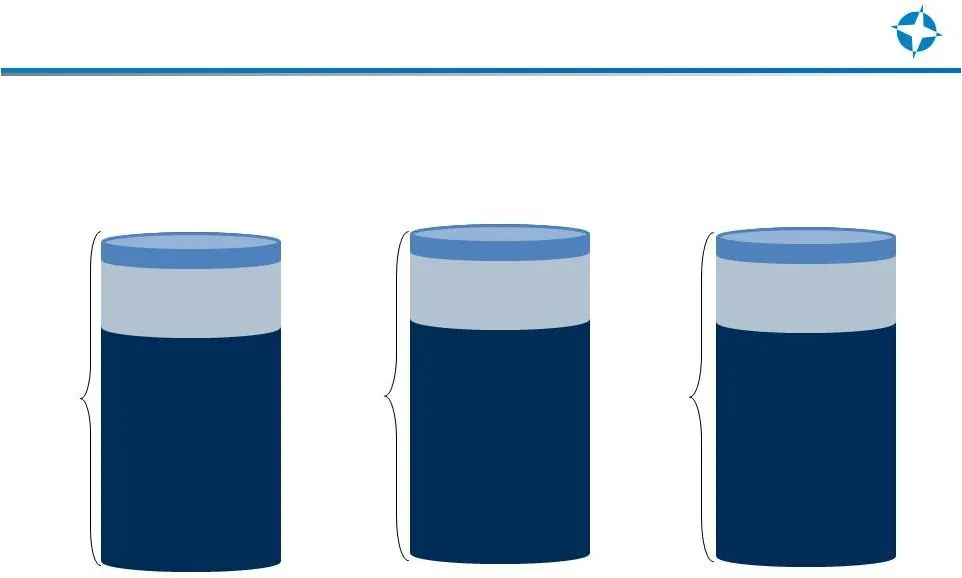
9 Cash Operating Expense Operating Cash Flow $9.00 $97.00 Cash Operating Expense Operating Cash Flow Cash Operating Expense Operating Cash Flow $20.00 $86.00 $1.50 $9.50 Attractive Margins and Expense Structure $106.00 NBP Spot $106.00 Note : Cash operating expense is midpoint of management estimate
Slide 9: Accomplishments
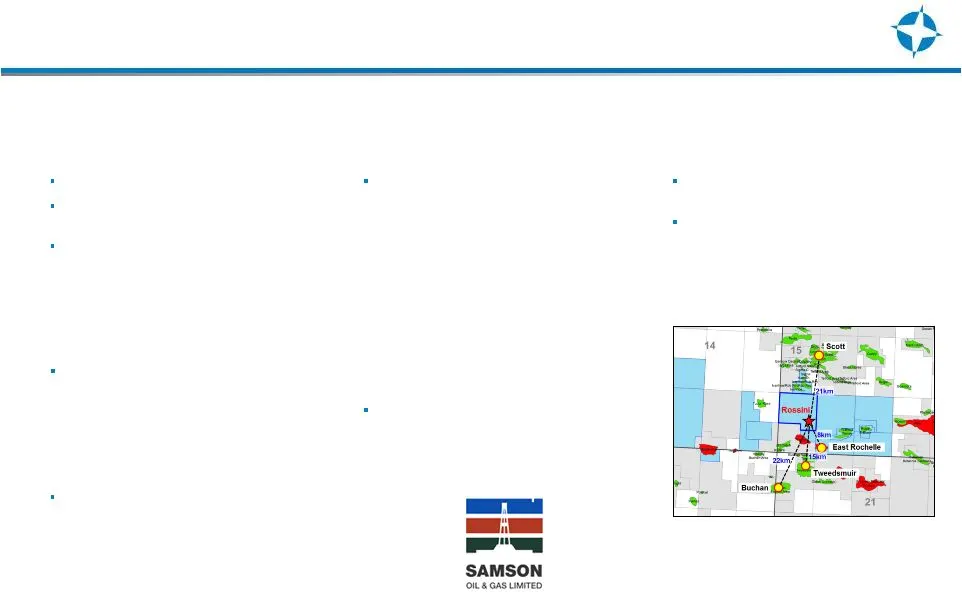
Accomplishments Sale of 50% of upstream and midstream assets in the Pennsylvania Marcellus and formed a joint venture with Samson Exploration, LLC. • Partnership plans to complete the three previously drilled and cased horizontal Marcellus wells • Tied into third-party pipeline that allows firm capa
Slide 10: Overview of Endeavour's U.K. Assets
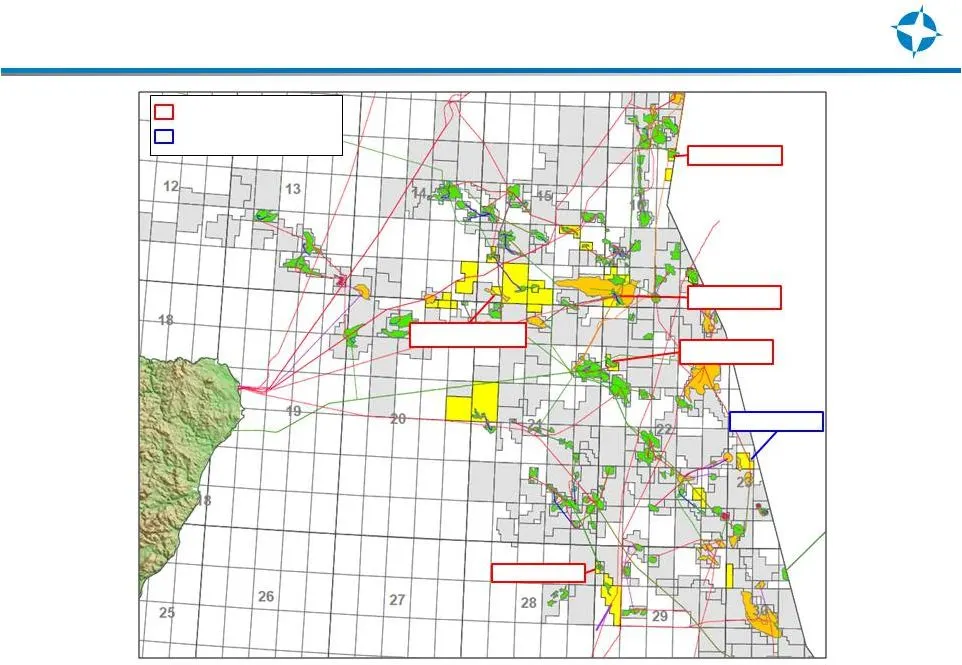
Overview of Endeavour’s U.K. Assets Bacchus Enoch Columbus Bittern Alba Rochelle Current Production Development Projects
Slide 11: Rochelle Overview - Blocks 15/26b, 15/26c and 15/27
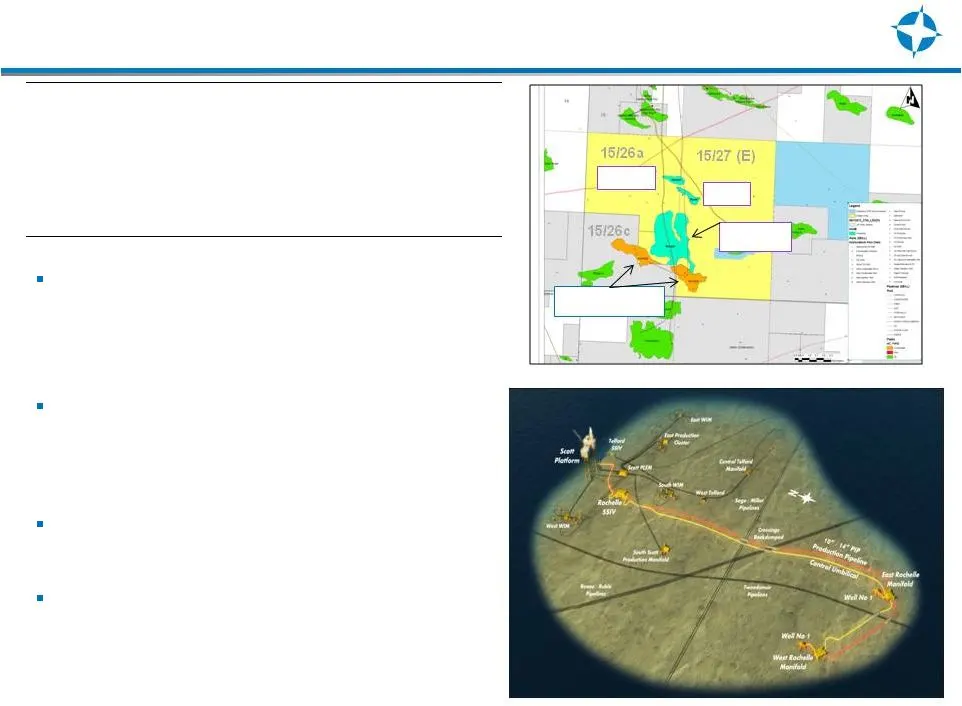
The field is a Lower Cretaceous reservoir at 9,900 ft • Good quality Britannia Kopervik turbidite sands • 3-way stratigraphic trap Flowing gas with associated condensate • Both wells have produced at rates of over 70 million cubic feet of gas per day, with an additional ~ 3,000 boepd of liquids Prod
Slide 12: Bacchus - Block 22/06a Central North Sea
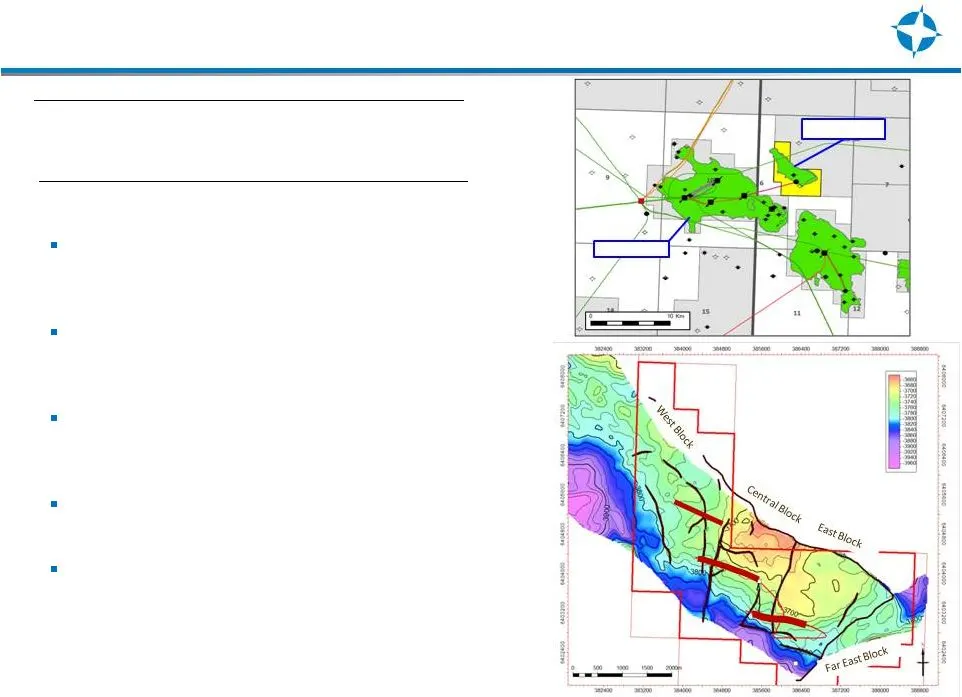
Bacchus - Block 22/06a Central North Sea Reservoir is formed by shallow marine Fulmar sandstones of Upper Jurassic age Current production at ~ 10,000 bopd * gross for the field Water injection introduced into the field in second quarter of 2014 Oil exported to Forties Pipeline System 3-D seismic sur
Slide 13: Alba Field Overview - Block 16/26a
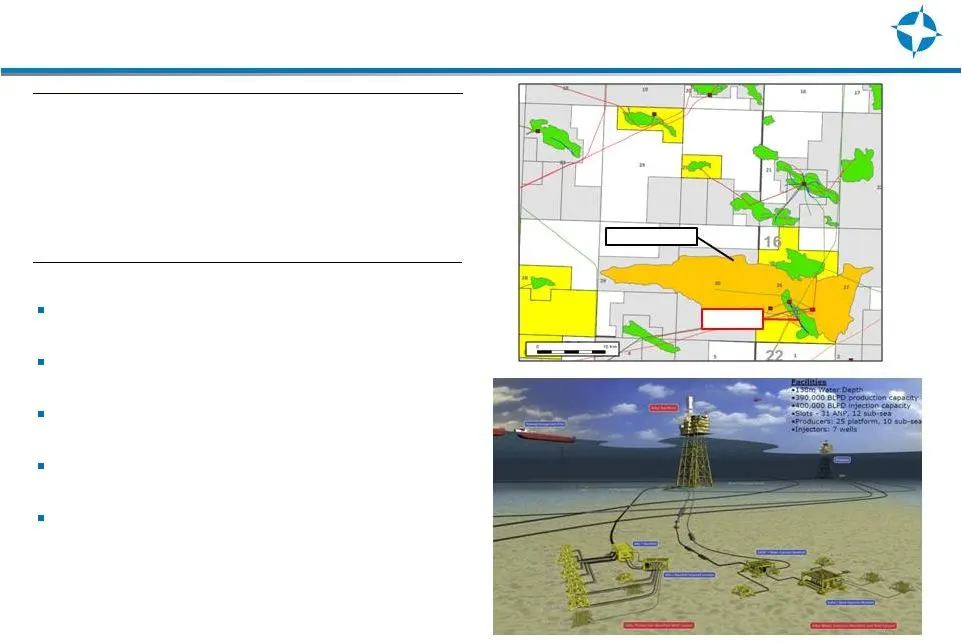
Alba Field Overview - Block 16/26a Late Eocene reservoir at ~6,200ft depth 450ft water depth 35 Platform and subsea wells Oil exported by tanker Annual infield drilling campaign of 2 - 4 wells • First well completed in March and the second well is expected to be on line in the summer Endeavour WI: 2
Slide 14: High Quality Exploration in Core Central North Sea Area
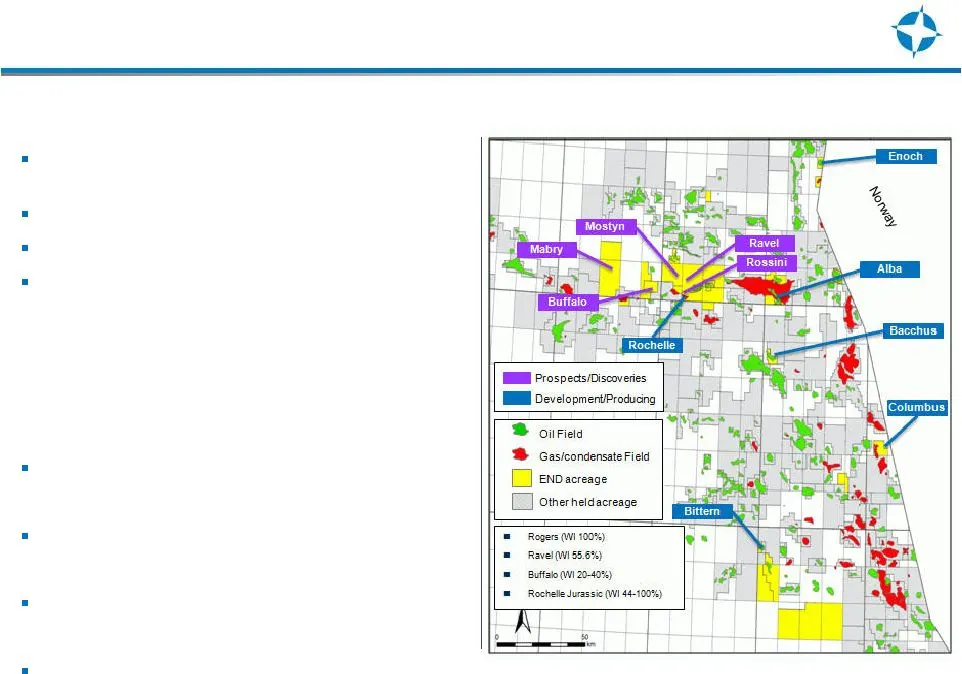
High Quality Exploration in Core Central North Sea Area Net Unrisked Contingent Prospective Resources: 376 MMboe 28 Licences (12 Endeavour operated) Own 105 kilometers of 3D seismic in this core area History of success bidding in the Licensing Rounds with a focus on high quality acreage close to inf
Slide 15: R-Block Exploration Opportunities - Rossini
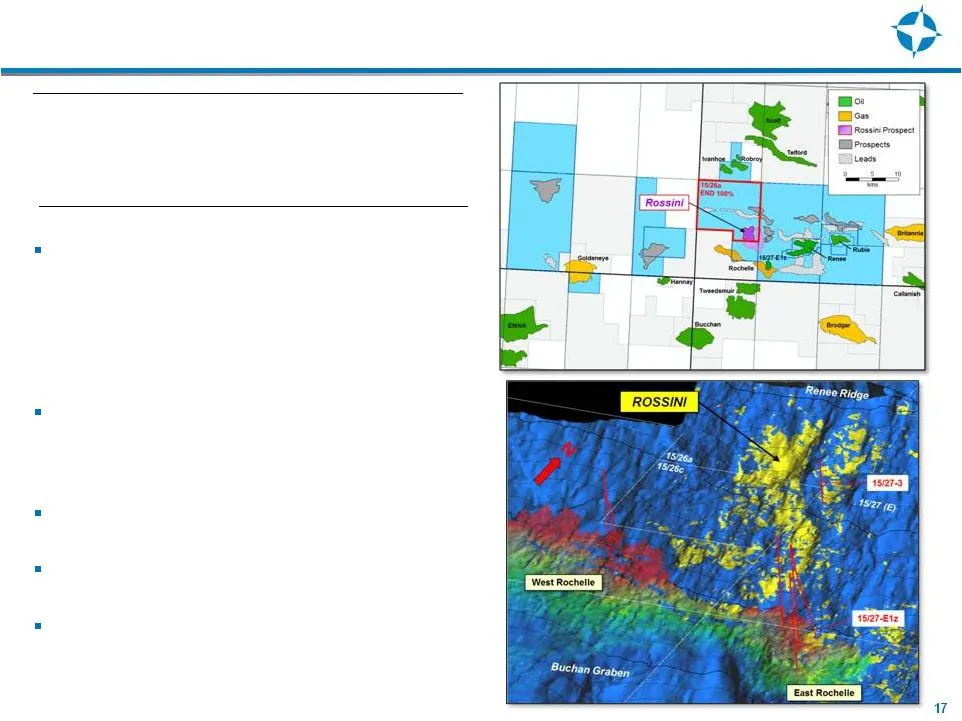
R-Block Exploration Opportunities - Rossini Rossini was discovered by Endeavour in 2012 • A large majority of the prospect sits in block 15/26a, where Endeavour has a 100% working interest and is the operator • P50 reserves potential of – MMBOE Field lies close to existing infrastructure , but may b
Slide 16: US Onshore Assets
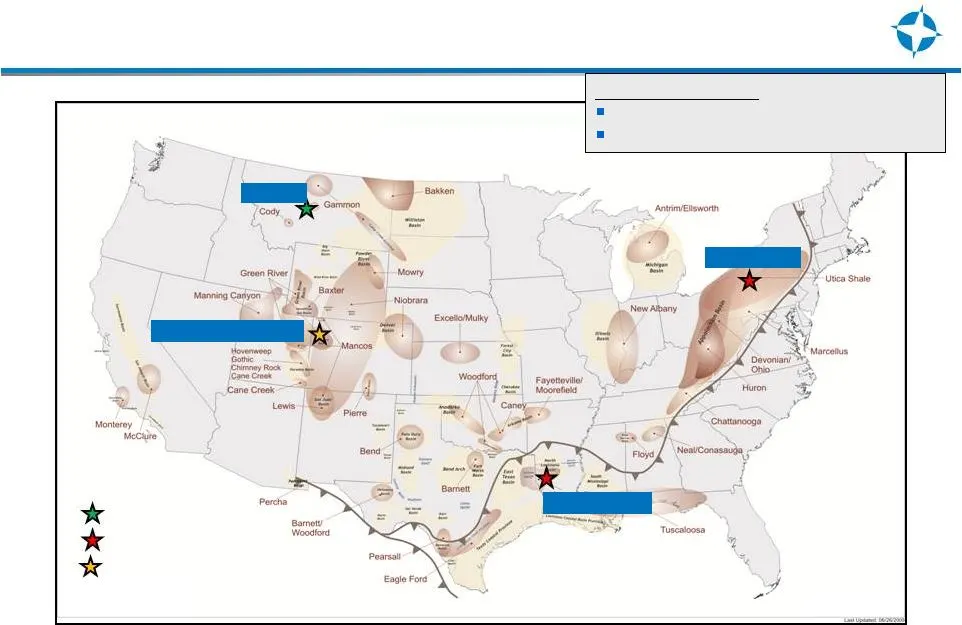
Heath Marcellus Niobrara/Frontier Haynesville US Onshore Assets Oil Gas Mixed Building Portfolio US Q4 2013 Totals 442,600 gross / 109,000 net acres Average of 6 MMCFe/D net production
Slide 17: NW Colorado Niobrara Opportunity
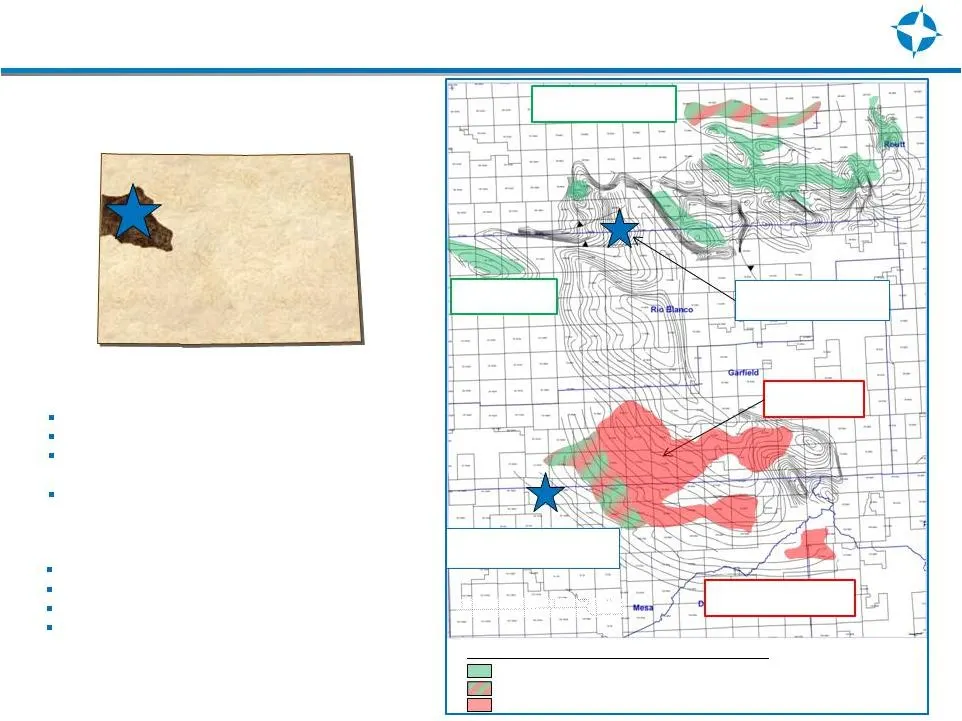
Endeavour - NW Colorado Niobrara Opportunity Pursuing liquids-rich, stacked Niobrara/Frontier plays in the Piceance Basin, NW Colorado Piceance Basin Colorado Rangely Niobrara 15 mmbo Buck Peak Niobrara trend 20-30 mmbo Encana’s Orchard Niobrara gas development WPX 16mmcf/d Niobrara well Wiley Prosp
Slide 18: Piceance Basin Niobrara - Industry Activity
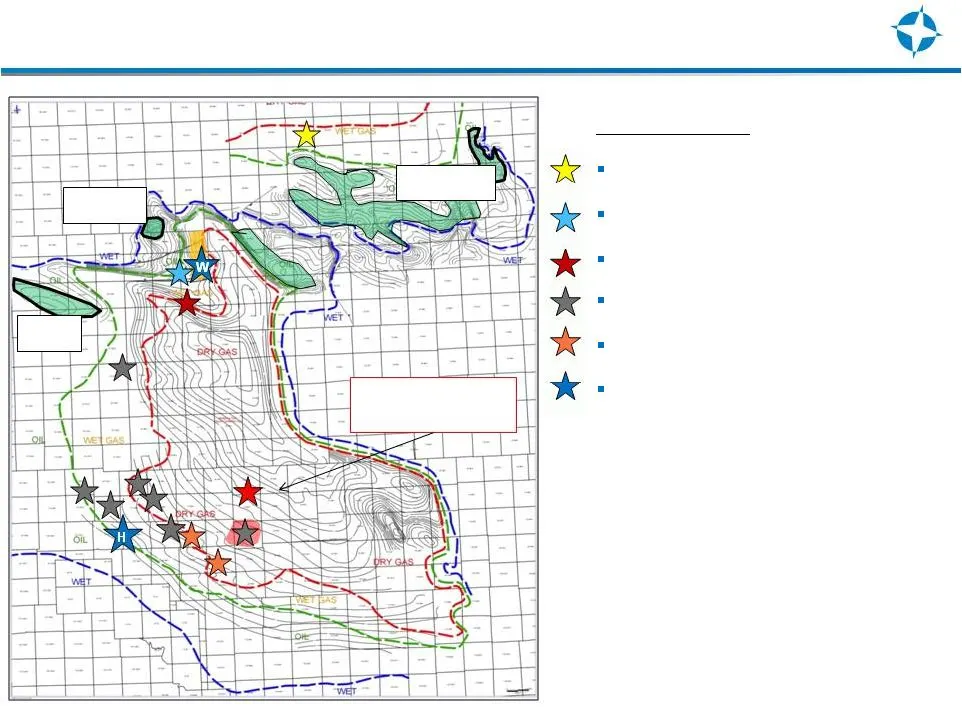
H Piceance Basin Niobrara - Industry Activity (Structure on top Rollins Ss, c.i. 500’) WPX 16 mmcf/d Niobrara well Area Participants Axia / Oxy Mesa/WPX Whiting Encana Black Hills Endeavour Project Areas • Wiley (W) and Hunter/Garvey (H) Buck Peak trend 20-30 mmbo Winter Valley 80 mbo Rangely 15 mmb
Slide 19: Marcellus Industry Activity in END Play Area
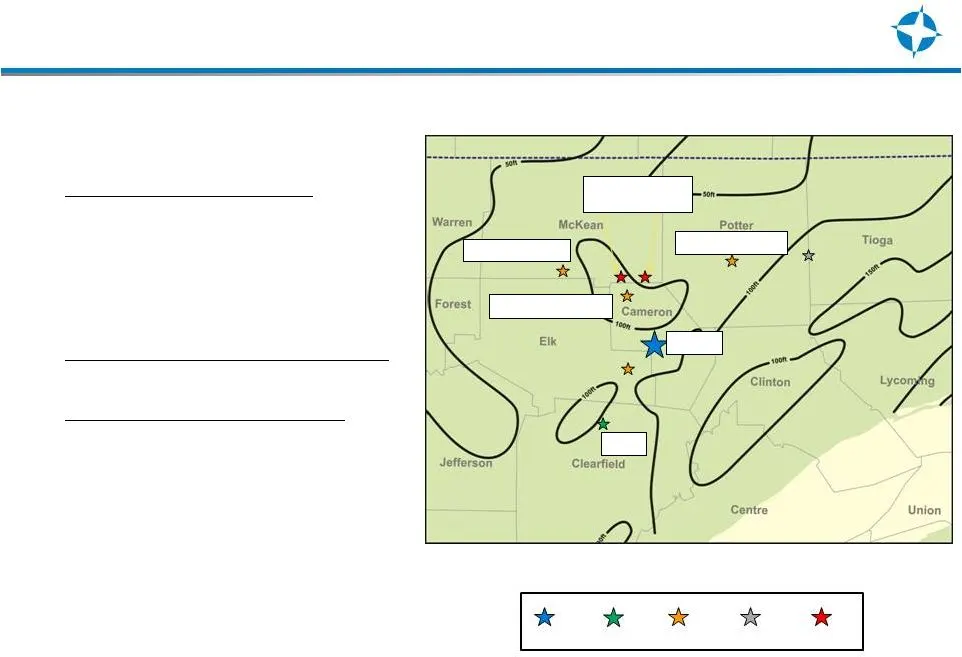
Marcellus Industry Activity in END Play Area Daniel END EOG Seneca Ultra PGE/Exxon Reported Marcellus EURs 6 – 8+ Bcf • Seneca – N. Cameron County • 5500’ laterals, 37-stage fracs • IP’s 7- 11 mmcf/d • EUR’s 6-8 BCF • Targeting < $6-7mm CWC’s (full pad development) • EOG/Seneca – Northern Clearfield
Slide 20: Pennsylvania Marcellus Assets
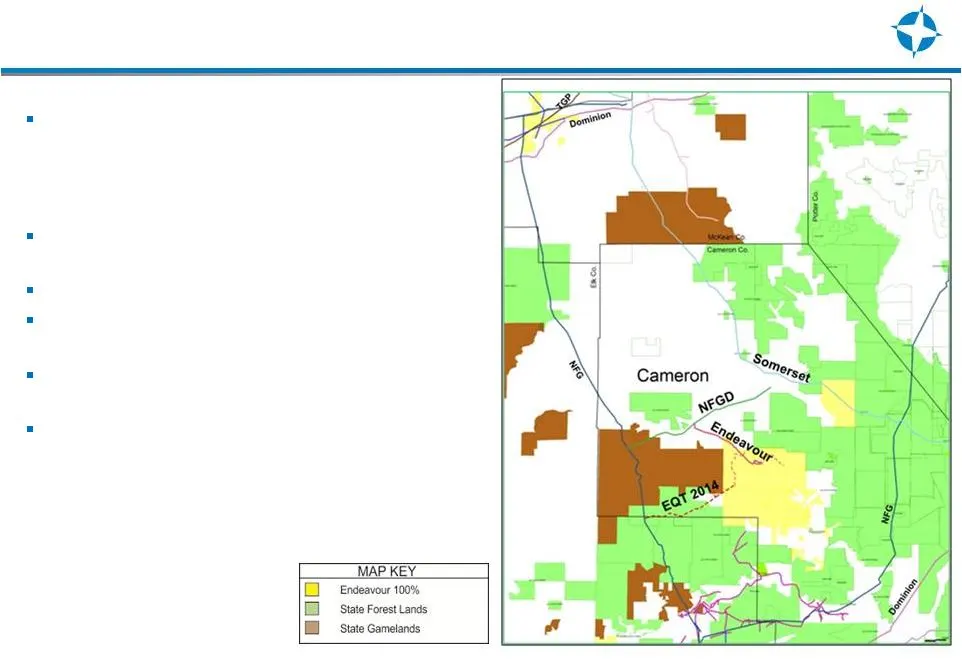
Pennsylvania Marcellus Assets In October 2013, closed a 50% sale / joint venture with Samson Exploration, LLC • Provides development capital for Daniel Project ‘proof of concept’ 27,000 net acres (majority held by production), END-operated 400-600+ BCFe net resource potential 1 TCF potential includi
Slide 21: Direct Capital Expenditure Budget
U.S. Other Alba U.K. Other Direct Capital Expenditure Budget Colorado Direct CapEx = $60 million - $80 million • U.K. = $40 million - $55 million • U.S. = $20 million - $25 million Decommissioning costs for IVRR, Renee and Rubie fields = $50 million
Slide 22: Pro Forma Debt Maturity Schedule
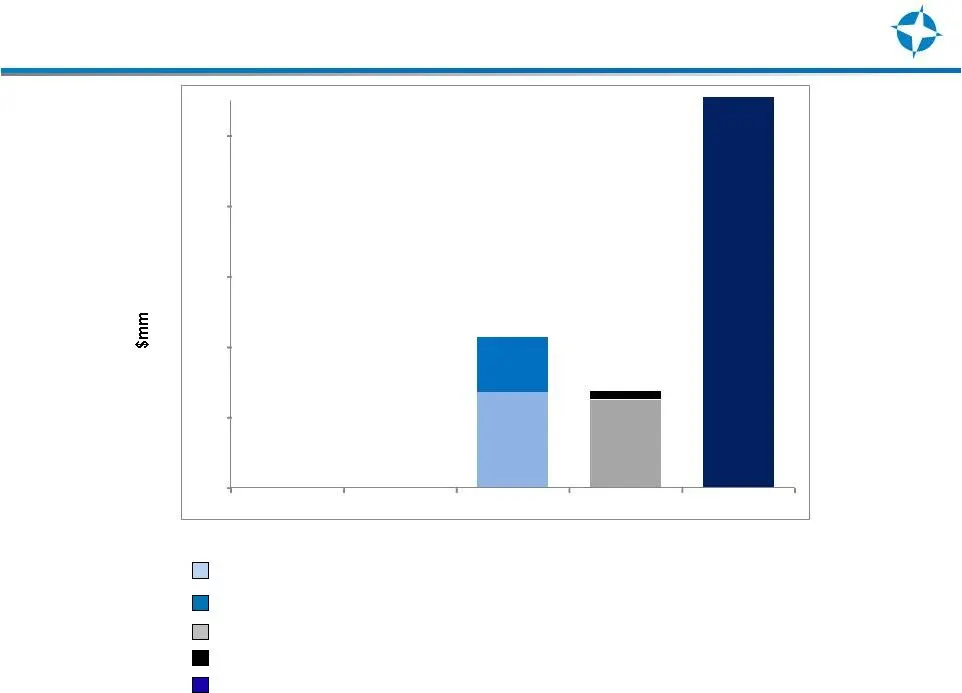
$554 $12.5 Pro Forma Debt Maturity Schedule Convertible Notes due 2016 ($18.51 per share conversion price) Convertible Bonds due 2016 ($16.52 per share conversion price) Senior Notes due 2018 Senior Secured First Lien Term Loan due 2017 Convertible Notes due 2017 ($4.66 per share conversion price) $
Slide 23: Focus for 2014
Focus for 2014 Improve and maintain production Control capex spending Deleverage Pursue exploitation of exploration inventory through joint ventures with like minded partners
Slide 24: Investor Contact
LSE:ENDV NYSE:END www.endeavourcorp.com INVESTOR CONTACT: Darcey Matthews Director of Investor Relations 713.307.8711 [email protected]
Source: SEC EDGAR · 8-K filed Mar 26, 2014
More decks from Endeavour International Corp
 Presentation (May 2015)5 slides · May 7, 2015
 Corporate Update (February 2015)23 slides · Feb 27, 2015
 Debt Investor Presentation (October 2014)16 slides · Oct 14, 2014
 Q2 2014 Earnings Presentation12 slides · Aug 5, 2014
 Proxy Contest (May 2014)45 slides · May 8, 2014
 Q1 2014 Earnings Presentation12 slides · May 7, 2014