Dynegy — Investor Day (January 2013)
102 slides from Dynegy's investor day presentation, Jan 17, 2013
Slide 1: Investor Day January 17, 2013
Investor Day January 17, 2013
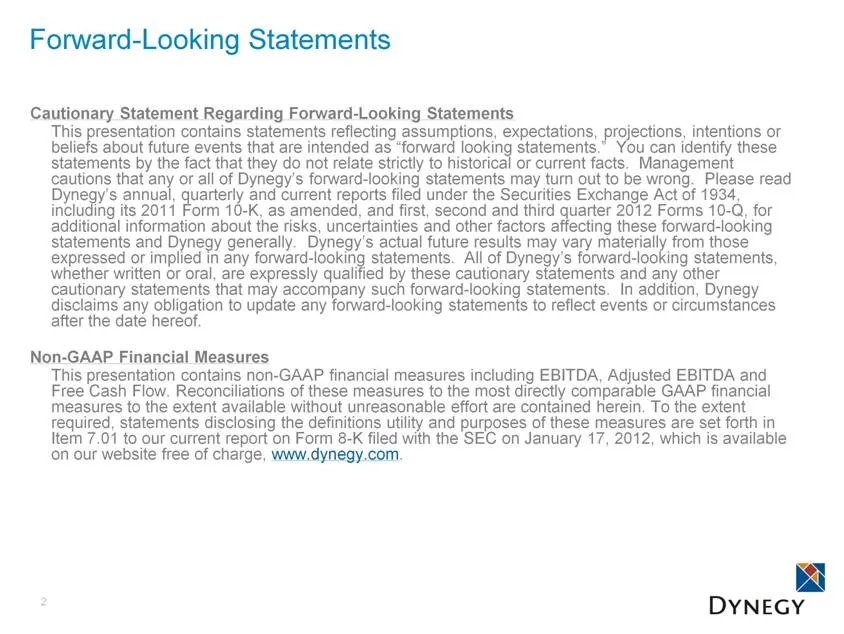
Slide 2: Forward-Looking Statements
Forward-Looking Statements Cautionary Statement Regarding Forward-Looking Statements This presentation contains statements reflecting assumptions, expectations, projections, intentions or beliefs about future events that are intended as “forward looking statements.” You can identify these statements
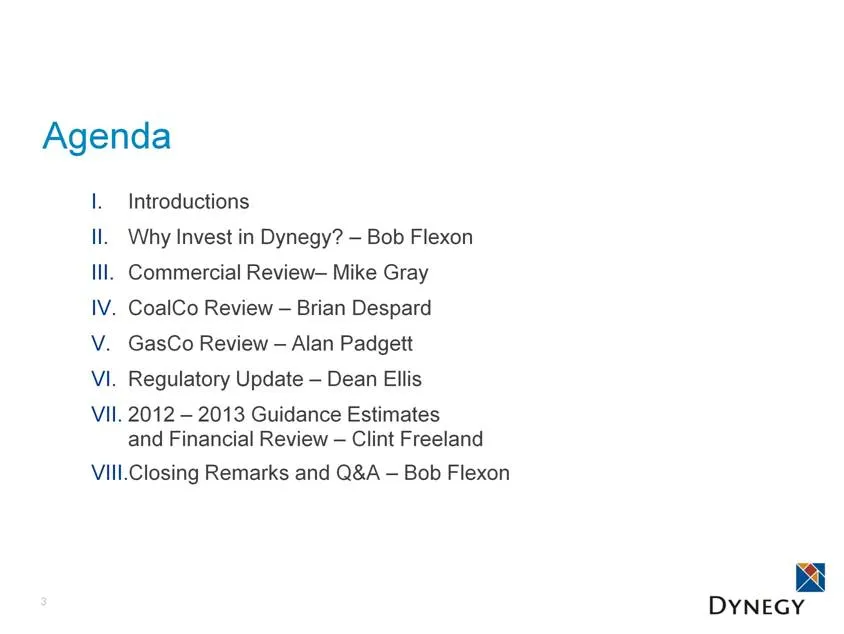
Slide 3: Agenda
3 Agenda I. Introductions II. Why Invest in Dynegy? – Bob Flexon III. Commercial Review– Mike Gray IV. CoalCo Review – Brian Despard V. GasCo Review – Alan Padgett VI. Regulatory Update – Dean Ellis VII. 2012 – 2013 Guidance Estimates and Financial Review – Clint Freeland VIII Closing Remarks and Q&
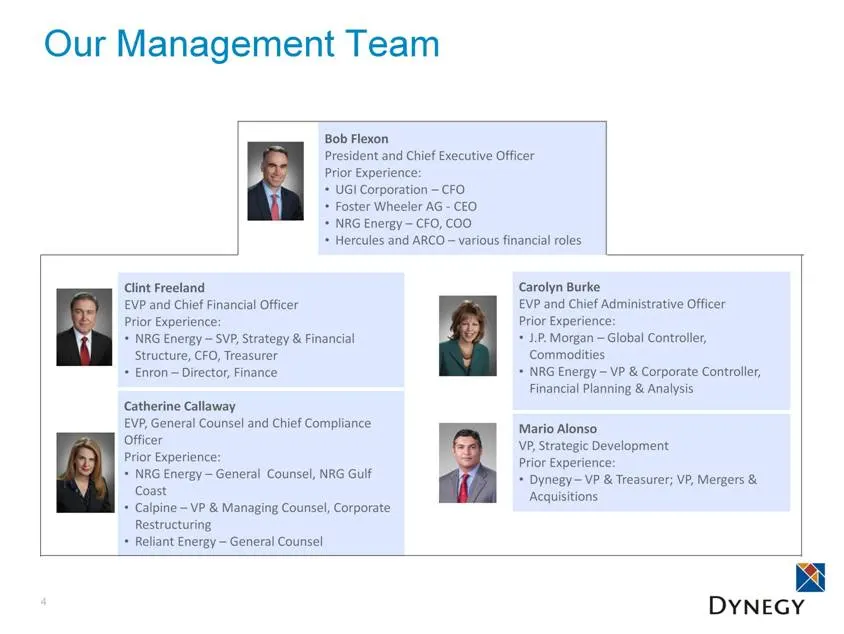
Slide 4: Our Management Team
Our Management Team 4 Carolyn Burke EVP and Chief Administrative Officer Prior Experience: J.P. Morgan – Global Controller, Commodities NRG Energy – VP & Corporate Controller, Financial Planning & Analysis Mario Alonso VP, Strategic Development Prior Experience: Dynegy – VP & Treasurer; VP, Mergers
Slide 5: Board of Directors
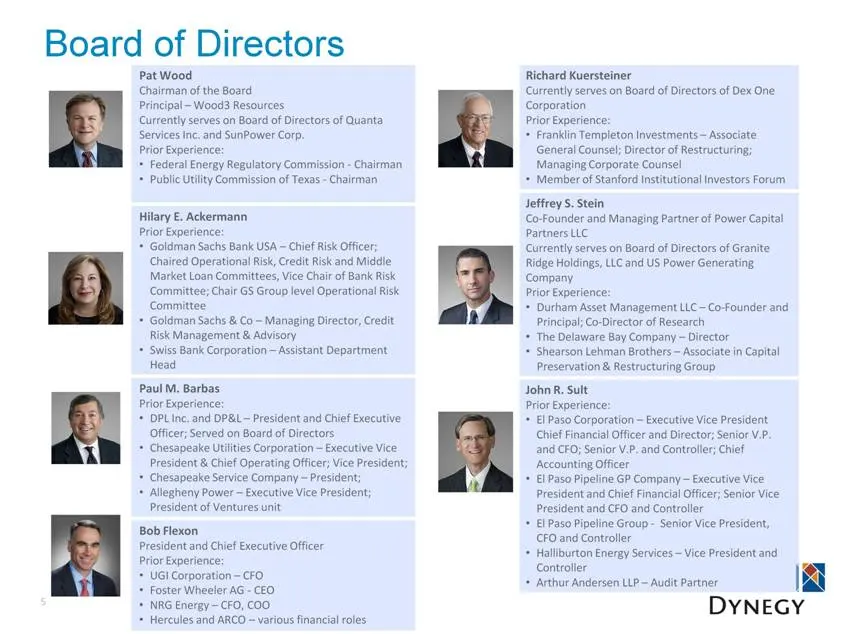
Pat Wood Chairman of the Board Principal – Wood3 Resources Currently serves on Board of Directors of Quanta Services Inc. and SunPower Corp. Prior Experience: Federal Energy Regulatory Commission - Chairman Public Utility Commission of Texas - Chairman Hilary E. Ackermann Prior Experience: Goldman S
Slide 6: Other Speakers Today
6 Alan Padgett VP, GasCo Asset Management Prior Experience: Dynegy – Managing Director, West Commercial Operations Calpine – Manager, West Commercial Operations Dean Ellis Senior Director, Government Affairs Prior Experience: Dynegy – Director, Asset Management NYISO – Manager, Transmission Studies
Slide 7: II. Why Invest in Dynegy?
II. Why Invest in Dynegy? Robert C. Flexon – President and CEO
Slide 8: Why invest in Dynegy?
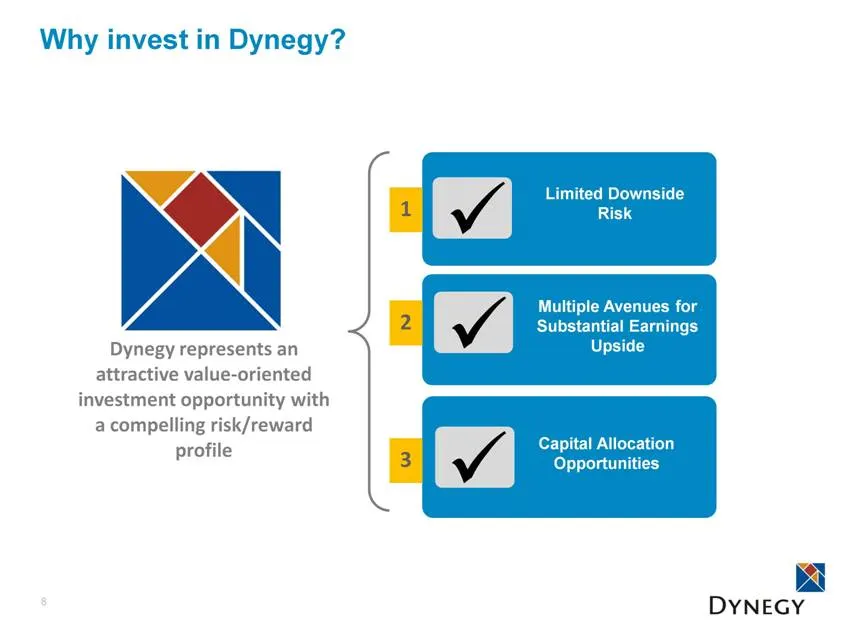
Why invest in Dynegy? 8 Dynegy represents an attractive value-oriented investment opportunity with a compelling risk/reward profile Capital Allocation Opportunities Multiple Avenues for Substantial Earnings Upside Limited Downside Risk 1 2 3
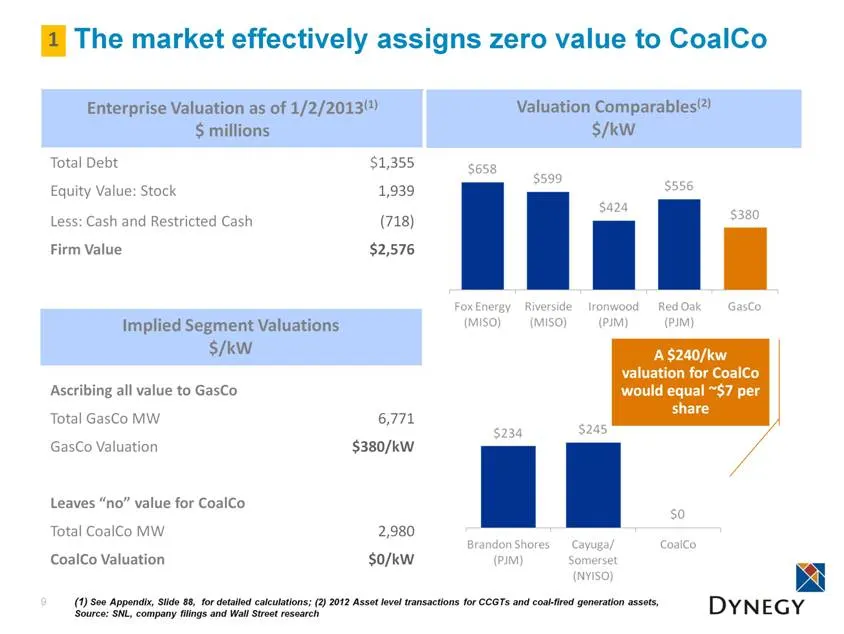
Slide 9: The market effectively assigns zero value to CoalCo
The market effectively assigns zero value to CoalCo 9 Enterprise Valuation as of 1/2/2013(1) $ millions Total Debt $1,355 Equity Value: Stock 1,939 Less: Cash and Restricted Cash (718) Firm Value $2,576 Ascribing all value to GasCo Total GasCo MW 6,771 GasCo Valuation $380/kW Leaves “no” value for C
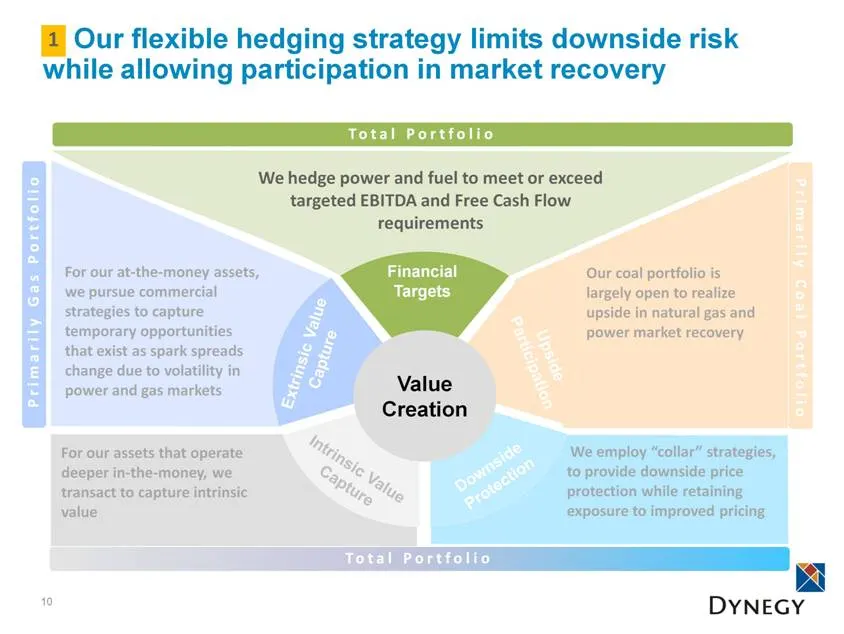
Slide 10: Flexible hedging strategy limits downside risk while allowing market recovery participation
Our flexible hedging strategy limits downside risk while allowing participation in market recovery 10 Value Creation We hedge power and fuel to meet or exceed targeted EBITDA and Free Cash Flow requirements Our coal portfolio is largely open to realize upside in natural gas and power market recovery
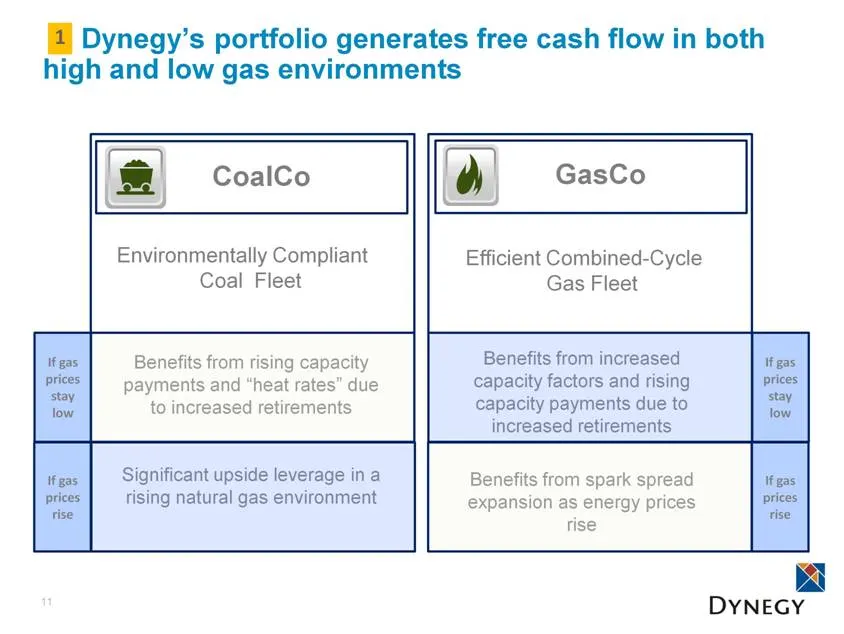
Slide 11: Portfolio generates free cash flow in both high and low gas environments
Dynegy’s portfolio generates free cash flow in both high and low gas environments 11 Environmentally Compliant Coal Fleet If gas prices stay low If gas prices rise Benefits from rising capacity payments and “heat rates” due to increased retirements Significant upside leverage in a rising natural gas
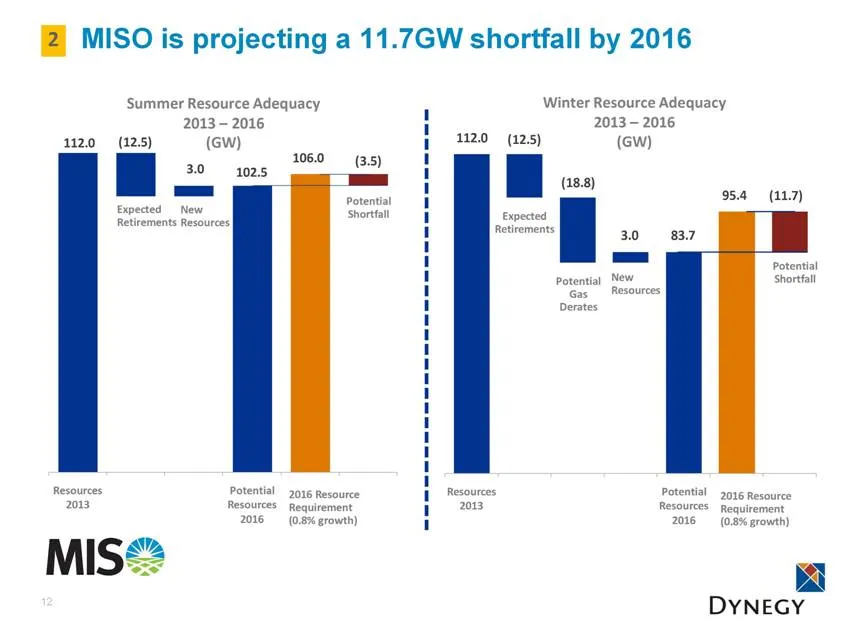
Slide 12: MISO is projecting a 11.7GW shortfall by 2016
MISO is projecting a 11.7GW shortfall by 2016 12 2 Resources 2013 Potential Resources 2016 Expected Retirements New Resources Potential Shortfall 2016 Resource Requirement (0.8% growth) Potential Gas Derates Winter Resource Adequacy 2013 – 2016 ( GW ) 112.0 3.0 (12.5) 95.4 (11.7) (18.8) 83.7
Slide 13: Tightening MISO reserve margins could result in capacity revenue
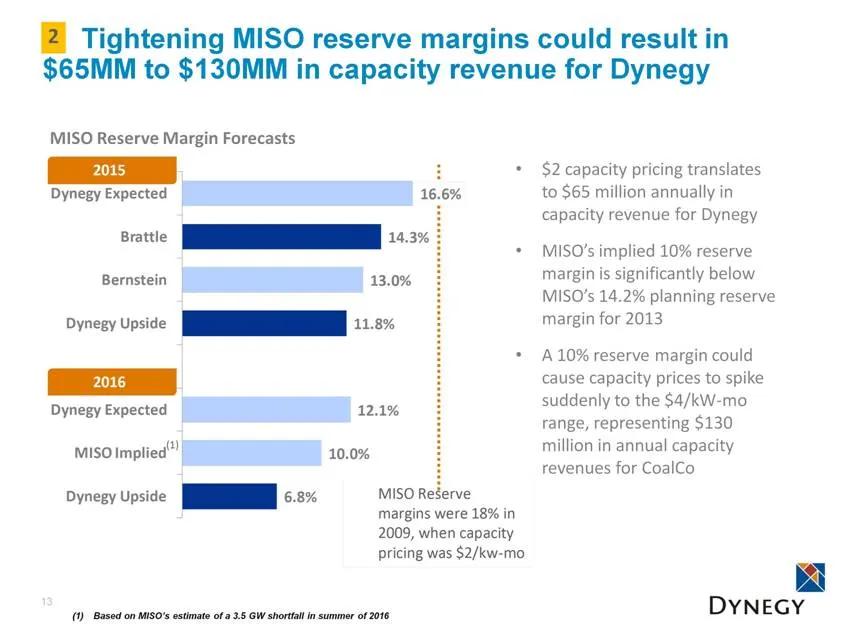
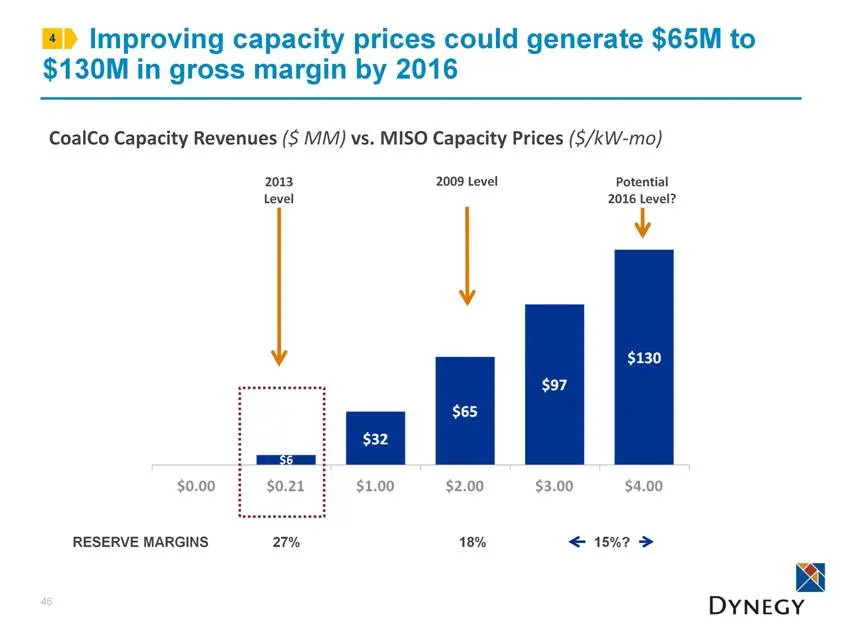
Tightening MISO reserve margins could result in $65MM to $130MM in capacity revenue for Dynegy 13 2 MISO Reserve Margin Forecasts $2 capacity pricing translates to $65 million annually in capacity revenue for Dynegy MISO’s implied 10% reserve margin is significantly below MISO’s 14.2% planning reser
Slide 14: Retirements could increase power prices around our fleet
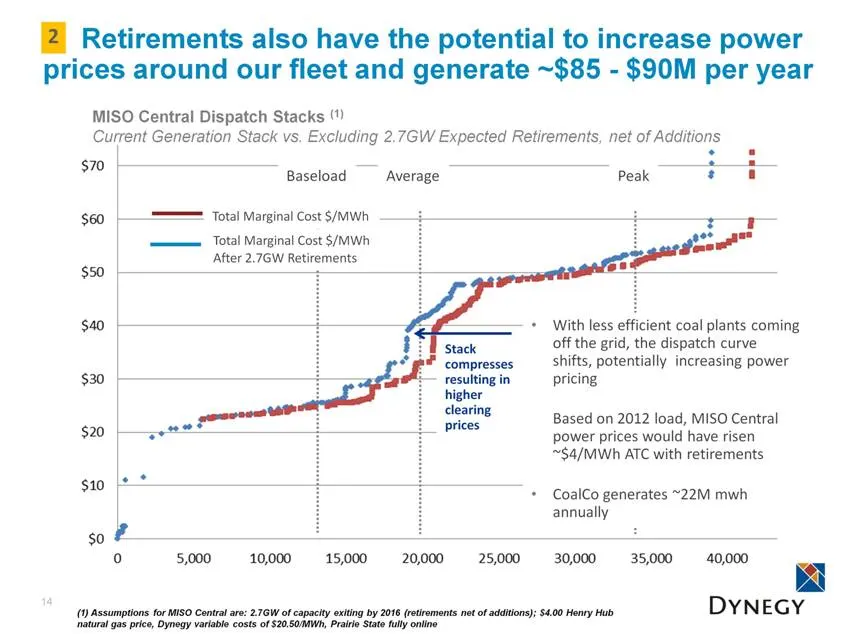
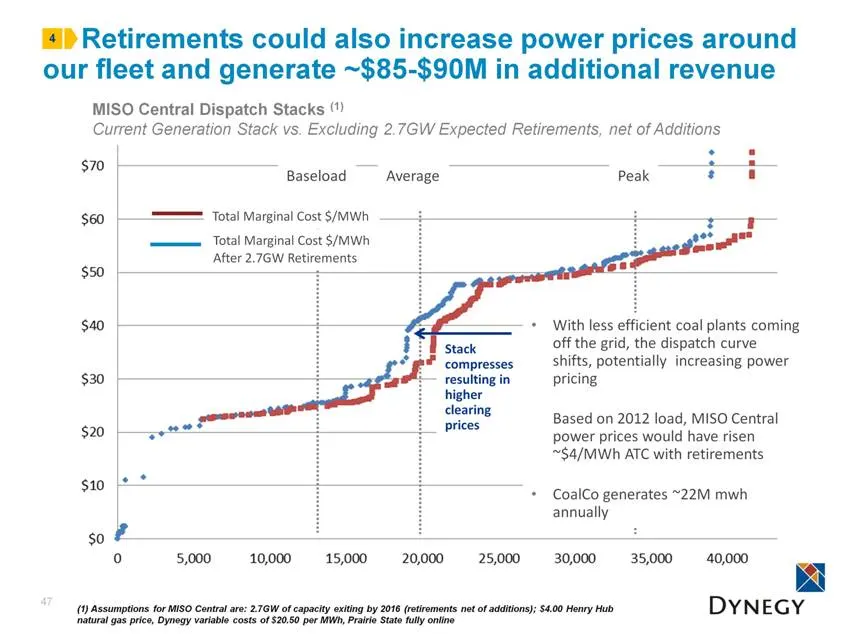
Retirements also have the potential to increase power prices around our fleet and generate ~$85 - $90M per year 14 Baseload Average Peak MISO Central Dispatch Stacks (1) Current Generation Stack vs. Excluding 2.7GW Expected Retirements, net of Additions (1) Assumptions for MISO Central are: 2.7GW of
Slide 15: Rising gas prices could generate increased EBITDA by 2016
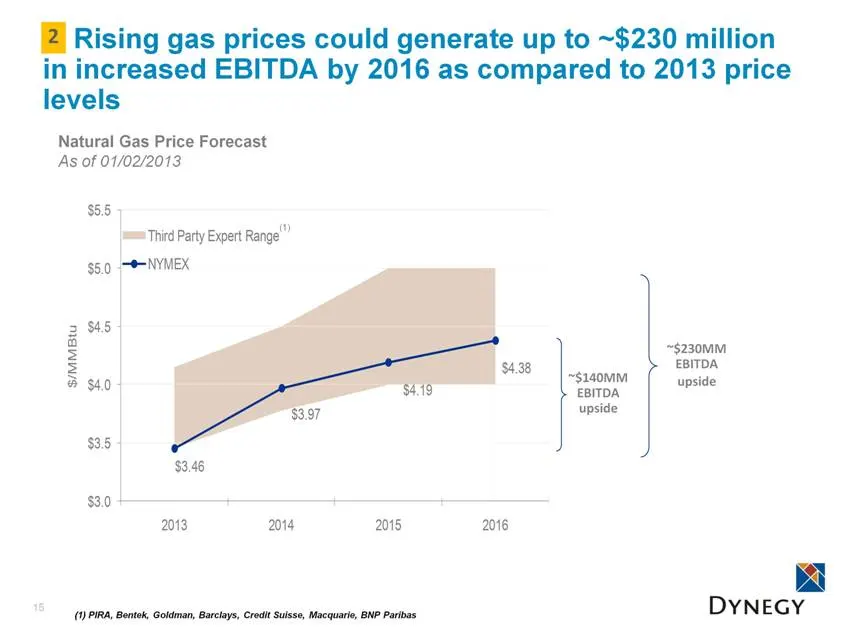
Rising gas prices could generate up to ~$230 million in increased EBITDA by 2016 as compared to 2013 price levels 15 Natural Gas Price Forecast As of 01/02/2013 ~$140MM EBITDA upside ~$230MM EBITDA upside (1) PIRA, Bentek, Goldman, Barclays, Credit Suisse, Macquarie, BNP Paribas 2 (1) $ 3.46 $3.97 $
Slide 16: PRIDE drives efficiencies
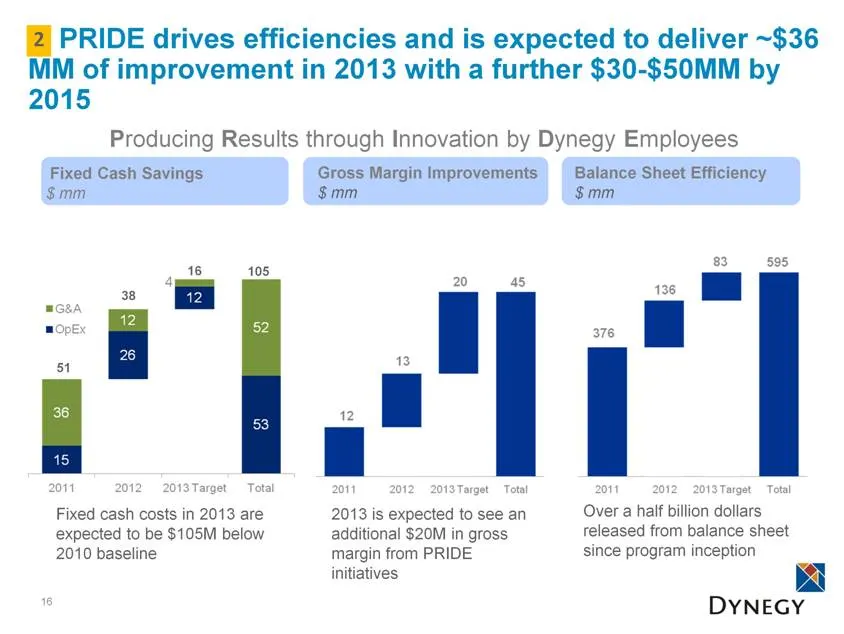
PRIDE drives efficiencies and is expected to deliver ~$36 MM of improvement in 2013 with a further $30-$50MM by 2015 16 Fixed Cash Savings $ mm Gross Margin Improvements $ mm Balance Sheet Efficiency $ mm Producing Results through Innovation by Dynegy Employees 51 38 16 105 Fixed cash costs in 2013
Slide 17: Capital Allocation Options
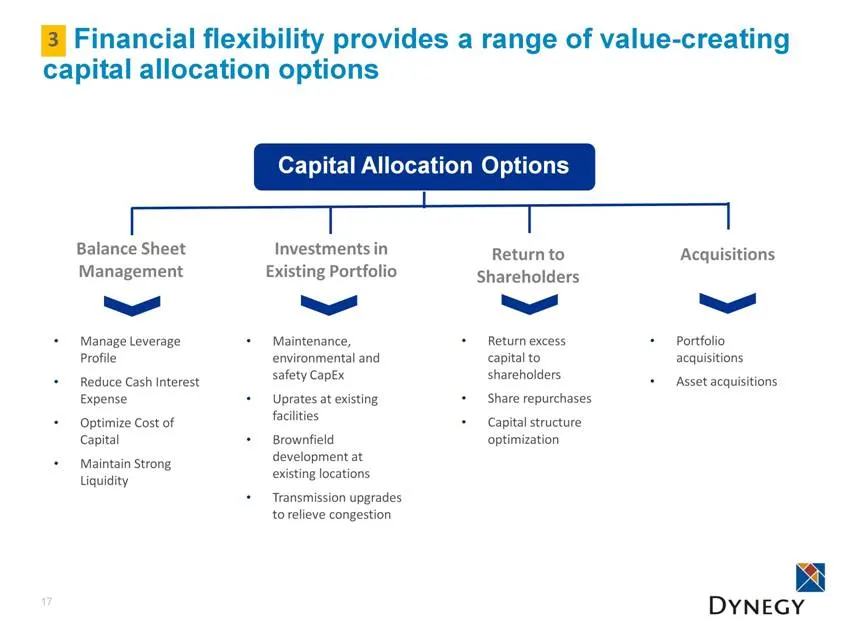
17 Capital Allocation Options Balance Sheet Management Manage Leverage Profile Reduce Cash Interest Expense Optimize Cost of Capital Maintain Strong Liquidity Investments in Existing Portfolio Maintenance, environmental and safety CapEx Uprates at existing facilities Brownfield development at existi
Slide 18: Financial flexibility from strong balance sheet and liquidity
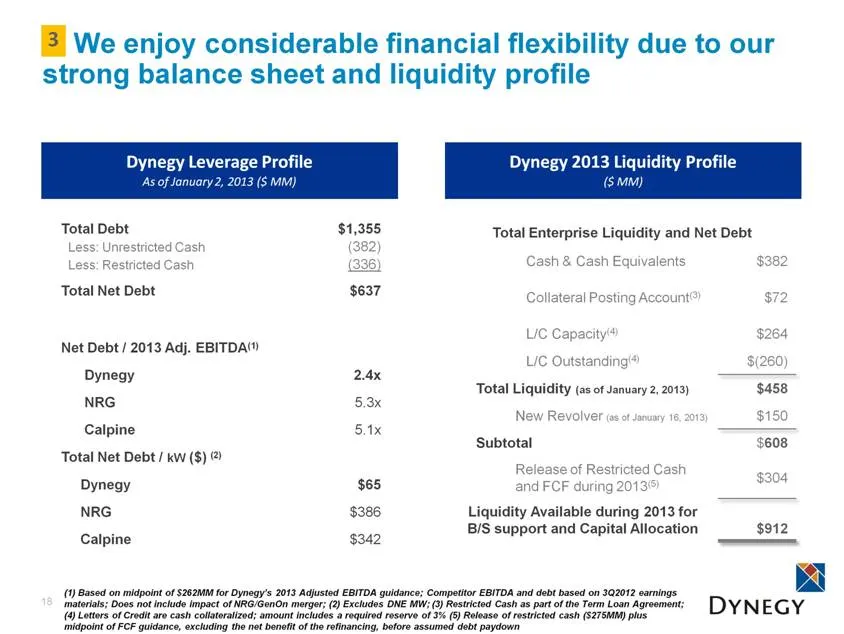
We enjoy considerable financial flexibility due to our strong balance sheet and liquidity profile 18 Total Debt $1,355 Less: Unrestricted Cash (382) Less: Restricted Cash (336) Total Net Debt $637 Net Debt / 2013 Adj. EBITDA(1) Dynegy 2.4x NRG 5.3x Calpine 5.1x Total Net Debt / kW ($) (2) Dynegy $65
Slide 19: Balance Sheet Management
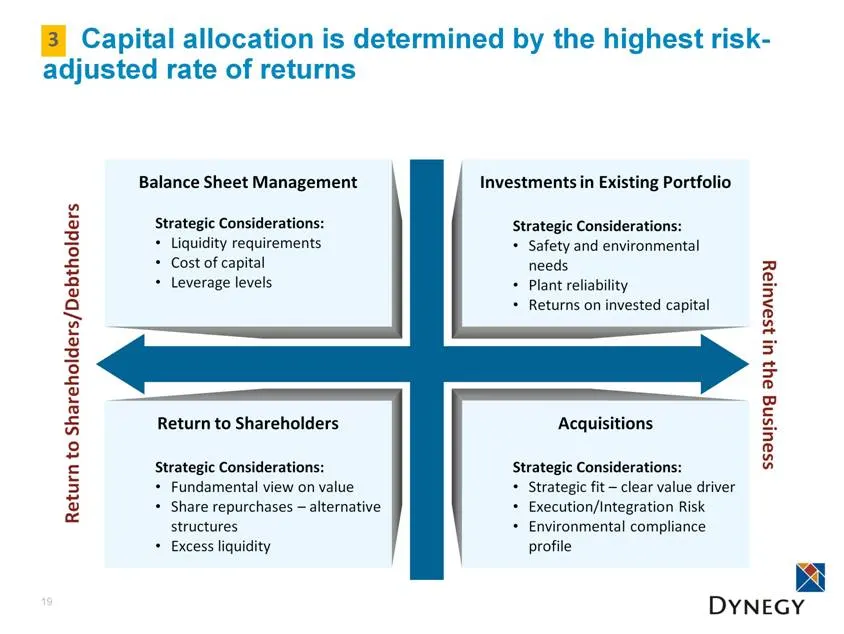
19 Balance Sheet Management Strategic Considerations: Liquidity requirements Cost of capital Leverage levels Investments in Existing Portfolio Strategic Considerations: Safety and environmental needs Plant reliability Returns on invested capital Acquisitions Strategic Considerations: Strategic fit –
Slide 20: Attractive value-oriented investment opportunity
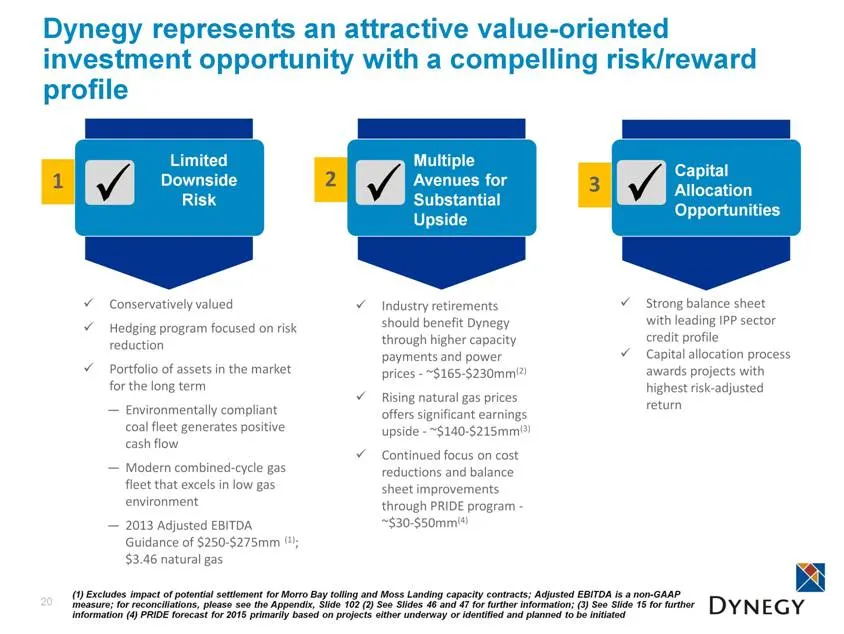
Dynegy represents an attractive value-oriented investment opportunity with a compelling risk/reward profile 20 Capital Allocation Opportunities Multiple Avenues for Substantial Upside Limited Downside Risk Conservatively valued Hedging program focused on risk reduction Portfolio of assets in the mar
Slide 21: I. Commercial Review
I. Commercial Review Mike Gray – VP, Commercial
Slide 22: Bullish view on natural gas within experts' range
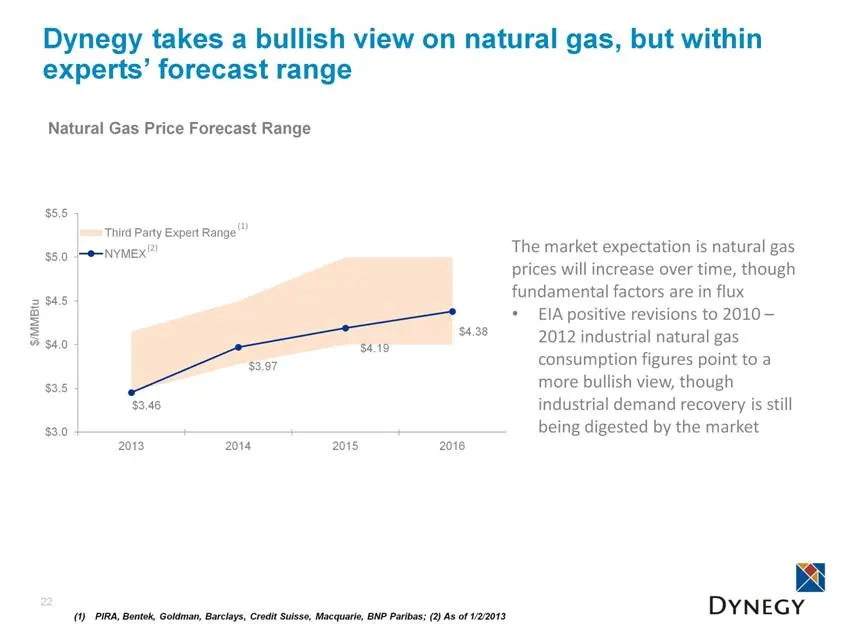
Dynegy takes a bullish view on natural gas, but within experts’ forecast range 22 The market expectation is natural gas prices will increase over time, though fundamental factors are in flux EIA positive revisions to 2010 – 2012 industrial natural gas consumption figures point to a more bullish view
Slide 23: Supplier economics expected to dampen gas supply growth
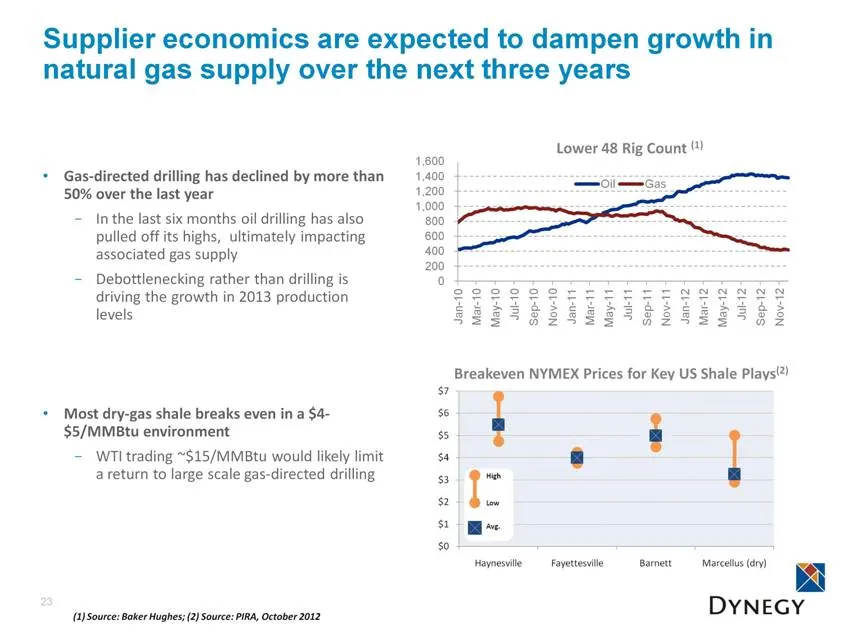
Supplier economics are expected to dampen growth in natural gas supply over the next three years 23 Gas-directed drilling has declined by more than 50% over the last year In the last six months oil drilling has also pulled off its highs, ultimately impacting associated gas supply Debottlenecking rat
Slide 24: Power sector gas demand expected to outpace supply growth
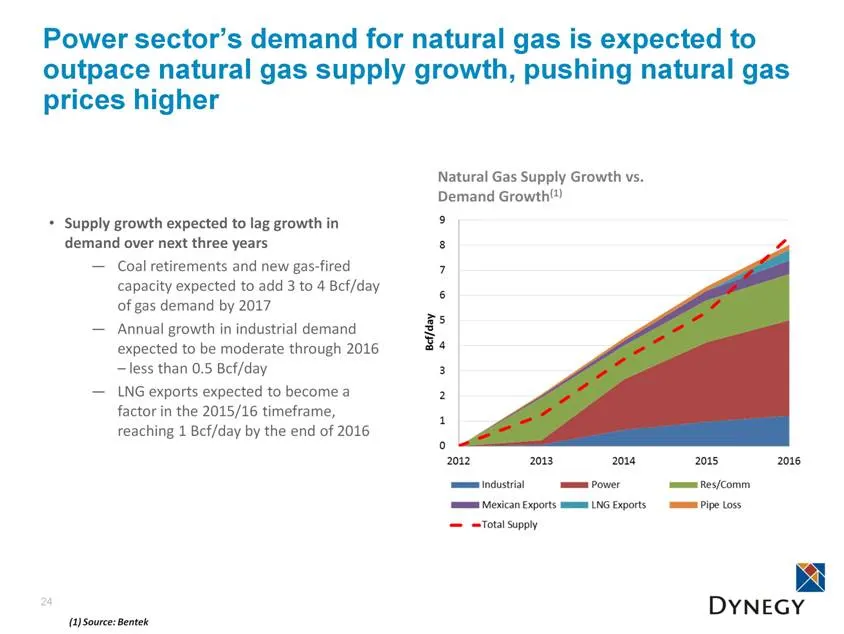
Power sector’s demand for natural gas is expected to outpace natural gas supply growth, pushing natural gas prices higher 24 Supply growth expected to lag growth in demand over next three years Coal retirements and new gas-fired capacity expected to add 3 to 4 Bcf/day of gas demand by 2017 Annual gr
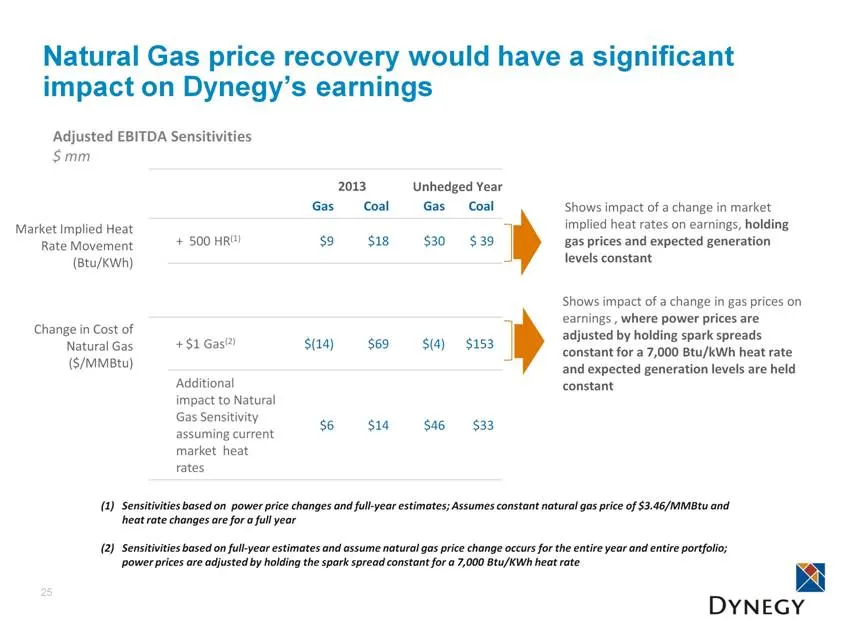
Slide 25: Natural gas price recovery impact on earnings
Natural Gas price recovery would have a significant impact on Dynegy’s earnings 25 Gas Coal Gas Coal + 500 HR(1) $9 $18 $30 $ 39 + $1 Gas(2) $(14) $69 $(4) $153 Additional impact to Natural Gas Sensitivity assuming current market heat rates $6 $14 $46 $33 Adjusted EBITDA Sensitivities $ mm Market Im
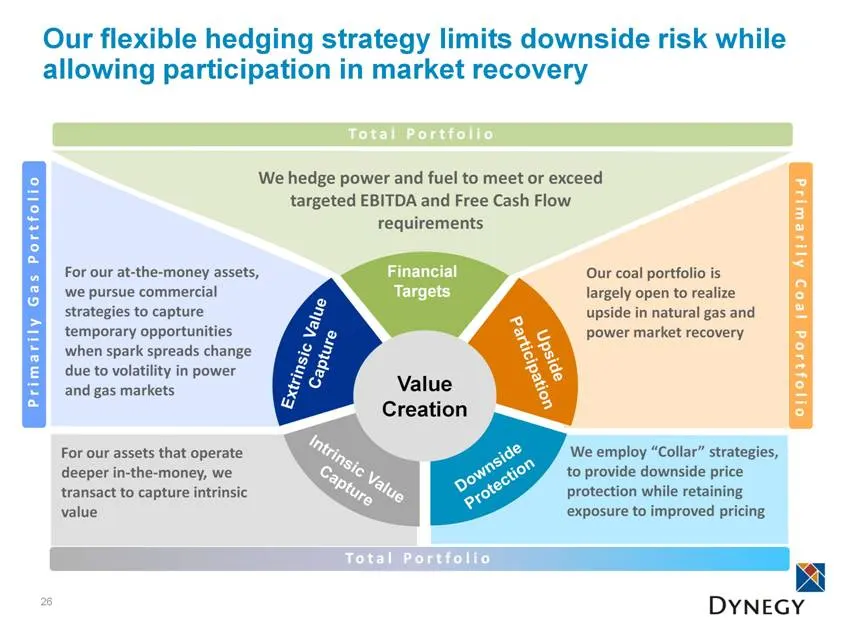
Slide 26: Flexible hedging strategy limits downside risk
Our flexible hedging strategy limits downside risk while allowing participation in market recovery 26 Value Creation We hedge power and fuel to meet or exceed targeted EBITDA and Free Cash Flow requirements Our coal portfolio is largely open to realize upside in natural gas and power market recovery
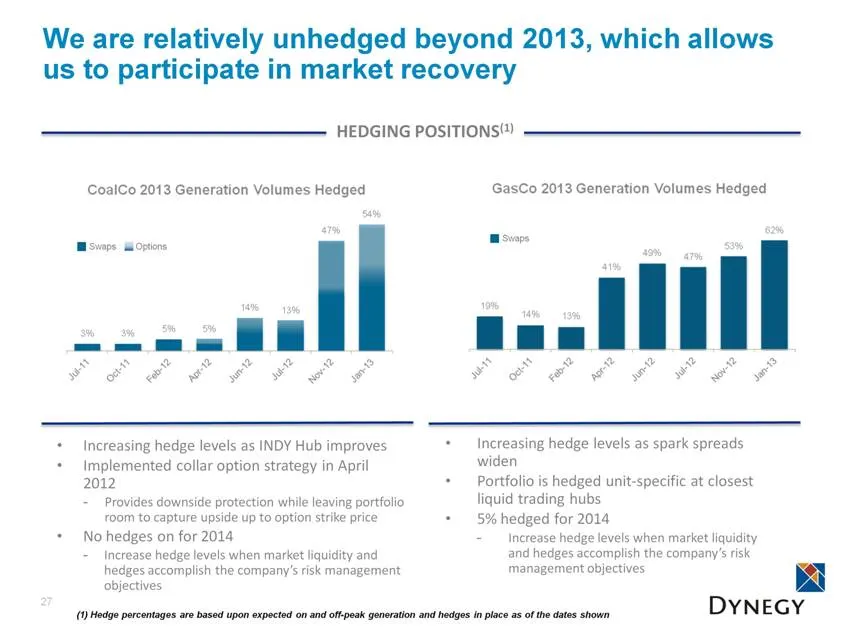
Slide 27: Relatively unhedged beyond 2013
We are relatively unhedged beyond 2013, which allows us to participate in market recovery (1) Hedge percentages are based upon expected on and off-peak generation and hedges in place as of the dates shown Increasing hedge levels as spark spreads widen Portfolio is hedged unit-specific at closest liq
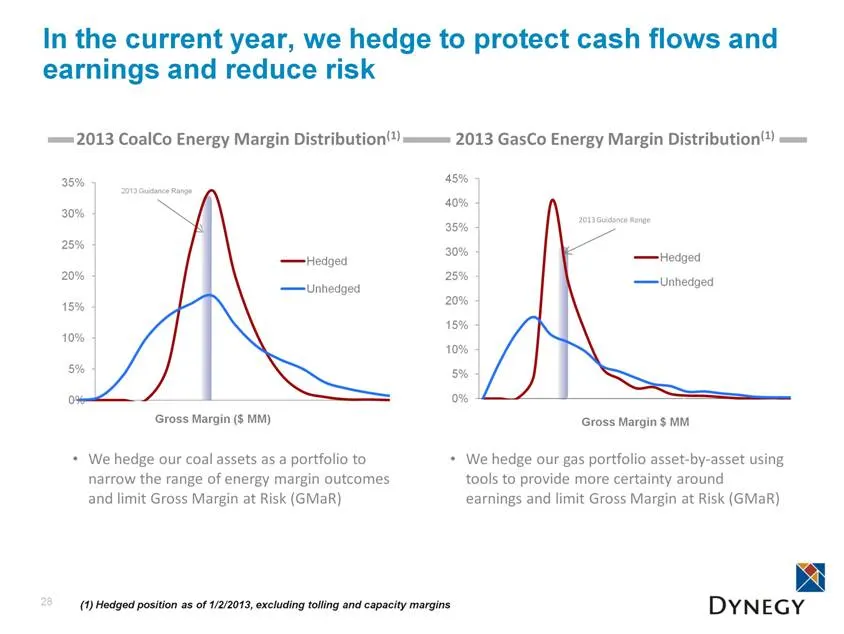
Slide 28: Current year hedging protects cash flows
In the current year, we hedge to protect cash flows and earnings and reduce risk 28 We hedge our coal assets as a portfolio to narrow the range of energy margin outcomes and limit Gross Margin at Risk (GMaR) (1) Hedged position as of 1/2/2013, excluding tolling and capacity margins 2013 CoalCo Energ
Slide 29: Capturing intrinsic and extrinsic value of assets
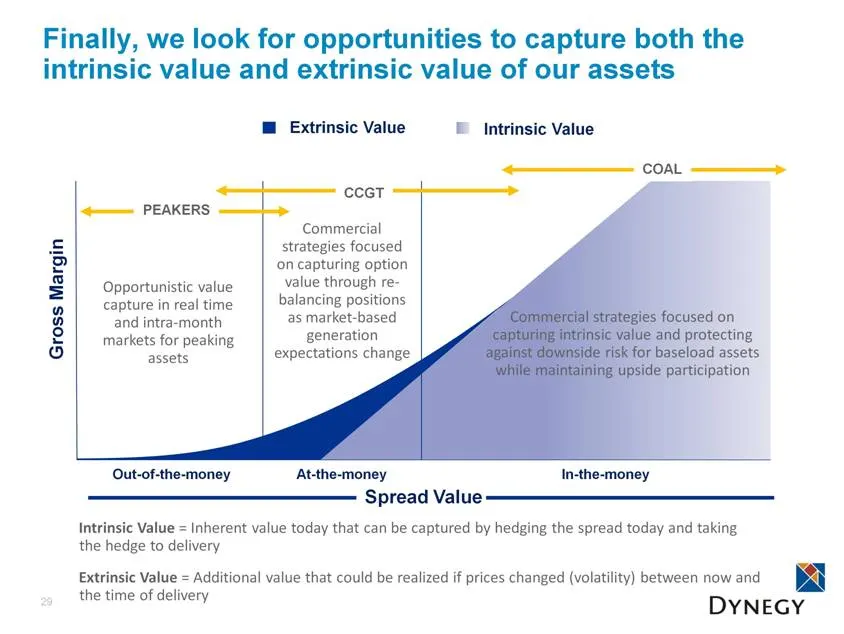
Finally, we look for opportunities to capture both the intrinsic value and extrinsic value of our assets 29 At-the-money Out-of-the-money In-the-money Gross Margin PEAKERS CCGT COAL Opportunistic value capture in real time and intra-month markets for peaking assets Commercial strategies focused on c
Slide 30: Commercial Summary
Commercial Summary Dynegy is bullish natural gas market, primarily due to the significant impact on gas demand due to retirements Our flexible hedging strategy is specific to each CoalCo and GasCo; we hedge to limit downside risk while allowing participation in market recovery In the prompt year, we
Slide 31: IV. CoalCo Review
IV. CoalCo Review Brian Despard – VP, CoalCo Asset Management
Slide 32: CoalCo runs an environmentally compliant, low-cost fleet
CoalCo runs an environmentally compliant, low-cost fleet with a highly favorable outlook 32 Earnings positive for 2013 despite a low gas price environment CoalCo’s cost structure and capital expenditure outlook provide low-cost stability PRIDE initiatives underway for further gross margin improvemen
Slide 33: CoalCo continues to generate positive cash flow
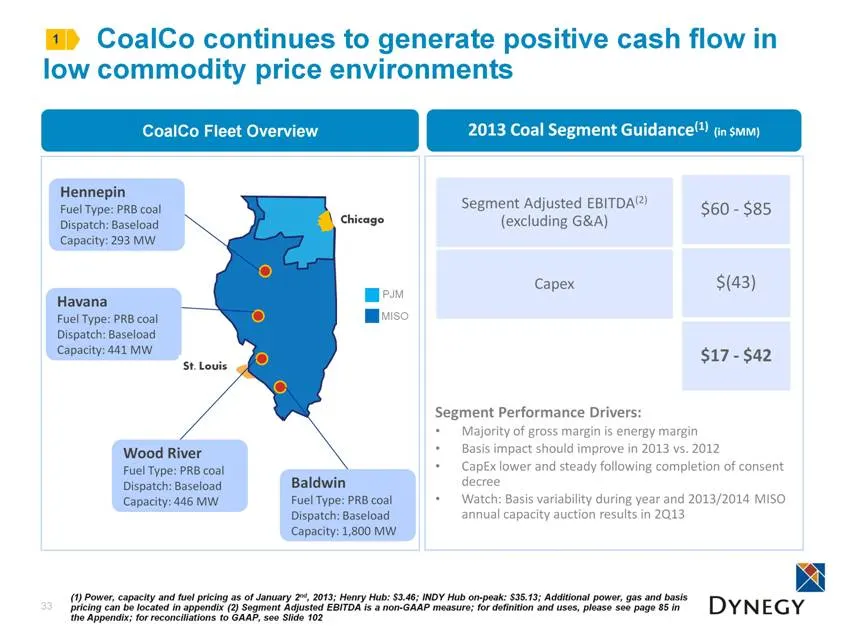
CoalCo continues to generate positive cash flow in low commodity price environments 33 CoalCo Fleet Overview PJM MISO Chicago 1 (1) Power, capacity and fuel pricing as of January 2nd, 2013; Henry Hub: $3.46; INDY Hub on-peak: $35.13; Additional power, gas and basis pricing can be located in appendix
Slide 34: Sustainable low-cost competitive advantage
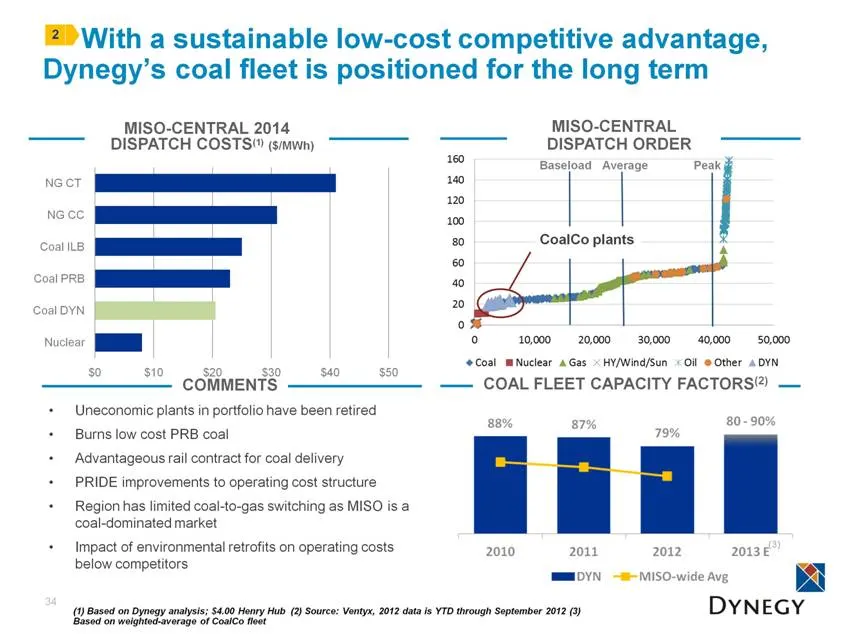
With a sustainable low-cost competitive advantage, Dynegy’s coal fleet is positioned for the long term 34 MISO-CENTRAL 2014 DISPATCH COSTS(1) ($/MWh) MISO-CENTRAL DISPATCH ORDER Uneconomic plants in portfolio have been retired Burns low cost PRB coal Advantageous rail contract for coal delivery PRID
Slide 35: Environmental retrofits in place, capex to reduce
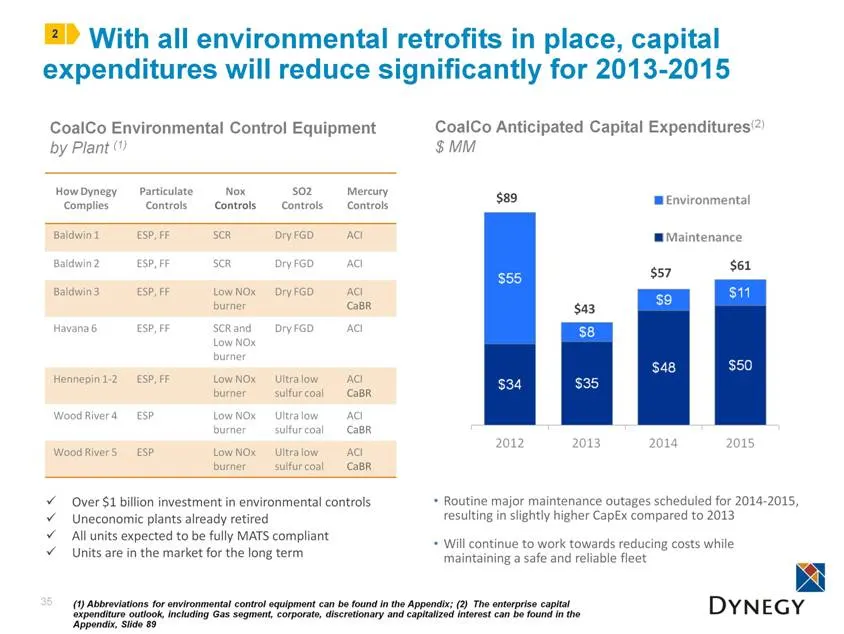
With all environmental retrofits in place, capital expenditures will reduce significantly for 2013-2015 35 Routine major maintenance outages scheduled for 2014-2015, resulting in slightly higher CapEx compared to 2013 Will continue to work towards reducing costs while maintaining a safe and reliable
Slide 36: 2012 basis greater than normal
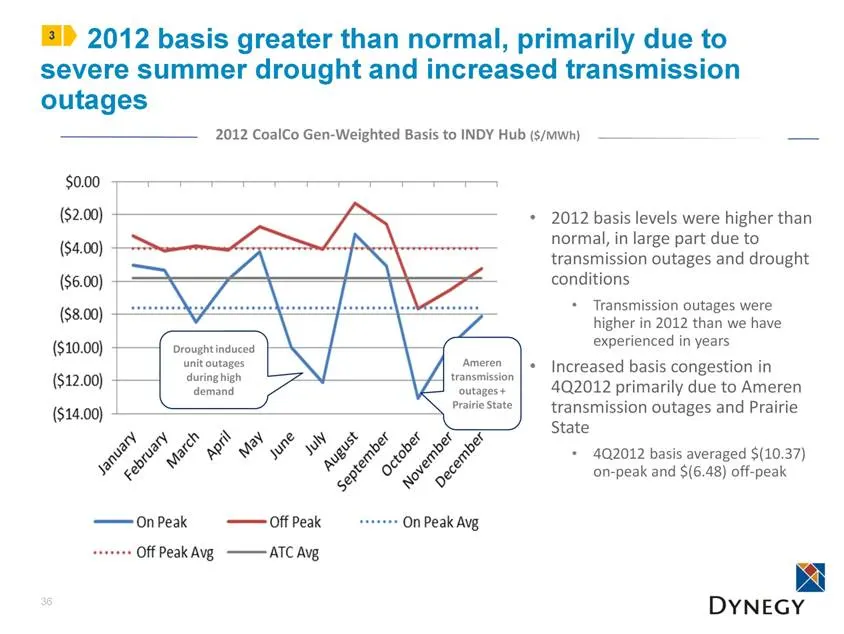
36 2012 basis greater than normal, primarily due to severe summer drought and increased transmission outages 3 Ameren transmission outages + Prairie State Drought induced unit outages during high demand 2012 basis levels were higher than normal, in large part due to transmission outages and drought
Slide 37: Expect return to more normal basis in 2013
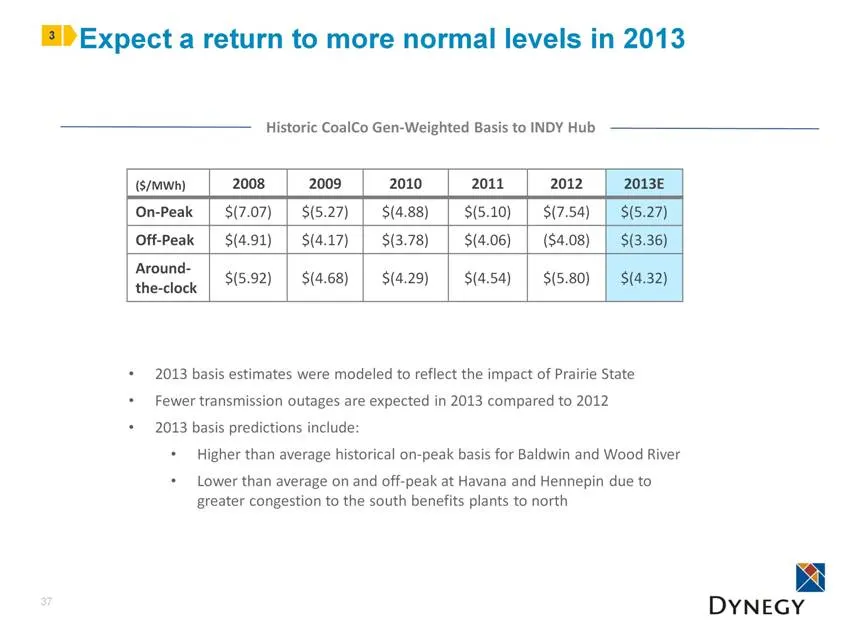
37 Expect a return to more normal levels in 2013 3 ($/MWh) 2008 2009 2010 2011 2012 2013E On-Peak $(7.07) $(5.27) $(4.88) $(5.10) $(7.54) $(5.27) Off-Peak $(4.91) $(4.17) $(3.78) $(4.06) ($4.08) $(3.36) Around-the-clock $(5.92) $(4.68) $(4.29) $(4.54) $(5.80) $(4.32) Historic CoalCo Gen-Weighted Bas
Slide 38: Addressing basis issues with two parallel efforts
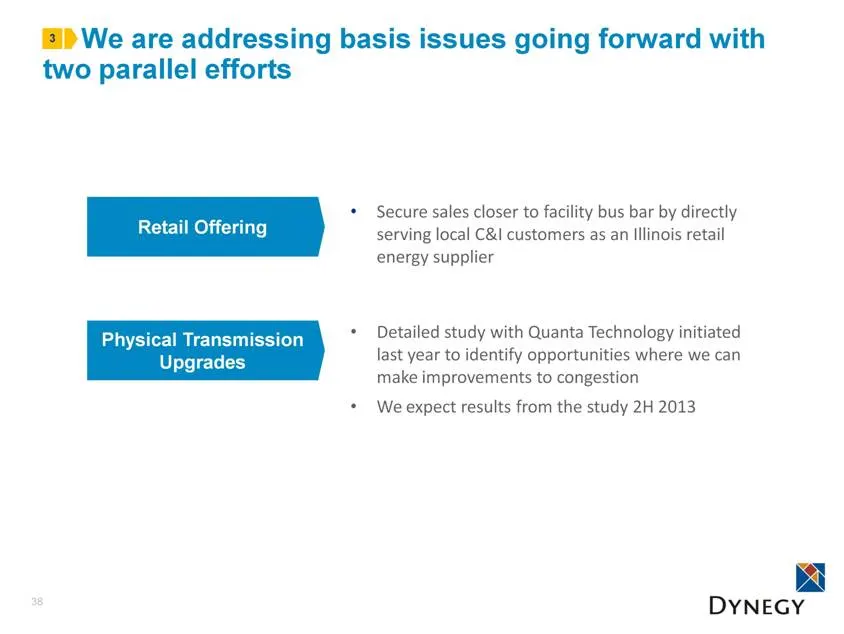
We are addressing basis issues going forward with two parallel efforts Retail Offering Physical Transmission Upgrades Secure sales closer to facility bus bar by directly serving local C&I customers as an Illinois retail energy supplier Detailed study with Quanta Technology initiated last year to ide
Slide 39: Re-entering the C&I retail business
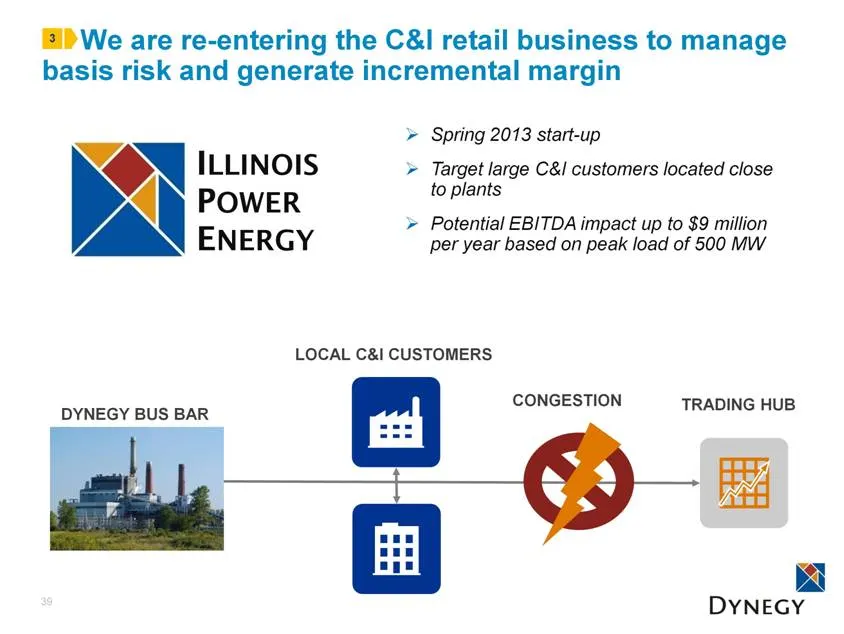
39 3 DYNEGY BUS BAR LOCAL C&I CUSTOMERS TRADING HUB CONGESTION We are re-entering the C&I retail business to manage basis risk and generate incremental margin Spring 2013 start-up Target large C&I customers located close to plants Potential EBITDA impact up to $9 million per year based on peak load
Slide 40: Target customers in Illinois territory
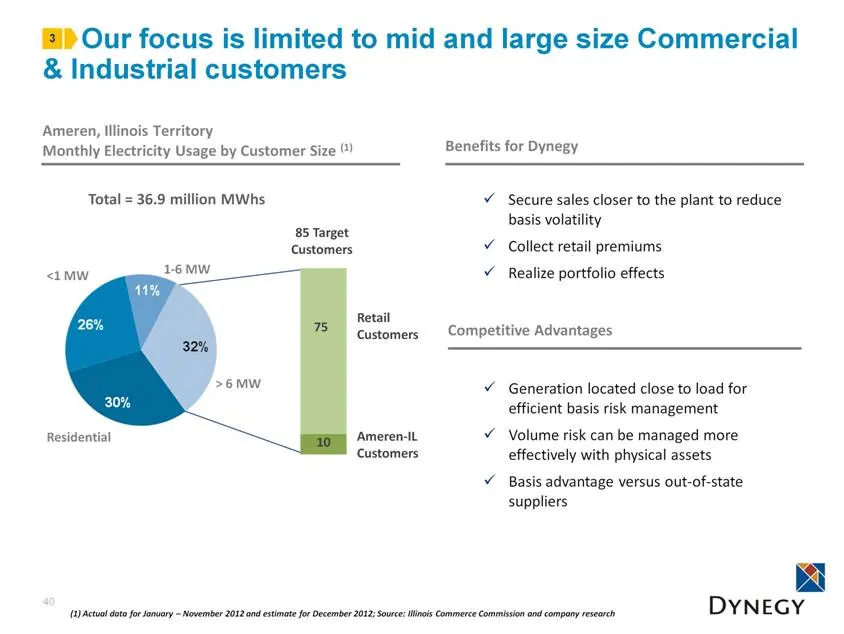
Ameren, Illinois Territory Monthly Electricity Usage by Customer Size (1) 40 85 Target Customers 1-6 MW <1 MW Residential > 6 MW 75 10 Retail Customers Ameren-IL Customers Benefits for Dynegy Our focus is limited to mid and large size Commercial & Industrial customers 3 (1) Actual data for January –
Slide 41: Transmission upgrades to relieve local congestion
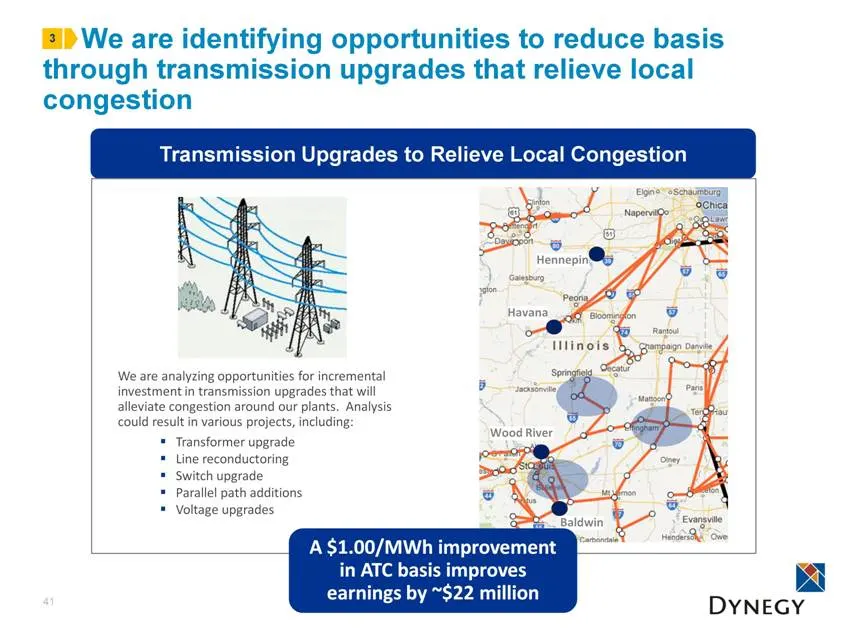
We are identifying opportunities to reduce basis through transmission upgrades that relieve local congestion 41 We are analyzing opportunities for incremental investment in transmission upgrades that will alleviate congestion around our plants. Analysis could result in various projects, including: T
Slide 42: CoalCo is more than a natural gas play
CoalCo is more than a natural gas play; retirements will have a positive impact on pricing 42 4 Natural Gas Prices Energy Prices As coal generation is retired, increased gas consumption by gas-fired generation is expected to be the critical component driving increasing natural gas demand Power price
Slide 43: Few competitors ready for MATS compliance deadline
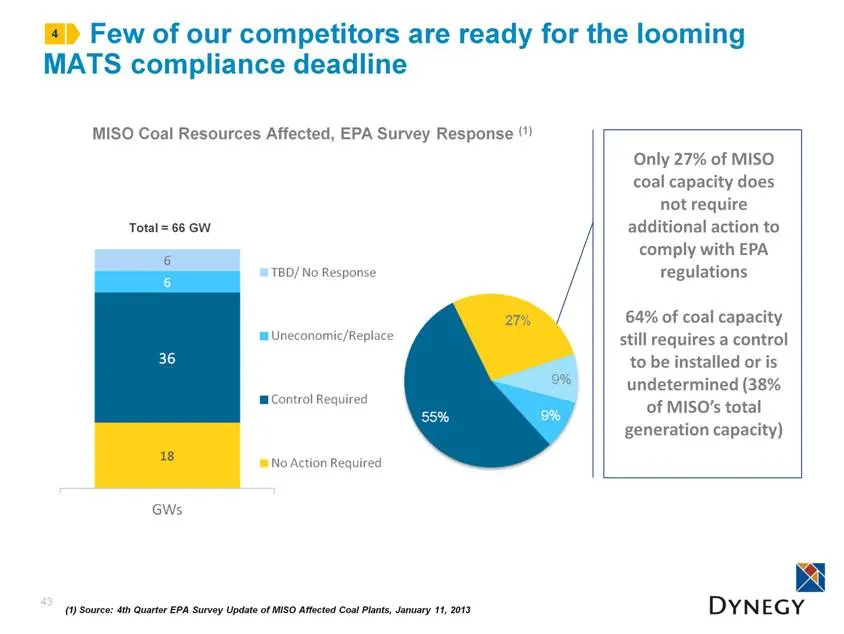
MISO Coal Resources Affected, EPA Survey Response (1) Total = 66 GW Few of our competitors are ready for the looming MATS compliance deadline 43 4 (1) Source: 4th Quarter EPA Survey Update of MISO Affected Coal Plants, January 11, 2013 Only 27% of MISO coal capacity does not require additional actio
Slide 44: Expected total net MISO retirements by 2016
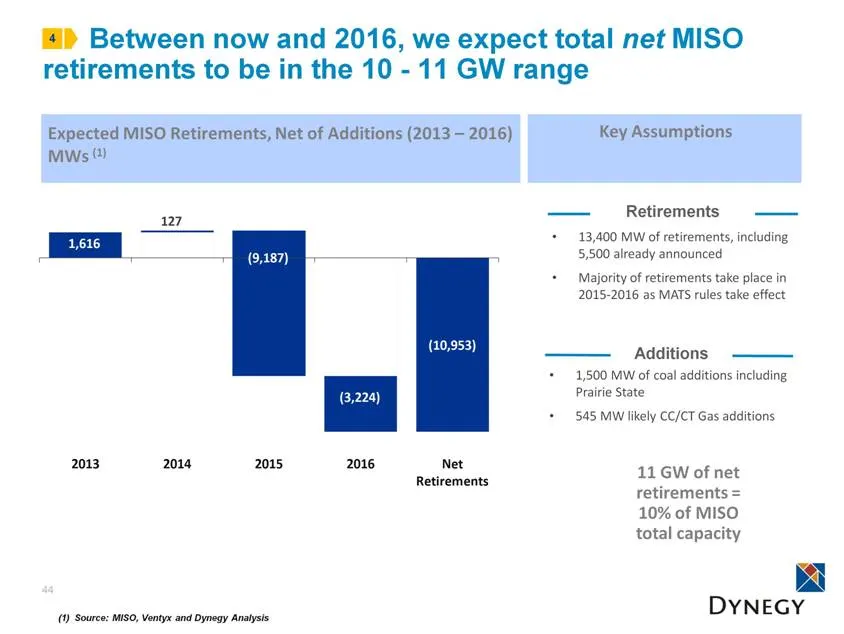
Between now and 2016, we expect total net MISO retirements to be in the 10 - 11 GW range 44 (1) Source: MISO, Ventyx and Dynegy Analysis 4 1,500 MW of coal additions including Prairie State 545 MW likely CC/CT Gas additions Additions 13,400 MW of retirements, including 5,500 already announced Majori
Slide 45: Reserve margins to tighten by 2016
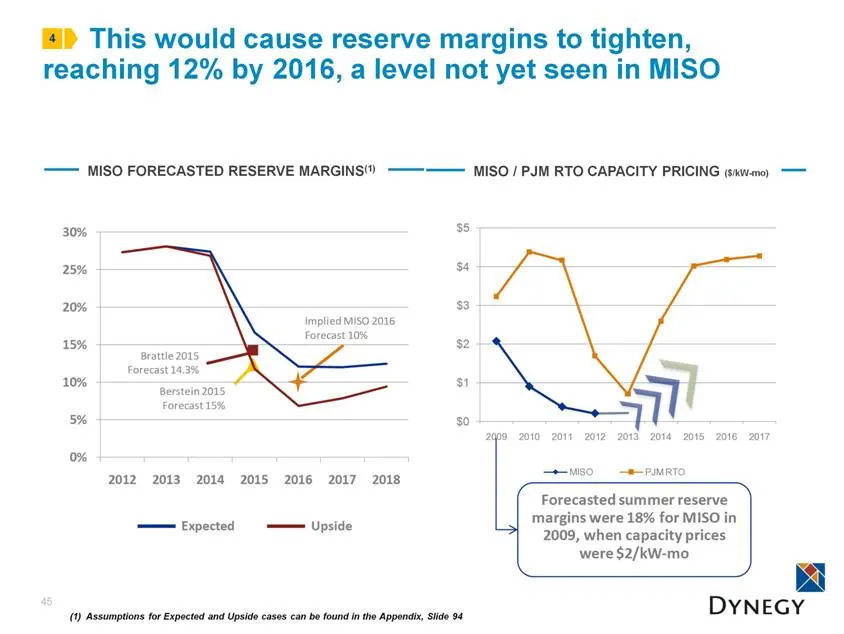
This would cause reserve margins to tighten, reaching 12% by 2016, a level not yet seen in MISO 45 MISO / PJM RTO CAPACITY PRICING ($/kW-mo) 4 MISO FORECASTED RESERVE MARGINS(1) (1) Assumptions for Expected and Upside cases can be found in the Appendix, Slide 94 $0 $1 $2 $3 $4 $5 2009 2010 2011 2012
Slide 46: Improving capacity prices could generate gross margin by 2016
46 CoalCo Capacity Revenues ($ MM) vs. MISO Capacity Prices ($/kW-mo) 2013 Level Improving capacity prices could generate $65M to $130M in gross margin by 2016 4 RESERVE MARGINS 27% 18% 2009 Level 15%? Potential 2016 Level?
Slide 47: Retirements could increase power prices around our fleet
Retirements could also increase power prices around our fleet and generate ~$85-$90M in additional revenue 47 MISO Central Dispatch Stacks (1) Current Generation Stack vs. Excluding 2.7GW Expected Retirements, net of Additions (1) Assumptions for MISO Central are: 2.7GW of capacity exiting by 2016 (
Slide 48: CoalCo Summary
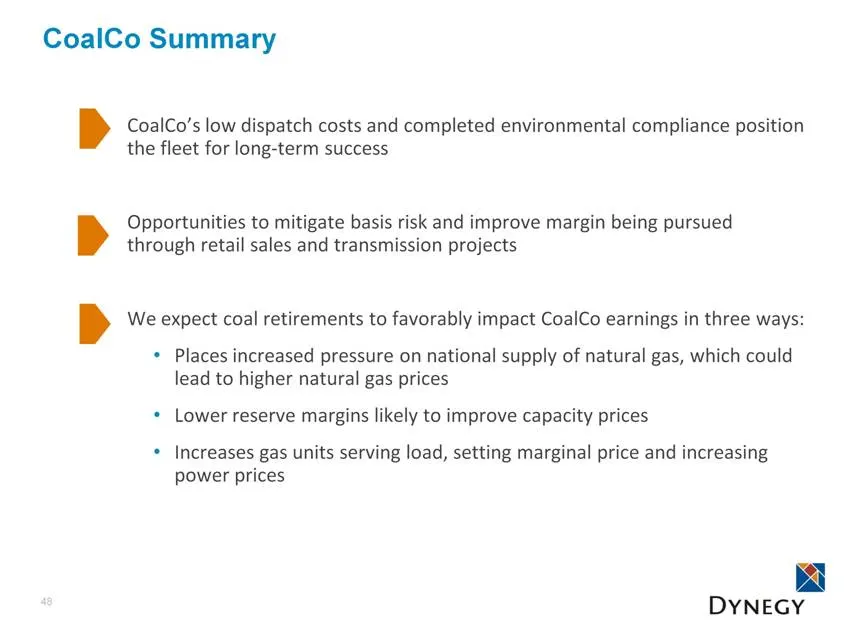
CoalCo Summary 48 CoalCo’s low dispatch costs and completed environmental compliance position the fleet for long-term success Opportunities to mitigate basis risk and improve margin being pursued through retail sales and transmission projects We expect coal retirements to favorably impact CoalCo ear
Slide 49: V. GasCo Review
V. GasCo Review Alan Padgett – VP, GasCo Asset Management 49
Slide 50: GasCo operates a diverse fleet generating steady cash flow
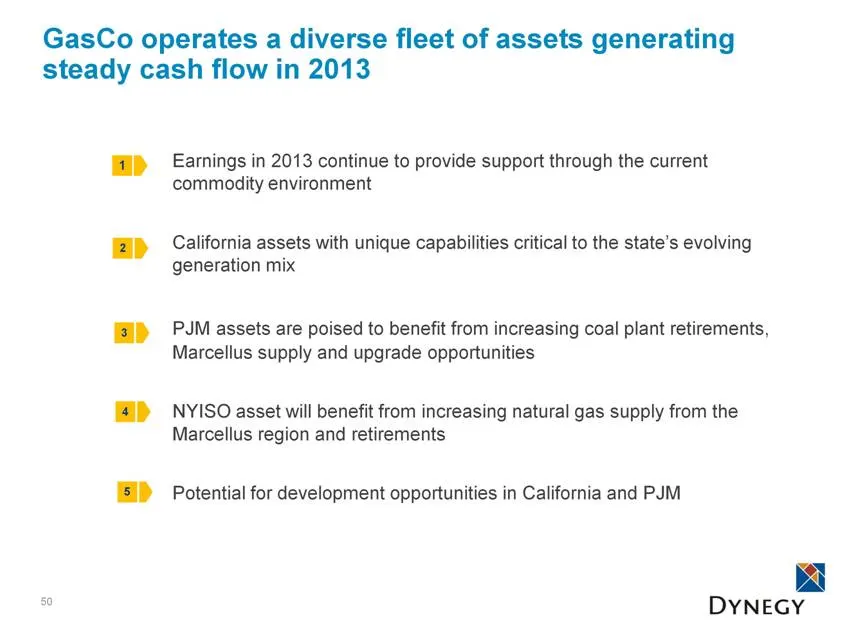
GasCo operates a diverse fleet of assets generating steady cash flow in 2013 50 Earnings in 2013 continue to provide support through the current commodity environment California assets with unique capabilities critical to the state’s evolving generation mix PJM assets are poised to benefit from incr
Slide 51: GasCo expected to generate strong earnings and cash flow in 2013
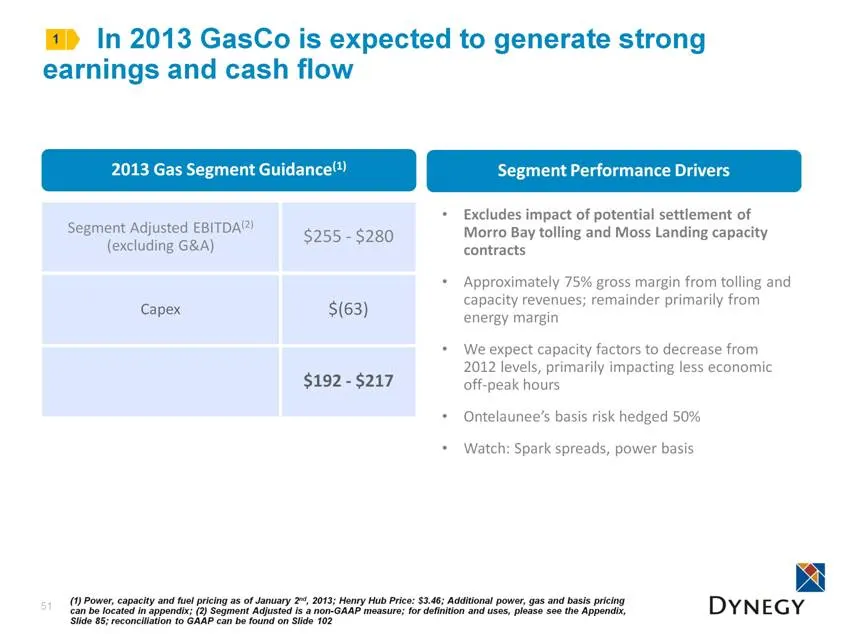
In 2013 GasCo is expected to generate strong earnings and cash flow 51 $255 - $280 $(63) $192 - $217 1 (1) Power, capacity and fuel pricing as of January 2nd, 2013; Henry Hub Price: $3.46; Additional power, gas and basis pricing can be located in appendix; (2) Segment Adjusted is a non-GAAP measure;
Slide 52: GasCo's fleet is located across four markets
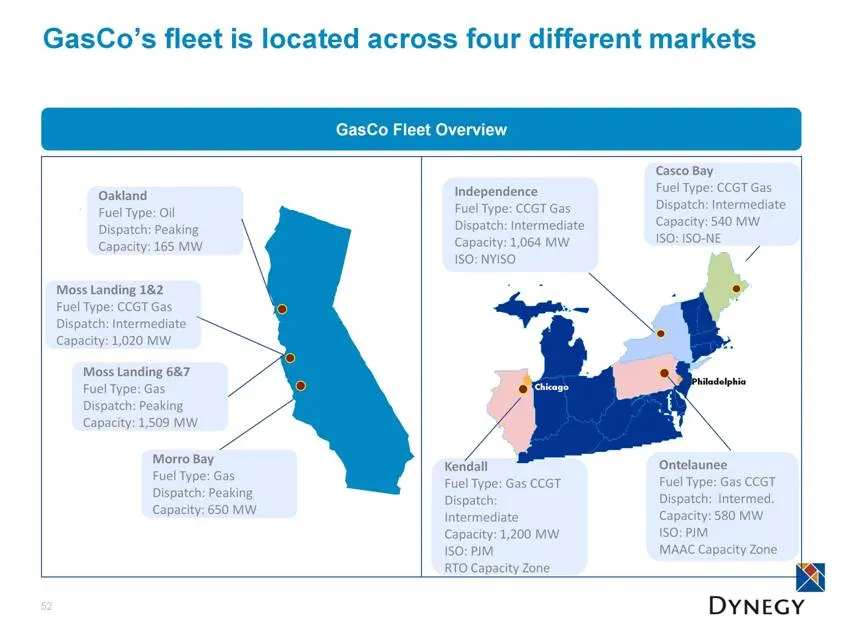
GasCo’s fleet is located across four different markets 52 GasCo Fleet Overview Ontelaunee Fuel Type: Gas CCGT Dispatch: Intermed. Capacity: 580 MW ISO: PJM MAAC Capacity Zone Kendall Fuel Type: Gas CCGT Dispatch: Intermediate Capacity: 1,200 MW ISO: PJM RTO Capacity Zone Casco Bay Fuel Type: CCGT Ga
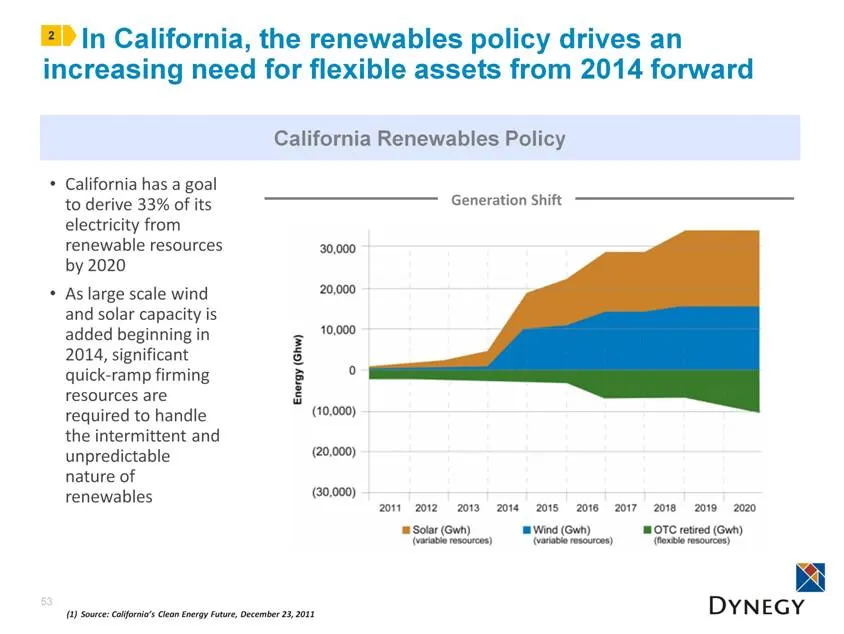
Slide 53: California renewables policy drives need for flexible assets
In California, the renewables policy drives an increasing need for flexible assets from 2014 forward 53 California has a goal to derive 33% of its electricity from renewable resources by 2020 As large scale wind and solar capacity is added beginning in 2014, significant quick-ramp firming resources
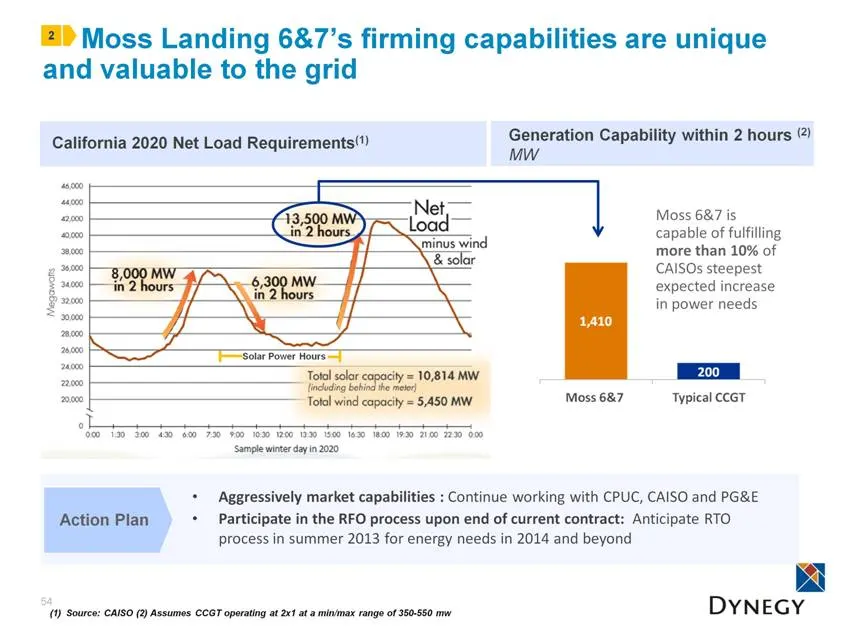
Slide 54: Moss Landing 6&7 firming capabilities are unique
Moss Landing 6&7’s firming capabilities are unique and valuable to the grid 54 54 California 2020 Net Load Requirements(1) 2 (1) Source: CAISO (2) Assumes CCGT operating at 2x1 at a min/max range of 350-550 mw Solar Power Hours Generation Capability within 2 hours (2) MW Moss 6&7 is capable of fulfi
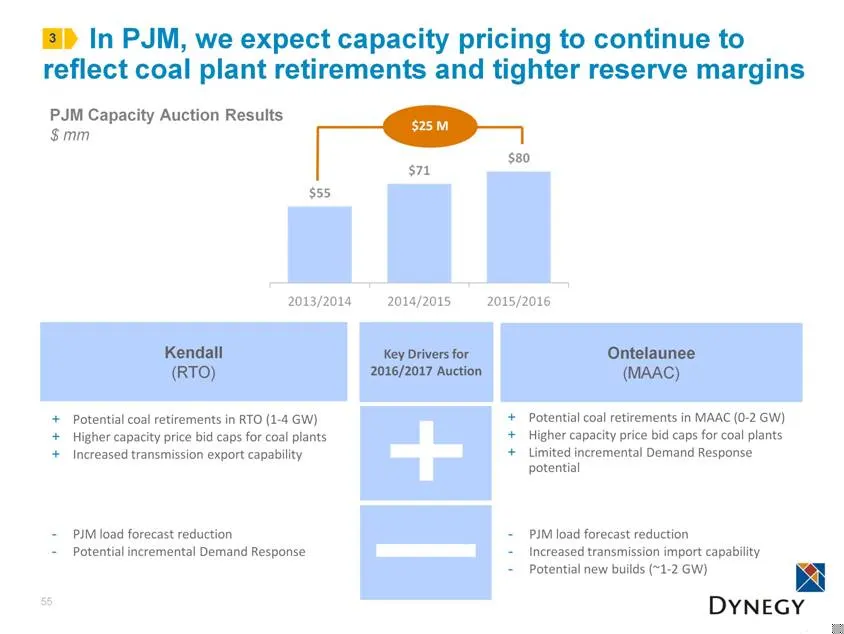
Slide 55: PJM capacity pricing to reflect coal retirements
In PJM, we expect capacity pricing to continue to reflect coal plant retirements and tighter reserve margins 55 3 Ontelaunee (MAAC) Kendall (RTO) PJM load forecast reduction Increased transmission import capability Potential new builds (~1-2 GW) Potential coal retirements in MAAC (0-2 GW) Higher cap
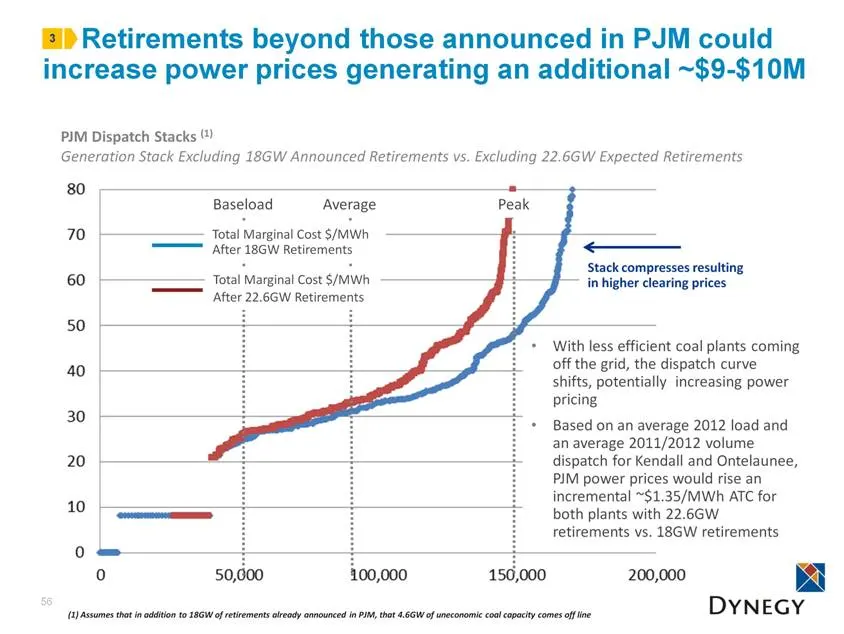
Slide 56: Retirements in PJM could increase power prices
Retirements beyond those announced in PJM could increase power prices generating an additional ~$9-$10M 56 PJM Dispatch Stacks (1) Generation Stack Excluding 18GW Announced Retirements vs. Excluding 22.6GW Expected Retirements 3 With less efficient coal plants coming off the grid, the dispatch curve
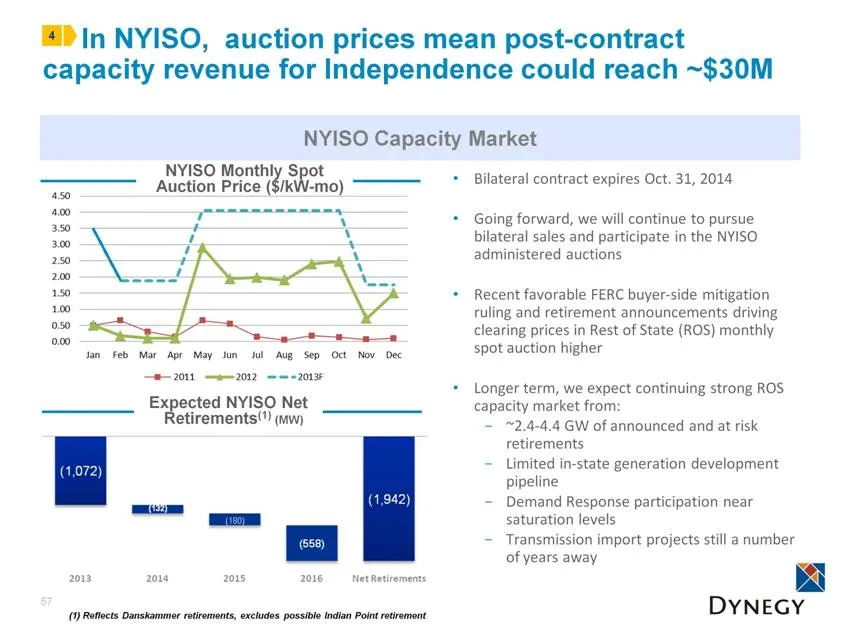
Slide 57: NYISO auction prices and post-contract capacity revenue
Bilateral contract expires Oct. 31, 2014 Going forward, we will continue to pursue bilateral sales and participate in the NYISO administered auctions Recent favorable FERC buyer-side mitigation ruling and retirement announcements driving clearing prices in Rest of State (ROS) monthly spot auction hi
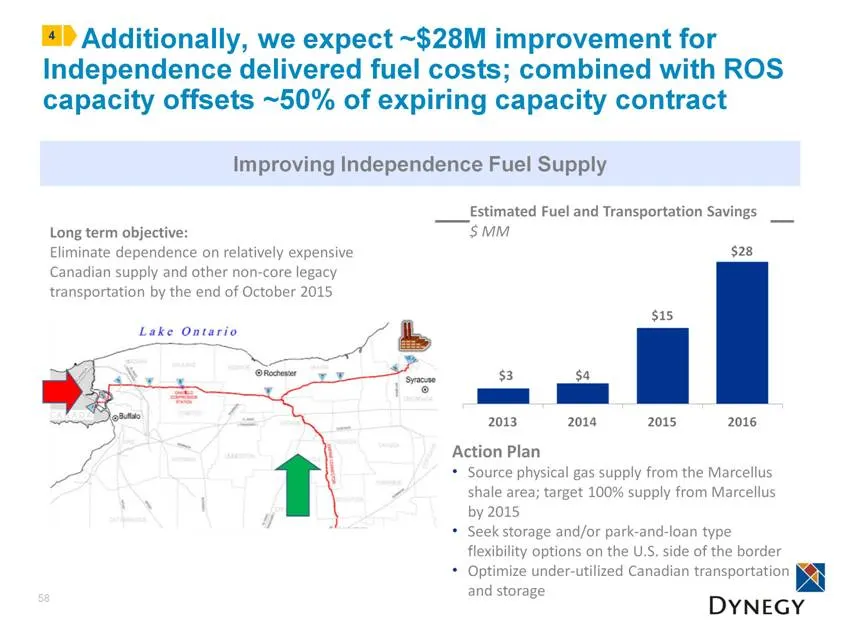
Slide 58: Improving Independence fuel supply
Additionally, we expect ~$28M improvement for Independence delivered fuel costs; combined with ROS capacity offsets ~50% of expiring capacity contract 58 Long term objective: Eliminate dependence on relatively expensive Canadian supply and other non-core legacy transportation by the end of October 2
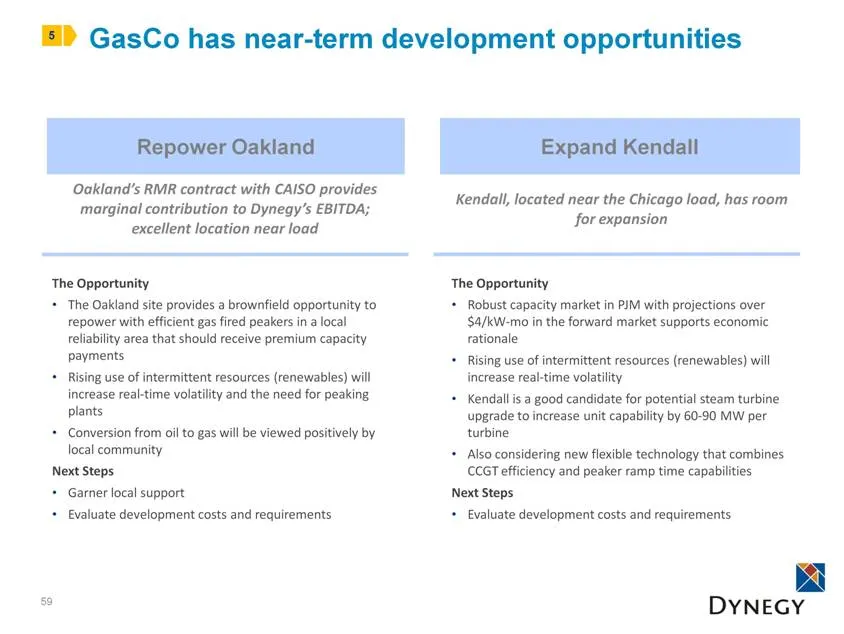
Slide 59: GasCo near-term development opportunities
GasCo has near-term development opportunities 59 Repower Oakland Expand Kendall Oakland’s RMR contract with CAISO provides marginal contribution to Dynegy’s EBITDA; excellent location near load The Opportunity The Oakland site provides a brownfield opportunity to repower with efficient gas fired pea
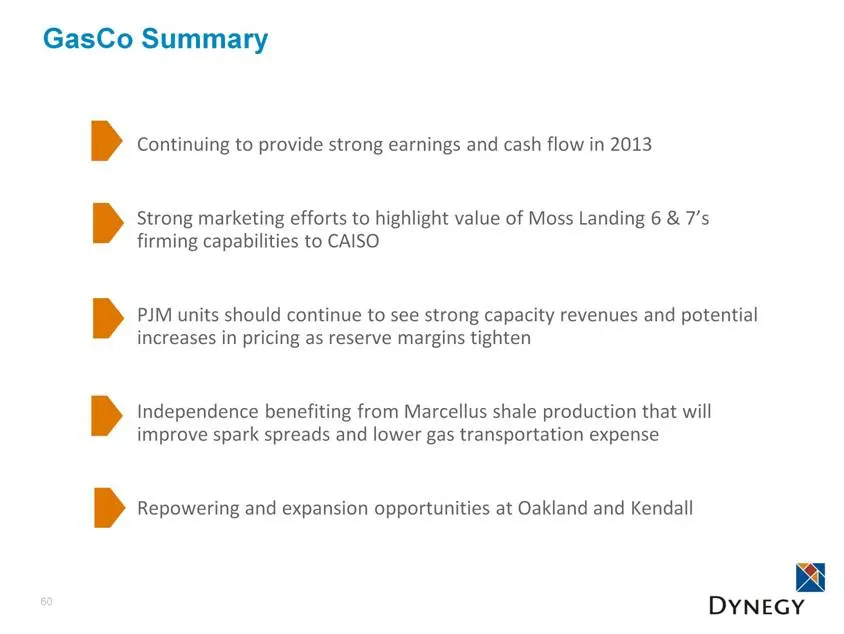
Slide 60: GasCo Summary
GasCo Summary Continuing to provide strong earnings and cash flow in 2013 Strong marketing efforts to highlight value of Moss Landing 6 & 7’s firming capabilities to CAISO PJM units should continue to see strong capacity revenues and potential increases in pricing as reserve margins tighten Independ
Slide 61: VI. Regulatory Update
VI. Regulatory Update Dean Ellis – Senior Director, Government Affairs
Slide 62: Vision and Visibility keys to regulatory success
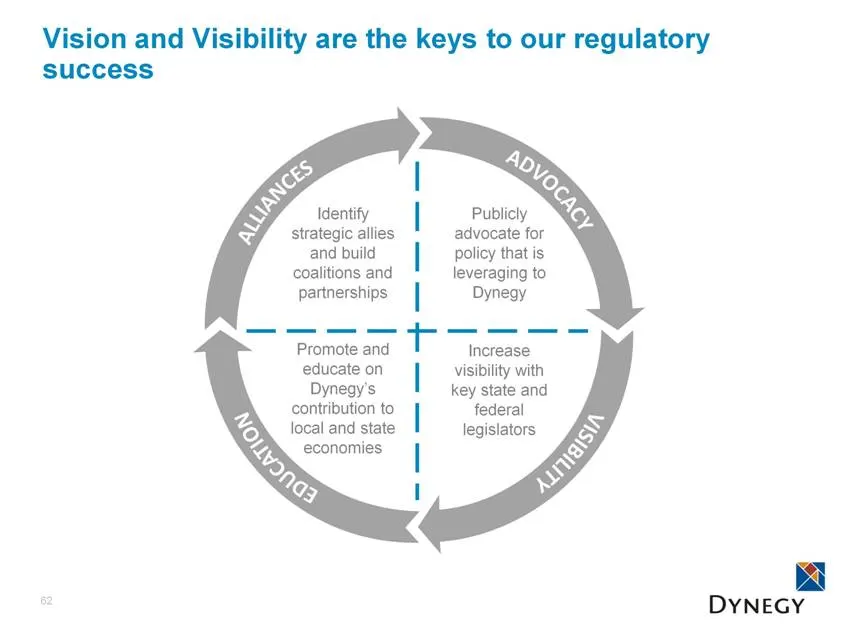
Vision and Visibility are the keys to our regulatory success 62 Identify strategic allies and build coalitions and partnerships Publicly advocate for policy that is leveraging to Dynegy Promote and educate on Dynegy’s contribution to local and state economies Increase visibility with key state and f
Slide 63: Focus on highest priority regulatory issues
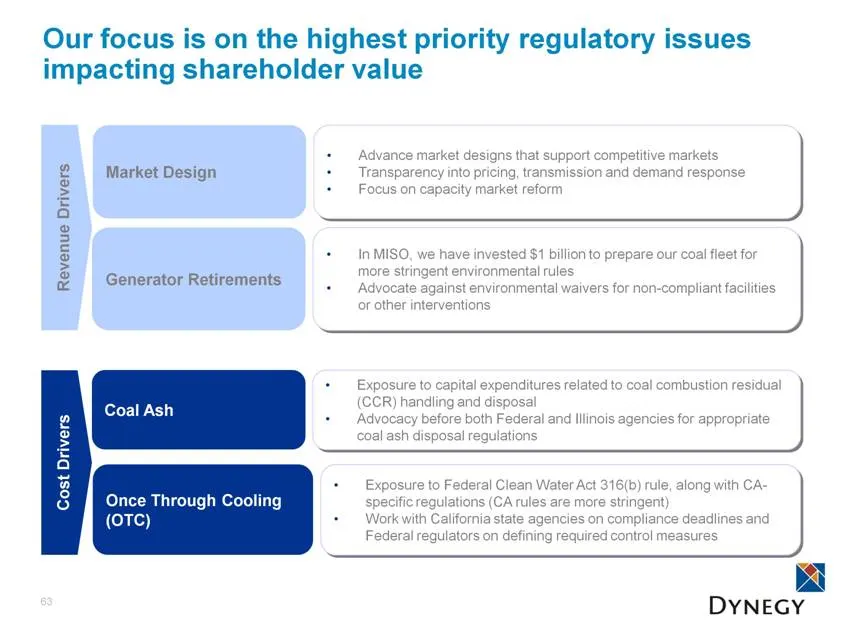
Our focus is on the highest priority regulatory issues impacting shareholder value 63 Market Design Advance market designs that support competitive markets Transparency into pricing, transmission and demand response Focus on capacity market reform Once Through Cooling (OTC) Coal Ash Generator Retire
Slide 64: Market Design efforts focusing on capacity markets
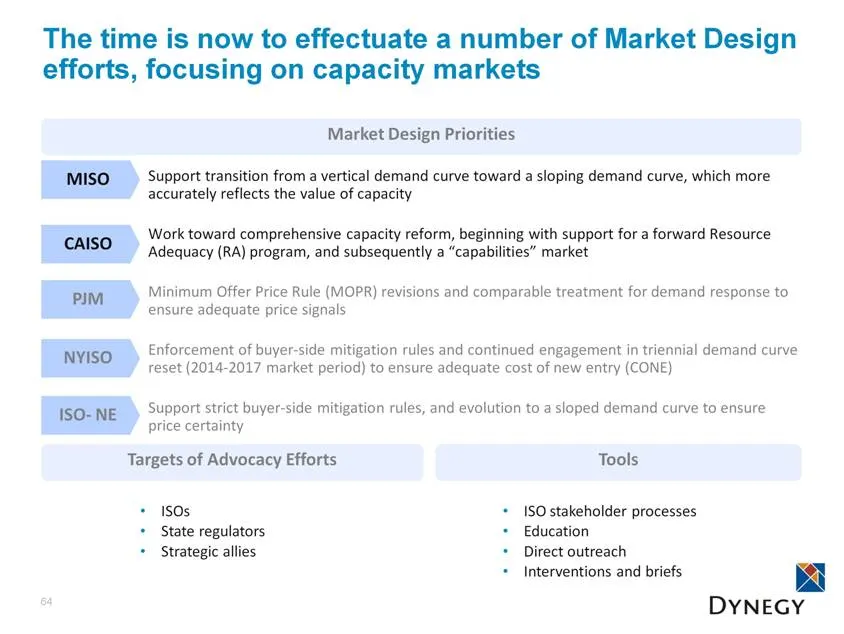
The time is now to effectuate a number of Market Design efforts, focusing on capacity markets Support transition from a vertical demand curve toward a sloping demand curve, which more accurately reflects the value of capacity Work toward comprehensive capacity reform, beginning with support for a fo
Slide 65: Advocate for a level playing field on retirements
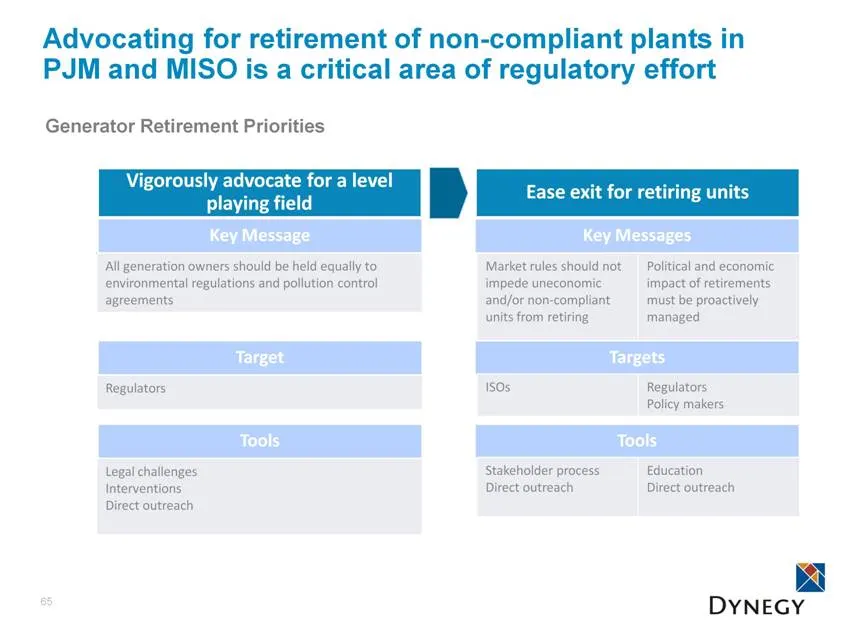
Vigorously advocate for a level playing field Advocating for retirement of non-compliant plants in PJM and MISO is a critical area of regulatory effort 65 Generator Retirement Priorities All generation owners should be held equally to environmental regulations and pollution control agreements Key Me
Slide 66: MATS is unlikely to be overturned
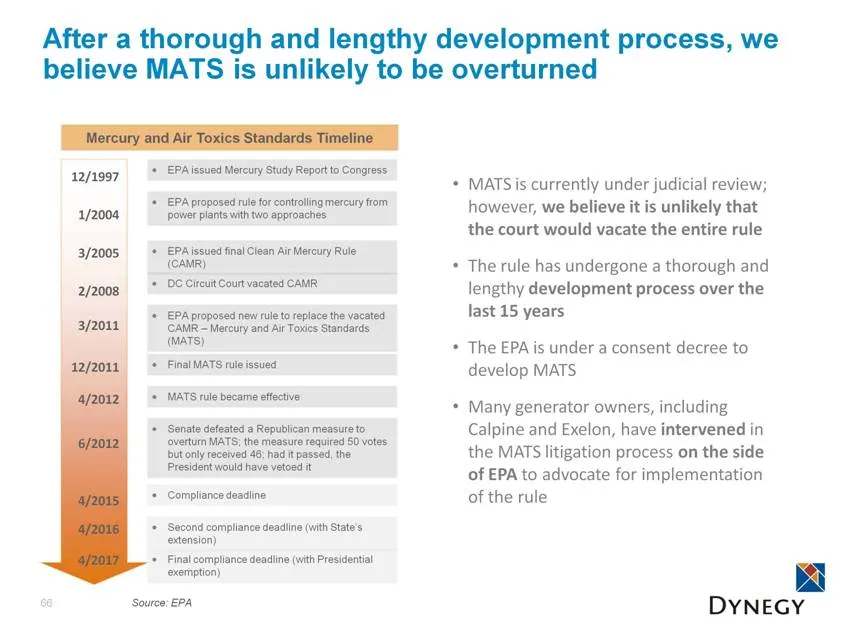
After a thorough and lengthy development process, we believe MATS is unlikely to be overturned 66 12/1997 EPA issued Mercury Study Report to Congress 1/2004 EPA proposed rule for controlling mercury from power plants with two approaches 3/2005 EPA issued final Clean Air Mercury Rule (CAMR) 2/2008 DC
Slide 67: The clock is ticking on MATS compliance
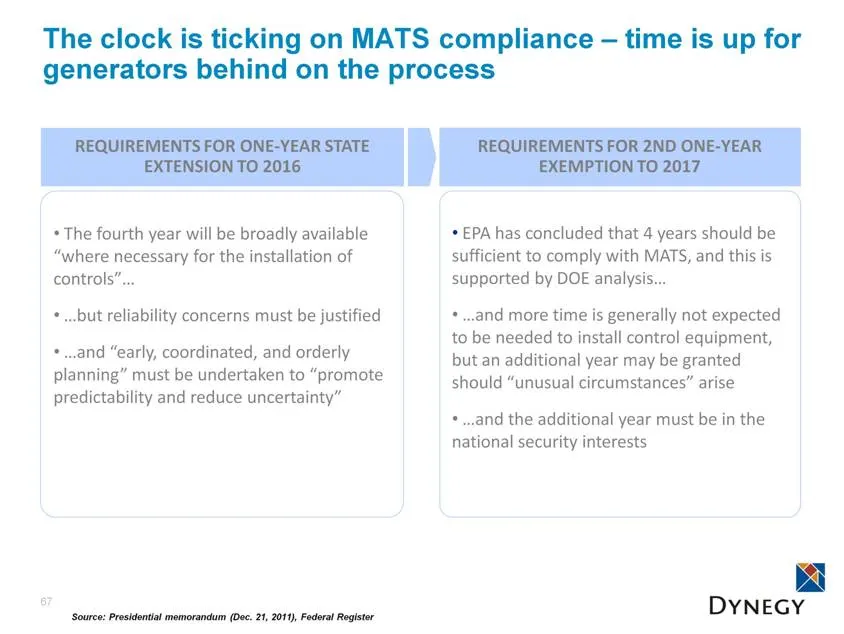
The clock is ticking on MATS compliance – time is up for generators behind on the process 67 The fourth year will be broadly available “where necessary for the installation of controls” but reliability concerns must be justified and “early, coordinated, and orderly planning” must be undertaken to “p
Slide 68: Coal Ash and California Once Through Cooling
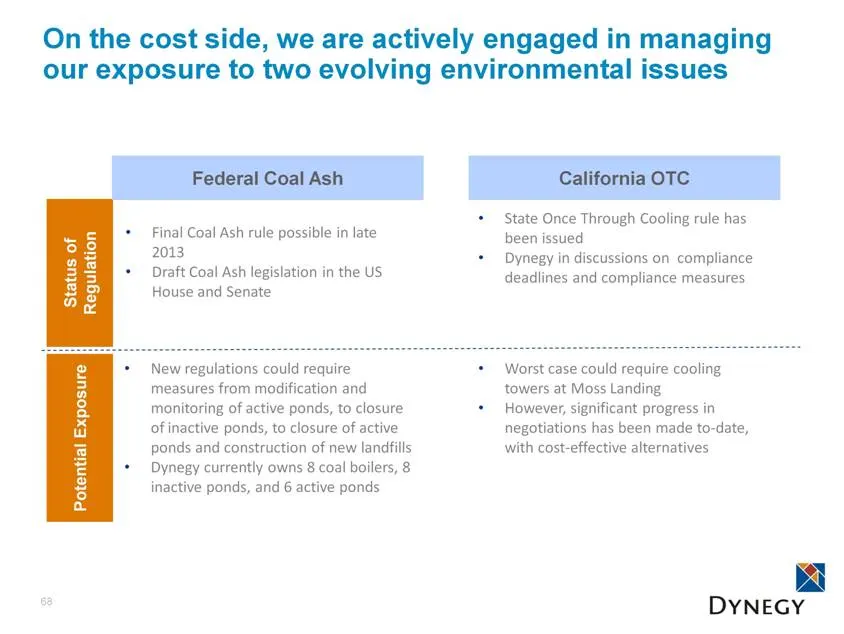
68 Federal Coal Ash California OTC State Once Through Cooling rule has been issued Dynegy in discussions on compliance deadlines and compliance measures Worst case could require cooling towers at Moss Landing However, significant progress in negotiations has been made to-date, with cost-effective al
Slide 69: Regulatory Summary
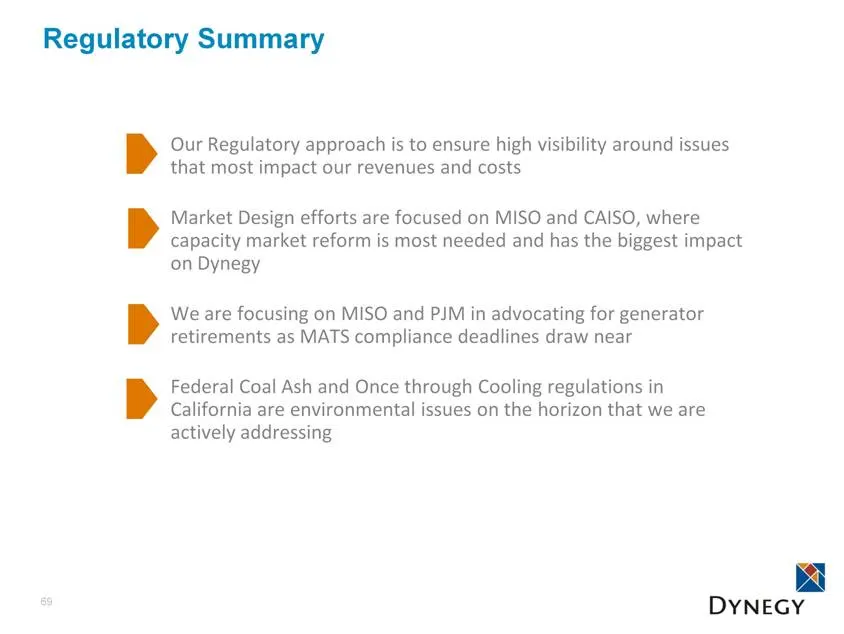
Regulatory Summary Our Regulatory approach is to ensure high visibility around issues that most impact our revenues and costs Market Design efforts are focused on MISO and CAISO, where capacity market reform is most needed and has the biggest impact on Dynegy We are focusing on MISO and PJM in advoc
Slide 70: VII. 2012-2013 Guidance Estimates and Financial Review
VII. 2012-2013 Guidance Estimates and Financial Review Clint Freeland - CFO
Slide 71: 2013 Financial Review and Goals
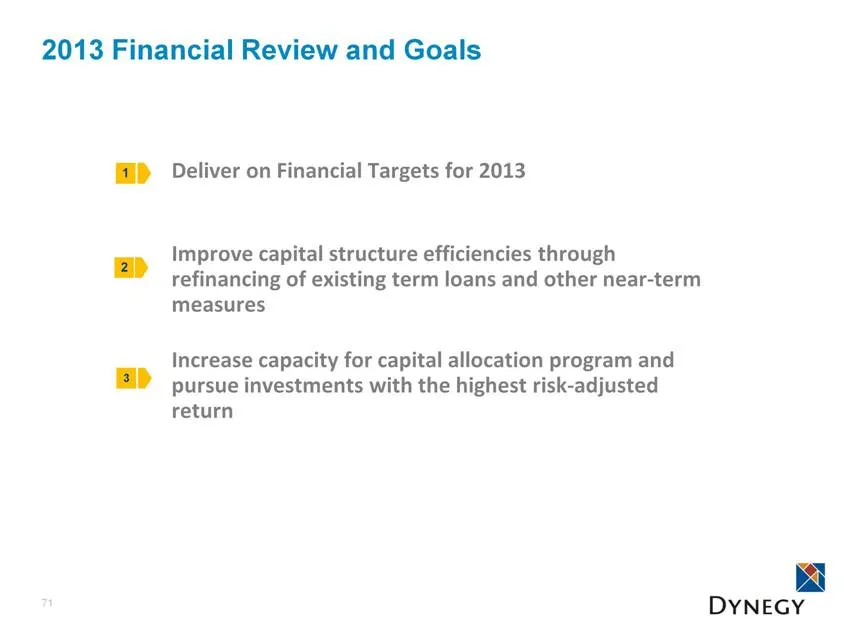
71 2013 Financial Review and Goals Deliver on Financial Targets for 2013 Improve capital structure efficiencies through refinancing of existing term loans and other near-term measures Increase capacity for capital allocation program and pursue investments with the highest risk-adjusted return 1 2 3
Slide 72: 2013 Guidance – Notes and Major Assumptions
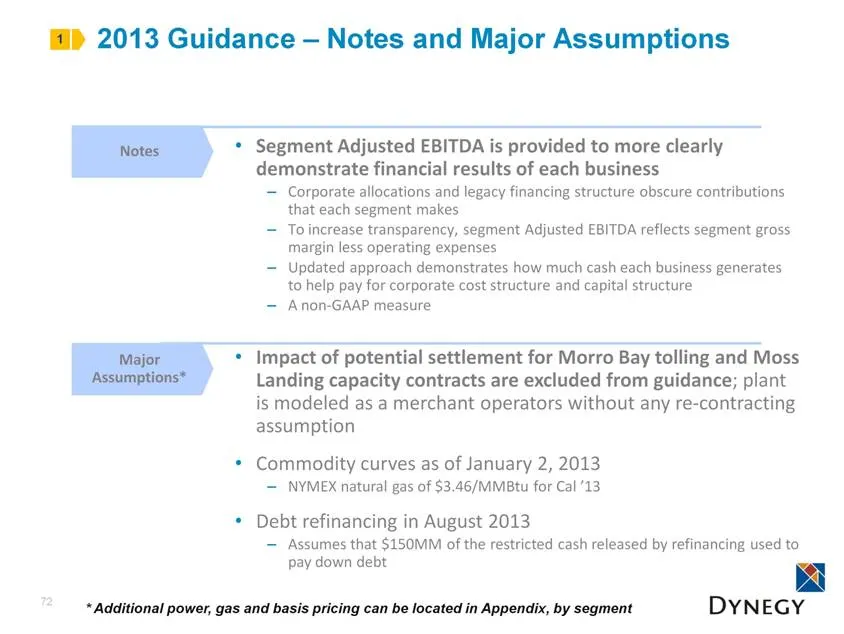
2013 Guidance – Notes and Major Assumptions Segment Adjusted EBITDA is provided to more clearly demonstrate financial results of each business Corporate allocations and legacy financing structure obscure contributions that each segment makes To increase transparency, segment Adjusted EBITDA reflects
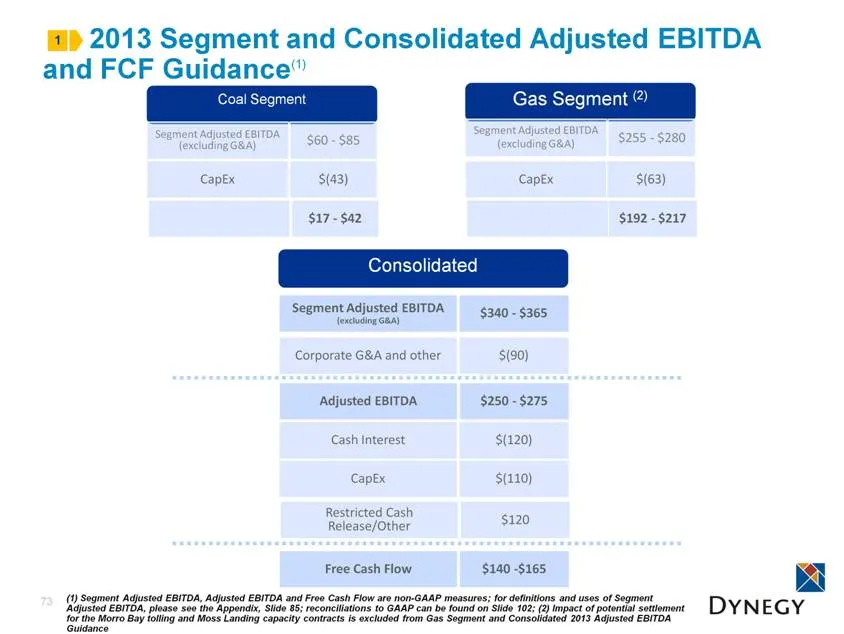
Slide 73: 2013 Segment and Consolidated Adjusted EBITDA and FCF Guidance
2013 Segment and Consolidated Adjusted EBITDA and FCF Guidance(1) 73 Gas Segment (2) Segment Adjusted EBITDA (excluding G&A) $255 - $280 Consolidated Segment Adjusted EBITDA (excluding G&A) $340 - $365 Cash Interest $(120) Free Cash Flow $140 -$165 CapEx $(110) CapEx $(63) Coal Segment Segment Adjus
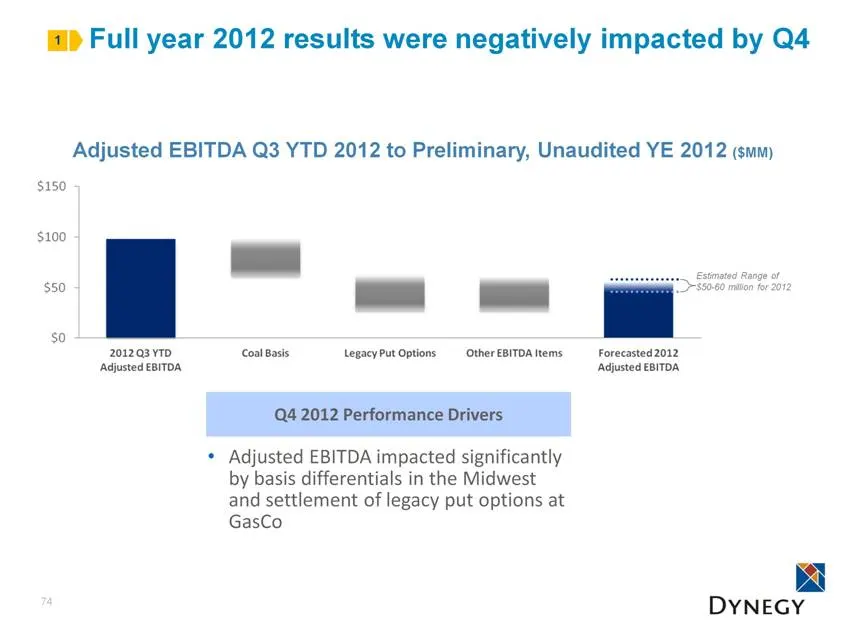
Slide 74: Full year 2012 results negatively impacted by Q4
Full year 2012 results were negatively impacted by Q4 74 1 Estimated Range of $50-60 million for 2012 Q4 2012 Performance Drivers Adjusted EBITDA impacted significantly by basis differentials in the Midwest and settlement of legacy put options at GasCo Adjusted EBITDA Q3 YTD 2012 to Preliminary, Una
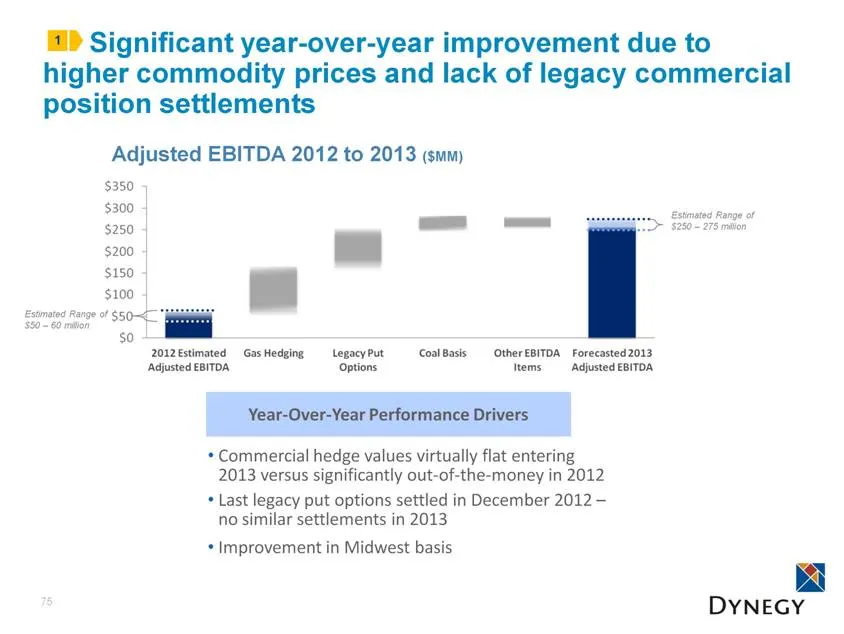
Slide 75: Adjusted EBITDA 2012 to 2013
75 Adjusted EBITDA 2012 to 2013 ($MM) Estimated Range of $250 – 275 million Estimated Range of $50 – 60 million 1 Significant year-over-year improvement due to higher commodity prices and lack of legacy commercial position settlements Year-Over-Year Performance Drivers Commercial hedge values virtua
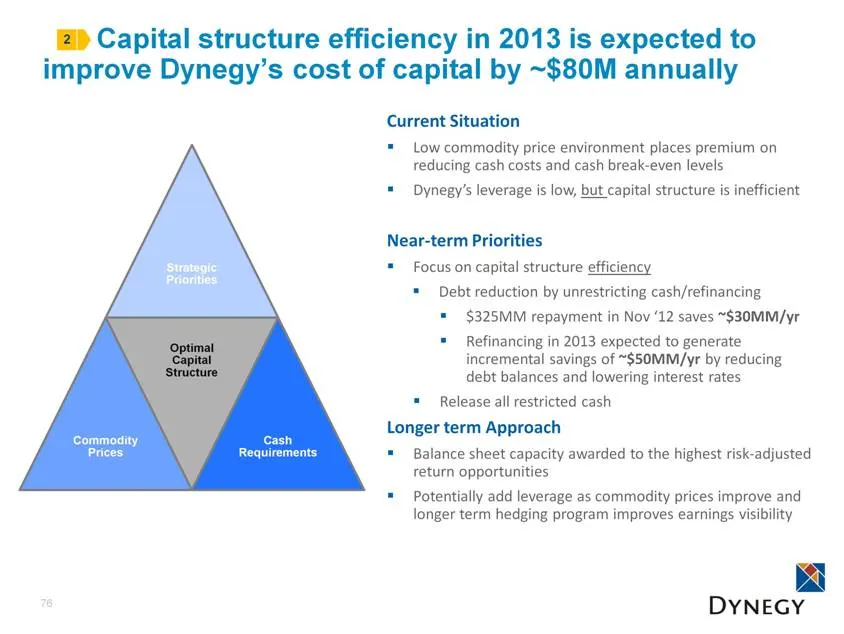
Slide 76: Capital structure efficiency to improve cost of capital
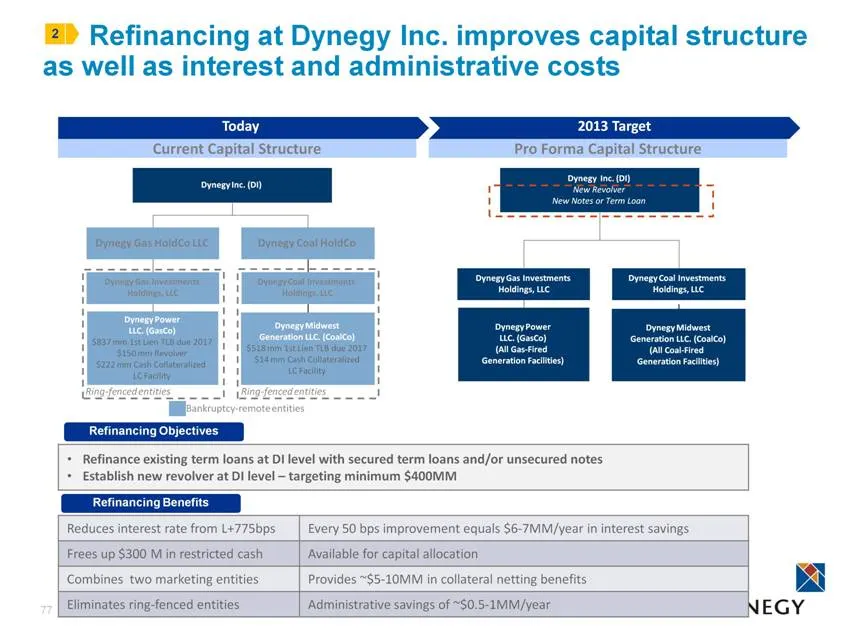
Capital structure efficiency in 2013 is expected to improve Dynegy’s cost of capital by ~$80M annually 76 2 Current Situation Low commodity price environment places premium on reducing cash costs and cash break-even levels Dynegy’s leverage is low, but capital structure is inefficient Near-term Prio
Slide 77: Refinancing Objectives
Refinancing Objectives Refinancing at Dynegy Inc. improves capital structure as well as interest and administrative costs 77 Dynegy Inc. (DI) Dynegy Coal HoldCo Ring-fenced entities Ring-fenced entities Dynegy Gas HoldCo LLC Dynegy Midwest Generation LLC. (CoalCo) $518 mm 1st Lien TLB due 2017 $14 m
Slide 78: Steps to improve balance sheet and liquidity
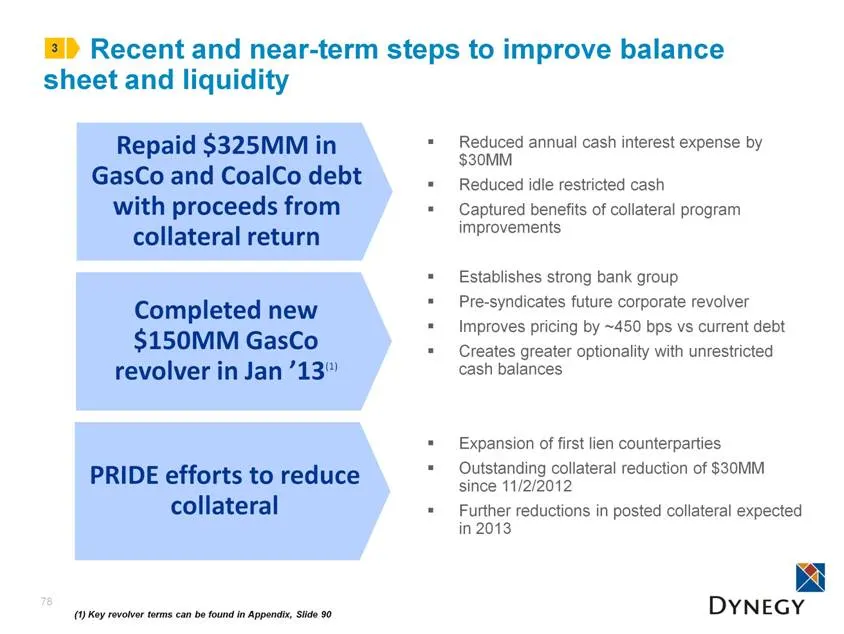
Recent and near-term steps to improve balance sheet and liquidity Reduced annual cash interest expense by $30MM Reduced idle restricted cash Captured benefits of collateral program improvements Establishes strong bank group Pre-syndicates future corporate revolver Improves pricing by ~450 bps vs cur
Slide 79: Refinancing key to increasing capital allocation capacity
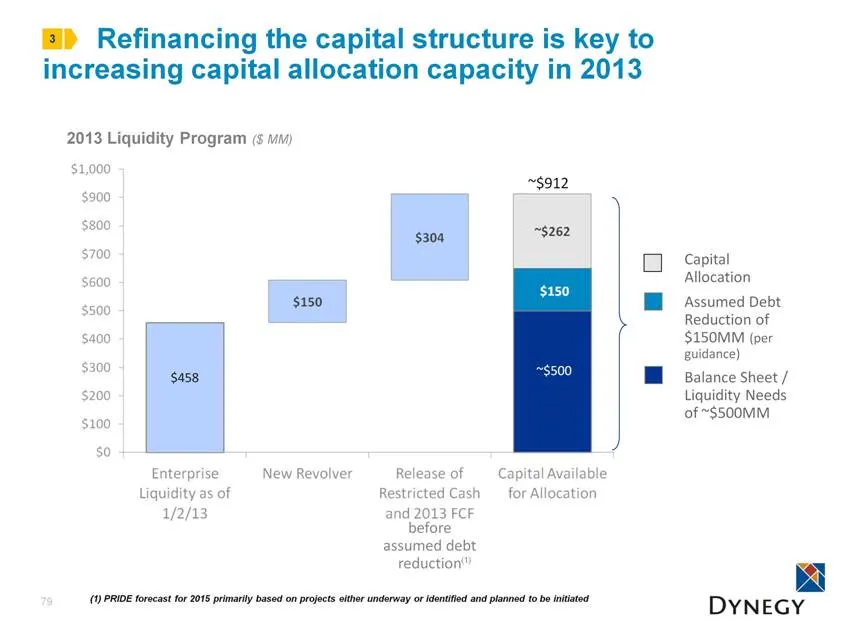
79 (1) PRIDE forecast for 2015 primarily based on projects either underway or identified and planned to be initiated Refinancing the capital structure is key to increasing capital allocation capacity in 2013 2013 Liquidity Program ($ MM) 3 Capital Allocation Assumed Debt Reduction of $150MM (per gui
Slide 80: Financial Summary
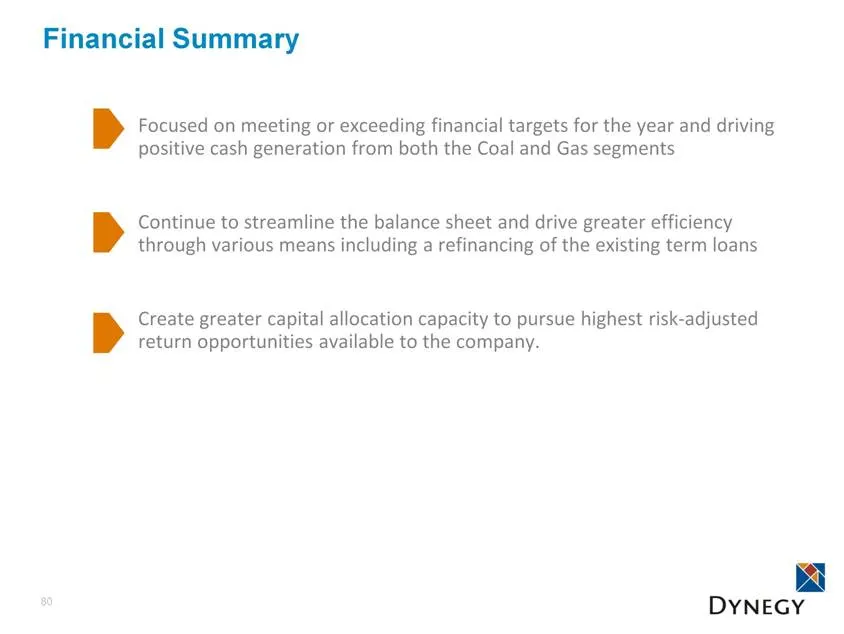
Financial Summary Focused on meeting or exceeding financial targets for the year and driving positive cash generation from both the Coal and Gas segments Continue to streamline the balance sheet and drive greater efficiency through various means including a refinancing of the existing term loans Cre
Slide 81: VIII. Closing Remarks and Q&A
VIII. Closing Remarks and Q&A
Slide 82: Dynegy's Path to $500 million
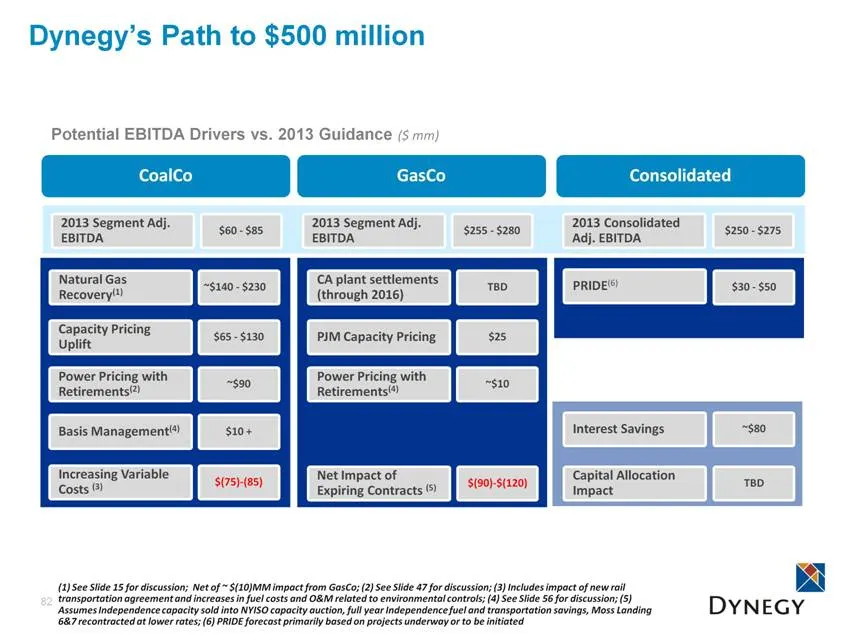
Dynegy’s Path to $500 million 82 Natural Gas Recovery(1) Capacity Pricing Uplift $65 - $130 ~$140 - $230 Power Pricing with Retirements(2) ~$90 Increasing Variable Costs (3) $(75)-(85) CA plant settlements (through 2016) PJM Capacity Pricing $25 TBD Net Impact of Expiring Contracts (5) $(90)-$(120)
Slide 83: Attractive value-oriented investment opportunity
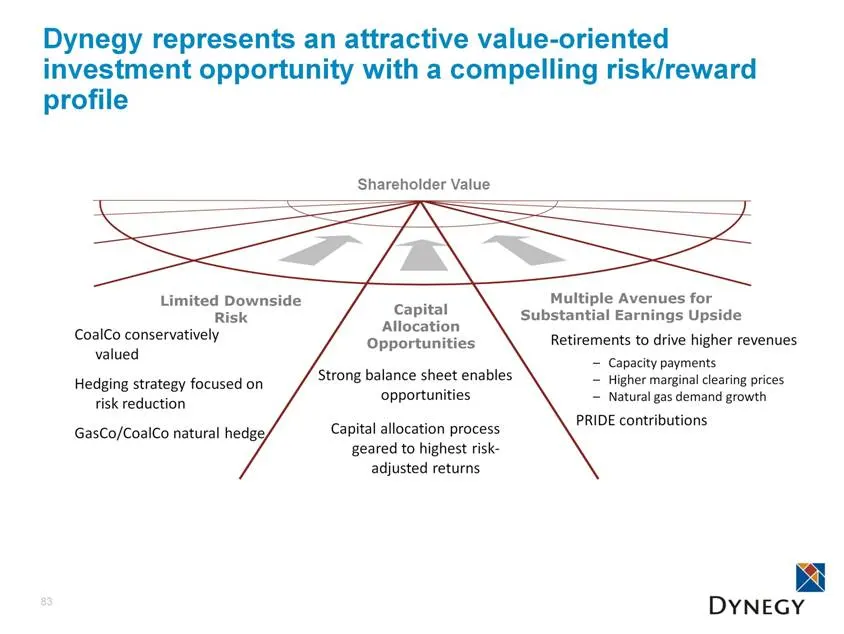
Dynegy represents an attractive value-oriented investment opportunity with a compelling risk/reward profile 83 Shareholder Value Limited Downside Risk Capital Allocation Opportunities CoalCo conservatively valued Hedging strategy focused on risk reduction GasCo/CoalCo natural hedge Retirements to dr
Slide 84: Appendix
Appendix
Slide 85: Segment Adjusted EBITDA Definition
Segment Adjusted EBITDA Definition Segment Adjusted EBITDA is a non-GAAP measure which is utilized to more clearly demonstrate the financial results of each business segment. The measure reflects segment gross margin less operating expenses. Corporate allocations such as general and administrative e
Slide 86: Dynegy Generation Facilities
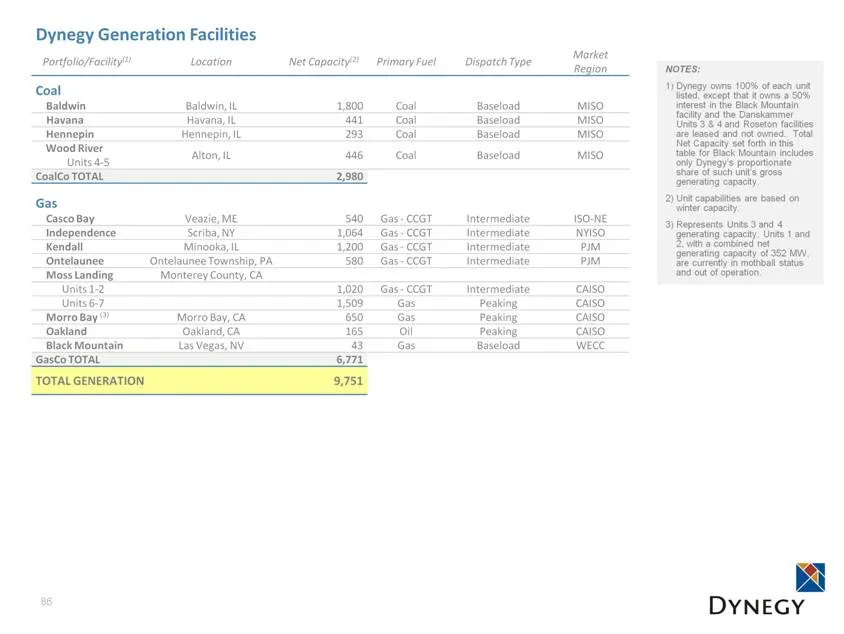
86 Dynegy Generation Facilities Portfolio/Facility(1) Location Net Capacity(2) Primary Fuel Dispatch Type Market Region Coal Baldwin Baldwin, IL 1,800 Coal Baseload MISO Havana Havana, IL 441 Coal Baseload MISO Hennepin Hennepin, IL 293 Coal Baseload MISO Wood River Units 4-5 Alton, IL 446 Coal Base
Slide 87: Appendix – Financial
Appendix Financial im DYNEGY
Slide 88: Enterprise Valuation
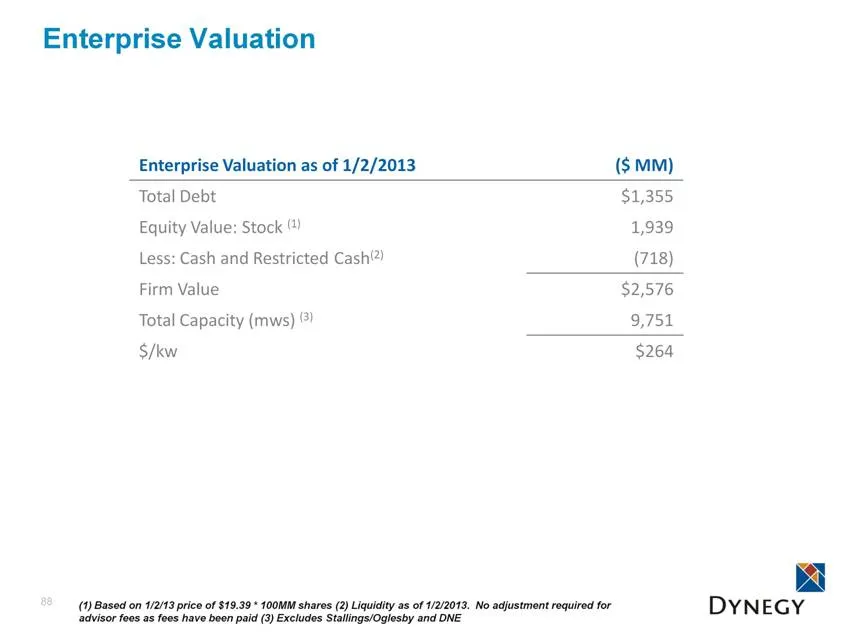
Enterprise Valuation Enterprise Valuation as of 1/2/2013 ($ MM) Total Debt $1,355 Equity Value: Stock (1) 1,939 Less: Cash and Restricted Cash(2) (718) Firm Value $2,576 Total Capacity (mws) (3) 9,751 $/kw $264 88 (1) Based on 1/2/13 price of $19.39 * 100MM shares (2) Liquidity as of 1/2/2013. No ad
Slide 89: Anticipated Capital Expenditures (2013–2015)
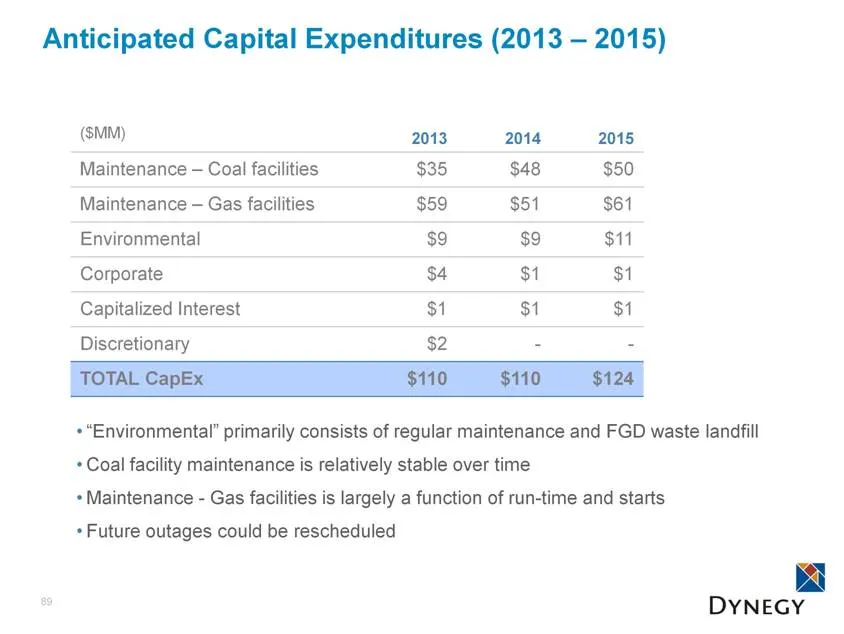
Anticipated Capital Expenditures (2013 – 2015) ($MM) 2013 2014 2015 Maintenance – Coal facilities $35 $48 $50 Maintenance – Gas facilities $59 $51 $61 Environmental $9 $9 $11 Corporate $4 $1 $1 Capitalized Interest $1 $1 $1 Discretionary $2 - - TOTAL CapEx $110 $110 $124 89 “Environmental” primarily
Slide 90: New GasCo revolver diversifies liquidity sources
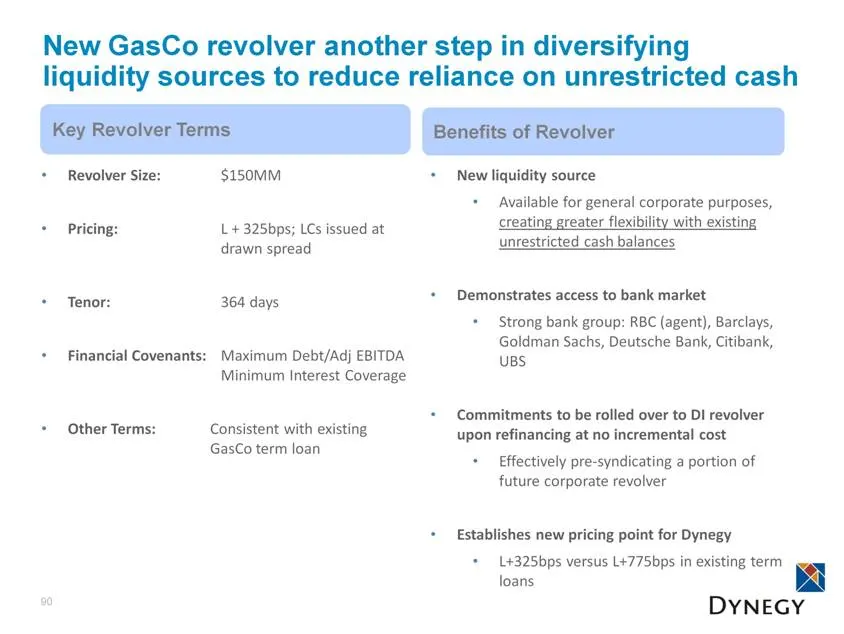
New GasCo revolver another step in diversifying liquidity sources to reduce reliance on unrestricted cash 90 New liquidity source Available for general corporate purposes, creating greater flexibility with existing unrestricted cash balances Demonstrates access to bank market Strong bank group: RBC
Slide 91: Ratings Agency Feedback
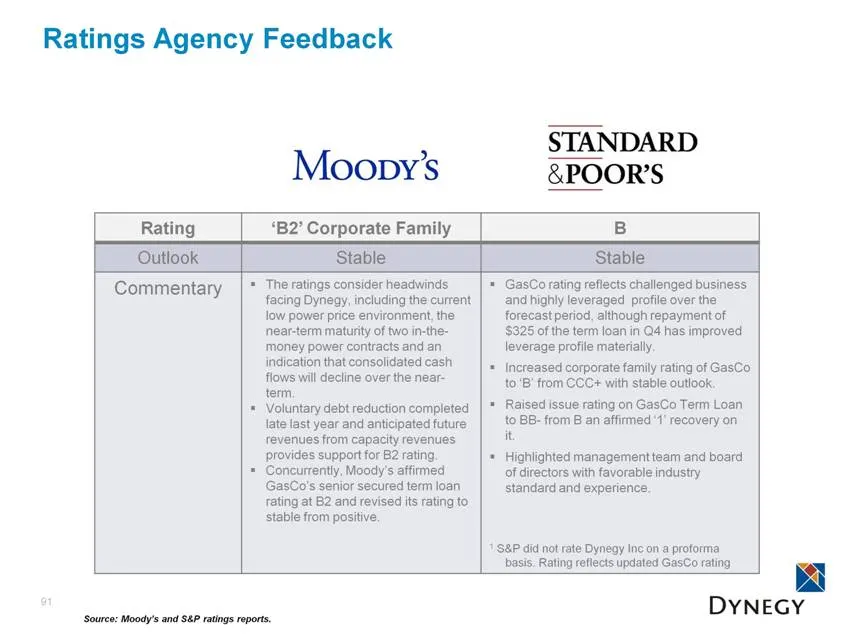
Ratings Agency Feedback 91 Source: Moody’s and S&P ratings reports. Rating ‘B2’ Corporate Family B Outlook Stable Stable Commentary The ratings consider headwinds facing Dynegy, including the current low power price environment, the near-term maturity of two in-the-money power contracts and an indic
Slide 92: Appendix – CoalCo
Appendix CoalCo im DYNEGY
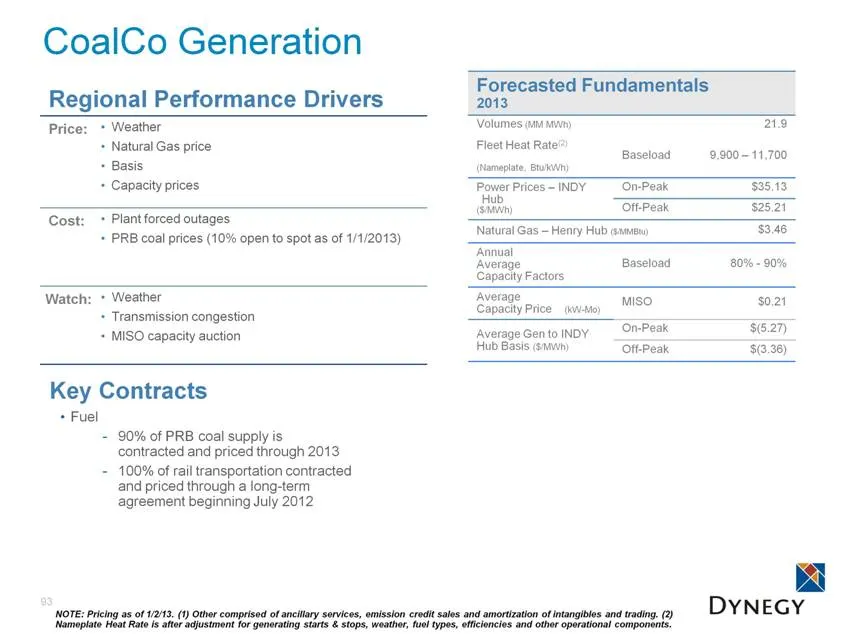
Slide 93: CoalCo Generation Key Contracts
CoalCo Generation 93 Key Contracts Fuel 90% of PRB coal supply is contracted and priced through 2013 100% of rail transportation contracted and priced through a long-term agreement beginning July 2012 Forecasted Fundamentals 2013 Volumes (MM MWh) 21.9 Fleet Heat Rate(2) (Nameplate, Btu/kWh) Baseload
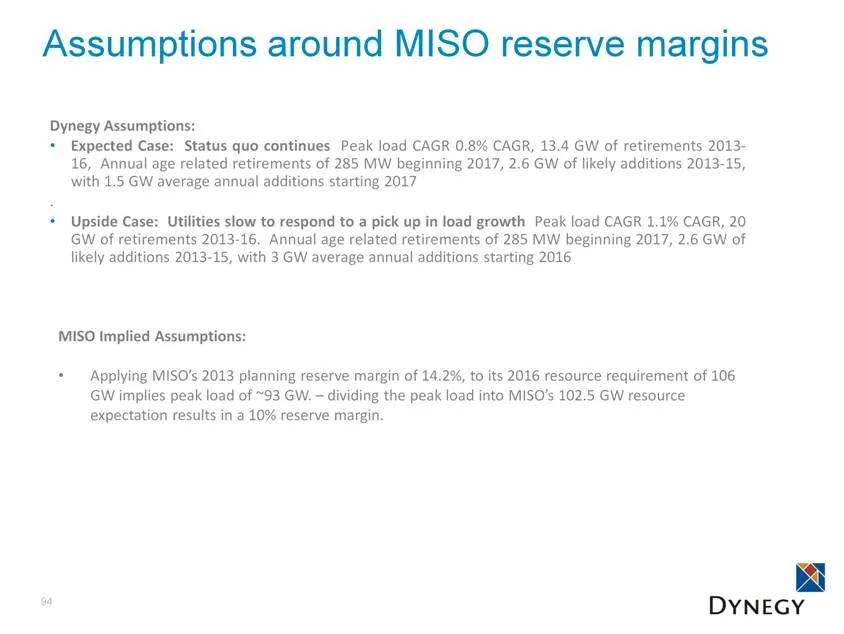
Slide 94: Assumptions around MISO reserve margins
Assumptions around MISO reserve margins 94 Dynegy Assumptions: Expected Case: Status quo continues Peak load CAGR 0.8% CAGR, 13.4 GW of retirements 2013-16, Annual age related retirements of 285 MW beginning 2017, 2.6 GW of likely additions 2013-15, with 1.5 GW average annual additions starting 2017
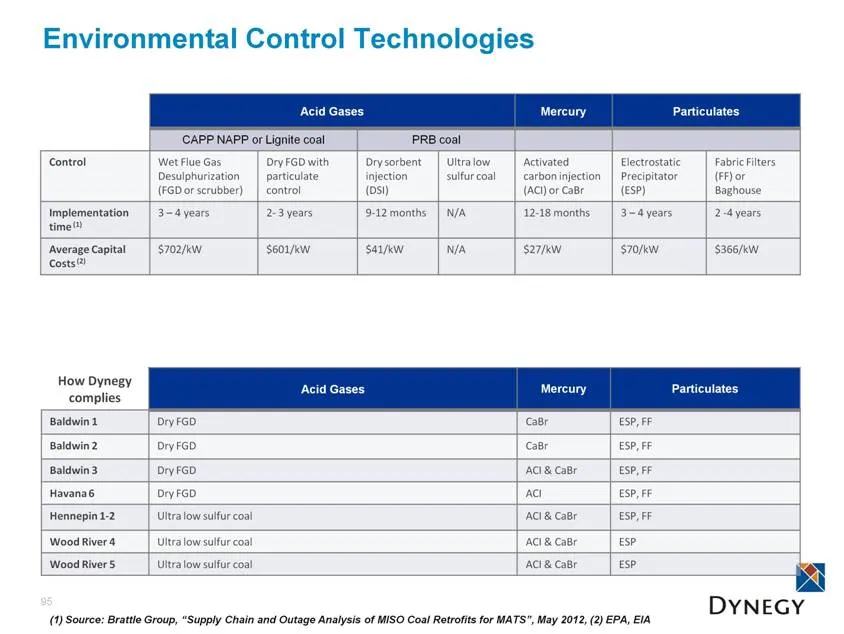
Slide 95: Environmental Control Technologies
Environmental Control Technologies Acid Gases Mercury Particulates CAPP NAPP or Lignite coal PRB coal Control Wet Flue Gas Desulphurization (FGD or scrubber) Dry FGD with particulate control Dry sorbent injection (DSI) Ultra low sulfur coal Activated carbon injection (ACI) or CaBr Electrostatic Prec
Slide 96: Appendix – GasCo
Appendix GasCo im DYNEGY
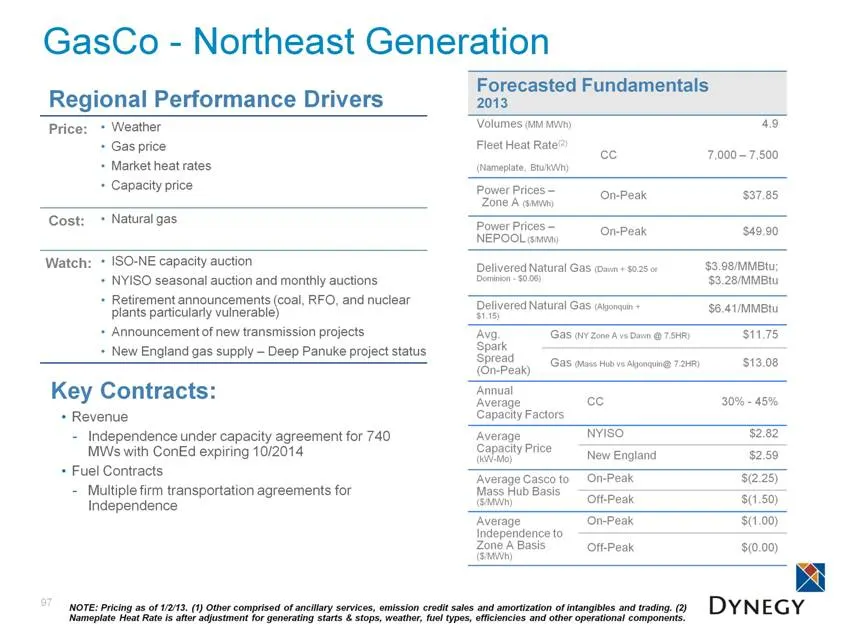
Slide 97: GasCo - Northeast Generation
GasCo - Northeast Generation 97 Key Contracts: Revenue Independence under capacity agreement for 740 MWs with ConEd expiring 10/2014 Fuel Contracts Multiple firm transportation agreements for Independence Forecasted Fundamentals 2013 Volumes (MM MWh) 4.9 Fleet Heat Rate(2) (Nameplate, Btu/kWh) CC 7,
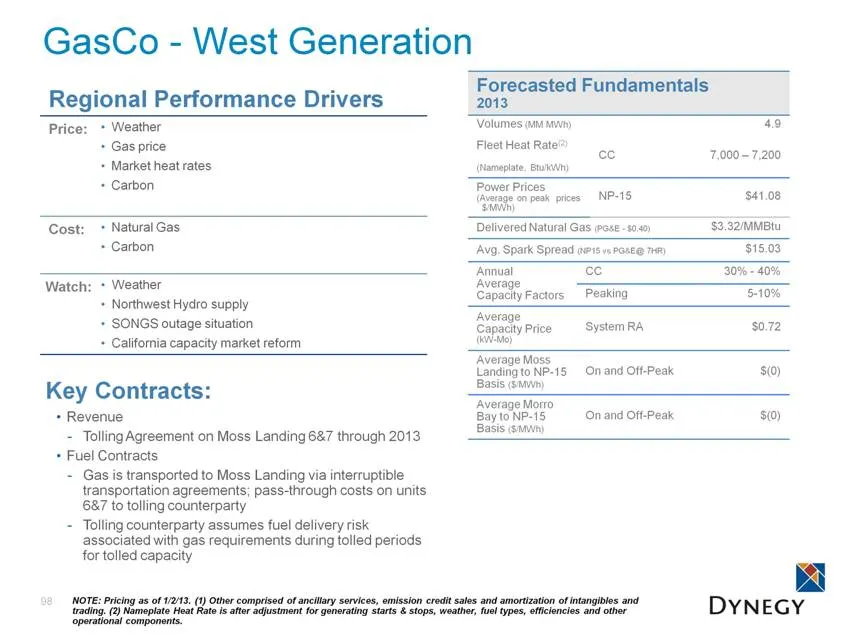
Slide 98: GasCo - West Generation
GasCo - West Generation 98 Forecasted Fundamentals 2013 Volumes (MM MWh) 4.9 Fleet Heat Rate(2) (Nameplate, Btu/kWh) CC 7,000 – 7,200 Power Prices (Average on peak prices $/MWh) NP-15 $41.08 Delivered Natural Gas (PG&E - $0.40) $3.32/MMBtu Avg. Spark Spread (NP15 vs PG&E@ 7HR) $15.03 Annual Average
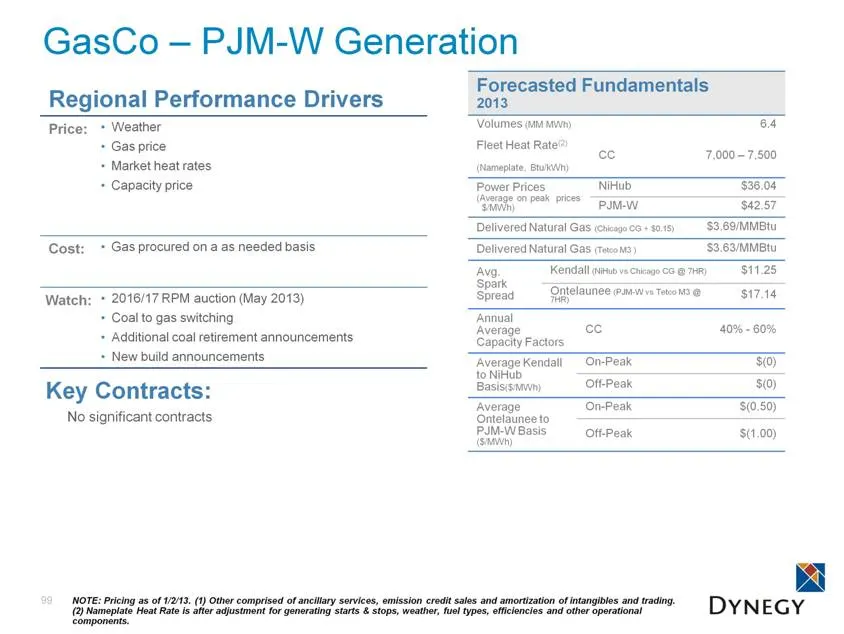
Slide 99: GasCo – PJM-W Generation
GasCo – PJM-W Generation 99 Forecasted Fundamentals 2013 Volumes (MM MWh) 6.4 Fleet Heat Rate(2) (Nameplate, Btu/kWh) CC 7,000 – 7,500 Power Prices (Average on peak prices $/MWh) NiHub $36.04 PJM-W $42.57 Delivered Natural Gas (Chicago CG + $0.15) $3.69/MMBtu Delivered Natural Gas (Tetco M3 ) $3.63/
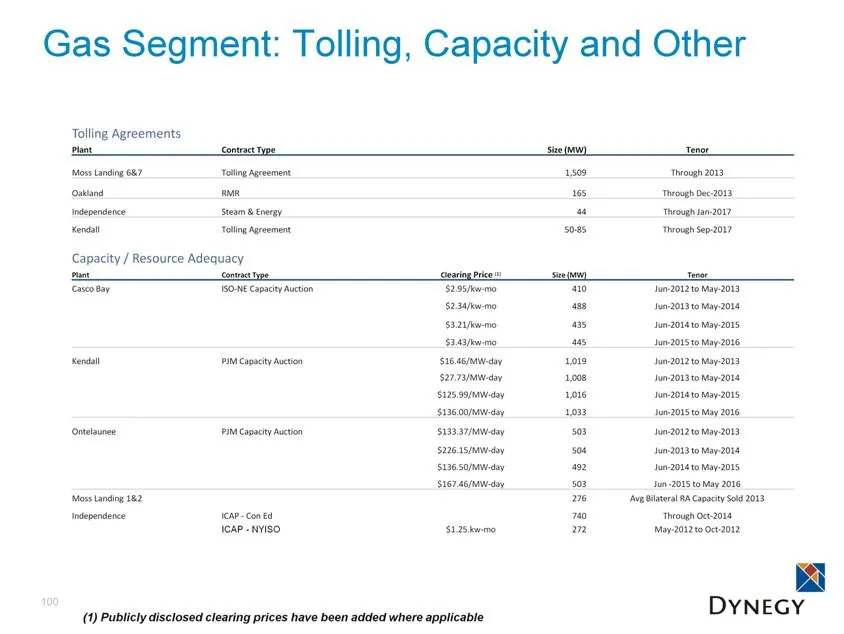
Slide 100: Gas Segment: Tolling, Capacity and Other
Gas Segment: Tolling, Capacity and Other 100 Tolling Agreements Plant Contract Type Size (MW) Tenor Moss Landing 6&7 Tolling Agreement 1,509 Through 2013 Oakland RMR 165 Through Dec-2013 Independence Steam & Energy 44 Through Jan-2017 Kendall Tolling Agreement 50-85 Through Sep-2017 Capacity / Resou
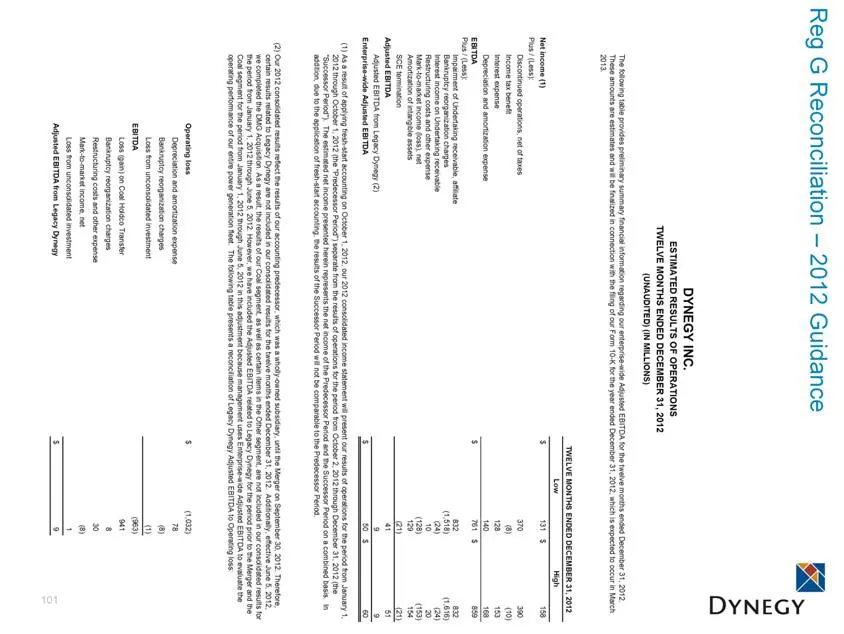
Slide 101: Reg G Reconciliation – 2012 Guidance
Reg G Reconciliation – 2012 Guidance 101 Low High Net income (1) 131 $ 158 $ Plus / (Less): Discontinued operations, net of taxes 370 390 Income tax benefit (8) (10) Interest expense 128 153 Depreciation and amortization expense 140 168 EBITDA 761 $ 859 $ Plus / (Less): Impairment of Undertaking rec
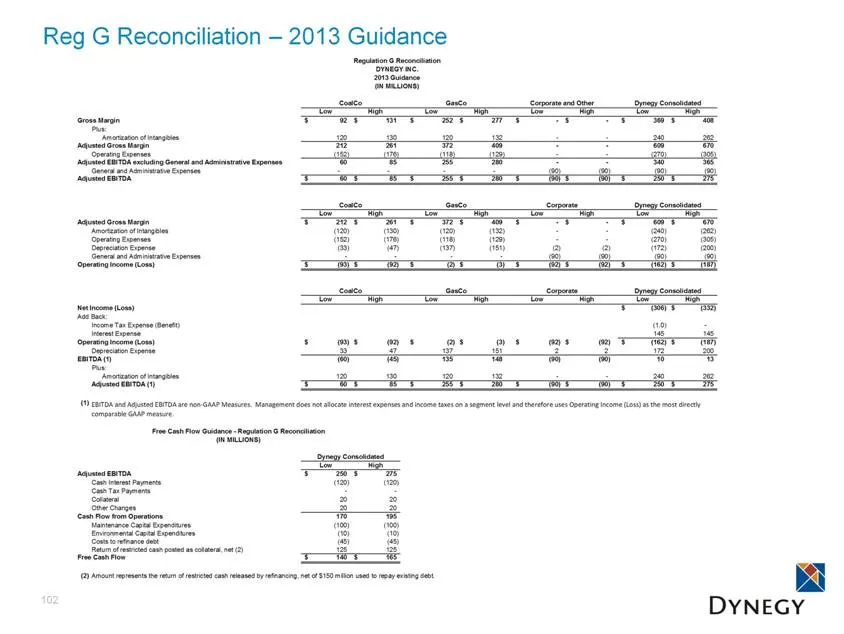
Slide 102: Reg G Reconciliation – 2013 Guidance
Reg G Reconciliation – 2013 Guidance 102 Low High Low High Low High Low High Gross Margin 92 $ 131 $ 252 $ 277 $ - $ - $ 369 $ 408 $ Plus: Amortization of Intangibles 120 130 120 132 - - 240 262 Adjusted Gross Margin 212 261 372 409 - - 609 670 Operating Expenses (152) (176) (118) (129) - - (270) (3
Source: SEC EDGAR · 8-K filed Jan 17, 2013
More decks from Dynegy Inc
 FY2017 Earnings Presentation30 slides · Feb 26, 2018
 Debt Investor Presentation (December 2017)10 slides · Dec 11, 2017
 Merger or Acquisition (October 2017)28 slides · Oct 31, 2017
 Debt Investor Presentation (October 2016)44 slides · Oct 3, 2016
 IPO Roadshow (June 2016)17 slides · Jun 15, 2016
 Investor Day (April 2014)94 slides · Apr 11, 2014